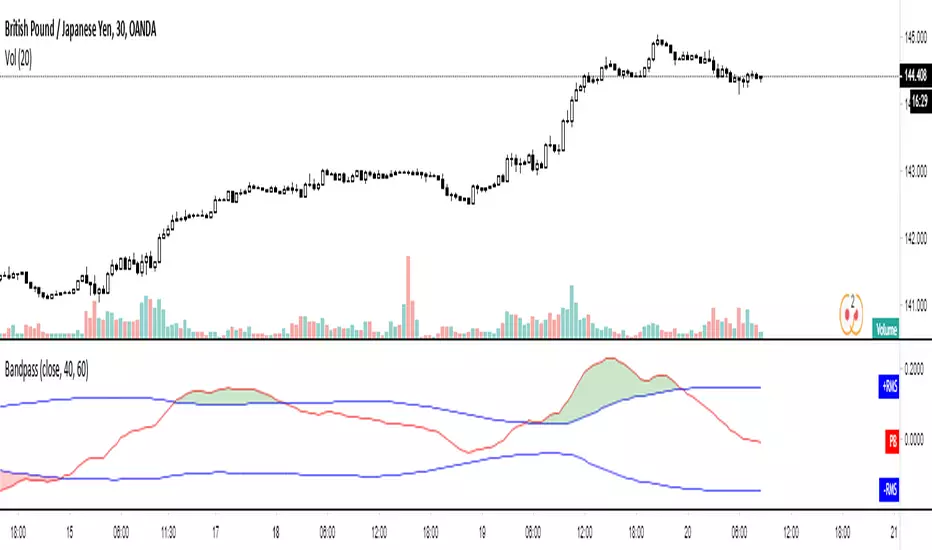
Midas Decision Dashboard (XAU)Midas Decision Dashboard (XAU)
Indicator Overview
Midas Decision Dashboard (XAU)** is a high-precision strategic tool specifically engineered for Gold (XAU/USD) scalping on lower timeframes like M1 and M5. Instead of providing a single, lagging signal, the dashboard acts as a "Mission Control" center, synthesizing four core market dimensions and real-time Price Action into a live, weighted scoring matrix.
The Four Strategic Pillars
The dashboard evaluates the market using a weighted logic system to ensure no single indicator triggers a false entry:
📈 TREND ANALYSIS (EMA 200 - 20%): Monitors the 200-period Exponential Moving Average to establish the primary market direction (BULL/BEAR/FLAT).
⚡ POWER & STRENGTH (ADX - 45%): The engine of the strategy. A high weight ensures you only engage when real trend strength is present. **WEAK** power is highlighted in Light Yellow to signal low-volatility caution.
🔥 MARKET ENERGY (CHOP - 25%): A sophisticated volatility meter that identifies BREAKOUT phases while flagging dangerous CONSOLIDATION zones in red to avoid sideways traps.
🌊 MOMENTUM SAFETY (RSI - 10%): Provides a final safety layer to prevent buying at overextended peaks or selling at oversaturated bottoms.
Dynamic Scoring & Signal Hierarchy
The system calculates a live score (0-100%) based on active conditions. The **🎯 SIGNAL** row triggers a verdict using a professional traffic-light system:
🟢 GO (80% - 100%): High-conviction alignment. All major pillars are in sync for an entry.
🟡 WAIT (50% - 79%): The market is developing, but full confirmation is currently missing.
🔴 STOP (Below 50%): Low-probability environment. No trade zone.
Disclaimer
Trading gold involves significant risk. This dashboard is a decision-support tool and should be used in conjunction with a proper risk management strategy.
Search in scripts for "scalping"
Luminous Trend Wave [Pineify]```
Luminous Trend Wave - Hull MA Based Normalized Momentum Oscillator
The Luminous Trend Wave (Pineify) is a momentum oscillator designed to provide clear, responsive trend signals while minimizing the lag commonly associated with traditional momentum indicators. By combining Hull Moving Average (HMA) calculations with ATR-based normalization and hyperbolic tangent transformation, LTW delivers a bounded oscillator that works consistently across different assets and timeframes.
Key Features
Hull Moving Average foundation for reduced lag trend detection
ATR normalization for universal applicability across all markets
Bounded output range (-100 to +100) using mathematical tanh transformation
Dynamic gradient coloring that reflects momentum intensity
Built-in signal line for momentum confirmation
Automatic alerts for trend reversals and momentum shifts
How It Works
The indicator operates through a four-stage calculation process:
Trend Basis Calculation: The indicator first calculates a Hull Moving Average (HMA) of the closing price. HMA was chosen specifically because it provides significantly less lag compared to Simple or Exponential Moving Averages while maintaining smoothness. This allows the oscillator to respond quickly to genuine price movements.
Distance Measurement: The raw distance between the current close price and the HMA trend line is calculated. This distance represents how far price has deviated from its smoothed trend.
ATR Normalization: The distance is then divided by the Average True Range (ATR) over the same lookback period. This normalization step is crucial - it makes the oscillator readings comparable across different assets regardless of their price levels or typical volatility. A stock trading at $500 and one at $5 will produce equivalent readings when their relative movements are similar.
Tanh Transformation: Finally, the normalized value is passed through a hyperbolic tangent function scaled by a sensitivity multiplier. The mathematical formula (e^2x - 1) / (e^2x + 1) naturally bounds the output between -100 and +100, preventing extreme spikes while preserving the directional information.
Trading Ideas and Insights
Zero Line Crossovers: When the oscillator crosses above zero, it indicates a shift from bearish to bullish momentum. Conversely, crossing below zero signals bearish momentum. These crossovers can be used as entry triggers when confirmed by other analysis.
Overbought/Oversold Levels: Readings above +80 suggest overbought conditions where price has extended significantly above its trend. Readings below -80 indicate oversold conditions. These extremes often precede mean reversion moves.
Signal Line Divergence: When the main oscillator (histogram) is above the signal line, momentum is increasing. When below, momentum is decreasing. This relationship helps identify the strength of the current move.
Momentum Fading: The indicator automatically fades the color intensity when the oscillator value is closer to the signal line than to the extremes, visually indicating weakening momentum before potential reversals.
How Multiple Indicators Work Together
LTW integrates three distinct technical concepts into a cohesive system:
Hull MA + ATR Integration: The Hull Moving Average provides the trend direction while ATR provides the volatility context. Together, they answer not just "where is the trend?" but "how significant is the current deviation relative to normal market movement?"
Mathematical Bounding + Visual Mapping: The tanh transformation ensures readings stay within predictable bounds, while the gradient coloring maps these bounded values to intuitive visual feedback. Strong bullish readings appear in bright green, strong bearish in bright red, with smooth transitions between.
Oscillator + Signal Line System: Similar to MACD's relationship between the MACD line and signal line, LTW uses a WMA-smoothed signal line to filter noise and confirm momentum direction. The interplay between the faster oscillator and slower signal creates actionable crossover signals.
Unique Aspects
Universal Normalization: Unlike many oscillators that produce different reading ranges on different assets, LTW's ATR normalization ensures consistent interpretation whether trading forex, crypto, stocks, or commodities.
Sensitivity Control: The sensitivity parameter allows traders to adjust how aggressively the oscillator responds to price changes. Higher values make it more responsive (useful for scalping), while lower values smooth out noise (better for swing trading).
Visual Momentum Feedback: The gradient coloring and transparency adjustments provide immediate visual feedback about trend strength without requiring traders to interpret numerical values.
How to Use
Add the indicator to your chart - it displays in a separate pane below price.
Watch for zero line crossovers as primary trend signals. Bullish when crossing above, bearish when crossing below.
Use the ±80 levels as caution zones where reversals become more likely.
Monitor the relationship between the histogram and signal line - histogram above signal indicates strengthening momentum.
Pay attention to color intensity - faded colors indicate weakening momentum and potential reversal zones.
Set alerts for automated notifications on trend changes and momentum shifts.
Customization
Trend Lookback (default: 21): Controls the HMA period. Lower values increase responsiveness but may generate more false signals. Higher values provide smoother trends but with more lag.
Signal Smoothing (default: 5): Adjusts the WMA period for the signal line. Higher values create a slower signal line with fewer crossovers.
Sensitivity (default: 1.5): Multiplier for the tanh transformation. Increase for more reactive signals, decrease for smoother readings.
Colors: Fully customizable bullish and bearish colors to match your chart theme.
Gradients: Toggle gradient coloring on/off based on preference.
Conclusion
The Luminous Trend Wave indicator offers traders a mathematically sound approach to momentum analysis. By combining the low-lag properties of Hull Moving Average with ATR-based normalization and bounded output transformation, LTW provides consistent, interpretable signals across any market. The visual feedback system makes trend strength immediately apparent, while the signal line crossovers offer clear entry and exit timing. Whether used as a standalone tool or combined with price action analysis, LTW helps traders identify trend direction, momentum strength, and potential reversal zones with clarity.
```
Market Structure & Supply-Demand EngineMarket Structure & Supply-Demand Engine (MSD-Engine) is a professional, non-repainting market structure and supply-demand analysis tool built purely on price action and volatility logic.
This indicator is designed for discretionary traders who want a clean, institutional-style view of market structure without lagging indicators or strategy automation.
🔍 What This Indicator Does
MSD-Engine identifies major structural reversals, plots price-action based supply & demand zones, and provides multi-timeframe confluence in a single, unified framework.
It is visual and analytical only — no strategy orders, no backtesting, and no repainting.
🚀 Core Features
• Non-Repainting Market Structure
Event-based swing reversal detection
ATR-adaptive displacement filtering
Confirmed pivots only (no future leaks)
• Pure Supply & Demand Zones
Candle-structure based zone detection
Volume-weighted zone strength
Automatic invalidation on breach
Configurable zone limits to maintain chart clarity
• Multi-Timeframe Context (MTF)
Chart timeframe structure
Two independent higher-timeframe supply & demand layers
Higher-timeframe directional bias visualization
HTF zones plotted only on confirmed HTF closes
• Volatility-Adaptive Logic
ATR normalized across timeframes
Dynamic reversal thresholds
Stable behavior from scalping to swing charts
• Trendline Lifecycle Tracking
Automatic major trendline construction
Single-fire break detection
Break validation / failure logic
HTF-aligned vs counter-trend classification
🧠 Designed For
• Discretionary price-action traders
• Supply & demand traders
• Market structure & smart-money style analysis
• Multi-timeframe confluence trading
• Futures, indices, forex, crypto, and equities
⚠️ Important Notes
This is NOT a strategy or auto-trading system
No buy/sell signals or performance metrics
No repainting (uses barmerge.lookahead_off)
Educational & analytical use only
📜 Disclaimer
This script is provided for educational and analytical purposes only.
It does not constitute financial advice. Trading financial markets involves risk.
Jurik MA Trend Breakouts [BigBeluga]🔵 OVERVIEW
Jurik MA Trend Breakouts is a precision trend-breakout detector built on a custom Jurik-smoothed moving average.
It identifies trend direction with ultra-low lag and maps breakout levels using pivot-based swing highs/lows.
The indicator plots dynamic breakout lines and confirms trend continuation or reversal when price breaks them — providing clean, minimalistic yet extremely accurate trend signals.
🔵 CONCEPTS
Jurik Moving Average (JMA) — A highly smooth and low-lag moving average that reacts quickly to trend shifts without noise. This becomes the core trend baseline.
Trend Bias —
• JMA rising → bullish trend
• JMA falling → bearish trend
The JMA color updates instantly based on slope.
Swing Pivots — Recent pivot highs/lows are detected to define structural break levels while filtering out weak noise.
Trend Breakout Levels —
The indicator draws horizontal levels at the last valid pivot in the direction of the trend.
These levels act as “confirmation gates” for breakout entries.
ATR Validity Filter — Ensures only meaningful pivots within a threshold are used to prevent fake breakouts.
🔵 FEATURES
Ultra-Smooth Jurik Trend Line — A visually clean trend baseline changing color based on direction.
Automatic Swing High Breakout Setup (Bullish) —
• During an uptrend, the indicator tracks the most recent pivot high.
• A horizontal breakout line is extended across the chart.
• A ✔ marker appears at both pivot points when the breakout structure becomes valid.
Automatic Swing Low Breakout Setup (Bearish) —
• During a downtrend, pivot lows are tracked.
• A horizontal breakout line marks the breakdown level.
• ✔ markers confirm valid structure before the breakout triggers.
Breakout Detection —
• Price closing above the bullish breakout line → “↑” signal printed on the chart.
• Price closing below the bearish breakout line → “↓” signal printed on the chart.
Automatic Reset on Trend Change —
When the JMA trend flips, all breakout structures are cleared and the model starts tracking new pivot levels.
Trend-Colored Visualization —
Glow + main JMA line give instant clarity of market direction.
🔵 HOW IT WORKS
1. JurikMA defines the main trend — Slope determines bullish or bearish state.
2. The indicator continuously searches for pivots in the direction of the trend.
3. When a valid pivot forms and passes ATR proximity filter, a structural breakout level is drawn.
4. As long as price stays below that level (bullish case), the trend setup remains active.
5. When price finally breaks the level , the indicator prints a directional arrow (↑ or ↓).
6. Trend flip instantly resets all levels and begins tracking pivots on the opposite side.
🔵 HOW TO USE
Breakout Trading — Enter long on “↑” and short on “↓” signals when price breaks key pivot structure.
Trend Confirmation — Use the JurikMA color to stay aligned with the main trend direction.
Reversals — Trend flips often mark major turning points.
Structure Mapping — Use the horizontal breakout lines to understand how close price is to confirming a new trend leg.
🔵 CONCLUSION
Jurik MA Trend Breakouts combines the speed of a Jurik MA with structural breakout logic to deliver clean, reliable entry signals.
Its minimal design, pivot-based confirmation, and trend-aligned logic make it suitable for scalping, swing trading, and intraday trend continuation setups.
If you want fast yet filtered breakout recognition with almost zero noise, this tool gives you everything you need.
JB Trader - Scenario B: Visual Pro (Nifty 50)Description: Designed and developed by Jeya Bharathi (JB), Founder of JB Trader.
This is a high-precision scalping strategy specifically optimized for Nifty 50 and Bank Nifty. It combines trend-following logic with momentum and volume confirmation to capture quick moves in the intraday market.
Key Features:
Multi-Indicator Synergy: Integrates SuperTrend for trend direction and VWAP for institutional price alignment.
Candle Break Confirmation: Entries are triggered only when a price break occurs (High/Low) on the signal candle, ensuring momentum is on our side.
Volume Filter: Built-in volume analysis to filter out "false breakouts" during low-liquidity periods.
Visual Dashboard: Real-time on-chart table showing current trend status and decision-making (Buy/Sell/Wait).
Time-Restricted Trading: Optimized for Indian market hours (9:15 AM - 2:45 PM) to avoid end-of-day volatility.
Best Performance:
Timeframe: 3 Minutes or 5 Minutes.
Asset: Nifty 50 Index / Futures.
Declaration & Disclaimer:
Educational Purpose: This script is developed for educational and analytical purposes only.
Risk Warning: Trading involves significant risk. JB Trader is not responsible for any financial losses incurred using this strategy.
No Financial Advice: The signals generated by this script do not constitute financial advice. Users should consult a certified financial advisor before making any investment decisions.
Proprietary Logic: This code is the intellectual property of JB Trader (Jeya Bharathi). Unauthorized reproduction or redistribution is strictly prohibited.
Multi-MA Crossover Alert by Funded RelayMulti-MA Crossover Alert is a simple yet powerful trend-following indicator that combines three moving averages to help identify trend direction and potential reversal points.
What it shows:
• Fast SMA (default 20 periods) – reacts quickly to price changes
• Medium EMA (default 50 periods) – smoother medium-term trend
• Slow SMA (default 200 periods) – long-term trend reference (often called the "death/golden cross" level)
Features:
• Dynamic coloring: Lines turn green when above the slow SMA (bullish bias) or red when below (bearish bias). The slow SMA stays gray for clear reference.
• Background tint: Light green/red background highlights the overall trend based on Fast SMA vs Slow SMA.
• Crossover alerts: Triggers notifications when the Medium EMA crosses above/below the Slow SMA (classic trend change signal).
How to interpret the signals:
• Bullish trend: Fast and Medium lines are green and above the Slow SMA → price is in an uptrend. Look for buying opportunities on pullbacks.
• Bearish trend: Fast and Medium lines are red and below the Slow SMA → price is in a downtrend. Look for selling/short opportunities on rallies.
• Bullish crossover (alert): Medium EMA crosses ABOVE Slow SMA → potential start of stronger uptrend or reversal from downtrend.
• Bearish crossover (alert): Medium EMA crosses BELOW Slow SMA → potential start of stronger downtrend or reversal from uptrend.
How to use it correctly:
1. Add the indicator to your chart via "Indicators" → Community Scripts.
2. Adjust the input lengths to match your timeframe and style:
- Shorter periods (e.g. 10/30/100) → better for intraday / scalping
- Longer periods (e.g. 50/100/200) → better for swing / position trading
3. Enable "Enable Crossover Alerts" if you want TradingView notifications (set alerts via the alert menu: condition = "alert() function calls only").
4. Use in combination with:
- Support/resistance levels
- Volume confirmation
- Other indicators (RSI for overbought/oversold, candlestick patterns)
5. Best on higher timeframes (1H, 4H, Daily) to reduce noise. On very low timeframes, false signals increase — always confirm with price action.
Important notes:
• This is NOT a standalone "buy/sell" system — no indicator is 100% accurate. Always use risk management (stop-loss, position sizing).
• Backtest on your assets/timeframes before live trading.
• Works on all markets: stocks, forex, crypto, futures, etc.
Open-source and free — feel free to modify and improve!
Happy trading!
Gaussian MA - Progressive Multi-FilterThe previously published indicator based on Watson's Quadratic kernel was a bit complicated and "quadratic" in its calculations – it's an old indicator, and I've updated it a bit. I'm currently using Gaussian MA due to its simpler design and additional features that the former lacked.
Gaussian MA is an advanced trend-following indicator that combines statistical data smoothing with dynamic noise filtering. Here's a step-by-step analysis:
1. Gaussian Kernel Regression - the heart of the script is the gaussian_regression_max function. Instead of a simple average, it calculates a weight for each past price using a Gaussian distribution (bell curve):
Weights: Prices closest to the current candlestick have the greatest impact on the result, while those further away lose their importance exponentially.
The result: A very smooth line (yhat) that reacts faster than traditional moving averages while maintaining high resistance to short-term price spikes.
2. Progressive Volume Filter (ALMA Volume) - this is a unique part of the code that adjusts the indicator's sensitivity to market activity:
- the script calculates the moving average volume using the ALMA algorithm. The vol_ratio (current volume / average volume) is calculated.
Logic: If volume increases, the prog_factor decreases. This makes the filter thresholds "tighter," allowing the indicator to react more quickly to strong moves supported by high volume.
3. Dynamic Thresholds (Hysteresis) Instead of reacting to every change in the direction of the yhat line, the code calculates a "safety zone" (filter) that the price change must break through to signal a new trend:
- ATR: Threshold based on volatility (Average True Range).
- Percentage: Threshold percentage of the current price.
Both thresholds are multiplied by the previously mentioned prog_factor (volume).
4. Trend Detection and Visualization
Finally, the script compares the change in the regression value (diff) with the calculated thresholds:
- Bullish: If the change is positive and greater than the dynamic threshold.
- Bearish: If the change is negative and less than the negative threshold.
Result: The color of the line on the chart changes (green/red), and the alertcondition function allows you to set a notification when the color changes.
In short: Gaussian MA is an intelligent average that "knows" when the market is chaotic (it then increases the filtering thresholds) and when real momentum with volume is emerging (it then becomes more sensitive).
How to optimize the indicator parameters:
1. for the h parameter - (Lookback Window)
The h parameter controls the degree of regression smoothing. The higher the timeframe (e.g., Daily), the smaller h can be; on lower timeframes (e.g., 1m, 5m), you need more smoothing.
- For Scalping (1m - 5m): Set h in the range of 2.5 - 4.0. Noise on lower timeframes is high, so you need a "heavier" Gaussian kernel.
- For Day Trading (15m - 1h): Set h in the range of 1.5 - 2.5. This is the golden mean for ensuring liquidity without significant lag.
- For Swing (4h - Daily): Set h in the range of 0.75 - 1.5.
Trends on higher timeframes are stronger, so a smaller smoothing will allow for faster movement.
2. Calibrate vol_sens (Volume Sensitivity)
This parameter determines how much a "volume spike" facilitates a trend change.
- High Sensitivity (0.7 - 1.0): Aggressive approach. Even a small increase in trading volume will cause the indicator to react to price changes. Good for currency pairs with low liquidity.
- Low Sensitivity (0.1 - 0.4): Conservative approach. The indicator will ignore price movements unless accompanied by heavy volume (so-called "smart money"). Ideal for filtering out false positives (fakeouts).
It's safest to start with a setting of 0.5...
The above guidelines are indicative and are intended only to facilitate the use of the indicator - there are no perfect trading solutions; this indicator attempts to mathematically indicate points where entries/exits are statistically highly probable...
Works well with the MACD ALMA Edition ;)
Alg0 Hal0 CCI SnapAlg0 ۞ Hal0 CCI Snap
1. The Core PhilosophyThe A۞H CCI Snap is a dual-confirmation momentum oscillator. Unlike standard oscillators that only look at one data stream, this tool separates Market Structure (Background Trend) from Momentum Velocity (CCI Snap). It is designed to identify "Mean Reversion" opportunities and "Trend Continuation" snaps.
2. The Interface (Visual Components)The CCI Line (Blue): Tracks the "typical price" relative to its average. It tells you how fast the market is moving.The Signal Line (Yellow): A customizable moving average (HMA, TEMA, etc.) of the CCI. It filters out the "jitters" of the blue line.Background Trend (Green/Red): This is independent of the CCI. It tracks whether the actual Price is above or below a long-term Moving Average (default is 50 SMA).The 5-Color Heatmap Dashboard: A real-time data table that calculates the "Heat" of the current momentum compared to the last 3 bars.
3. How to Trade with A۞H CCI Snap
۞ The "Snap" Entry (Trend Continuation)This is the highest probability trade. You are looking for a momentary dip in a strong trend.Check Background: Background must be solid Green.Observe CCI: The Blue CCI line dips below the Yellow Signal line (a "cooling off").The Trigger: Enter when the Blue line snaps back above the Yellow line.Confirmation: The Dashboard should show Dark Green (Accelerating Bullish Heat).
۞ The Zero-Line Rejection (Trend Strength)
The 0 line is the "Fair Value" of momentum.Bullish: In a Green background, if CCI drops toward 0 but bounces off it without crossing, it confirms the trend is extremely strong.
Bearish: In a Red background, if CCI rises toward 0 but "rejects" and heads back down, it confirms heavy selling pressure.
۞ Exhaustion Warning (Mean Reversion)If the CCI is above +200 or below -200, the market is overextended. Look at the Dashboard Heatmap: If the CCI is at +210 but the cell color turns from Dark Green to Light Green, the "Heat" is leaving the move. This is your signal to tighten stop-losses or take profits.
4. Input Customization Guide and Recommendations
* Setting GroupFunctionPro-TipCCI CoreSets the sensitivity of the blue line.
* Use 14 for scalping, 20 for day trading.
* CCI SignalSets the smoothing of the yellow line.
* HMA (Hull) is best for crypto due to low lag.Background
* TrendDrives the Green/Red chart color.
* Set to 50 SMA for a "Trend Filter" or 200 SMA for "Macro" view.
* Alert SettingsToggles specific notifications.
* Turn off "Zero Cross" if you only want major Trend Flips.
5. Interpreting the Heatmap Dashboard:
۞ Dark Green (+): Bullish Acceleration (Buy/Hold).
۞ Light Green (+): Bullish Deceleration (Caution/Take Profit).
۞ Gray (0): No Momentum (Range-bound/Sideways).
۞ Orange/Light Red (-): Bearish Deceleration (Short Cover/Bottom Fish).
۞ Dark Red (-): Bearish Acceleration (Sell/Short).
!! Important Technical Note!!
VWAP Option: If you select VWAP as your Trend MA Type, the background will only color on charts that provide Volume Data (Stocks, Crypto, most Futures). It will appear gray on most Forex pairs.
HH & LLHH & LL
HH & LL is a lightweight market structure indicator that automatically identifies Higher Highs (HH) and Lower Lows (LL) based on pivot analysis.
It helps traders:
- Visualize trend continuation and potential reversals
- Detect dynamic support and resistance from recent HH & LL levels
- Measure the number of bars between structure points for timing and momentum insight
Designed for clarity and simplicity, this indicator is suitable for scalping, swing trading, and trend analysis across all markets and timeframes.
Gold Trap Hunter (Auto-Structure & Liquidity Sweeps)The Concept: Stop Getting Trapped Have you ever bought a breakout, only to watch the price immediately reverse and hit your stop loss? This is called a Liquidity Trap (or "Sweep"). Institutional algorithms often push price slightly above a key High or below a key Low to trigger retail stop losses before moving the market in the real direction.
The Universal Trap Hunter is designed to visualize this market structure automatically. It helps you avoid "Fake Breakouts" and identifies high-probability Reversal points where the "Smart Money" is active.
How It Works (The Logic)
1. The Structure Boxes (The Battlefield) The indicator draws a shaded box representing the Higher Timeframe Structure.
Green Box: The market structure is Bullish (Making Higher Highs). We are looking for longs.
Red Box: The market structure is Bearish (Making Lower Lows). We are looking for shorts.
Feature: This is Universal. If you are on the 15-minute chart, it automatically calculates the 4-Hour structure for you. You are always trading with the bigger trend.
2. The "SWEEP" Signal (The Entry Trigger) A "Sweep" is the most powerful signal in this system.
What is it? Price breaks a previous structure High/Low but fails to close there. It grabs the liquidity and reverses.
⚔️ Green Sweep: Price broke the previous Low (trapping sellers), then closed back UP inside the range. This is a bullish reversal signal.
⚔️ Red Sweep: Price broke the previous High (trapping buyers), then closed back DOWN inside the range. This is a bearish reversal signal.
3. The Noise Filter (Gray Candles) Trading is about knowing when NOT to trade.
Gray Candles: These indicate "Noise." The price action is choppy or conflicting with the trend.
Colored Candles: The candles only turn Green or Red when the Trend, Momentum, and Structure all align. If you see color, the move is valid.
Settings & Customization
Structure Mode (Auto vs Manual):
Auto (Recommended): The script automatically selects the best Higher Timeframe for you.
Scalping 1m? → It looks at 1H Structure.
Trading 15m? → It looks at 4H Structure.
Manual: You can lock it to a specific timeframe (e.g., always show Daily structure).
Colors: Fully customizable to fit your dark/light theme.
How to Trade This Strategy
Identify the Trend: Look at the background Box color (Green = Bullish, Red = Bearish).
Wait for the Trap: Do not chase the price. Wait for price to challenge the edge of the box.
The Signal: Look for the "⚔️ SWEEP" label.
If the box is Green and you see a Green Sweep at the bottom: Strong Buy.
If the box is Red and you see a Red Sweep at the top: Strong Sell.
Disclaimer: This tool is for educational purposes and market analysis only. It helps visualize market structure and liquidity traps but does not guarantee future results. Always manage your risk.
Gold Sniper (Liquidity Sweep)Concept : Stop Hunting the "Smart Money" Way Most traders lose money because they enter exactly where "Smart Money" is looking to trigger Stop Losses. We have all been there: You buy at support, the price dips just below your stop loss, takes you out, and then rockets up without you.
Gold Sniper is designed to capitalize on this exact behavior . Instead of buying the support, this script waits for the Liquidity Sweep (the "Stop Hunt"). It identifies when price breaks a key structure level to trap sellers, and signals an entry only when the price reclaims that level with momentum.
How It Works (The Logic) This indicator looks for a specific "Perfect Storm" setup using a 4-step confirmation process:
Identifies Support (Yellow Dots): It tracks local pivot lows (default 10 bars) to visualize the "Floor" where retail traders likely have their stop losses.
Detects the Sweep: It waits for price to drop below these yellow dots. This is the "Trap" phase where liquidity is grabbed.
Confirms the Reclaim: It does NOT catch the falling knife. It waits for a candle to close back ABOVE the broken support level.
Momentum Check (RSI): It ensures internal strength (RSI) is rising compared to the previous low, confirming that the drop was a trap, not a genuine crash.
Visual Features
Yellow Dots: Dynamic Support Levels / Pivot Lows.
"SWEEP BUY" Label: Signals exactly when the trap is complete and the reclaim has occurred.
Red Line (Hard Stop): Automatically draws a Stop Loss level at the lowest point of the sweep candle.
How to Use This Strategy
Wait for the Setup: Do not trade if price is just drifting. Wait for price to challenge and break the Yellow Dots.
The Trigger: Enter immediately on the Close of the candle with the "SWEEP BUY" label.
Stop Loss: Place your Hard Stop at the Red Line provided by the indicator.
Rule: If price touches the Red Line, the setup has failed (it was a real crash, not a sweep). Exit immediately.
Best Timeframes: Optimized for 1-Minute and 5-Minute scalping on Gold (XAUUSD) and Futures, but works on all liquid assets.
Settings
Pivot Lookback: How many bars back to check for the support floor (Default: 10).
RSI Length: Sensitivity of the momentum filter (Default: 14).
Disclaimer : This tool is for educational purposes and market analysis only. It identifies high-probability "Liquidity Sweep" setups but does not guarantee future results. Always manage your risk.
Core IC 2.0
## 📌 NIFTY Weekly Option Seller — Core Regime & Risk Framework
This indicator is designed for **systematic weekly option selling on NIFTY**, focused on **Iron Condors (IC), Put Credit Spreads (PCS), and Call Credit Spreads (CCS)**.
It is **not a scalping tool** and **not a signal generator**.
Instead, it provides a **structured decision framework** to help option sellers decide:
* *What structure to deploy* (IC / PCS / CCS)
* *How aggressive to be* (position size & distance)
* *When to adjust* (defend / harvest / regime change)
---
## 🔍 What the Indicator Does
### 1️⃣ Market Regime Detection
The script continuously evaluates the market and classifies it into one of three regimes:
* **IC (Range / Mixed)** – neutral, mean-reverting conditions
* **PCS (Trend Up)** – bullish trend continuation
* **CCS (Trend Down)** – bearish trend continuation
Regime selection is based on:
* EMA structure
* ADX (trend strength)
* VWAP positioning
* Higher timeframe (daily) trend alignment
---
### 2️⃣ Independent Conviction Scores
The indicator computes **three independent scores (0–5)**:
```
IC / PCS / CCS
```
These scores represent **conviction strength**, not trade signals.
* Higher score = stronger suitability for that structure
* All three scores are always visible for transparency
Only **one active score** (based on the current regime) is used for:
* Position sizing
* Strike distance suggestions
* Risk management logic
---
### 3️⃣ Risk-First Position Guidance
Based on the active score, the indicator suggests:
* **Position Size** (100% / 50% / 25%)
* **Short strike distance** (ATR-based, dynamic)
* **Defend / Harvest conditions**
* **Regime change alerts**
This helps traders remain **consistent and disciplined**, especially during volatile weeks.
---
### 4️⃣ Visual Decision Panel
A compact panel displays all key information at a glance:
* Regime (IC / PCS / CCS)
* ATR & ADX
* Suggested size
* Suggested short distance
* IC / PCS / CCS scores
* Key reference levels (H3 / L3, VWAP)
No guesswork, no over-trading.
---
## 🕒 Recommended Usage
* **Best timeframe:** 1H or 4H
* **Ideal style:** End-of-day or limited-check traders
* **Designed for:** Weekly option sellers (not intraday scalpers)
Adjustments are intended to be made **at fixed checkpoints**, not every candle.
---
## ⚠️ Important Notes
* This is **not financial advice**
* The indicator does **not place trades**
* Works best when combined with:
* Defined stop-loss rules
* Fixed risk-reward discipline
* Proper position sizing
---
## 🎯 Who This Is For
✔ Rule-based option sellers
✔ Traders focused on consistency over excitement
✔ Professionals who value structure and risk control
❌ Not for discretionary scalpers
❌ Not for beginners without options knowledge
Participation Regime (Volume Context)Most failed trades aren’t caused by bad entries.
They’re taken in environments where participation is weak.
Price can move without participation.
Trends usually don’t survive it.
This indicator focuses on how much participation is present, not on predicting direction or generating trades.
What it looks at:
The tool compares a fast and a slow volume EMA to see whether activity is expanding or fading relative to its own recent history.
Based on that, the environment is classified into:
LOW participation
NORMAL participation
HIGH participation
This is meant to describe the quality of the environment, not the quality of a setup.
How it’s meant to be used
Use it as a context and risk filter on top of an existing system.
Examples:
Reduce size or expectations when participation is weak
Allow normal or full risk when participation is strong
Be more selective in low-quality environments
It does not tell you when to enter or exit.
It does not predict price.
It does not replace a strategy.
What this is not:
Not a buy/sell indicator
Not a confirmation signal
Not a volume spike alert
Not designed for scalping or mean-reversion
Examples
Example 1 — High participation environment
Participation expands and trend continuation behaves as expected.
Example 2 — Low participation environment
Weak participation environments tend to produce noise and false moves.
Closing thought
Structure decides entries.
Participation influences outcomes.
This tool exists to help judge when trend continuation is statistically more or less favorable, so risk and expectations can be adjusted accordingly.
Notes:
Works on any market and timeframe
Best used as a higher-timeframe context layer
Built for trend-following and swing-based approaches
If you read this and think “this tells me when to buy”, this tool is not for you.
If you read this and think “this helps me understand when to push risk and when not to”, then it’s doing its job.
VWAP Confluence Pro█ OVERVIEW
VWAP Confluence Pro is a high-precision trading indicator that combines VWAP with multiple confirmation filters to generate reliable buy and sell signals. Unlike basic VWAP crossover strategies that produce excessive noise, this indicator requires alignment across six independent conditions before triggering a signal, dramatically reducing false entries while capturing high-probability setups.
█ FEATURES
Multi-Layer Confirmation System
The indicator employs a strict confluence approach requiring all of the following conditions to align:
- VWAP Cross: Price must cross above (buy) or below (sell) the VWAP line
- VWAP Trend: The VWAP itself must be rising for buys or falling for sells, confirming directional bias
- Price Trend: A 20-period moving average filter ensures trades align with the prevailing trend
- Volume Confirmation: Signals only trigger when volume exceeds 1.5x the 20-bar average, indicating institutional participation
- RSI Filter: Buys require RSI between 50-60 (bullish momentum without overbought conditions), sells require 40-50 (bearish momentum without oversold conditions)
- MACD Momentum: MACD must confirm directional bias with the MACD line above the signal line for buys, below for sells
Signal Cooldown Period
A configurable cooldown mechanism (default 10 bars) prevents signal clustering and overtrading by ensuring adequate spacing between alerts. This feature is critical for maintaining discipline and avoiding choppy market conditions.
Visual Elements
- Purple VWAP Line: The cornerstone of the strategy, plotted with high visibility
- Green Up Arrows: Buy signals appear below price candles when all conditions align
- Red Down Arrows: Sell signals appear above price candles when all conditions align
- Blue Trend MA: A semi-transparent moving average provides visual trend context
- Background Shading: Subtle green/red backgrounds indicate when multiple confluence factors are aligned, even without a cross
█ HOW TO USE
Timeframe Selection
This indicator is optimized for intraday trading on 1-minute to 15-minute charts, where VWAP is most effective. It can also be used on hourly charts for swing trade entries or daily charts with appropriate parameter adjustments.
Parameter Optimization
All key parameters are customizable through the indicator settings:
- VWAP Deviation %: Controls sensitivity (default 0.8%). Lower values = stricter signals
- Volume Multiplier: Defines volume threshold (default 1.5x). Higher values = stronger volume confirmation required
- Trend Filter Length: Moving average period (default 20). Adjust based on your timeframe
- Cooldown Period: Minimum bars between signals (default 10). Increase for slower markets
- RSI/MACD Settings: Standard values provided, adjust for specific instruments if needed
Trading Strategy
1 — Wait for a signal arrow to appear (green for buy, red for sell)
2 — Confirm the background shading supports the signal direction
3 — Enter on the close of the signal candle or the open of the next candle
4 — Set stop loss below/above the recent swing low/high or the VWAP line
5 — Take profit at logical resistance/support levels or when opposing confluence develops
Best Practices
- Only take long trades when price is above a rising VWAP
- Only take short trades when price is below a falling VWAP
- Avoid trading during low volume periods (first/last 15 minutes of sessions)
- Use the background shading to gauge overall market bias between signals
- Consider increasing the cooldown period in choppy or range-bound conditions
█ LIMITATIONS
- This indicator is designed for trending markets and will produce fewer signals during consolidation periods
- The strict confluence requirements mean you may miss some valid moves in exchange for higher signal quality
- VWAP resets at the start of each session, making it less reliable on 24-hour markets without session breaks (use anchored VWAP for crypto/forex)
- Requires real-time volume data to function properly, less effective on thinly traded instruments
- Not suitable for scalping strategies requiring rapid entries, as the cooldown mechanism intentionally limits signal frequency
█ NOTES
Signal Quality Over Quantity
This indicator prioritizes accuracy over frequency. You may only see 1-3 signals per session on lower timeframes, but each signal represents a setup where trend, momentum, and volume are all aligned. This approach is designed to keep you out of low-probability trades and focused on the best opportunities.
Customization Encouraged
The default parameters provide a solid foundation, but different instruments and timeframes may benefit from optimization. Test the indicator across various settings to find what works best for your specific trading style and markets.
═════════════════════════════════════════════════════════════════════════
This indicator synthesizes best practices from institutional VWAP trading with momentum confirmation from RSI and MACD. By requiring multiple independent factors to align, it filters out the noise common in single-indicator systems and focuses on setups where probability favors directional moves.
MTF EMA Traffic Light System Trend Alignment for ScalpersMTF EMA Traffic Light – Trend Bias System
This indicator is designed to help traders quickly identify high-probability trend alignment using multiple timeframes and EMAs.
It analyzes price relative to the 13 EMA and 55 EMA on:
1 Minute
5 Minute
15 Minute
1 Hour
4 Hour
Then it converts that data into a simple Traffic Light system to guide trade decisions.
🚦 How It Works
Each timeframe is classified as:
🟢 BULL – Price above both EMAs
🔴 BEAR – Price below both EMAs
🟡 MIXED – No clear direction
The system focuses on lower-timeframe alignment:
When 1m + 5m + 15m are aligned → Strong setup
When mixed → Caution
When misaligned → Stand aside
🟢 GREEN State (Full Trade Mode)
Triggered when:
✔ 1m, 5m, and 15m are all BULL → Long Bias
✔ 1m, 5m, and 15m are all BEAR → Short Bias
Rules:
Full position size
Trade with trend
Look for EMA pullbacks
Let winners run
🟡 YELLOW State (Caution Mode)
Triggered when:
✔ Lower timeframes are mixed
Rules:
Reduce size
Take quick profits
No holding
Defensive trading
🔴 RED State (No Trade)
Triggered when:
✔ No clear alignment
Rules:
Stay out
Mark key levels
Protect capital
📋 Dashboard Panel
The indicator displays a real-time table showing:
Each timeframe’s bias
Overall market state
Trade rules
This allows you to read market structure in seconds without switching charts.
🎯 Best Use
This tool works best for:
✔ Scalping
✔ Intraday trading
✔ Trend continuation setups
✔ EMA pullback strategies
Recommended for:
Forex
Indices
Gold
Crypto
⚠️ Risk Disclaimer
This indicator is a decision-support tool, not a guarantee of profits.
Always use:
Proper risk management
Stop losses
Personal trade rules
Never risk more than you can afford to lose.
Buyers & sellers Candle Control Dominance Zone @MaxMaserati 3.0Description
The Buyers & Sellers Candle Control Dominance Zone is a surgical price-action tool designed to identify and project key supply and demand zones derived from candle anatomy across multiple timeframes.
By splitting candles into "Sellers Control" (upper wick/shadow) and "Buyers Control" (lower wick/shadow) regions, this script visualizes exactly where price rejection and absorption are occurring. With the new HTF Engine, you can now view these institutional rejection zones from a Higher Timeframe (e.g., 4H) while trading on a Lower Timeframe (e.g., 15m).
How it Works
The indicator identifies specific "Control Zones" based on the battle between buyers and sellers:
Live Control (Current & HTF): Real-time monitoring of the developing candle. See a 4H wick forming live while watching the 1m chart.
Last Closed Control (Current & HTF): Projects the zones from the most recently completed candle.
Dominance Zones (BuBC & BeBC):
BuBC (Bullish Body Close): A "Dominance Zone" triggered when a candle closes above the previous candle's high. Signifies strong bullish momentum.
BeBC (Bearish Body Close): A "Dominance Zone" triggered when a candle closes below the previous candle's low. Signifies aggressive selling pressure.
Key Features
Multi-Timeframe (MTF) Overlay: Plot 4H, Daily, or Weekly control zones directly on your lower timeframe scalping charts.
Smart Labeling: HTF labels automatically update to show the zone type (e.g., "Sellers Control (Live) ") and whether the last candle was a Dominance candle (BuBC/BeBC).
Dynamic Extension: Zones are projected forward to help you catch retests of rejection levels.
Alerts Included: Built-in alerts trigger when price crosses into a Dominance Zone (BuBC/BeBC), allowing you to set it and forget it.
Can be use as:
Support & Resistance: Use Buyers Control zones (lower wicks) as demand zones for longs and Sellers Control zones (upper wicks) as supply zones for shorts.
Trend Confirmation: A BuBC zone often acts as a launchpad for continued upside. If price falls back into a BuBC zone and rejects, it is a high-probability continuation signal.
Fractal Entry: Use the HTF zones to find the "Big Picture" levels, then use the Current TF zones to refine your entry with precision.
Settings
Display Filter: Toggle Current TF zones (Live, Closed, BuBC, BeBC) independently.
Higher Timeframe Settings: Enable/Disable HTF overlay and select your preferred timeframe (e.g., 240 for 4H).
Visuals: Fully adjustable transparency, colors, and extension lengths to keep your chart clean.
Funnelzon Graded Buy and Sell Signals (LITE) MFI MTFFunnelzon Buy and Sell Signals (EMA Zones) – LITE is a lightweight overlay indicator built for scalping and short-term trading. It generates BUY/SELL signals, grades each signal (A+ to F), and provides a clean Confirmation Box that summarizes multi-timeframe context so you can make faster, more structured decisions.
How it works
Signal Engine (LTF)
Signals are triggered using an ATR-based “scalp helper” logic with adjustable sensitivity.
A stop-state system helps reduce repeated or noisy entries.
Signal Scoring & Grades (A+ → F)
When a signal appears, it is evaluated by a context pipeline that considers:
Adaptive momentum/flow (AMF)
ALMA trend alignment
Support/Resistance proximity
Swing structure behavior
Market regime / trend strength (ADX-based)
The result is a score mapped to a grade:
A+ / A = strongest signals
B / C = mixed conditions
D / F = low-quality conditions
Optional Filters
MFI Filter: Helps avoid signals that do not meet Money Flow conditions.
HTF Confirmation (MTF): Uses HTF1 and HTF2 bias. Choose strict filtering or soft alignment.
Confirmation Box (Dashboard)
The box displays:
HTF State: Trend Long / Trend Short / HTF Conflict / Neutral
Market Mode: Trend / Pullback / Conflict
Trade Bias: Long-only / Short-only / Wait
ENTRY NOW? = “YES” when HTF bias and LTF signal align
MFI status + HTF1/HTF2 direction
Optional Structure Tools
EMA overlays: 9 / 12 / 20 / 50 / 100 / 200
Auto Supply/Demand zones (pivot-based, ATR thickness, configurable extension and limits)
Best practices (recommended workflow)
Prefer trading A+ / A signals only.
Trade in the direction of HTF State when possible.
If Market Mode shows PULLBACK or CONFLICT, reduce risk or wait for better alignment.
Use Supply/Demand zones and EMAs for structure (targets, invalidation, and bias).
Important: Confirmation with Stochastic + MACD
This script is a signal + context tool, not a guarantee. To validate signal confirmation, it is strongly recommended to use:
Stochastic Oscillator (momentum/exhaustion confirmation)
MACD (trend momentum and direction confirmation)
Only take trades when the script signal and your confirmation indicators agree.
Alerts
Includes alert conditions for:
Buy Signal
Sell Signal
Any Signal
ENTRY NOW (HTF + LTF aligned)
ENTRY NOW Long / ENTRY NOW Short
Disclaimer
This indicator is for educational purposes and does not constitute financial advice. Always backtest, manage risk, and confirm signals with your own rules.
ICT Trend Candles [KTY]ICT Trend Candles Indicator
This indicator colors candles based on market structure direction.
Candle colors change when BOS (Break of Structure) or CHoCH (Change of Character) occurs, allowing you to quickly identify the current trend direction.
Structure-Based Coloring
- Bullish structure break → Candles turn bullish color
- Bearish structure break → Candles turn bearish color
- Color changes at trend shift points
Two Structure Options
- INTERNAL: Short-term structure based, faster color changes
- EXTERNAL: Long-term structure based, slower but more reliable
1. Select structure type (INTERNAL or EXTERNAL)
2. Watch for candle color changes to identify trend shifts
3. Combine with other ICT concepts (OB, FVG, Liquidity) for confluence
Pro Tips:
- Use INTERNAL for scalping and short-term trading
- Use EXTERNAL for swing trading and position trading
- Color change after liquidity sweep = high probability reversal signal
Show Trend Candles: Toggle candle coloring on/off
Structure Type: Select INTERNAL or EXTERNAL
Bullish Color: Color when in bullish structure
Bearish Color: Color when in bearish structure
This indicator is designed for educational purposes.
Color change does not guarantee trend reversal.
Always combine with proper risk management.
If you find this indicator helpful, please leave a like and follow for more ICT-based tools!
Smart Pivot Trend█ OVERVIEW
Smart Pivot Trend is a market structure–based trend indicator that combines swing pivots, volatility adaptation (ATR), and dynamic range levels to determine which side of the market is in control — buyers or sellers. Instead of moving averages, trend direction is defined through structural breaks inside pivot ranges.
The indicator visualizes the active trend, evolving market structure, and historical support/resistance levels created at moments of control shifts. It helps identify trend transitions, structure breaks, and areas where price has an increased probability of reaction.
█ CONCEPT
Built around adaptive swing structure. The core idea is that trend emerges from market structure, not from price relative to an average.
- Swing highs and swing lows form the current structural range.
- Two internal percentage-based levels inside this range act as decision zones.
- Break above the upper level → bullish control.
- Break below the lower level → bearish control.
To prevent structure from becoming outdated during strong moves, pivots are dynamically adjusted when price deviates beyond ATR × multiplier. This mechanism makes the structure volatility-aware rather than static.
As a result, the indicator combines:
- a dynamic, living market structure (active pivot trend)
- static “market memory” levels marking previous control shifts
█ FEATURES
Calculations
- Swing pivots as the foundation of market structure
- Internal range levels as structural decision zones
- ATR-based adaptive pivot correction (volatility-aware structure)
- Smooth Factor — controls the degree of structural correction relative to price; defines how fast pivots adapt during strong moves
- Trend change detection through structural range breaks
Visualization
- Active trend line based on current structure
- Historical support/resistance levels plotted at trend flips
- Triangles marking breaks of those levels
- Gradient fill between price and the active trend line
- Trend-based coloring (green = bullish, red = bearish)
- Optional candle coloring based on current structural trend (bullish / bearish control)
Signals
- BUY / SELL — on structural trend changes
- Bullish Break / Bearish Break — when historical levels are broken
- Impulse breaks (when candles break levels with strong momentum)
Alerts
- Trend change to bullish
- Trend change to bearish
- Resistance break
- Support break
█ HOW TO USE
Main settings:
- Swing Length — sensitivity of swing detection
- Lower / Upper Level — internal structural decision levels
- ATR Length / Multiplier — influence of volatility on pivot adaptation
- Smooth Factor — speed of structural adjustment to price
- Visual options — colors, hiding lines, deleting broken levels, color candles by trend
Trend logic:
- Price above active pivot low → bullish structure
- Price below active pivot high → bearish structure
█ APPLICATION
Trend-following
- The indicator can act as a directional filter for signals from other tools.
- Entries are taken only when signals from external indicators (e.g., RSI, MACD, momentum tools, price action setups, breakout systems) align with the current Smart Pivot Trend direction.
- Highest probability occurs when entries happen during pullbacks to the active trend line in the direction of the prevailing structure.
Market structure shifts
- A trend flip represents a transfer of control between buyers and sellers.
- These moments often precede larger moves because the swing structure changes.
Breakout trading
- Historical levels mark areas where control previously changed.
- Their break often leads to volatility expansion and impulsive movement.
Pullback trading
- The active trend line acts as dynamic support/resistance.
- Pullbacks to this line in strong trends often provide favorable risk-to-reward setups.
█ ADAPTATION TO TRADING STYLE
The Swing Length and Smooth Factor parameters allow the indicator to be tailored to different trading styles:
Shorter Swing Length + higher Smooth Factor
- structure reacts faster
- more frequent trend shifts
- suitable for scalping and intraday trading
Longer Swing Length + lower Smooth Factor
- slower structural changes
- filters minor fluctuations
- better suited for swing trading and longer-term positions
This allows the indicator to function both as a fast micro-structure engine and as a stable higher-level trend filter.
█ NOTES
- This is a structural analysis tool, not a standalone trading system
- Best results come when combined with key S/R levels, higher timeframe context, and price action
- In ranging markets, trend flips may occur more frequently — a natural behavior of structure-based systems
Bollinger Bands + 5 Flexible MA [Ahorrador de Espacio]Description:
This "All-in-One" indicator combines classic Bollinger Bands with up to 5 fully customizable Moving Averages (MA) in a single script.
Designed specifically for traders who want to maximize their technical analysis setup without using up multiple indicator slots (ideal for Basic/Free plan users).
Key Features:
Bollinger Bands: Standard configuration (SMA 20, StdDev 2) with visual contact alerts (Triangles).
5 Independent Moving Averages:
Toggle On/Off: Activate only the lines you need.
Total Flexibility: Choose between SMA (Simple) or EMA (Exponential) for each individual line.
Customization: Full control over length, color, and line thickness.
Clean Interface: MAs 4 and 5 are disabled by default to keep your chart clean, but are ready to be activated in the settings.
How to Use:
Add the indicator to your chart.
Open the Settings (gear icon).
Select which MAs you want to display (e.g., SMA 200 for trend, EMA 9 for scalping).
Use at your own discretion as a confluence tool for trend and volatility.
Note: This script is a visualization tool. The band signals (triangles) indicate price touching the outer bands, which can signify either a potential reversal or trend continuation depending on the market context.
Three Green Candles Screener - % Move & Volume1️⃣ Core purpose (big picture)
The indicator identifies stocks that:
Have 2 or 3 consecutive green candles
Are above a 21-EMA (trend filter)
Have reasonable % price movement (not overextended)
Show current volume, average volume, and turnover
Show daily and weekly % price change
It’s meant for short-term momentum screening (swing / positional / breakout prep).
2️⃣ Trend filter (EMA)
ema21 = ta.ema(close, emaLength)
Uses a 21-period EMA
All buy signals require price > EMA
This avoids counter-trend setups
3️⃣ Three Green Candles logic (main signal)
threeGreen = (close > open) and (close > open ) and (close > open )
This checks for three consecutive bullish candles.
Then it calculates:
% change for each candle (open → close)
Average % change across the 3 candles
avgChg = (chg0 + chg1 + chg2) / 3
✅ 3-Green signal triggers when:
3 consecutive green candles
Average % change ≤ user-defined max (default 10%)
Price above EMA21
➡ Output:
signal = 1 // Buy flag
signal = 0 // No action
This avoids parabolic / news-spike candles.
4️⃣ Two Green Candles logic (early signal)
This is a lighter, earlier version of the same logic.
twoGreen = (close > open) and (close > open )
avgChg2 = (chg0 + chg1) / 2
✅ 2-Green signal triggers when:
2 consecutive green candles
Average % change ≤ maxAvgChange
Price above EMA21
➡ Output:
signal2 = 1 // Early momentum
This helps catch moves one day earlier than the 3-green setup.
5️⃣ Volume & liquidity context (important)
Average volume (7 days)
avgVol7 = ta.sma(volume, 7) / 1e6
Shows liquidity trend
Units: Millions of shares
Today’s volume
todayVol = volume / 1e6
Helps confirm participation
6️⃣ Turnover (Price × Volume)
priceVolCrore = (close * volume) / 1e7
Measures capital flow, not just volume
Output in ₹ Crores
Helps filter:
Low-value pump candles
Illiquid stocks
7️⃣ % price movement
Daily move
pctDay = (close - close ) / close * 100
Weekly move (5 bars)
pctWeek = (close - close ) / close * 100
These give context, not signals:
Is this early?
Is it already extended?
8️⃣ Visual outputs (what you see)
Plots (in the indicator pane)
CMP (current price)
3-Green signal (0 / 1)
2-Green signal (0 / 1)
Avg 7-day volume (M)
Today’s volume (M)
Turnover (₹ Cr)
Day % move
Week % move
This makes it usable as a visual screener.
9️⃣ Summary table (top-right)
On the latest bar only, it shows:
Field Meaning
CMP Current price
Today Vol (M) Today’s volume
Turnover (Cr) Value traded
Day / Week % Momentum context
Compact, readable, no clutter.
10️⃣ What this indicator is GOOD for
✅ Momentum stock screening
✅ Swing / positional setups
✅ Avoiding overextended candles
✅ Liquidity & capital flow validation
✅ Manual decision support
11️⃣ What it does NOT do
❌ No auto buy/sell
❌ No stop-loss or targets
❌ No relative strength vs index
❌ No intraday scalping logic
TL;DR (one-liner)
This indicator finds stocks in a healthy uptrend with 2–3 controlled bullish candles, confirms them with EMA and volume/turnover, and presents all key momentum metrics in one clean view.
VWAP Tension Bands + Osc Sigma Gap [MAXmks]Hello Traders,
This indicator started as an accident. I was building a different tool — a multi-metric dashboard — and added VWAP deviation as one of the components. I expected it to help catch falling knives. It didn't.
But I noticed something else. During cooling-off periods — when volatility fades and price just sits there, not really going anywhere — VWAP deviation on lower timeframes would start climbing quietly. And more often than not, a pullback followed. Sometimes a liquidity sweep first, then a pullback. I watched this pattern for months before deciding to build a dedicated tool around it, adding oscillator confirmation to filter the noise.
This is that tool.
The core idea
Markets act like a rubber band around VWAP — the further price stretches, the higher the tension. But raw deviation isn't enough. The real question: is momentum confirming the stretch, or lagging behind?
The σ-Gap captures when these two disagree — price pushed hard, but internals haven't caught up. That's where mean-reversion setups tend to appear.
The indicator tracks VWAP deviation across 2m / 5m / 15m simultaneously and compares it against a composite of momentum oscillators (Williams %R, CVD-based metrics). Signals require multi-timeframe consensus — no single timeframe can trigger alone.
Adaptive thresholds
What counts as "extreme" isn't fixed. Distance is measured in standard deviations (σ) , not pips or percentages — so the indicator adapts to volatility automatically. Thresholds scale with regime and historical distribution, adjusting to current market conditions in real time.
Two modes
Standard — adaptive thresholds, more signals. Good for active sessions and exploration.
High Precision — adds divergence confirmation from multiple oscillators (MFI, Delta RSI, CVD Z-Score). Fewer signals, higher selectivity.
Extreme Tension
When σ-Gap exceeds 1.6× the threshold, the indicator can fire without full confirmation. Rare, but these are the "overstretched" moments worth watching.
Filters (so you don't trade ghosts)
RVOL filter blocks signals during low activity. Session close filter avoids entries near VWAP reset. 24h volume filter skips illiquid instruments. Cooldown prevents signal clustering in the same direction.
Best use case
Built for short-term mean-reversion — quick snapback plays on 5m–15m charts where price overextends and reverts within a few candles. The engine is optimized for this rhythm, not for trend-following or swings.
On-chart
Tension Bands show dynamic threshold zones around VWAP. Signals are non-repainting and confirmed on bar close. Compact HUD displays all metrics, filter states, and signal status in real time.
Alerts
Pre-signal alerts when conditions start forming. Confirmed signal alerts with full breakdown: VWAP deviation values, σ-Gap readings, divergences detected, current mode.
Volume matters
This is a VWAP-based indicator. No volume data = no signal. If your instrument shows "No Volume" in the dashboard, switch to a data feed that provides it (crypto spot, futures, stocks with real volume).
A note on expectations
I use this logic in my own research and it has shown useful results for me in my backtesting scenarios. But this is an indicator for analysis , not a magic button. Your execution, fees, slippage, and market regime all matter. Treat signals as context, not commands. DYOR.
Feedback welcome.
For educational and analysis purposes only. Not financial advice.
ICT Liquidity & OTE Engine - Real TimeICT Liquidity & OTE Engine - Real Time
This indicator is a comprehensive toolkit designed for traders utilizing Inner Circle Trader (ICT) concepts. It automates the identification of key structural liquidity pools (Buy Side & Sell Side Liquidity) and calculates real-time Optimal Trade Entry (OTE) levels, allowing you to react instantly to market structure shifts and liquidity sweeps.
Core Features
1. Dynamic Liquidity Pools (BSL / SSL) The script uses pivot high and low logic to identify significant swing points where stop losses and breakout orders typically reside.
BSL (Buy Side Liquidity): Green lines extending from Pivot Highs. These represent areas where short sellers have stops (buy stops).
SSL (Sell Side Liquidity): Red lines extending from Pivot Lows. These represent areas where long traders have stops (sell stops).
2. Real-Time "Sweep" Detection Unlike static support/resistance indicators, this script reacts to live price action.
Visual Feedback: When price "sweeps" or purges a liquidity level (breaks a BSL or SSL line), the line style automatically changes from solid to dotted and becomes semi-transparent.
Why this matters: This provides immediate visual confirmation that a "Stop Hunt" has occurred, often a precursor to a Smart Money reversal.
3. Optimal Trade Entry (OTE) 70.5% The indicator continuously tracks the highest high and lowest low over a definable lookback period (default 40 bars) to establish the current dealing range.
It plots the 70.5% Fibonacci retracement level, which is the classic ICT "Sweet Spot" for entries during a retracement.
This removes the need to manually draw and redraw Fib tools every time the range expands.
4. Bullish Fair Value Gap (FVG) Markers The script highlights specific bars that exhibit bullish displacement gaps, aiding in the identification of strong buying pressure or potential entries after a liquidity sweep.
How It Works
Pivots: It calculates pivots based on your user-defined Lookback input (default 20). A higher number finds longer-term swings; a lower number finds short-term scalping levels.
Liquidity Logic: Once a pivot is confirmed, a line is projected forward. If the current live High or Low breaches this line, the script detects the liquidity run and alters the line's appearance.
OTE Logic: (Highest High - Lowest Low) * 0.705. This dynamic calculation ensures the OTE level moves with the market structure in real-time.
How to Use
Identify the Sweep: Wait for price to run a SSL (Red Line) or BSL (Green Line). Watch for the line to turn dotted, indicating the liquidity has been taken.
Wait for Displacement: Look for a reaction away from the sweep (e.g., a sharp move up after taking SSL).
Find the Entry: Look for price to retrace to the plotted OTE 70.5% Line, ideally aligning with a marked FVG square, to position yourself in alignment with Smart Money.
Settings
Pivot Lookback: Adjusts the sensitivity of the liquidity lines (Default: 20).
Show BSL/SSL Lines: Toggles the liquidity pools on/off.
Show OTE Levels: Toggles the real-time Fibonacci level.
OTE Line Color: Customize the visual style of your entry level.


