Search in scripts for "scalping"

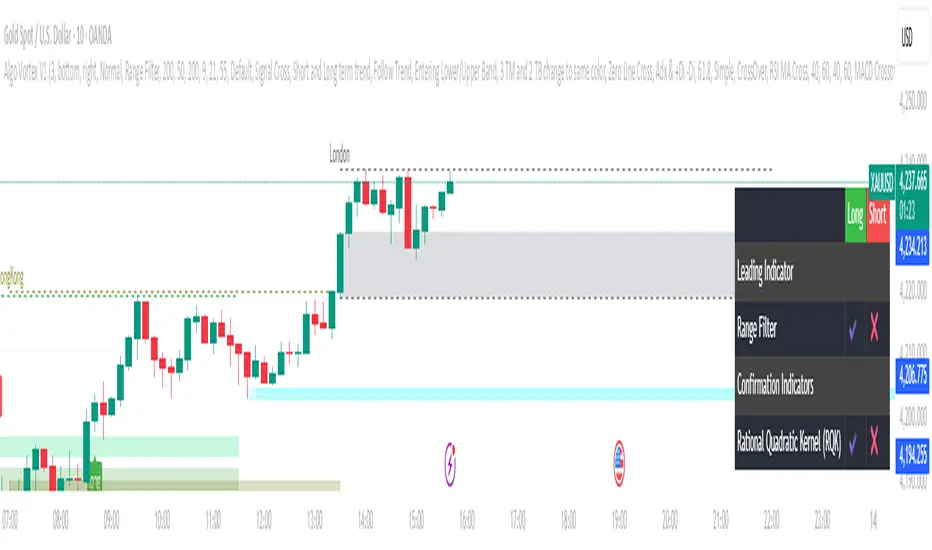
Algo Vortex V1⚡ Algo Vortex v1 — Auto Buy/Sell Signals
Description:
Algo Vortex v1 is a powerful, trend-following indicator designed for traders who want clean, reliable, and automated trading signals. This tool uses a unique blend of volatility, momentum, and trend strength filters to generate Buy and Sell alerts with high accuracy — ideal for scalping, intraday, and swing trading.
🚀 Key Features
🔹 Auto Buy/Sell Signals — Instantly highlights entry and exit zones with precision.
🔹 Trend Detection Engine — Filters false signals using Vortex-based momentum analysis.
🔹 No Lag Alerts — Signals appear in real-time for quick decision-making.
🔹 Customizable Settings — Adjust sensitivity for your preferred trading style.
🔹 Works on All Markets — Stocks, Indices, Forex, Crypto, and Commodities.
🧠 How It Works
The indicator combines the Vortex Indicator (VI) with custom smoothing algorithms and price action filters to identify trend shifts early.
When the bullish vortex crosses above the bearish vortex, a Buy Signal is triggered.
When the bearish vortex dominates, a Sell Signal appears.
Additional logic filters minimize whipsaws in sideways markets.
💡 Best Timeframes
Intraday Traders: 5m / 15m / 1H
Swing Traders: 4H / Daily
⚠️ Disclaimer
This indicator is for educational purposes only.
Past performance doesn’t guarantee future results. Always backtest before live trading.
Gabriel's Witcher Strategy [65 Minute Trading Bot]Strategy Description: Gabriel's Witcher Strategy
Author: Gabriel
Platform: TradingView Pine Script (Version 5)
Backtested Asset: Avalanche (Coinbase Brokage for Volume adjustment)
Timeframe: 65 Minutes
Strategy Type: Comprehensive Trend-Following and Momentum Strategy with Scalping and Risk Management Features
Overview
Gabriel's Witcher Strategy is an advanced trading bot designed for the Avalanche pair on a 65-minute timeframe. This strategy integrates a multitude of technical indicators to identify and execute high-probability trading opportunities. By combining trend-following, momentum, volume analysis, and range filtering, the strategy aims to capitalize on both long and short market movements. Additionally, it incorporates scalping mechanisms and robust risk management features, including take-profit (TP) levels and commission considerations, to optimize trade performance and profitability.
====Key Components====
Source Selection:
Custom Source Flexibility: Allows traders to select from a wide range of price and volume sources (e.g., Close, Open, High, Low, HL2, HLC3, OHLC4, VWAP, On-Balance Volume, etc.) for indicator calculations, enhancing adaptability to various trading styles.
Various curves of Volume Analysis are employed:
Tick Volume Calculation: Utilizes tick volume as a fallback when actual volume data is unavailable, ensuring consistency across different data feeds.
Volume Indicators: Incorporates multiple volume-based indicators such as On-Balance Volume (OBV), Accumulation/Distribution (AccDist), Negative Volume Index (NVI), Positive Volume Index (PVI), and Price Volume Trend (PVT) for comprehensive market analysis.
Trend Indicators:
ADX (Average Directional Index): Measures trend strength using either the Classic or Masanakamura method, with customizable length and threshold settings. It's used to open positions when the mesured trend is strong, or exit when its weak.
Jurik Moving Average (JMA): A smooth moving average that reduces lag, configurable with various parameters including source, resolution, and repainting options.
Parabolic SAR: Identifies potential reversals in market trends with adjustable start, increment, and maximum settings.
Custom Trend Indicator: Utilizes highest and lowest price points over a specified timeframe to determine current and previous trend bases, visually represented with color-filled areas.
Momentum Indicators:
Relative Strength Index (RSI): Evaluates the speed and change of price movements, smoothed with a custom length and source. It's used to not enter the market for shorts in oversold or longs for overbought conditions, and to enter for long in oversold or shorts for overboughts.
Momentum-Based Calculations: Employs both Double Exponential Moving Averages (DEMA) on a MACD-based RSI to enhance momentum signal accuracy which is then further accelerated by a Hull MA. This is the technical analysis tool that determines bearish or bullish momentum.
OBV-Based Momentum Conditions: Uses two exponential moving averages of OBV to determine bullish or bearish momentum shifts, anomalities, breakouts where banks flow their funds in or Smart Money Concepts trade.
Moving Averages (MA):
Multiple MA Types: Includes Simple Moving Average (SMA), Exponential Moving Average (EMA), Weighted Moving Average (WMA), Hull Moving Average (HMA), and Volume-Weighted Moving Average (VWMA), selectable via input parameters.
MA Speed Calculation: Measures the percentage change in MA values to determine the direction and speed of the trend.
Range Filtering:
Variance-Based Filter: Utilizes variance and moving averages to filter out trades during low-volatility periods, enhancing trade quality.
Color-Coded Range Indicators: Visualizes range filtering with color changes on the chart for quick assessment.
Scalping Mechanism:
Heikin-Ashi Candles: Optionally uses Heikin-Ashi candles for smoother price action analysis.
EMA-Based Trend Detection: Employs fast, medium, and slow EMAs to determine trend direction and potential entry points.
Fractal-Based Filtering: Detects regular or BW (Black & White) fractals to confirm trade signals.
Take Profit (TP) Management:
Dynamic TP Levels: Calculates TP levels based on the number of consecutive long or short entries, adjusting targets to maximize profits.
TP Signals and Re-Entry: Plots TP signals on the chart and allows for automatic re-entry upon TP hit, maintaining continuous trade flow.
Risk Management:
Commission Integration: Accounts for trading commissions to ensure net profitability.
Position Sizing: Configured to use a percentage of equity for each trade, adjustable via input parameters.
Pyramiding: Allows up to one additional position per direction to enhance gains during strong trends.
Alerts and Visual Indicators:
Buy/Sell Signals: Plots visual indicators (triangles and flags) on the chart to signify entry and TP points.
Bar Coloring: Changes bar colors based on ADX and trend conditions for immediate visual cues.
Price Levels: Marks significant price levels related to TP and position entries with cross styles.
Input Parameters
Source Settings:
Custom Sources (srcinput): Choose from various price and volume sources to tailor indicator calculations.
ADX Settings:
ADX Type (ADX_options): Select between 'CLASSIC' and 'MASANAKAMURA' methods.
ADX Length (ADX_len): Defines the period for ADX calculation.
ADX Threshold (th): Sets the minimum ADX value to consider a strong trend.
RSI Settings:
RSI Length (len_3): Period for RSI calculation.
RSI Source (src_3): Source data for RSI.
Trend Strength Settings:
Channel Length (n1): Period for trend channel calculation.
Average Length (n2): Period for smoothing trend strength.
Jurik Moving Average (JMA) Settings:
JMA Source (inp): Source data for JMA.
JMA Resolution (reso): Timeframe for JMA calculation.
JMA Repainting (rep): Option to allow JMA to repaint.
JMA Length (lengths): Period for JMA.
Parabolic SAR Settings:
SAR Start (start): Initial acceleration factor.
SAR Increment (increment): Acceleration factor increment.
SAR Maximum (maximum): Maximum acceleration factor.
SAR Point Width (width): Visual width of SAR points.
Trend Indicator Settings:
Trend Timeframe (timeframe): Period for trend indicator calculations.
Momentum Settings:
Source Type (srcType): Select between 'Price' and 'VWAP'.
Momentum Source (srcPrice): Source data for momentum calculations.
RSI Length (rsiLen): Period for momentum RSI.
Smooth Length (sLen): Smoothing period for momentum RSI.
OBV Settings:
OBV Line 1 (e1): EMA period for OBV line 1.
OBV Line 2 (e2): EMA period for OBV line 2.
Moving Average (MA) Settings:
MA Length (length): Period for MA calculations.
MA Type (matype): Select MA type (1: SMA, 2: EMA, 3: HMA, 4: WMA, 5: VWMA).
Range Filter Settings:
Range Filter Length (length0): Period for range filtering.
Range Filter Multiplier (mult): Multiplier for range variance.
Take Profit (TP) Settings:
TP Long (tp_long0): Percentage for long TP.
TP Short (tp_short0): Percentage for short TP.
Scalping Settings:
Scalping Activation (ACT_SCLP): Enable or disable scalping.
Scalping Length (HiLoLen): Period for scalping indicators.
Fast EMA Length (fastEMAlength): Period for fast EMA in scalping.
Medium EMA Length (mediumEMAlength): Period for medium EMA in scalping.
Slow EMA Length (slowEMAlength): Period for slow EMA in scalping.
Filter (filterBW): Enable or disable additional fractal filtering.
Pullback Lookback (Lookback): Number of bars for pullback consideration.
Use Heikin-Ashi Candles (UseHAcandles): Option to use Heikin-Ashi candles for smoother trend analysis.
Strategy Logic
Indicator Calculations:
Volume and Source Selection: Determines the primary data source based on user input, ensuring flexibility and adaptability.
ADX Calculation: Computes ADX using either the Classic or Masanakamura method to assess trend strength.
RSI Calculation: Evaluates market momentum using RSI, further smoothed with custom periods.
Trend Strength Assessment: Utilizes trend channel and average lengths to gauge the robustness of current trends.
Jurik Moving Average (JMA): Smooths price data to reduce lag and enhance trend detection.
Parabolic SAR: Identifies potential trend reversals with adjustable parameters for sensitivity.
Momentum Analysis: Combines RSI with DEMA and OBV-based conditions to confirm bullish or bearish momentum.
Moving Averages: Employs multiple MA types to determine trend direction and speed.
Range Filtering: Filters out low-volatility periods to focus on high-probability trades.
Trade Conditions:
Long Entry Conditions:
ADX Confirmation: ADX must be above the threshold, indicating a strong uptrend.
RSI and Momentum: RSI below 70 and positive momentum signals.
JMA and SAR: JMA indicates an uptrend, and Parabolic SAR is below the price.
Trend Indicator: Confirms the current trend direction.
Range Filter: Ensures market is in an upward range.
Scalping Option: If enabled, additional scalping conditions must be met.
Short Entry Conditions:
ADX Confirmation: ADX must be above the threshold, indicating a strong downtrend.
RSI and Momentum: RSI above 30 and negative momentum signals.
JMA and SAR: JMA indicates a downtrend, and Parabolic SAR is above the price.
Trend Indicator: Confirms the current trend direction.
Range Filter: Ensures market is in a downward range.
Scalping Option: If enabled, additional scalping conditions must be met.
Position Management:
Entry Execution: Places long or short orders based on the identified conditions and user-selected position types (Longs, Shorts, or Both).
Take Profit (TP): Automatically sets TP levels based on predefined percentages, adjusting dynamically with consecutive trades.
Re-Entry Mechanism: Allows for automatic re-entry upon TP hit, maintaining active trading positions.
Exit Conditions: Closes positions when TP levels are reached or when opposing trend signals are detected.
Visual Indicators:
Bar Coloring: Highlights bars in green for bullish conditions, red for bearish, and orange for neutral.
Plotting Price Levels: Marks significant price levels related to TP and trade entries with cross symbols.
Signal Shapes: Displays triangle and flag shapes on the chart to indicate trade entries and TP hits.
Alerts:
Custom Alerts: Configured to notify traders of long entries, short entries, and TP hits, enabling timely trade management and execution.
Usage Instructions
Setup:
Apply the Strategy: Add the script to your TradingView chart set to BTCUSDT with a 65-minute timeframe.
Configure Inputs: Adjust the input parameters under their respective groups (e.g., Source Settings, ADX, RSI, Trend Strength, etc.) to match your trading preferences and risk tolerance.
Position Selection:
Choose Position Type: Use the Position input to select Longs, Shorts, or Both based on your market outlook.
Execution: The strategy will automatically execute and manage positions according to the selected type, ensuring targeted trading actions.
Signal Interpretation:
Buy Signals: Blue triangles below the bars indicate potential long entry points.
Sell Signals: Red triangles above the bars indicate potential short entry points.
Take Profit Signals: Flags above or below the bars signify TP hits for long and short positions, respectively.
Bar Colors: Green bars suggest bullish conditions, red bars indicate bearish conditions, and orange bars represent neutral or consolidating markets.
Risk Management:
Default Position Size: Set to 100% of equity. Adjust the default_qty_value as needed for your risk management strategy.
Commission: Accounts for a 0.1% commission per trade. Adjust the commission_value to match your broker's fees.
Pyramiding: Allows up to one additional position per direction to enhance gains during strong trends.
Backtesting and Optimization:
Historical Testing: Utilize TradingView's backtesting features to evaluate the strategy's performance over historical data.
Parameter Tuning: Optimize input parameters to align the strategy with current market dynamics and personal trading objectives.
Alerts Configuration:
Set Up Alerts: Enable and configure alerts based on the predefined alertcondition statements to receive real-time notifications of trade signals and TP hits.
Additional Features
Comprehensive Indicator Integration: Combines multiple technical indicators to provide a holistic view of market conditions, enhancing trade signal accuracy.
Scalping Options: Offers an optional scalping mechanism to capitalize on short-term price movements, increasing trading flexibility.
Dynamic Take Profit Levels: Adjusts TP targets based on the number of consecutive trades, maximizing profit potential during favorable trends.
Advanced Volume Analysis: Utilizes various volume indicators to confirm trend strength and validate trade signals.
Customizable Range Filtering: Filters trades based on market volatility, ensuring trades are taken during optimal conditions.
Heikin-Ashi Candle Support: Optionally uses Heikin-Ashi candles for smoother price action analysis and reduced noise.
====Recommendations====
Thorough Backtesting:
Historical Performance: Before deploying the strategy in a live trading environment, perform comprehensive backtesting to understand its performance under various market conditions. These are the premium settings for Avalanche Coinbase.
Optimization: Regularly review and adjust input parameters to ensure the strategy remains effective amidst changing market volatility and trends. Backtest the strategy for each crypto and make sure you are in the right brokage when using the volume sources as it will affect the overall outcome of the trading strategy.
Risk Management:
Position Sizing: Adjust the default_qty_value to align with your risk tolerance and account size.
Stop-Loss Implementation: Although the strategy includes TP levels, they're also consided to be a stop-loss mechanisms to protect against adverse market movements.
Commission Adjustment: Ensure the commission_value accurately reflects your broker's fees to maintain realistic backtesting results. Generally, 0.1~0.3% are most of the average broker's comission fees.
Slipage: The slip comssion is 1 Tick, since the strategy is adjusted to only enter/exit on bar close where most positions are available.
Continuous Monitoring:
Strategy Performance: Regularly monitor the strategy's performance to ensure it operates as expected and make adjustments as needed. A max-drawndown hit has been added to operate in case the premium Avalanche settings go wrong, but you can turn it off an adjust the equity percentage to 50% if you are confortable with the high volatile max-drown or even 100% if your account allows you to borrow cash.
Customization:
Indicator Parameters: Tailor indicator settings (e.g., ADX length, RSI period, MA types) to better fit your specific trading style and market conditions.
Scalping Options: Enable or disable scalping based on your trading preferences and risk appetite.
Conclusion
Gabriel's Witcher Strategy is a robust and versatile trading solution designed to navigate the complexities of the Crypto market. By integrating a wide array of technical indicators and providing extensive customization options, this strategy empowers traders to execute informed and strategic trades. Its comprehensive approach, combining trend analysis, momentum detection, volume evaluation, and range filtering, ensures that trades are taken during optimal market conditions. Additionally, the inclusion of scalping features and dynamic take-profit management enhances the strategy's adaptability and profitability potential. Unlike any trading strategy, with both diligent testing and continuous monitoring under the strategy tester, it's possible to achieve sustained success by adjusting the settings to the individual Crypto that need it, for example this one is preset for Avalanche Coinbase 65 Miinutes but it can be adjust for BTCUSD or Etherium if you backtest and search for the right settings.

Support Resistance Pivot EMA Scalp Strategy [Mauserrifle]A strategy that creates signals based on: pivots, EMA 9+20, RSI, ATR, VWAP, wicks and volume.
The strategy is developed as a helper for quick long option scalping. This strategy is primarily designed for intraday trading on the 2m SPY chart with extended hours. However, users can adapt it for use on different symbols and timeframes. These signals are meant as a helper rather than fully automated trading bots.
One of the key elements is its pivot-based calculation, driven by my integrated indicator "Support and Resistance Pivot Points/Lines ". It enables multi-timeframe pivot calculations which are used to generate the signals and offers customizability, allowing you to define rounding methods and cooldown periods to refine pivot levels. The pivots, in combination with EMA crossovers, VWAP trend, and additional filters (RSI, ATR, VWAP, wicks and volume), create an entry and exit strategy for scalping opportunities that is useful for 0/1 DTE options with an average trade time of six minutes with the default setup for SPY. Option trading should be done outside TradingView. At this moment of release there is no option trading support.
All parameters used in the strategy are tweaked based on deep backtests results and real-time behavior. Be mindful that past performance does not guarantee future results.
The strategy is designed for intermediate and advanced users who are familiar intraday option scalping techniques.
How It Works
The strategy identifies entries based on multiple conditions, including: recently above pivot, recent EMA crossovers, RSI range, candle patterns, and VWAP uptrend. It avoids trades below the VWAP lower band due to poor backtesting results in those conditions. It creates a great number of signals when it detects an uptrend, which entails: VWAP and its lower/upper band slopes are going up, and the number of next high pivot points is greater than the number of lower pivot points. This indicates that we hope it will keep going up. In historical testing, this showed favorable results. This uptrend criteria runs on 15m charts max (where up to the VWAP effectiveness is the greatest).
The strategy also checks for candle and volume patterns, identified in backtesting to improve entry levels on historic data. Which include:
A red candle after multiple green ones, hoping to jump on a trend during a small pullback
Zero lower wick
Percentage and volume is up after lower volume candles
Percentage is up and the first and second EMA slopes are going up
Percentage is up, the first EMA is higher than the second, the price low is below the second EMA and price close above it
The VWAP uptrend overrules the candle and volume conditions (thus lots of signals during those moments).
The above is the base for many signals. There is a strict mode that adds extra checks such as:
not trading when there is no next low or high pivot
requiring a VWAP uptrend only
minimum candle percentages
This mode is for analyzing history and seeing performance during these conditions. It is worth it to create a separate alert for strict mode so you are aware of these conditions during trading.
When no stop has been defined, exits will always happen on pivot crossunder confirmations. If a stop is defined (default config), the strategy exits a position when:
the position is negative or no trail has been set
at least 1 bar has past
OR no stop has been defined (overrules previous)
trail has not been activated
The second exit condition happens when the close is below first EMA(9 by default) and when:
the position has been above first EMA
the gap between close and last pivot isn't small
the position is negative or no trail has been set
OR no stop has been defined (overrules above)
trail has not been activated
There are some more variations on this but the above are the most common. These exit conditions are a safety net because the strategy heavily relies on and favors stops. The settings allow changing stops, profit takers and trails. You can configure it to always sell without the conditions above.
The script will paint the pivot lines, trailing activation/stops, EMAs and entry/exits; with extra information in the data panel. For a complete view add VWAP and RSI to your chart, which are available from TradingView official indicator library. The strategy will not rely on those added indicators since VWAP and RSI are programmed in. You can add them to track the behavior of the signals based on these filters you have configured and have a complete view trading this strategy.
As mentioned earlier, the default settings are built for SPY 2m charts, with extended hours and real-time data. Open the strategy on this chart to study how all input parameters are used. If you don't have real-time data you need to adjust the minimum volume settings (set it to 0 at first).
The backtest
The default backtest configuration is set up to simulate SPY option trading.
Start capital is set to 10,000 and we risk around 5% of that per trade (1 contract)
Commission is set to 0.005%. The reason: at the time of this publication the SPY index price is approximately $580. Two ITM 0/1 DTE options contracts, each priced around $280, which is approximately $560. The typical commission for such a trade is around $3. To simulate this commission in the backtest on the SPY index itself, a commission of 0.005% per trade has been applied, approximating the options trading costs.
Slippage of 3 is set reflecting liquid SPY
The bar magnifier feature is turned on to have more realistic fills
Trading
In backtesting, setting commission and slippage to 0 on the SPY 2m chart shows many trades result around breaking even. Personally, I view them as an opportunity and safety net to help manage emotional decisions for exits. The signals are designed for short option scalps, allowing traders to take small profits and potentially re-enter during the strategy’s position window. It's advisable to take small potential profits, such as 4%, whenever the opportunity arises and consider re-entering if the setup still looks favorable, for example price still above ema9. Exiting a long position below ema9 is a common strategy for 2m scalping.
The average trade duration is approximately 6 minutes (3 bars). The choice between ITM (in-the-money), ATM (at-the-money), or OTM (out-of-the-money) options will depend on your trading style. Personally, I’ve seen better results with ITM options because they tend to move more in sync with the underlying index, thanks to their higher delta.
It’s important to note that the signals are designed to be a helper for manual trading rather than to automate a bot. Users are encouraged to take small profits and re-enter positions if favorable conditions persist. Be mindful that past performance does not guarantee future results.
For the default SPY setup the losses will mostly be 4-10% for ITM options. Be mindful of extreme volatile conditions where losses may reach 30% quickly, especially when trading ATM/OTM options.
The following settings can be changed:
8 pivot timeframes with left/right bars and days rendered
Here you can configure the timeframes for the pivots, which are crucial. The strategy wants that a crossover has happened recently (so it might enter after a crossunder if the crossover was recent) or the price is still above the crossed pivot.
When you decide to use a pivot timeframe higher than your chart, make sure it aligns the same starting point as the chart timeframe. As stated in the 43000478429 docs, there is a dependency between the resolution and the alignment of a starting point:
1–14 minutes — aligns to the beginning of a week
15–29 minutes — aligns to the beginning of a month
from 30 minutes and higher — aligns to the beginning of a year
This alignment also affects the setting of rendered days. I recommend a max value of 5 days for 1-14 minutes timeframes.
Also make sure a higher pivot timeframe can be divided by the lower. For instance I had repaint issues using 3m pivots on a 2m chart. But 4m pivots work fine.
Please look up docs 43000478429 to make sure this information is still up to date.
Pivot rounding
The pivot rounding option is used to add pivots based on a rounded price and limit the number of pivots. While this feature is disabled by default it can be useful with tweaking strategy variations, because many orders are placed at rounded levels and tend to act as strong price barriers.
There are multiple rounding methods: round, ceil/floor, roundn (decimal) and rounding to the minimal tick.
The next feature is a powerful extension called "Cooldown rounding":
Pivot cooldown rounding
This rounds new pivot levels for a cooldown period to keep the previous pivot line instead of adding a new line when they match the rounded value within the cooldown period. The existing line will be extended. This feature is useful because it makes sure the initial line is added to the exact high/low pivot level but any future lines within the rounding will just extend the existing line. This limits the number of pivots while still having precise levels (which normal rounding lacks) and allows more precise pivot trading.
This feature also helps ensure that the number of rendered lines will not exceed 500 too much, which is the render limit on TradingView.
You can set a maximum minutes for the cooldown. The default is 3 years which will enable the cooldown rounding permanently on the intraday (due to the max bar limit).
Pivot always added when new higher/lower pivot
When using cooldown rounding, one may find it useful to override this behavior when a new lower or higher pivot level has been reached. When enabled the new level will be added despite the fact that they may be rounded the same in the cooldown check. This is a good balance between limiting pivots but also allowing preciser trading.
VWAP bands multiplier
This is used to tweak the inner VWAP working for the upper and lower band. The default VWAP multiplier (0.9) is set based on backtesting since it performed better on historic data (the strategy does not trade below the lowerband). When you add the VWAP indicator from the TradingView library to the chart, make sure it uses the same multiplier setting as within this strategy so you have a correct view of the conditions the strategy acts on.
ATR EMA smoothing length
Used to tweak the ATR EMA smoothing. By default it is set up to 4 based on deep backtesting historic data.
EMA lengths
Changing the EMA length allows you to fine tune the EMA crossing behavior. By default the strategy is set up to EMA 9 and 20 which are considered commonly used values on the 2-minute chart.
Trading intraday time restrictions
For intraday charts you can configure when the strategy starts trading after market open and when it stops, including a hard sell. This makes sure there are no open positions left for the day during backtesting and can also aid in your trading style. For example some scalpers will not trade in the first two hours. Having no signals during this time can be beneficial. It is possible to configure these settings based on the number of bars or minutes.
Not trading on days the market closes earlier
By default the strategy does not trade on days the market closes earlier in the US. This makes sure there are no open positions left open during backtesting. Make sure to change it when using it on such a day. The days are: day before independence day, day after thanksgiving, Christmas eve and new years eve.
Not trading below VWAP lowerband
Backtesting has shown poor performance when trading below the VWAP lowerband but you are free to allow it to trade in such conditions. Past performance does not guarantee future results.
Minimum volume
A minimum volume can be set up. The current value is based on better deep backtest results for SPY using real-time data (48000). When you do not have a data plan for SPY, please set it to 0 and tweak based on backtests.
Minimum ATRP
The strategy has shown during my trading that it is sensitive to higher ATRP values and more volatile market conditions. There is more chance the index moves and we can profit from this during option scalping (if it moves in your favor). The default is based on SPY backtesting (0.04%), as a balance to have a lot of trades but also capture minimal movement.
RSI range
A RSI range can be set using a minimum and maximum value so we can limit trading during overbought/oversold conditions. Backtesting for SPY has shown the strategy performs better on historic data within a tighter range, so a default range has been set to 40-65.
Allow orders on every tick (no effect on stop/profit/trail)
This setting is used to allow orders on every tick. The strategy has been developed without trading on every tick but you can change this, for example when you have configured a setup different than the default configuration that you know works well with this. The default setup will not work well with it due to too many constant signals.
Stop percentage + ATRP threshold
One of the most important settings for managing the risk. I recommend setting a stop percentage first and later the ATRP threshold where the stop is calculated based on the current ATRP value. The calculated value will only be in effect when it is greater than the normal stop--the normal stop acts as baseline. The default stop is low (0.03). With a default ATRP threshold stop of 1.12, the calculated value overrules the normal stop when the value is greater. 0.03 acts as a minimum value but in reality the stop will most likely be higher on average for SPY with the default ATRP threshold.
For the default SPY setup the losses will be around 4-10% for ITM options. Be mindful of extreme volatile conditions where losses may reach 30% quickly, especially when trading ATM/OTM options.
Profit taker percentage + ATRP threshold
Same principles as the stop percentage above, but for profit taking. There is a very high ATRP threshold of 4 set by default. Backtests showed that trailing stops perform better on historic data.
Trailing stop
Used to set up a trailing stop. A useful feature to secure profit after a run-up, or get out with a small loss after initial activation. It is important to not use too tight values because they will give unrealistic backtest results and trigger too fast in real-time. Both the trail activation level and trail stop itself can be configured with a percentage value and ATRP value. I recommend setting up the ATRP last. By default the values are 0.05 for activation and 0.03 for the stop based on SPY real-time behavior.
Always sell on pivot crossunder confirmation
The strategy includes pivot crossunder confirmations as sell condition. By default it will not sell on every crossunder confirmation but checks for different conditions (explained in detail earlier in this description). You can change this behavior.
Always sell below first EMA when position has been above
The strategy sells below the first EMA when the position has been above it. By default it will not always sell but checks for different conditions (mentioned earlier in this description). You can change this behavior.
Buy modes pivot
By default the strategy buys between pivots as long as there has been a pivot crossover and EMAs crossover recently or price is still above it. You can change the behavior so it only buys on pivot crossovers or pivot crossover confirmations. Backtesting on the default setup shows decreased performance but for other strategy variations and pivot setups this feature can be useful since many scalpers do not buy between pivots.
Strict mode
There is a strict mode that adds extra checks such as not trading when there is no next low or high pivot, requiring a VWAP uptrend only and minimum candle percentages. This mode is for analyzing history and seeing performance during these conditions. It is worth it to create a separate alert for strict mode so you are aware of these conditions during trading. The deep backtests improved with these setting but past performance does not guarantee future results.
In the strict mode section you can override the stop, minimum ATRP, set up a minimum percentage, only trade VWAP uptrends and to not trade candles without a wick.
A summary and some extra detail
At the time of release only long trades are supported
The strategy is meant for quick scalping but one might find other uses for it
Enable extended hours on intraday charts so it captures more pivots
It does not trade extended hours (pre and post market) since options do not trade during those times
real-time data is recommended and required if a symbol has delayed data by default
You can configure that it trades minutes after market open and hard sells minutes after market open
The entries have a specific label text, example: "833 LE1 / 569.71 / P:569.8". This means: / / . The condition number is only for development/debug purposes for me when you have an issue.
The strategy cannot be tweaked to work on multiple symbols and timeframes with a single config. So you will have to make a config for every timeframe and symbol. I recommend using the Indicator Templates feature of TradingView. This way you can save the settings per timeframe and symbol
The strategy is per default config very dependent on (trailing) stops because it trades between pivots too. It wants that a pivot and EMA crossover has happened more recently than a crossunder. But you can change this behavior to always force crossover buys and crossunder sells.
It’s recommended to set up alerts to notify you of entry and exit signals. Watching the chart alone might cause you to miss trades, especially in fast-moving markets.
Only a max of 500 lines can be rendered on the chart, but the strategy will function with more under the hood. When you exceed 500 you will notice the beginning of the chart has no pivots, but beneath everything functions for backtesting.
Changing settings
Changing the settings for a different symbol and/or timeframe can be a challenging task. Here's a how-to you could use the first time to help you get going:
Set commission and slippage to 0. I prefer to do this so it is more clear whether you are balancing on break-even trades
Enable the pivot timeframe equal or above your chart timeframe. Avoid repainting as discussed earlier by choosing timeframes that align with the same timeframe
Set all volume, ATR, stop, profit takers and trail values to 0
Make sure strict mode is disabled at the bottom of the settings
You now have a clean state and you should see the backtest results purely based on pivot and EMA conditions
Tweak the stop and profit taker, beginning with the simple values and then ATRP threshold
At the last moment tweak the trailing stops. Tight trailing stops create an unrealistic backtest so you will need to tweak them based on real-time behavior of the symbol you're using which you will have to monitor during signals while the market is open. The default values are low (2m intraday SPY). Only with the bar magnifier feature it is somewhat possible to tweak realistic with history data. The tighter they are, the more unrealistic your backtest results. As a starting point, set the trailing stop low and find the highest activation level that doesn't change the results drastically, then increase the stop to the value you think reflects real-time behavior.
Keep refining by testing it during real-time behavior. Does it exit too early according to your own judgment? You need to increase the stop and maybe the activation level.
I hope you will find this useful!
DISCLAIMER
Trading is risky & most day traders lose money. This indicator is purely for informational & educational purposes only. Past performance does not guarantee future results.

[ETH] Optimized Trend Strategy - Lorenzo SuperScalpStrategy Title: Optimized Trend Strategy - Lorenzo SuperScalp
Description:
The Optimized Trend Strategy is a comprehensive trading system tailored for Ethereum (ETH) and optimized for the 15-minute timeframe but adaptable to various timeframes. This strategy utilizes a combination of technical indicators—RSI, Bollinger Bands, and MACD—to identify and act on price trends efficiently, providing traders with actionable buy and sell signals based on market conditions.
Key Features:
Multi-Indicator Approach:
RSI (Relative Strength Index): Identifies overbought and oversold conditions to time market entries and exits.
Bollinger Bands: Acts as a dynamic support and resistance level, helping to pinpoint precise entry and exit zones.
MACD (Moving Average Convergence Divergence): Detects momentum changes through bullish and bearish crossovers.
Signal Conditions:
Buy Signal:
RSI is below 45 (indicating an oversold condition).
Price is near or below the lower Bollinger Band.
MACD bullish crossover occurs.
Sell Signal:
RSI is above 55 (indicating an overbought condition).
Price is near or above the upper Bollinger Band.
MACD bearish crossunder occurs.
Trade Execution Logic:
Long Trades: Opened when a buy signal flashes. If there’s an open short position, it is closed before opening a long.
Short Trades: Opened when a sell signal flashes. If there’s an open long position, it is closed before opening a short.
The strategy also ensures a minimum number of bars between consecutive trades to avoid rapid trading in choppy conditions.
Pyramiding Support:
Up to 3 consecutive trades in the same direction are allowed, enabling traders to scale into positions based on strong signals.
Visual Indicators:
RSI Levels: Dotted lines at 45 and 55 for quick reference to oversold and overbought levels.
Buy and Sell Signals: Visual markers on the chart indicate where trades are executed, ensuring clarity on entry and exit points.
Best Used For:
Swing Trading & Scalping: While optimized for the 15-minute timeframe, this strategy works across various timeframes, making it suitable for both short-term scalping and swing trading.
Crypto Trading: Tailored for Ethereum but effective for other cryptocurrencies due to its dynamic indicator setup.

NQ Phantom Scalper Pro# 👻 NQ Phantom Scalper Pro
**Advanced VWAP Mean Reversion Strategy with Volume Confirmation**
## 🎯 Strategy Overview
The NQ Phantom Scalper Pro is a sophisticated mean reversion strategy designed specifically for Nasdaq 100 (NQ) futures scalping. This strategy combines Volume Weighted Average Price (VWAP) bands with intelligent volume spike detection to identify high-probability reversal opportunities during optimal market hours.
## 🔧 Key Features
### VWAP Band System
- **Dynamic VWAP Bands**: Automatically adjusting standard deviation bands based on intraday volatility
- **Multiple Band Levels**: Configurable Band #1 (entry trigger) and Band #2 (profit target reference)
- **Flexible Anchoring**: Choose from Session, Week, Month, Quarter, or Year-based VWAP calculations
### Volume Intelligence
- **Volume Spike Detection**: Only triggers entries when volume exceeds SMA by configurable multiplier
- **Relative Volume Display**: Real-time volume strength indicator in info panel
- **Optional Volume Filter**: Can be disabled for testing alternative setups
### Advanced Time Management
- **12-Hour Format**: User-friendly time inputs (9 AM - 4 PM default)
- **Lunch Filter**: Automatically avoids low-liquidity lunch period (12-2 PM)
- **Visual Time Zones**: Color-coded background for active/inactive periods
- **Market Hours Focus**: Optimized for peak NQ trading sessions
### Smart Risk Management
- **ATR-Based Stops**: Volatility-adjusted stop losses using Average True Range
- **Dual Exit Strategy**: VWAP mean reversion + fixed profit targets
- **Adjustable Risk-Reward**: Configurable target ratio to opposite VWAP band
- **Position Sizing**: Percentage-based equity allocation
### Optional Trend Filter
- **EMA Trend Alignment**: Optional trend filter to avoid counter-trend trades
- **Configurable Period**: Adjustable EMA length for trend determination
- **Toggle Functionality**: Enable/disable based on market conditions
## 📊 How It Works
### Entry Logic
**Long Entries**: Triggered when price touches lower VWAP band + volume spike during active hours
**Short Entries**: Triggered when price touches upper VWAP band + volume spike during active hours
### Exit Strategy
1. **VWAP Mean Reversion**: Early exit when price returns to VWAP center line
2. **Profit Target**: Fixed target based on percentage to opposite VWAP band
3. **Stop Loss**: ATR-based protective stop
### Visual Elements
- **VWAP Center Line**: Blue line showing volume-weighted fair value
- **Green Bands**: Entry trigger levels (Band #1)
- **Red Bands**: Extended levels for target reference (Band #2)
- **Orange EMA**: Trend filter line (when enabled)
- **Background Colors**: Yellow (lunch), Gray (after hours), Clear (active trading)
- **Info Panel**: Real-time metrics display
## ⚙️ Recommended Settings
### Timeframes
- **Primary**: 1-5 minute charts for scalping
- **Validation**: Test on 15-minute for swing applications
### Market Conditions
- **Best Performance**: Ranging/choppy markets with good volume
- **Trend Markets**: Enable trend filter to avoid counter-trend trades
- **High Volatility**: Increase ATR multiplier for stops
### Session Optimization
- **Pre-Market**: Generally avoided (low volume)
- **Morning Session**: 9:30 AM - 12:00 PM (high activity)
- **Lunch Period**: 12:00 PM - 2:00 PM (filtered by default)
- **Afternoon Session**: 2:00 PM - 4:00 PM (good volume)
- **After Hours**: Generally avoided (wide spreads)
## ⚠️ Risk Disclaimer
This strategy is for educational purposes only and does not constitute financial advice. Past performance does not guarantee future results. Trading futures involves substantial risk of loss and is not suitable for all investors. Users should:
- Thoroughly backtest on historical data
- Start with small position sizes
- Understand the risks of leveraged trading
- Consider transaction costs and slippage
- Never risk more than you can afford to lose
## 📈 Performance Tips
1. **Volume Threshold**: Adjust volume multiplier based on average NQ volume patterns
2. **Band Sensitivity**: Modify band multipliers for different volatility regimes
3. **Time Filters**: Customize trading hours based on your timezone and preferences
4. **Trend Alignment**: Use trend filter during strong directional markets
5. **Risk Management**: Always maintain consistent position sizing and risk parameters
**Version**: 6.0 Compatible
**Asset**: Optimized for NASDAQ 100 Futures (NQ)
**Style**: Mean Reversion Scalping
**Frequency**: High-Frequency Trading Ready

[Sniper] SSL Hybrid + QQE MOD + Waddah Attar StrategyHi. I’m DuDu95.
**********************************************************************************
This is the script for the series called "Sniper".
*** What is "Sniper" Series? ***
"Sniper" series is the project that I’m going to start.
In "Sniper" Series, I’m going to "snipe and shoot" the youtuber’s strategy: to find out whether the youtuber’s video about strategy is "true or false".
Specifically, I’m going to do the things below.
1. Implement "Youtuber’s strategy" into pinescript code.
2. Then I will "backtest" and prove whether "the strategy really works" in the specific ticker (e.g. BTCUSDT) for the specific timeframe (e.g. 5m).
3. Based on the backtest result, I will rate and judge whether the youtube video is "true" or "false", and then rate the validity, reliability, robustness, of the strategy. (like a lie detector)
*** What is the purpose of this series? ***
1. To notify whether the strategy really works for the people who watched the youtube video.
2. To find and build my own scalping / day trading strategy that really works.
**********************************************************************************
*** Strategy Description ***
This strategy is from "SSL QQE MOD 5MIN SCALPING STRATEGY" by youtuber "Daily Investments".
"Daily Investments" claimed that this strategy will make you some money from 100 trades in any ticker in 5 minute timeframe.
### Entry Logic
1. Long Entry Logic
- close > SSL Hybrid Baseline.
- QQE MOD should turn into blue color.
- Waddah Attar Explosion indicator must be green.
2. Short Entry Logic
- close < SSL Hybrid Baseline
- QQE MOD should turn into red color.
- Waddah Attar Explosion indicator must be red.
### Exit Logic
1. Long Exit Logic
- When QQE MOD turn into red color.
2. Short Entry Logic
- When QQE MOD turn into blue color.
### StopLoss
1. Can Choose Stop Loss Type: Percent, ATR, Previous Low / High.
2. Can Chosse inputs of each Stop Loss Type.
### Take Profit
1. Can set Risk Reward Ratio for Take Profit.
- To simplify backtest, I erased all other options except RR Ratio.
- You can add Take Profit Logic by adding options in the code.
2. Can set Take Profit Quantity.
### Risk Manangement
1. Can choose whether to use Risk Manangement Logic.
- This controls the Quantity of the Entry.
- e.g. If you want to take 3% risk per trade and stop loss price is 6% below the long entry price,
then 50% of your equity will be used for trade.
2. Can choose How much risk you would take per trade.
### Plot
1. Added Labels to check the data of entry / exit positions.
2. Changed and Added color different from the original one. (green: #02732A, red: #D92332, yellow: #F2E313)
3. SSL Hybrid Baseline is by default drawn on the chart.
4. If you check EMA filter, EMA would be drawn on the chart.
5. Should add QQE MOD and Waddah Attar Explosion indicator manually if you want to see QQE MOD.
**********************************************************************************
*** Rating: True or False?
### Rating:
→ 1.5 / 5 (0 = Trash, 1 = Bad, 2 = Not Good, 3 = Good, 4 = Great, 5 = Excellent)
### True or False?
→ False
→ Doesn't Work on 5 minute timeframe. Also, it doesn't work on crypto.
### Better Option?
→ Use this for Day trading or Swing Trading, not for Scalping. (Bigger Timeframe)
→ Although the result was bad at 5 minute timeframe, it was profitable in 1h, 2h, 4h, 8h, 1d timeframe.
→ BTC, ETH was ok.
→ The result was better when I use EMA filter (only on longer timeframe).
### Robust?
→ So So. Although result was bad in short timeframe (e.g. 30m 15m 5m), backtest result was "consistently" profitable on longer timeframe.
→ Also, MDD was not that bad under risk management option on.
**********************************************************************************
*** Conclusion?
→ Don't use this on short timeframe.
→ Better use on longer timeframe with filter, stoploss and risk management.

Weekend Hunter Ultimate v6.2 Weekend Hunter Ultimate v6.2 - Automated Crypto Weekend Trading System
OVERVIEW:
Specialized trading strategy designed for cryptocurrency weekend markets (Saturday-Sunday) when institutional traders are typically offline and market dynamics differ significantly from weekdays. Optimized for 15-minute timeframe execution with multi-timeframe confluence analysis.
KEY FEATURES:
- Weekend-Only Trading: Automatically activates during configurable weekend hours
- Dynamic Leverage: 5-20x leverage adjusted based on market safety and signal confidence
- Multi-Timeframe Analysis: Combines 4H trend, 1H momentum, and 15M execution
- 10 Pre-configured Crypto Pairs: BTC, ETH, LINK, XRP, DOGE, SOL, AVAX, PEPE, TON, POL
- Position & Risk Management: Max 4 concurrent positions, -30% account protection
- Smart Trailing Stops: Protects profits when approaching targets
RISK MANAGEMENT:
- Maximum daily loss: 5% (configurable)
- Maximum weekend loss: 15% (configurable)
- Per-position risk: Capped at 120-156 USDT
- Emergency stops for flash crashes (8% moves)
- Consecutive loss protection (4 losses = pause)
TECHNICAL INDICATORS:
- CVD (Cumulative Volume Delta) divergence detection
- ATR-based dynamic stop loss and take profit
- RSI, MACD, Bollinger Bands confluence
- Volume surge confirmation (1.5x average)
- Weekend liquidity adjustments
INTEGRATION:
- Designed for Bybit Futures (0.075% taker fee)
- WunderTrading webhook compatibility via JSON alerts
- Minimum position size: 120 USDT (Bybit requirement)
- Initial capital: $500 recommended
TARGET METRICS:
- Win rate target: 65%
- Average win: 5.5%
- Average loss: 1.8%
- Risk-reward ratio: ~3:1
IMPORTANT DISCLAIMERS:
- Past performance does not guarantee future results
- Leveraged trading carries substantial risk of loss
- Weekend crypto markets have 13% of normal liquidity
- Not suitable for traders who cannot afford to lose their entire investment
- Requires continuous monitoring and adjustment
USAGE:
1. Apply to 15-minute charts only
2. Configure weekend hours for your timezone
3. Set up webhook alerts for automation
4. Monitor performance table in top-right corner
5. Adjust parameters based on your risk tolerance
This is an experimental strategy for educational purposes. Always test with small amounts first and never invest more than you can afford to lose completely.

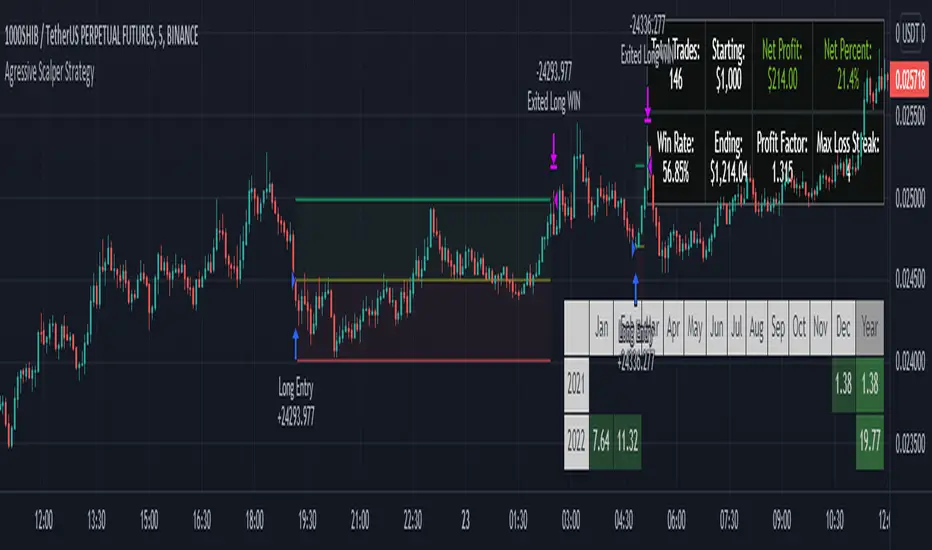
Agressive Scalper StrategyAfter many different tests and tries we found a strategy which is suited for people that likes to trade in shorter time frames. It uses multiple indications for entries. Entries include indications like Double ATR, Consolidation Detection, Dynamic RSI Calculation with Overbought and Oversold lines and also previous bars highs and lows. Although this strategy has been coded and tested on short time frames, after many additions it turns out it can be very profitable in every time frame if you play with the settings. Also it has some helpers for people that likes to optimize and see how their choices affects the outcome.
The strategy calculates the entry with the rules below:
LONG ENTRY RULES
- Price must be in consolidation zone
- Fast ATR Must be higher than Slow ATR
- Dynamic RSI must be below the oversold line (Green Line as Default)
- The Signal lookback must allow entry. (For example if you set signal lookback to 5, if the LOW of current price is LOWEST point of last 5 bars it is okay to enter LONG) If you check the lookback helper it will show you as green arrow at the bottom.
SHORT ENTRY RULES
- Price must be in consolidation zone
- Fast ATR Must be higher than Slow ATR
- Dynamic RSI must be above the overbought line (Red Line as Default)
- The Signal lookback must allow entry. (For example if you set signal lookback to 5, if the HIGHEST of current price is HIGHEST point of last 5 bars it is okay to enter SHORT) If you check the lookback helper it will show you as red arrow at the top.
This strategy has additional settings that are not available in indicator version that is previously released so i suggest everyone to use this instead.
Happy trading everyone!
Bollinger Bands JuanSeNL Strategy Bitmex 15min
It is a conservative strategy that works in bitmex in a 15-minute time frame, identifies an oversold market and sells on the rebound
It has a modifiable takeprofit and stoploss but works fine as it is set by default
Only Longs

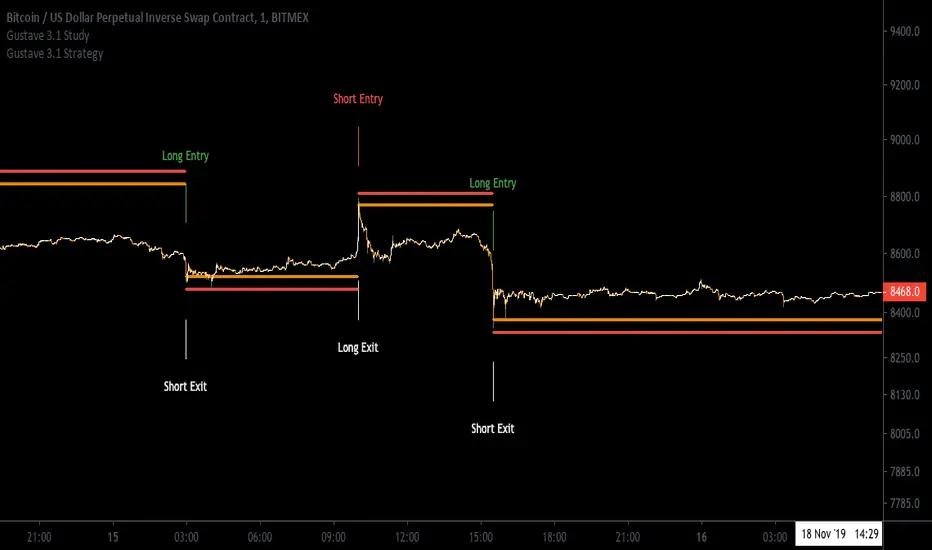
[Aill3urs V.1.0.P] Strategy GustaveThis INVIT-ONLY strategy is based on Noise / Fixe TP & SL / EMA and you can optimize it with trends and work on low timeframe < 5min
Please use comment section for any feedback.
I have also a study with alarms Long Entry / Long Exit / Short Entry / Short Exit
For any question DM me for any request.
## DISCLAIMER
1. I am not licensed financial advisors or broker dealers. I do not tell you when or what to buy or sell. I developed this software which enables you execute manual or automated trades multiple trades using TradingView. The software allows you to set the criteria you want for entering and exiting trades.
2. Do not trade with money you cannot afford to lose.
3. I do not guarantee consistent profits or that anyone can make money with no effort. And I am not selling the holy grail.
4. Every system can have winning and losing streaks.
5. Money management plays a large role in the results of your trading. For example: lot size, account size, broker leverage, and broker margin call rules all have an effect on results. Also, your Take Profit and Stop Loss settings for individual pair trades and for overall account equity have a major impact on results. If you are new to trading and do not understand these items, then I recommend you seek education materials to further your knowledge.
**YOU NEED TO FIND AND USE THE TRADING SYSTEM THAT WORKS BEST FOR YOU AND YOUR TRADING TOLERANCE.**
**I HAVE PROVIDED NOTHING MORE THAN A TOOL WITH OPTIONS FOR YOU TO TRADE WITH THIS PROGRAM ON TRADINGVIEW.**

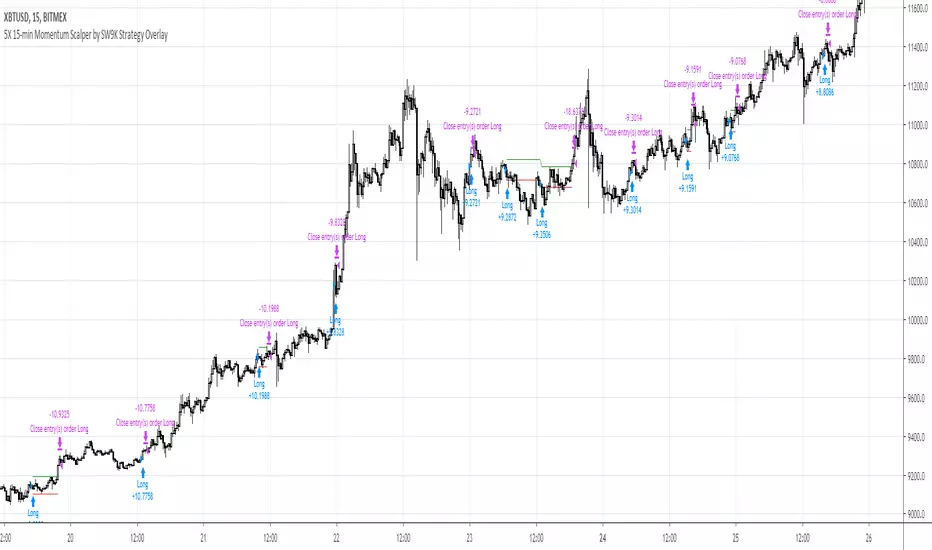
15MEX Momentum Scalper (5X)Working prototype to accurately scalp on the 15 min chart for $XBTUSD pair on BitMex. Designed to let winners run a bit, without any pre-set stop loss. Model is optimized to allow 5X leveraged underwater positions to recover into profitability. Do NOT overleverage with this strategy or you will be liquidated.
Simulated with trades since March 1, 2019, with 100k contract size entries.
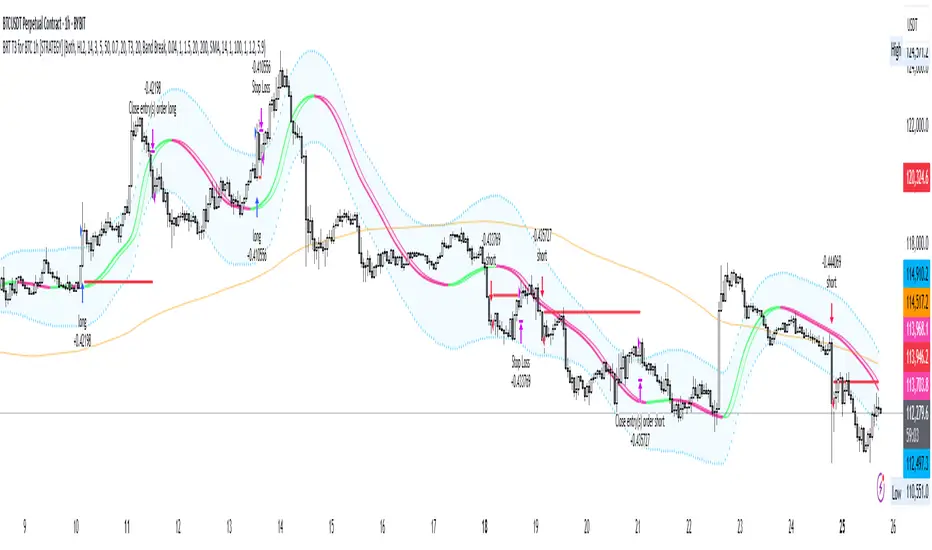
BRT T3 for BTC 1h [STRATEGY]## 📊 BRT T3 Adaptive Strategy for BTC 1H
STRATEGY DESCRIPTION
Professional trading strategy based on the adaptive T3 (Tillson T3) indicator with dynamic length controlled by the Relative Strength Index (RSI) . The strategy is specifically designed for Bitcoin trading on the hourly timeframe and includes a comprehensive filter system to minimize false signals.
═════════════════════════════════════════
🔥 UNIQUE CODE FEATURES
1. RSI-Adaptive Architecture:
• Innovative Approach: Unlike standard MA strategies with fixed periods, our code dynamically adjusts the moving average length based on RSI
• Smart Formula: len = minLen + (maxLen - minLen) * (1 - RSI/100) - automatically accelerates response in extreme zones
• Result: Strategy adapts to market conditions without manual reconfiguration
2. Modified Ichimoku Cloud:
• Unique Calculation: Instead of classic high/low, uses ATR-based method
• Dynamic Levels: Cloud is built based on volatility, not fixed periods
• Advantage: More accurate trend determination in highly volatile cryptocurrency markets
3. Hybrid Signal System:
• Dual-mode Generation: Switch between classic MA crossovers and volatility band breakouts
• Multi-stage Confirmation: Optional signal verification across N forward bars
• Effect: 40-60% reduction in false signals compared to simple MA strategies
4. All-in-One Solution:
• 8 MA Types in One Code: The only strategy on TradingView with complete implementation of T3, EMA, SMA, WMA, VWMA, HMA, RMA, DEMA
• Custom Functions: All MAs calculated through custom functions supporting series int
• Versatility: One code replaces 8 different strategies
5. Intelligent Filtering:
Combination of 4 independent filters:
├── Volume Filter (dynamic multiplier)
├── Trend Filter (adaptive period)
├── ATR Filter (volatility)
└── Ichimoku Filter (cloud trend)
• Unique Logic: Each filter can work independently or in combination
• Master Switch: Single control for all filters
6. Advanced Risk Management:
• Smart Stops: SL/TP levels are stored in variables and not recalculated on every bar
• Slippage Protection: Checks both close and high/low for stop triggers
• Visualization: Dynamic display of levels only for active positions
7. Performance Optimization:
• Efficient Loops: Minimized calculations through intermediate result storage
• Conditional Visualization: Element rendering only when necessary
• Clean Code: Structured organization with clear logical block separation
═════════════════════════════════════════
💎 TECHNICAL INNOVATIONS
Adaptation Algorithm (exclusive development):
// Dynamic length based on RSI
rsi_scale = 1.0 - rsi / 100.0
len_adaptive = minLen + (maxLen - minLen) * rsi_scale
ATR-based Ichimoku (unique modification):
// Instead of classic (highest + lowest) / 2
// Using ATR for dynamic levels
upper := close < upper ? min(hl2 + atr*mult, upper ) : hl2 + atr*mult
lower := close > lower ? max(hl2 - atr*mult, lower ) : hl2 - atr*mult
Multi-MA Architecture (complete implementation):
• Each MA type has its own optimized function
• Support for series int for dynamic length
• Unified selection interface via switch statement
═════════════════════════════════════════
🎯 KEY FEATURES
• Adaptive System: Moving average length automatically adjusts based on RSI, providing quick response in trending movements and stability in sideways markets
• 8 Moving Average Types: T3, EMA, SMA, WMA, VWMA, HMA, RMA, DEMA - ability to choose the optimal type for different market conditions
• Multi-level Filtering:
- Volume Filter - signal confirmation with increased activity
- Trend Filter - trading in the direction of the main trend
- ATR Filter - accounting for market volatility
- Ichimoku Cloud - additional trend direction confirmation
• Professional Risk Management: Customizable stop-loss and take-profit levels
═════════════════════════════════════════
⚙️ HOW IT WORKS
1. Signal Generation:
• Original Mode: Classic MA crossover signals with lagged version
• Band Break Mode: Volatility band breakouts (based on standard deviation)
2. RSI Adaptation:
• High RSI (overbought) → uses short MA length for quick response
• Low RSI (oversold) → uses long MA for noise smoothing
• Adaptation range is configured by Min/Max length parameters
3. Filter System:
• Each filter can be enabled/disabled independently
• Signal is generated only when passing all active filters
• Ichimoku filter blocks counter-trend trades
═════════════════════════════════════════
📈 STRATEGY PARAMETERS
Main Settings:
• Strategy Type: Long Only / Short Only / Both
• Data Source: Close, Open, High, Low, HL2, HLC3, OHLC4
RSI Settings:
• RSI Length: Calculation period (default 14)
• RSI Smoothing: Smoothing to reduce noise
T3/MA Settings:
• Min/Max Length: Adaptive length range (5-50)
• Volume Factor: T3 smoothing coefficient (0.7)
• MA Type: Moving average type selection
Filters:
• Volume Filter: Volume multiplier (1.5x average)
• Trend Filter: Trend MA period (200)
• ATR Filter: Minimum volatility for entry
• Ichimoku Filter: Cloud for trend determination
Risk Management:
• Stop Loss: Percentage from entry price (1.2%)
• Take Profit: Percentage from entry price (5.9%)
• Position Size: 50,000 USDT (effective leverage 5x)
═════════════════════════════════════════
💡 USAGE RECOMMENDATIONS
Optimal Conditions:
• Timeframe: 1H (developed and optimized)
• Instrument: BTC/USDT and other liquid cryptocurrencies
• Market Conditions: Trending and moderately volatile markets
Customize to Your Style:
1. Conservative: Increase signal confirmation period, enable all filters
2. Aggressive: Reduce filters, use Band Break mode
3. Scalping: Decrease Min/Max length, disable trend filter
═════════════════════════════════════════
📊 VISUALIZATION
Strategy displays:
• Main MA Line - changes color depending on direction
• Lag Line - for visualizing crossover moment
• Volatility Bands - upper and lower boundaries
• Trend MA - orange line (200 periods)
• SL/TP Levels - red and green lines for open positions
═════════════════════════════════════════
🔔 ALERTS
Strategy supports alert configuration for:
• Long position entry signals
• Short position entry signals
• Position exit signals
• Ichimoku line crossings
═════════════════════════════════════════
⚠️ RISK WARNING
IMPORTANT NOTICE: Trading in financial markets involves substantial risk of capital loss. Past performance presented in this strategy is based solely on historical data and under no circumstances constitutes a guarantee of future returns.
The strategy author is not responsible for:
• Any direct or indirect financial losses resulting from the use of this strategy
• Trading decisions made based on strategy signals
• Interpretation of backtesting results as a forecast of future performance
This strategy is provided exclusively for educational and research purposes. Backtesting results are affected by numerous factors including but not limited to: slippage, spread, commissions, market liquidity, and technical failures.
Before using the strategy in live trading:
• Conduct your own testing on a demo account
• Ensure understanding of all parameters and logic
• Only use funds you can afford to lose
• Consider consulting with a qualified financial advisor
DISCLAIMER: By using this strategy, you acknowledge and accept all risks associated with financial market trading and confirm that the author does not provide investment advice and bears no fiduciary responsibility to users.
═════════════════════════════════════════
🛠 TECHNICAL SUPPORT
For questions about setup and optimization:
• Leave comments under the publication
• Follow strategy updates
• Study the code for deep understanding of logic
═════════════════════════════════════════
📝 VERSION AND UPDATES
Version: 1.0.0
Pine Script: v6
Last Updated: 2025
Changelog:
• Added support for 8 MA types
• Integrated Ichimoku Cloud filter
• Optimized risk management system
• Improved signal visualization
═════════════════════════════════════════
© 2025 BRT Trading Systems
Strategy is protected by copyright. Commercial use without author's permission is prohibited.
Apex Trend SniperApex Trend Sniper - Advanced Trend Trading Strategy (Pine Script v5)
🚀 Overview
The Apex Trend Sniper is an advanced, fully automated trend-following strategy designed for crypto, forex, and stock markets. It combines momentum analysis, trend confirmation, volume validation, and adaptive risk management to capture high-probability trades. Unlike many strategies, this system is 100% non-repainting, ensuring reliable backtesting and real-time execution.
🔹 How This Strategy Works (Indicator Mashup)
The Apex Trend Sniper leverages multiple indicators to create a robust multi-layered confirmation system:
1️⃣ Trend Identification with RMI & McGinley Dynamic
📌 What It Does: Identifies the dominant trend and prevents trading against market conditions.
✔ McGinley Dynamic Baseline:
A highly adaptive moving average that dynamically reacts to price changes.
Price above the baseline = bullish trend.
Price below the baseline = bearish trend.
✔ Relative Momentum Index (RMI):
A refined Relative Strength Index (RSI) that filters out weak trends.
Above 50 = bullish confirmation.
Below 50 = bearish confirmation.
2️⃣ Trend Strength Confirmation with Vortex Indicator
📌 What It Does: Confirms that a detected trend is strong and valid.
✔ Vortex Indicator (VI):
Measures directional movement and trend strength.
A bullish trend is confirmed when VI+ > VI-.
A bearish trend is confirmed when VI- > VI+.
3️⃣ Volume Spike Detection for Trade Validation
📌 What It Does: Ensures that trades are placed only during strong market participation.
✔ Volume Confirmation:
A trade signal is only valid if volume spikes above the moving average.
Helps avoid false breakouts and weak trends.
4️⃣ Entry & Exit Strategy with Multi-Level Take Profits
📌 What It Does: Enters trades only when all conditions align and manages risk effectively.
✔ Entry Conditions (All must be met):
Price is above/below McGinley Dynamic.
RMI confirms trend direction.
Vortex indicator confirms trend strength.
Volume spike is detected.
✔ Exit Conditions:
Take Profit 1 (TP1): Secures 50% of the position at the first price target.
Take Profit 2 (TP2): Closes the remaining position at the second price target.
Exit Before Reversal: If an opposite trend signal appears, the position is closed early.
Trend Weakness Exit: If momentum weakens, the trade is exited automatically.
📌 Strategy Customization
🔧 Fully customizable to fit any trading style:
✔ McGinley Dynamic Length – Adjust baseline sensitivity.
✔ RMI & Vortex Settings – Fine-tune momentum filters.
✔ Volume Thresholds – Modify spike detection for better accuracy.
✔ Take Profit Levels – Set TP1 & TP2 based on market volatility.
📢 How to Use Apex Trend Sniper
1️⃣ Apply the strategy to any TradingView chart.
2️⃣ Customize the settings to fit your trading approach.
3️⃣ Use the backtest report to evaluate performance.
4️⃣ Monitor the dashboard to track real-time trade execution.
📌 Recommended Timeframes & Markets
✔ Best Markets:
✅ Crypto (BTC, ETH, SOL, etc.)
✅ Forex (EUR/USD, GBP/USD, JPY/USD, etc.)
✅ Stocks & Indices (S&P500, NASDAQ, etc.)
✔ Optimal Timeframes:
✅ Swing Trading: 1H – 4H – 1D
✅ Intraday & Scalping: 5M – 15M – 30M
📌 Backtest Settings for Realistic Performance
✔ Initial Capital: $1000 (or more for scaling).
✔ Commission: 0.05% (to simulate exchange fees).
✔ Slippage: 1-2 (to account for execution delay).
✔ Date Range: Test across different market conditions.
📢 TradingView Disclaimer
📌 This script is for educational purposes only and does not constitute financial advice. Trading carries significant risk, and past performance does not guarantee future results. Always test strategies thoroughly before applying them in a live market. Users are responsible for their own trading decisions.
🚀 Why Choose Apex Trend Sniper?
✅ Non-Repainting – No misleading signals.
✅ Multi-Layer Confirmation – Reduces false trades.
✅ Volume & Trend Strength Validation – Ensures high-probability entries.
✅ Adaptive Risk Management – Secures profits while maximizing trends.
✅ Versatile Across Markets & Timeframes – Works for crypto, forex, and stocks.
📢 Start Trading Smarter with Apex Trend Sniper! 🚀
🔗 Try it now on TradingView and optimize your trend-following strategy. 🔥

Price action: Trendline Break StrategyThis strategy use trendline to entry. Trendline be drawed from Pivots High/Low.
Entry Long: When price break up trendline.
Entry Short: When price break down trendline.
Risk:Reward setup is 1:1.
You can backtest with whichever pair and whichever timeframe.
I backtested:
- If scalping: should use timeframe 5m, set up SL, TP is 2%.
- If swing trade: should use timeframe 1H, set up SL 2%, TP is 3%.
Should use with other indicator to increase winrate.

RSI Divergence Strategywhat is "RSI Divergence Strategy"?
it is a RSI strategy based this indicator:
what it does?
it gives buy or sell signals according to RSI Divergences. it also has different variables such as "take profit", "stop loss" and trailing stop loss.
how it does it?
it uses the "RSI Divergence" indicator to give signal. For detailed information on how it works, you can visit the link above. The quantity of the inputs is proportional to the rsi values. Long trades are directly traded with "RSI" value, while short poses are traded with "100-RSI" value.
How to use it?
The default settings are for scalp strategy but can be used for any type of trading strategy. you can develop different strategies by changing the sections. It is quite simple to use.
RSI length is length of RSİ
source is source of RSİ
RSİ Divergence lenght is length of line on the RSI
The "take profit", "stop" and "trailing stop" parts used in the "buy" group only affect buys. The "sell" group is similarly independent of the variables in the "buy" group.
The "zoom" section is used to enlarge or reduce the indicator. it only changes the appearance, it does not affect the results of the strategy.

RastaRasta — Educational Strategy (Pine v5)
Momentum · Smoothing · Trend Study
Overview
The Rasta Strategy is a visual and educational framework designed to help traders study momentum transitions using the interaction between a fast-reacting EMA line and a slower smoothed reference line.
It is not a signal generator or profit system; it’s a learning tool for understanding how smoothing, crossovers, and filters interact under different market conditions.
The script displays:
A primary EMA line (the fast reactive wave).
A Smoothed line (using your chosen smoothing method).
Optional fog zones between them for quick visual context.
Optional DNA rungs connecting both lines to illustrate volatility compression and expansion.
Optional EMA 8 / EMA 21 trend filter to observe higher-time-frame alignment.
Core Idea
The Rasta model focuses on wave interaction. When the fast EMA crosses above the smoothed line, it reflects a shift in short-term momentum relative to background trend pressure. Cross-unders suggest weakening or reversal.
Rather than treating this as a trading “signal,” use it to observe structure, study trend alignment, and test how smoothing type affects reaction speed.
Smoothing Types Explained
The script lets you experiment with multiple smoothing techniques:
Type Description Use Case
SMA (Simple Moving Average) Arithmetic mean of the last n values. Smooth and steady, but slower. Trend-following studies; filters noise on higher time frames.
EMA (Exponential Moving Average) Weights recent data more. Responds faster to new price action. Momentum or reactive strategies; quick shifts and reversals.
RMA (Relative Moving Average) Used internally by RSI; smooths exponentially but slower than EMA. Momentum confirmation; balanced response.
WMA (Weighted Moving Average) Linear weights emphasizing the most recent data strongly. Intraday scalping; crisp but potentially noisy.
None Disables smoothing; uses the EMA line alone. Raw comparison baseline.
Each smoothing method changes how early or late the strategy reacts:
Faster smoothing (EMA/WMA) = more responsive, good for scalping.
Slower smoothing (SMA/RMA) = more stable, good for trend following.
Modes of Study
🔹 Scalper Mode
Use short EMA lengths (e.g., 3–5) and fast smoothing (EMA or WMA).
Focus on 1 min – 15 min charts.
Watch how quick crossovers appear near local tops/bottoms.
Fog and rung compression reveal volatility contraction before bursts.
Goal: study short-term rhythm and liquidity pulses.
🔹 Momentum Mode
Use moderate EMA (5–9) and RMA smoothing.
Ideal for 1 H–4 H charts.
Observe how the fog color aligns with trend shifts.
EMA 8 / 21 filter can act as macro bias; “Enter” labels will appear only in its direction when enabled.
Goal: study sustained motion between pullbacks and acceleration waves.
🔹 Trend-Follower Mode
Use longer EMA (13–21) with SMA smoothing.
Great for daily/weekly charts.
Focus on periods where fog stays unbroken for long stretches — these illustrate clear trend dominance.
Watch rung spacing: tight clusters often precede consolidations; wide rungs signal expanding volatility.
Goal: visualize slow-motion trend transitions and filter whipsaw conditions.
Components
EMA Line (Red): Fast-reacting short-term direction.
Smoothed Line (Yellow): Reference trend baseline.
Fog Zone: Green when EMA > Smoothed (up-momentum), red when below.
DNA Rungs: Thin connectors showing volatility structure.
EMA 8 / 21 Filter (optional):
When enabled, the strategy will only allow Enter events if EMA 8 > EMA 21.
Use this to study higher-trend gating effects.
Educational Applications
Momentum Visualization: Observe how the fast EMA “breathes” around the smoothed baseline.
Trend Transitions: Compare different smoothing types to see how early or late reversals are detected.
Noise Filtering: Experiment with fog opacity and smoothing lengths to understand trade-off between responsiveness and stability.
Risk Concept Simulation: Includes a simple fixed stop-loss parameter (default 13%) for educational demonstrations of position management in the Strategy Tester.
How to Use
Add to Chart → “Strategy.”
Works on any timeframe and instrument.
Adjust Parameters:
Length: base EMA speed.
Smoothing Type: choose SMA, EMA, RMA, or WMA.
Smoothing Length: controls delay and smoothness.
EMA 8 / 21 Filter: toggles trend gating.
Fog & Rungs: visual study options only.
Study Behavior:
Use Strategy Tester → List of Trades for entry/exit context.
Observe how different smoothing types affect early vs. late “Enter” points.
Compare trend periods vs. ranging periods to evaluate efficiency.
Combine with External Tools:
Overlay RSI, MACD, or Volume for deeper correlation analysis.
Use replay mode to visualize crossovers in live sequence.
Interpreting the Labels
Enter: Marks where fast EMA crosses above the smoothed line (or when filter flips positive).
Exit: Marks where fast EMA crosses back below.
These are purely analytical markers — they do not represent trade advice.
Educational Value
The Rasta framework helps learners explore:
Reaction time differences between moving-average algorithms.
Impact of smoothing on signal clarity.
Interaction of local and global trends.
Visualization of volatility contraction (tight DNA rungs) and expansion (wide fog zones).
It’s a sandbox for studying price structure, not a promise of profit.
Disclaimer
This script is provided for educational and research purposes only.
It does not constitute financial advice, trading signals, or performance guarantees. Past market behavior does not predict future outcomes.
Users are encouraged to experiment responsibly, record observations, and develop their own understanding of price behavior.
Author: Michael Culpepper (mikeyc747)
License: Educational / Open for study and modification with credit.
Philosophy:
“Learning the rhythm of the market is more valuable than chasing its profits.” — Rasta

VoVix DEVMA🌌 VoVix DEVMA: A Deep Dive into Second-Order Volatility Dynamics
Welcome to VoVix+, a sophisticated trading framework that transcends traditional price analysis. This is not merely another indicator; it is a complete system designed to dissect and interpret the very fabric of market volatility. VoVix+ operates on the principle that the most powerful signals are not found in price alone, but in the behavior of volatility itself. It analyzes the rate of change, the momentum, and the structure of market volatility to identify periods of expansion and contraction, providing a unique edge in anticipating major market moves.
This document will serve as your comprehensive guide, breaking down every mathematical component, every user input, and every visual element to empower you with a profound understanding of how to harness its capabilities.
🔬 THEORETICAL FOUNDATION: THE MATHEMATICS OF MARKET DYNAMICS
VoVix+ is built upon a multi-layered mathematical engine designed to measure what we call "second-order volatility." While standard indicators analyze price, and first-order volatility indicators (like ATR) analyze the range of price, VoVix+ analyzes the dynamics of the volatility itself. This provides insight into the market's underlying state of stability or chaos.
1. The VoVix Score: Measuring Volatility Thrust
The core of the system begins with the VoVix Score. This is a normalized measure of volatility acceleration or deceleration.
Mathematical Formula:
VoVix Score = (ATR(fast) - ATR(slow)) / (StDev(ATR(fast)) + ε)
Where:
ATR(fast) is the Average True Range over a short period, representing current, immediate volatility.
ATR(slow) is the Average True Range over a longer period, representing the baseline or established volatility.
StDev(ATR(fast)) is the Standard Deviation of the fast ATR, which measures the "noisiness" or consistency of recent volatility.
ε (epsilon) is a very small number to prevent division by zero.
Market Implementation:
Positive Score (Expansion): When the fast ATR is significantly higher than the slow ATR, it indicates a rapid increase in volatility. The market is "stretching" or expanding.
Negative Score (Contraction): When the fast ATR falls below the slow ATR, it indicates a decrease in volatility. The market is "coiling" or contracting.
Normalization: By dividing by the standard deviation, we normalize the score. This turns it into a standardized measure, allowing us to compare volatility thrust across different market conditions and timeframes. A score of 2.0 in a quiet market means the same, relatively, as a score of 2.0 in a volatile market.
2. Deviation Analysis (DEV): Gauging Volatility's Own Volatility
The script then takes the analysis a step further. It calculates the standard deviation of the VoVix Score itself.
Mathematical Formula:
DEV = StDev(VoVix Score, lookback_period)
Market Implementation:
This DEV value represents the magnitude of chaos or stability in the market's volatility dynamics. A high DEV value means the volatility thrust is erratic and unpredictable. A low DEV value suggests the change in volatility is smooth and directional.
3. The DEVMA Crossover: Identifying Regime Shifts
This is the primary signal generator. We take two moving averages of the DEV value.
Mathematical Formula:
fastDEVMA = SMA(DEV, fast_period)
slowDEVMA = SMA(DEV, slow_period)
The Core Signal:
The strategy triggers on the crossover and crossunder of these two DEVMA lines. This is a profound concept: we are not looking at a moving average of price or even of volatility, but a moving average of the standard deviation of the normalized rate of change of volatility.
Bullish Crossover (fastDEVMA > slowDEVMA): This signals that the short-term measure of volatility's chaos is increasing relative to the long-term measure. This often precedes a significant market expansion and is interpreted as a bullish volatility regime.
Bearish Crossunder (fastDEVMA < slowDEVMA): This signals that the short-term measure of volatility's chaos is decreasing. The market is settling down or contracting, often leading to trending moves or range consolidation.
⚙️ INPUTS MENU: CONFIGURING YOUR ANALYSIS ENGINE
Every input has been meticulously designed to give you full control over the strategy's behavior. Understanding these settings is key to adapting VoVix+ to your specific instrument, timeframe, and trading style.
🌀 VoVix DEVMA Configuration
🧬 Deviation Lookback: This sets the lookback period for calculating the DEV value. It defines the window for measuring the stability of the VoVix Score. A shorter value makes the system highly reactive to recent changes in volatility's character, ideal for scalping. A longer value provides a smoother, more stable reading, better for identifying major, long-term regime shifts.
⚡ Fast VoVix Length: This is the lookback period for the fastDEVMA. It represents the short-term trend of volatility's chaos. A smaller number will result in a faster, more sensitive signal line that reacts quickly to market shifts.
🐌 Slow VoVix Length: This is the lookback period for the slowDEVMA. It represents the long-term, baseline trend of volatility's chaos. A larger number creates a more stable, slower-moving anchor against which the fast line is compared.
How to Optimize: The relationship between the Fast and Slow lengths is crucial. A wider gap (e.g., 20 and 60) will result in fewer, but potentially more significant, signals. A narrower gap (e.g., 25 and 40) will generate more frequent signals, suitable for more active trading styles.
🧠 Adaptive Intelligence
🧠 Enable Adaptive Features: When enabled, this activates the strategy's performance tracking module. The script will analyze the outcome of its last 50 trades to calculate a dynamic win rate.
⏰ Adaptive Time-Based Exit: If Enable Adaptive Features is on, this allows the strategy to adjust its Maximum Bars in Trade setting based on performance. It learns from the average duration of winning trades. If winning trades tend to be short, it may shorten the time exit to lock in profits. If winners tend to run, it will extend the time exit, allowing trades more room to develop. This helps prevent the strategy from cutting winning trades short or holding losing trades for too long.
⚡ Intelligent Execution
📊 Trade Quantity: A straightforward input that defines the number of contracts or shares for each trade. This is a fixed value for consistent position sizing.
🛡️ Smart Stop Loss: Enables the dynamic stop-loss mechanism.
🎯 Stop Loss ATR Multiplier: Determines the distance of the stop loss from the entry price, calculated as a multiple of the current 14-period ATR. A higher multiplier gives the trade more room to breathe but increases risk per trade. A lower multiplier creates a tighter stop, reducing risk but increasing the chance of being stopped out by normal market noise.
💰 Take Profit ATR Multiplier: Sets the take profit target, also as a multiple of the ATR. A common practice is to set this higher than the Stop Loss multiplier (e.g., a 2:1 or 3:1 reward-to-risk ratio).
🏃 Use Trailing Stop: This is a powerful feature for trend-following. When enabled, instead of a fixed stop loss, the stop will trail behind the price as the trade moves into profit, helping to lock in gains while letting winners run.
🎯 Trail Points & 📏 Trail Offset ATR Multipliers: These control the trailing stop's behavior. Trail Points defines how much profit is needed before the trail activates. Trail Offset defines how far the stop will trail behind the current price. Both are based on ATR, making them fully adaptive to market volatility.
⏰ Maximum Bars in Trade: This is a time-based stop. It forces an exit if a trade has been open for a specified number of bars, preventing positions from being held indefinitely in stagnant markets.
⏰ Session Management
These inputs allow you to confine the strategy's trading activity to specific market hours, which is crucial for day trading instruments that have defined high-volume sessions (e.g., stock market open).
🎨 Visual Effects & Dashboard
These toggles give you complete control over the on-chart visuals and the dashboard. You can disable any element to declutter your chart or focus only on the information that matters most to you.
📊 THE DASHBOARD: YOUR AT-A-GLANCE COMMAND CENTER
The dashboard centralizes all critical information into one compact, easy-to-read panel. It provides a real-time summary of the market state and strategy performance.
🎯 VOVIX ANALYSIS
Fast & Slow: Displays the current numerical values of the fastDEVMA and slowDEVMA. The color indicates their direction: green for rising, red for falling. This lets you see the underlying momentum of each line.
Regime: This is your most important environmental cue. It tells you the market's current state based on the DEVMA relationship. 🚀 EXPANSION (Green) signifies a bullish volatility regime where explosive moves are more likely. ⚛️ CONTRACTION (Purple) signifies a bearish volatility regime, where the market may be consolidating or entering a smoother trend.
Quality: Measures the strength of the last signal based on the magnitude of the DEVMA difference. An ELITE or STRONG signal indicates a high-conviction setup where the crossover had significant force.
PERFORMANCE
Win Rate & Trades: Displays the historical win rate of the strategy from the backtest, along with the total number of closed trades. This provides immediate feedback on the strategy's historical effectiveness on the current chart.
EXECUTION
Trade Qty: Shows your configured position size per trade.
Session: Indicates whether trading is currently OPEN (allowed) or CLOSED based on your session management settings.
POSITION
Position & PnL: Displays your current position (LONG, SHORT, or FLAT) and the real-time Profit or Loss of the open trade.
🧠 ADAPTIVE STATUS
Stop/Profit Mult: In this simplified version, these are placeholders. The primary adaptive feature currently modifies the time-based exit, which is reflected in how long trades are held on the chart.
🎨 THE VISUAL UNIVERSE: DECIPHERING MARKET GEOMETRY
The visuals are not mere decorations; they are geometric representations of the underlying mathematical concepts, designed to give you an intuitive feel for the market's state.
The Core Lines:
FastDEVMA (Green/Maroon Line): The primary signal line. Green when rising, indicating an increase in short-term volatility chaos. Maroon when falling.
SlowDEVMA (Aqua/Orange Line): The baseline. Aqua when rising, indicating a long-term increase in volatility chaos. Orange when falling.
🌊 Morphism Flow (Flowing Lines with Circles):
What it represents: This visualizes the momentum and strength of the fastDEVMA. The width and intensity of the "beam" are proportional to the signal strength.
Interpretation: A thick, steep, and vibrant flow indicates powerful, committed momentum in the current volatility regime. The floating '●' particles represent kinetic energy; more particles suggest stronger underlying force.
📐 Homotopy Paths (Layered Transparent Boxes):
What it represents: These layered boxes are centered between the two DEVMA lines. Their height is determined by the DEV value.
Interpretation: This visualizes the overall "volatility of volatility." Wider boxes indicate a chaotic, unpredictable market. Narrower boxes suggest a more stable, predictable environment.
🧠 Consciousness Field (The Grid):
What it represents: This grid provides a historical lookback at the DEV range.
Interpretation: It maps the recent "consciousness" or character of the market's volatility. A consistently wide grid suggests a prolonged period of chaos, while a narrowing grid can signal a transition to a more stable state.
📏 Functorial Levels (Projected Horizontal Lines):
What it represents: These lines extend from the current fastDEVMA and slowDEVMA values into the future.
Interpretation: Think of these as dynamic support and resistance levels for the volatility structure itself. A crossover becomes more significant if it breaks cleanly through a prior established level.
🌊 Flow Boxes (Spaced Out Boxes):
What it represents: These are compact visual footprints of the current regime, colored green for Expansion and red for Contraction.
Interpretation: They provide a quick, at-a-glance confirmation of the dominant volatility flow, reinforcing the background color.
Background Color:
This provides an immediate, unmistakable indication of the current volatility regime. Light Green for Expansion and Light Aqua/Blue for Contraction, allowing you to assess the market environment in a split second.
📊 BACKTESTING PERFORMANCE REVIEW & ANALYSIS
The following is a factual, transparent review of a backtest conducted using the strategy's default settings on a specific instrument and timeframe. This information is presented for educational purposes to demonstrate how the strategy's mechanics performed over a historical period. It is crucial to understand that these results are historical, apply only to the specific conditions of this test, and are not a guarantee or promise of future performance. Market conditions are dynamic and constantly change.
Test Parameters & Conditions
To ensure the backtest reflects a degree of real-world conditions, the following parameters were used. The goal is to provide a transparent baseline, not an over-optimized or unrealistic scenario.
Instrument: CME E-mini Nasdaq 100 Futures (NQ1!)
Timeframe: 5-Minute Chart
Backtesting Range: March 24, 2024, to July 09, 2024
Initial Capital: $100,000
Commission: $0.62 per contract (A realistic cost for futures trading).
Slippage: 3 ticks per trade (A conservative setting to account for potential price discrepancies between order placement and execution).
Trade Size: 1 contract per trade.
Performance Overview (Historical Data)
The test period generated 465 total trades , providing a statistically significant sample size for analysis, which is well above the recommended minimum of 100 trades for a strategy evaluation.
Profit Factor: The historical Profit Factor was 2.663 . This metric represents the gross profit divided by the gross loss. In this test, it indicates that for every dollar lost, $2.663 was gained.
Percent Profitable: Across all 465 trades, the strategy had a historical win rate of 84.09% . While a high figure, this is a historical artifact of this specific data set and settings, and should not be the sole basis for future expectations.
Risk & Trade Characteristics
Beyond the headline numbers, the following metrics provide deeper insight into the strategy's historical behavior.
Sortino Ratio (Downside Risk): The Sortino Ratio was 6.828 . Unlike the Sharpe Ratio, this metric only measures the volatility of negative returns. A higher value, such as this one, suggests that during this test period, the strategy was highly efficient at managing downside volatility and large losing trades relative to the profits it generated.
Average Trade Duration: A critical characteristic to understand is the strategy's holding period. With an average of only 2 bars per trade , this configuration operates as a very short-term, or scalping-style, system. Winning trades averaged 2 bars, while losing trades averaged 4 bars. This indicates the strategy's logic is designed to capture quick, high-probability moves and exit rapidly, either at a profit target or a stop loss.
Conclusion and Final Disclaimer
This backtest demonstrates one specific application of the VoVix+ framework. It highlights the strategy's behavior as a short-term system that, in this historical test on NQ1!, exhibited a high win rate and effective management of downside risk. Users are strongly encouraged to conduct their own backtests on different instruments, timeframes, and date ranges to understand how the strategy adapts to varying market structures. Past performance is not indicative of future results, and all trading involves significant risk.
🔧 THE DEVELOPMENT PHILOSOPHY: FROM VOLATILITY TO CLARITY
The journey to create VoVix+ began with a simple question: "What drives major market moves?" The answer is often not a change in price direction, but a fundamental shift in market volatility. Standard indicators are reactive to price. We wanted to create a system that was predictive of market state. VoVix+ was designed to go one level deeper—to analyze the behavior, character, and momentum of volatility itself.
The challenge was twofold. First, to create a robust mathematical model to quantify these abstract concepts. This led to the multi-layered analysis of ATR differentials and standard deviations. Second, to make this complex data intuitive and actionable. This drove the creation of the "Visual Universe," where abstract mathematical values are translated into geometric shapes, flows, and fields. The adaptive system was intentionally kept simple and transparent, focusing on a single, impactful parameter (time-based exits) to provide performance feedback without becoming an inscrutable "black box." The result is a tool that is both profoundly deep in its analysis and remarkably clear in its presentation.
⚠️ RISK DISCLAIMER AND BEST PRACTICES
VoVix+ is an advanced analytical tool, not a guarantee of future profits. All financial markets carry inherent risk. The backtesting results shown by the strategy are historical and do not guarantee future performance. This strategy incorporates realistic commission and slippage settings by default, but market conditions can vary. Always practice sound risk management, use position sizes appropriate for your account equity, and never risk more than you can afford to lose. It is recommended to use this strategy as part of a comprehensive trading plan. This was developed specifically for Futures
"The prevailing wisdom is that markets are always right. I take the opposite view. I assume that markets are always wrong. Even if my assumption is occasionally wrong, I use it as a working hypothesis."
— George Soros
— Dskyz, Trade with insight. Trade with anticipation.

[Sniper] SuperTrend + SSL Hybrid + QQE MODHi. I’m DuDu95.
**********************************************************************************
This is the script for the series called "Sniper".
*** What is "Sniper" Series? ***
"Sniper" series is the project that I’m going to start.
In "Sniper" Series, I’m going to "snipe and shoot" the youtuber’s strategy: to find out whether the youtuber’s video about strategy is "true or false".
Specifically, I’m going to do the things below.
1. Implement "Youtuber’s strategy" into pinescript code.
2. Then I will "backtest" and prove whether "the strategy really works" in the specific ticker (e.g. BTCUSDT) for the specific timeframe (e.g. 5m).
3. Based on the backtest result, I will rate and judge whether the youtube video is "true" or "false", and then rate the validity, reliability, robustness, of the strategy. (like a lie detector)
*** What is the purpose of this series? ***
1. To notify whether the strategy really works for the people who watched the youtube video.
2. To find and build my own scalping / day trading strategy that really works.
**********************************************************************************
*** Strategy Description ***
This strategy is from " QQE MOD + supertrend + ssl hybrid" by korean youtuber "코인투데이".
"코인투데이" claimed that this strategy will make you a lot of money in any crypto ticker in 15 minute timeframe.
### Entry Logic
1. Long Entry Logic
- Super Trend Short -> Long
- close > SSL Hybrid baseline upper k
- QQE MOD should be blue
2. Short Entry Logic
- Super Trend Long -> Short
- close < SSL Hybrid baseline lower k
- QQE MOD should be red
### Exit Logic
1. Long Exit Logic
- Super Trend Long -> Short
2. Short Entry Logic
- Super Trend Short -> Long
### StopLoss
1. Can Choose Stop Loss Type: Percent, ATR, Previous Low / High.
2. Can Chosse inputs of each Stop Loss Type.
### Take Profit
1. Can set Risk Reward Ratio for Take Profit.
- To simplify backtest, I erased all other options except RR Ratio.
- You can add Take Profit Logic by adding options in the code.
2. Can set Take Profit Quantity.
### Risk Manangement
1. Can choose whether to use Risk Manangement Logic.
- This controls the Quantity of the Entry.
- e.g. If you want to take 3% risk per trade and stop loss price is 6% below the long entry price,
then 50% of your equity will be used for trade.
2. Can choose How much risk you would take per trade.
### Plot
1. Added Labels to check the data of entry / exit positions.
2. Changed and Added color different from the original one. (green: #02732A, red: #D92332, yellow: #F2E313)
3. SuperTrend and SSL Hybrid Baseline is by default drawn on the chart.
4. If you check EMA filter, EMA would be drawn on the chart.
5. Should add QQE MOD indicator manually if you want to see QQE MOD.
**********************************************************************************
*** Rating: True or False?
### Rating:
→ 3.5 / 5 (0 = Trash, 1 = Bad, 2 = Not Good, 3 = Good, 4 = Great, 5 = Excellent)
### True or False?
→ True but not a 'perfect true'.
→ It did made a small profit on 15 minute timeframe. But it made a profit so it's true.
→ It worked well in longer timeframe. I think super trend works well so I will work on this further.
### Better Option?
→ Use this for Day trading or Swing Trading, not for Scalping. (Bigger Timeframe)
→ Although the result was not good at 15 minute timeframe, it was quite profitable in 1h, 2h, 4h, 8h, 1d timeframe.
→ Crypto like BTC, ETH was ok.
→ The result was better when I use EMA filter.
### Robust?
→ Yes. Although result was super bad in 5m timeframe, backtest result was "consistently" profitable on longer timeframe (when timeframe was bigger than 15m, it was profitable).
→ Also, MDD was good under risk management option on.
**********************************************************************************
*** Conclusion?
→ I recommend you not to use this on short timeframe as the youtuber first mentioned.
→ In my opinion, I can use on longer timeframe like 2h or bigger with EMA filter, stoploss and risk management.

LFT (Low Frequency Trading) StrategyLFT (Low Frequency Trading) Strategy - For Brokers with HIGH FEES.
Hi,
This is a LFT Strategy made for brokers with high fees per trade. It minimizes the amount of signals given by using an algorithm which only enters when the market has satisfied 15 different indications, and a few custom requirements such as VOD. (Volatility on Daily)
Also you should set a 100 point SL.
DO NOT USE THIS IF THE BROKER YOU ARE USING DOES NOT HAVE HIGH FEES - THIS STRATEGY SHOULD ONLY BE USED FOR LARGE SWING TRADING, NOT SCALPING. YOU WILL NOT RECEIVE SMALL SIGNALS, ONLY MAJOR MOVEMENTS.
I will make modifications to the strategy and publish a version which can be used for scalping, only if there is demand.
To get this strategy just comment below and I will grant you access for a while until the next large update.
Use at your own risk, you are increasing your chances at losing money by not following my instructions. USE ONLY FOR HIGH FEE BROKERS.

Multi-Confluence Swing Hunter V1# Multi-Confluence Swing Hunter V1 - Complete Description
Overview
The Multi-Confluence Swing Hunter V1 is a sophisticated low timeframe scalping strategy specifically optimized for MSTR (MicroStrategy) trading. This strategy employs a comprehensive point-based scoring system that combines optimized technical indicators, price action analysis, and reversal pattern recognition to generate precise trading signals on lower timeframes.
Performance Highlight:
In backtesting on MSTR 5-minute charts, this strategy has demonstrated over 200% profit performance, showcasing its effectiveness in capturing rapid price movements and volatility patterns unique to MicroStrategy's trading behavior.
The strategy's parameters have been fine-tuned for MSTR's unique volatility characteristics, though they can be optimized for other high-volatility instruments as well.
## Key Innovation & Originality
This strategy introduces a unique **dual scoring system** approach:
- **Entry Scoring**: Identifies swing bottoms using 13+ different technical criteria
- **Exit Scoring**: Identifies swing tops using inverse criteria for optimal exit timing
Unlike traditional strategies that rely on simple indicator crossovers, this system quantifies market conditions through a weighted scoring mechanism, providing objective, data-driven entry and exit decisions.
## Technical Foundation
### Optimized Indicator Parameters
The strategy utilizes extensively backtested parameters specifically optimized for MSTR's volatility patterns:
**MACD Configuration (3,10,3)**:
- Fast EMA: 3 periods (vs standard 12)
- Slow EMA: 10 periods (vs standard 26)
- Signal Line: 3 periods (vs standard 9)
- **Rationale**: These faster parameters provide earlier signal detection while maintaining reliability, particularly effective for MSTR's rapid price movements and high-frequency volatility
**RSI Configuration (21-period)**:
- Length: 21 periods (vs standard 14)
- Oversold: 30 level
- Extreme Oversold: 25 level
- **Rationale**: The 21-period RSI reduces false signals while still capturing oversold conditions effectively in MSTR's volatile environment
**Parameter Adaptability**: While optimized for MSTR, these parameters can be adjusted for other high-volatility instruments. Faster-moving stocks may benefit from even shorter MACD periods, while less volatile assets might require longer periods for optimal performance.
### Scoring System Methodology
**Entry Score Components (Minimum 13 points required)**:
1. **RSI Signals** (max 5 points):
- RSI < 30: +2 points
- RSI < 25: +2 points
- RSI turning up: +1 point
2. **MACD Signals** (max 8 points):
- MACD below zero: +1 point
- MACD turning up: +2 points
- MACD histogram improving: +2 points
- MACD bullish divergence: +3 points
3. **Price Action** (max 4 points):
- Long lower wick (>50%): +2 points
- Small body (<30%): +1 point
- Bullish close: +1 point
4. **Pattern Recognition** (max 8 points):
- RSI bullish divergence: +4 points
- Quick recovery pattern: +2 points
- Reversal confirmation: +4 points
**Exit Score Components (Minimum 13 points required)**:
Uses inverse criteria to identify swing tops with similar weighting system.
## Risk Management Features
### Position Sizing & Risk Control
- **Single Position Strategy**: 100% equity allocation per trade
- **No Overlapping Positions**: Ensures focused risk management
- **Configurable Risk/Reward**: Default 5:1 ratio optimized for volatile assets
### Stop Loss & Take Profit Logic
- **Dynamic Stop Loss**: Based on recent swing lows with configurable buffer
- **Risk-Based Take Profit**: Calculated using risk/reward ratio
- **Clean Exit Logic**: Prevents conflicting signals
## Default Settings Optimization
### Key Parameters (Optimized for MSTR/Bitcoin-style volatility):
- **Minimum Entry Score**: 13 (ensures high-conviction entries)
- **Minimum Exit Score**: 13 (prevents premature exits)
- **Risk/Reward Ratio**: 5.0 (accounts for volatility)
- **Lower Wick Threshold**: 50% (identifies true hammer patterns)
- **Divergence Lookback**: 8 bars (optimal for swing timeframes)
### Why These Defaults Work for MSTR:
1. **Higher Score Thresholds**: MSTR's volatility requires more confirmation
2. **5:1 Risk/Reward**: Compensates for wider stops needed in volatile markets
3. **Faster MACD**: Captures momentum shifts quickly in fast-moving stocks
4. **21-period RSI**: Reduces noise while maintaining sensitivity
## Visual Features
### Score Display System
- **Green Labels**: Entry scores ≥10 points (below bars)
- **Red Labels**: Exit scores ≥10 points (above bars)
- **Large Triangles**: Actual trade entries/exits
- **Small Triangles**: Reversal pattern confirmations
### Chart Cleanliness
- Indicators plotted in separate panes (MACD, RSI)
- TP/SL levels shown only during active positions
- Clear trade markers distinguish signals from actual trades
## Backtesting Specifications
### Realistic Trading Conditions
- **Commission**: 0.1% per trade
- **Slippage**: 3 points
- **Initial Capital**: $1,000
- **Account Type**: Cash (no margin)
### Sample Size Considerations
- Strategy designed for 100+ trade sample sizes
- Recommended timeframes: 4H, 1D for swing trading
- Optimal for trending/volatile markets
## Strategy Limitations & Considerations
### Market Conditions
- **Best Performance**: Trending markets with clear swings
- **Reduced Effectiveness**: Highly choppy, sideways markets
- **Volatility Dependency**: Optimized for moderate to high volatility assets
### Risk Warnings
- **High Allocation**: 100% position sizing increases risk
- **No Diversification**: Single position strategy
- **Backtesting Limitation**: Past performance doesn't guarantee future results
## Usage Guidelines
### Recommended Assets & Timeframes
- **Primary Target**: MSTR (MicroStrategy) - 5min to 15min timeframes
- **Secondary Targets**: High-volatility stocks (TSLA, NVDA, COIN, etc.)
- **Crypto Markets**: Bitcoin, Ethereum (with parameter adjustments)
- **Timeframe Optimization**: 1min-15min for scalping, 30min-1H for swing scalping
### Timeframe Recommendations
- **Primary Scalping**: 5-minute and 15-minute charts
- **Active Monitoring**: 1-minute for precise entries
- **Swing Scalping**: 30-minute to 1-hour timeframes
- **Avoid**: Sub-1-minute (excessive noise) and above 4-hour (reduces scalping opportunities)
## Technical Requirements
- **Pine Script Version**: v6
- **Overlay**: Yes (plots on price chart)
- **Additional Panes**: MACD and RSI indicators
- **Real-time Compatibility**: Confirmed bar signals only
## Customization Options
All parameters are fully customizable through inputs:
- Indicator lengths and levels
- Scoring thresholds
- Risk management settings
- Visual display preferences
- Date range filtering
## Conclusion
This scalping strategy represents a comprehensive approach to low timeframe trading that combines multiple technical analysis methods into a cohesive, quantified system specifically optimized for MSTR's unique volatility characteristics. The optimized parameters and scoring methodology provide a systematic way to identify high-probability scalping setups while managing risk effectively in fast-moving markets.
The strategy's strength lies in its objective, multi-criteria approach that removes emotional decision-making from scalping while maintaining the flexibility to adapt to different instruments through parameter optimization. While designed for MSTR, the underlying methodology can be fine-tuned for other high-volatility assets across various markets.
**Important Disclaimer**: This strategy is designed for experienced scalpers and is optimized for MSTR trading. The high-frequency nature of scalping involves significant risk. Past performance does not guarantee future results. Always conduct your own analysis, consider your risk tolerance, and be aware of commission/slippage costs that can significantly impact scalping profitability.

Destroyer LifeDestroyer Life Strategy - High-Frequency Long & Short Trading
Overview:
The Destroyer Life strategy is an advanced cryptocurrency trading algorithm designed for high-frequency execution on the 15-second timeframe. It combines CRT (Candle Range Trend) and Turtle Soup trading logic with multi-timeframe analysis to optimize entries and exits for both long and short trades. This strategy is specifically optimized for high-volatility crypto pairs, such as SOL/USD on MEXC, ensuring precise execution with minimal drawdown.
Key Features:
15-Second Timeframe Execution: Optimized for ultra-short-term trading.
Long & Short Strategy: Simultaneously identifies profitable buy and sell opportunities.
CRT & Turtle Soup Logic: Leverages price action patterns for enhanced trade accuracy.
Higher Timeframe Analysis (HTF): Incorporates liquidity zones, fair value gaps (FVG), and breaker blocks for context-aware trading.
Dynamic Position Sizing: Uses an adjustable leverage multiplier for risk-controlled trade sizing.
Commission Optimization: Ensures profitability even with trading fees.
Strict Risk Management: Implements exit conditions based on liquidity structure and trend reversals.
Strategy Performance (Backtested on SOL/USD - MEXC):
Overall Profitability: ~80% win rate in backtesting.
Net Profit: $3,151.12 (6.30% ROI).
Gross Profit: $3,795.68 (7.59%).
Gross Loss: $644.56 (1.29%).
Long Trades Profit: $1,459.05 (2.92%).
Short Trades Profit: $1,692.07 (3.38%).
Commission Paid: $924.82.
Minimum Trade Holding Period: 1-minute cooldown between trades.
Trading Logic:
Entry Conditions:
Long Trades: Triggered when the price enters a liquidity void and aligns with higher timeframe bullish bias.
Short Trades: Triggered when price approaches a resistance level with bearish higher timeframe confluence.
CRT & Turtle Soup Patterns: Identifies reversals by analyzing breakout and fake-out structures.
Exit Conditions:
Long Positions Close: Upon price exceeding a 3.88% profit threshold or reversing below an HTF structure.
Short Positions Close: Upon reaching a similar 3.88% threshold or showing strong bullish signals.
Dynamic Position Sizing:
Uses a leverage-based calculation that adapts trade size based on volatility.
Liquidity Awareness:
Tracks Mitigation Blocks (MB), Fair Value Gaps (FVG), Buy/Sell-Side Liquidity (BSL/SSL) to determine optimal execution.
Best Use Cases:
Scalpers & High-Frequency Traders: Those looking for rapid trade execution with short holding periods.
Crypto Traders Focused on Low Timeframes: Optimized for 15-second price action.
Traders Utilizing Liquidity Concepts: Built to exploit liquidity traps and inefficiencies.
Risks & Considerations:
High-Frequency Execution Requires Low Latency: Ensure your broker or exchange supports fast order execution.
Backtested Results May Vary: Real-time performance depends on market conditions.
Commission & Fees Impact Profits: Consider exchanges with low fees to maximize strategy efficiency.
Final Thoughts:
The Destroyer Life Strategy is designed for serious traders looking to take advantage of high-volatility markets with a structured, liquidity-based approach. By combining price action, liquidity concepts, and adaptive risk management, it provides a solid framework for executing high-probability trades on crypto markets.
🚀 Ready to take your trading to the next level? Try Destroyer Life today and dominate the markets!
