Session Opens by TradeSeekersIt doesn't get much simpler than this indicator for futures traders wanting to track four key session open prices.
Sessions
1. ETH open - extended hours starts
2. Midnight open - new calendar day starts
3. CME open - Chicago exchange opens, data releases
4. RTH open - regular trading hours, volume cometh
Usage
All four of these prices / areas are important for futures traders to pay attention to.
RTH opens far below ETH sometimes will retrace, CME and RTH together can act as a powerful range.
Midnight open sometimes has little importance for the day, but then again it's provided beautiful bounces. Again each level I find to be impactful nearly every session, so I like to keep them close by in an understated manner.
Timezone
If you're not EST, adjust the timezone string accordingly (refer to TradingView docs for string formats).
Proximity Detection
Also, I added proximity detection that aims to keep level collisions from occurring. If a particular session open isn't shown it may be due to being exactly the same price as another open or it's too close to another open.
The proximity sensitivity can be adjusted in settings. The on chart appearance doesn't impact the alerting capability.
Aesthetics
I don't like boring charts so I added a fun "glow" effect, I went with a palette that reminded me of clear sky colors at those times of day (if you're EST).
Alerting
Alerting can be done with just a single alert, first open the indicator config and uncheck any session opens you don't want to be alerted on (why!?), and then use the standard alert menus in TradingView to set the alert on "Any alert() function call".
Why does this beautiful indicator exist?
While there are a handful of indicators that plot open prices with some overlap to this one, I didn't see any that alerted automatically without much fuss.
Search in scripts for "session"

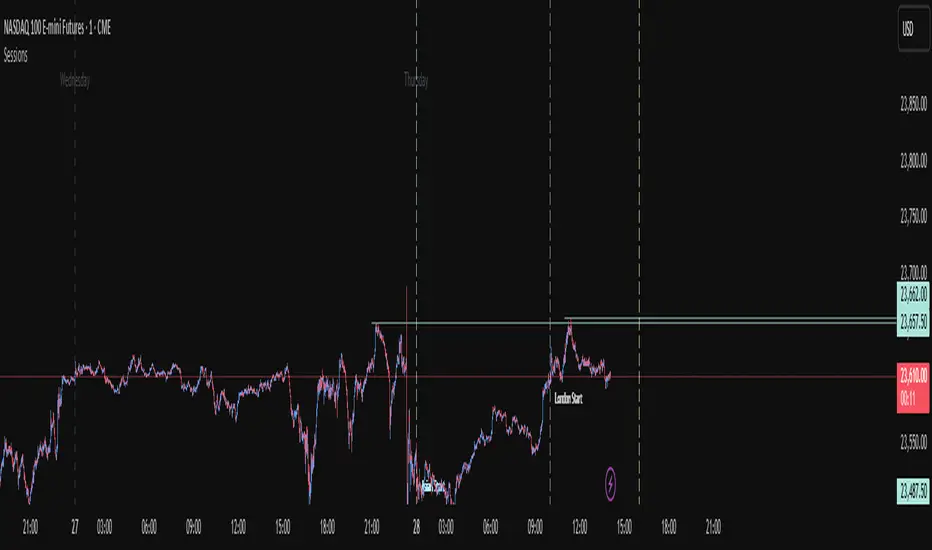
Sessions+Days Marker (SigmaSita)An indicator that marks the sessions and days. You can adjust session start times. Sessions are Asian, London and New York.
Session Shading (Asia, London, NY)This indicator highlights the three major trading sessions — Asia, London, and New York — on your chart in any time zone. Each session is shaded a different color, with optional labels marking when each begins. It’s designed to help traders quickly see when global market centers are active, identify overlaps between sessions, and align entries or exits with periods of higher liquidity and volatility.

Session Shading (Asia, London, NY) — ESTThis indicator highlights the three major trading sessions — Asia, London, and New York — on your chart in Eastern Time. Each session is shaded a different color, with optional labels marking when each begins. It’s designed to help traders quickly see when global market centers are active, identify overlaps between sessions, and align entries or exits with periods of higher liquidity and volatility.
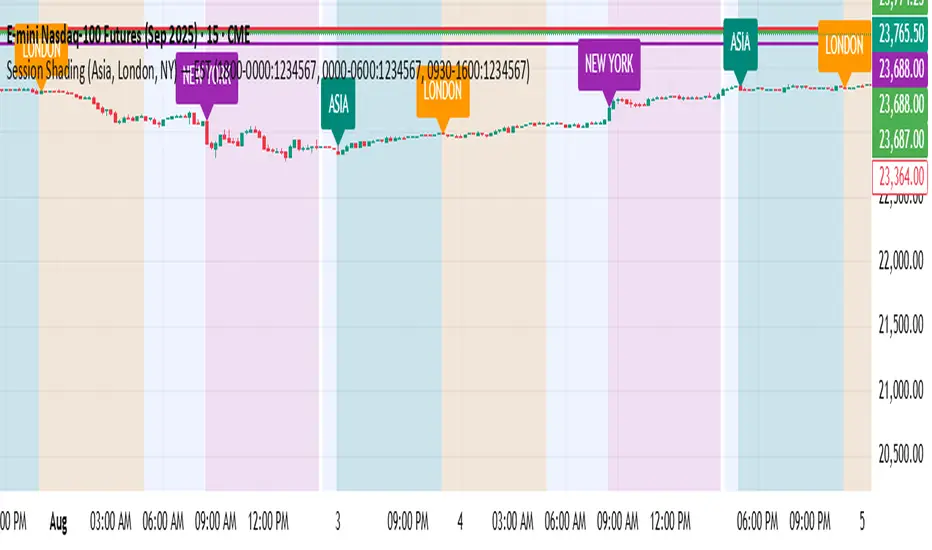
Session Shading (Asia, London, NY) — PSTThis indicator highlights the three major trading sessions — Asia, London, and New York — on your chart in Pacific Time. Each session is shaded a different color, with optional labels marking when each begins. It’s designed to help traders quickly see when global market centers are active, identify overlaps between sessions, and align entries or exits with periods of higher liquidity and volatility.

Session Breakout Scalper Trading BotHi Traders !
Introduction:
I have recently been exploring the world of automated algorithmic trading (as I prefer more objective trading strategies over subjective technical analysis (TA)) and would like to share one of my automation compatible (PineConnecter compatible) scripts “Session Breakout Scalper”.
The strategy is really simple and is based on time conditional breakouts although has more ”relatively” advanced optional features such as the regime indicators (Regime Filters) that attempt to filter out noise by adding more confluence states and the ATR multiple SL that takes into account volatility to mitigate the down side risk of the trade.
What is Algorthmic Trading:
Firstly what is algorithmic trading? Algorithmic trading also known as algo-trading, is a method of using computer programs (in this case pine script) to execute trades based on predetermined rules and instructions (this trading strategy). It's like having a robot trader who follows a strict set of commands to buy and sell assets automatically, without any human intervention.
Important Note:
For Algorithmic trading the strategy will require you having an essential TV subscription at the minimum (so that you can set alerts) plus a PineConnecter subscription (scroll down to the .”How does the strategy send signals” headings to read more)
The Strategy Explained:
Is the Time input true ? (this can be changed by toggling times under the “TRADE MEDIAN TIMES” group for user inputs).
Given the above is true the strategy waits x bars after the session and then calculates the highest high (HH) to lowest low (LL) range. For this box to form, the user defined amount of bars must print after the session. The box is symmetrical meaning the HH and LL are calculated over a lookback that is equal to the sum of user defined bars before and after the session (+ 1).
The Strategy then simultaneously defines the HH as the buy level (green line) and the LL as the sell level (red line). note the strategy will set stop orders at these levels respectively.
Enter a buy if price action crosses above the HH, and then cancel the sell order type (The opposite is true for a stop order).
If the momentum based regime filters are true the strategy will check for the regime / regimes to be true, if the regime if false the strategy will exit the current trade, as the regime filter has predicted a slowing / reversal of momentum.
The image below shows the strategy executing these trading rules ( Regime filters, "Trades on chart", "Signal & Label" and "Quantity" have been omitted. "Strategy label plots" has been switched to true)
Other Strategy Rules:
If a new session (time session which is user defined) is true (blue vertical line) and the strategy is currently still in a trade it will exit that trade immediately.
It is possible to also set a range of percentage gain per day that the strategy will try to acquire, if at any point the strategy’s profit is within the percentage range then the position / trade will be exited immediately (This can be changed in the “PERCENT DAY GAIN” group for user inputs)
Stops and Targets:
The strategy has either static (fixed) or variable SL options. TP however is only static. The “STRAT TP & TP” group of user inputs is responsible for the SL and TP values (quoted in pips). Note once the ATR stop is set to true the SL values in the above group no longer have any affect on the SL as expected.
What are the Regime Filters:
The Larry Williams Large Trade Index (LWLTI): The Larry Williams Large Trade Index (LWTI) is a momentum-based technical indicator developed by iconic trader Larry Williams. It identifies potential entries and exits for trades by gauging market sentiment, particularly the buying and selling pressure from large market players. Here's a breakdown of the LWTI:
LWLTI components and their interpretation:
Oscillator: It oscillates between 0 and 100, with 50 acting as the neutral line.
Sentiment Meter: Values above 75 suggest a bearish market dominated by large selling, while readings below 25 indicate a bullish market with strong buying from large players.
Trend Confirmation: Crossing above 75 during an uptrend and below 25 during a downtrend confirms the trend's continuation.
The Andean Oscillator (AO) : The Andean Oscillator is a trend and momentum based indicator designed to measure the degree of variations within individual uptrends and downtrends in the prices.
Regime Filter States:
In trading, a regime filter is a tool used to identify the current state or "regime" of the market.
These Regime filters are integrated within the trading strategy to attempt to lower risk (equity volatility and/or draw down). The regime filters have different states for each market order type (buy and sell). When the regime filters are set to true, if these regime states fail to be true the trade is exited immediately.
For Buy Trades:
LWLTI positive momentum state: Quotient of the lagged trailing difference and the ATR > 50
AO positive momentum state: Bull line > Bear line (signal line is omitted)
For Sell Trades:
LWLTI negative momentum stat: Quotient of the lagged trailing difference and the ATR < 50
AO negative momentum state: Bull line < Bear line (signal line is omitted)
How does the Strategy Send Signals:
The strategy triggers a TV alert (you will neet to set a alert first), TV then sends a HTTP request to the automation software (PineConnecter) which receives the request and then communicates to an MT4/5 EA to automate the trading strategy.
For the strategy to send signals you must have the following
At least a TV essential subscription
This Script added to your chart
A PineConnecter account, which is paid and not free. This will provide you with the expert advisor that executes trades based on these strategies signals.
For more detailed information on the automation process I would recommend you read the PineConnecter documentation and FAQ page.
Dashboard:
This Dashboard (top right by defualt) lists some simple trading statistics and also shows when a trade is live.
Important Notice:
- USE THIS STRATEGY AT YOUR OWN RISK AND ALWAYS DO YOUR OWN RESEARCH & MANUAL BACKTESTING !
- THE STRATEGY WILL NOT EXHIBIT THE BACKTEST PERFORMANCE SEEN BELOW IN ALL MARKETS !

Session barsthis script marks off the extended hours trading for NY session. Shades the off hours and overnight data. Highlights the regular trading session for NY session. It can be adjusted for any particular market.
I use it specifically to show the missing data on the SPY as compared with the continuous data on the SPX500.

Session Volume Spike Detector (MTF Arrows)Overview
The Session Volume Spike Detector is a precision multi-timeframe (MTF) tool that identifies sudden surges in buy or sell volume during key market windows. It highlights high-impact institutional participation by comparing current volume against its historical baseline and short-term highs, then plots directional markers on your chart.
This version adds MTF awareness, showing spikes from 1-minute, 5-minute, and 10-minute frames on a single chart. It’s ideal for traders monitoring microstructure shifts across multiple time compressions while staying on a fast chart (like 1-second or 1-minute).
Key Features
Dual Session Windows (DST-aware)
Automatically tracks Morning (05:30–08:30 MT) and Midday (11:00–13:30 MT) activity, adjusted for daylight savings.
Directional Spike Detection
Flags Buy spikes (green triangles) and Sell spikes (magenta triangles) using dynamic volume gates, Z-Score normalization, and recent-bar jump filters.
Multi-Timeframe Projection
Displays higher-timeframe (1m / 5m / 10m) spikes directly on your active chart for continuous visual context — even on sub-minute intervals.
Adaptive Volume Logic
Each spike is validated against:
Volume ≥ SMA × multiplier
Volume ≥ recent-high × jump factor
Optional Z-Score threshold for statistical significance
Session-Only Filtering
Ensures spikes are only plotted within specified trading sessions — ideal for futures or intraday equity traders.
Configurable Alerts
Built-in alert conditions for:
Any timeframe (MTF aggregate)
Individual 1m, 5m, or 10m windows
Alerts trigger only when a new qualifying spike appears at the close of its bar.
Use Cases
Detect algorithmic or institutional activity bursts inside your trading window.
Track confluence of volume surges across multiple timeframes.
Combine with FVGs, bank levels, or range breakouts to identify probable continuation or reversal zones.
Build custom automation or alert workflows around statistically unusual participation spikes.
Recommended Settings
Use on 1-minute chart for full MTF display.
Adjust the SMA length (default 20) and Z-Score threshold (default 3.0) to suit market volatility.
For scalping or high-frequency environments, disable the 10m layer to reduce visual clutter.
Credits
Developed by Jason Hyde
© 2025 — All rights reserved.
Designed for clarity, precision, and MTF-synchronized institutional volume detection.
Intraday Sessions Ranges with Time SegmentationSession Ranges indicator overlays customizable range boxes on major trading sessions (e.g. London, Premarket, NY AM and NY PM) using New York time.
Toggle visibility, add evenly spaced vertical segment lines, and highlight key time zones. Perfect for traders marking price action and levels across multiple historical days.

session high and low (only for current day) -HITHVEERits about session highs and lows and only for the current day and main sessions are asia london and newyork

Session Highs and LowsShows the current and previous session highs and lows for the New York, London and Asian sessions

Sessions by SHARK [Kyiv Time]Why Forex Sessions Matter
First of all, it is very convenient for a trader to structure their working hours. The best times to open positions are during the London Kill Zone (KZ) and New York Kill Zone (KZ). Based on what happens within each session, you can build your future analysis while considering the overall context.
We must understand that there are specific times of the day that are more or less volatile. Knowing this will help you determine when you should be looking for trade setups and when you should avoid them.
Trading outside of the Kill Zones can lead to holding positions for too long because market liquidity decreases, which in turn leads to lower volatility.

Session Start & Day BackgroundThis indicator visually enhances your TradingView charts by highlighting the start of each new trading day and coloring the background based on the day of the week.
The first candle of each new trading day is marked in gray for better session separation.
The background color changes based on the current day of the week, making it easier to recognize market patterns and trends at a glance.
Works across all markets including Forex, Stocks, and Crypto.
Designed to improve chart readability and market structure visualization.
Ideal for traders who want a clearer overview of daily sessions and better differentiation between trading days! 🚀

Sessions by Aegean This script has the full 8 hours for the 3 major sessions and 1 hour for the Frankfurt, Germany session

Trading Sessions v.2 - Max WarrenUpdated to work with Pine updates:
London DST timezone still broken. Will fix later.
As always full customization visually, with London fix I'll add more options.
Keep in mind the render resolution option

Session 30 Second OR DeviationsThis indicator will plot the -4, -6, and -8 levels in color coded fashion based on session. We look for price reactions at these levels. It will plot the Asia session first 30 second candle, same with London, and New York.
Session High and Low IndicatorThis script is meant for stocks that have a pre-market session. It is meant to be used on the 1 min time frame. This script will draw a green line at the high of pre-market, and a red line at the low of pre-market and extend these lines across the regular session day
This makes it easy to see if price action during regular market has broken above pre-market high or broken below pre-market low.
The high/low skips any quick spikes in price action (similar to what happens at 8:30 am every day).

Session HeatmapIntraday Seasonality
Overview
Analyzes historical patterns by time of day. Identifies when volatility, volume, and open interest changes tend to be highest or lowest.
Features
Multiple Metrics: TR (volatility), Volume, and Open Interest changes
Flexible Grouping: View patterns by weekday or month to spot day-of-week or seasonal effects
Heatmap Visualization: Blue (low) to Red (high) color scale for quick pattern recognition
Percentile Mode: Reduces outlier impact by using 5th-95th percentile range
Timezone Support: Display in UTC alongside your local time
Metrics Explained
TR: Volatility - when markets move most
Volume: Liquidity - when participation is highest
OI Increase: When new positions are opened
OI Decrease: When positions are closed
OI Net: Net open interest change
Usage
Set your timezone and preferred slot size (30min/1H)
Choose a date range (relative or custom)
Select a metric to analyze
Use "Group By" to see weekday or monthly patterns
Switch to Percentile color scale if outliers dominate
Notes
Chart timeframe should be equal to or smaller than Slot Size
OI metrics require Binance Perpetual symbols
DST is not automatically adjusted; consider seasonal shifts for US/EU sessions

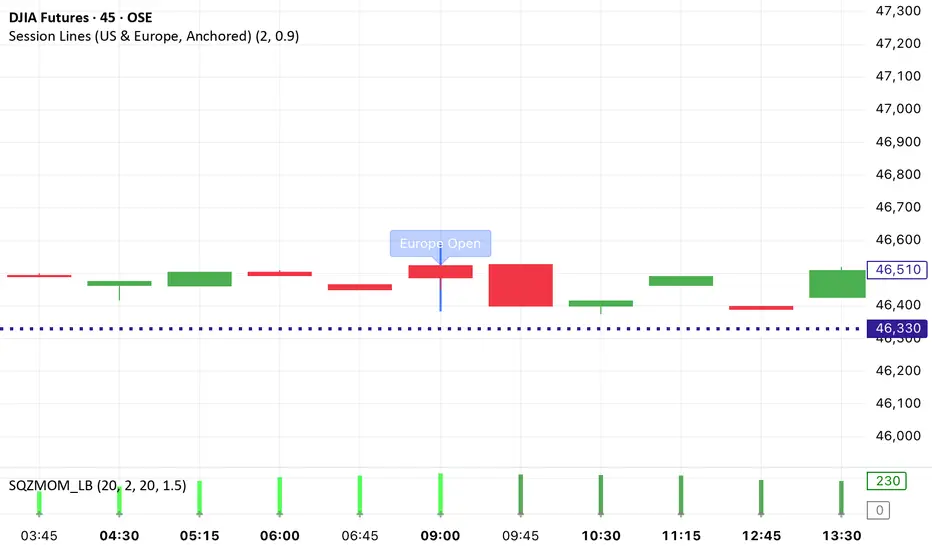
Session Lines (US & Europe, Anchored and Adaptive)A sleek indicator that marks the London (blue) and New York (red) trading sessions with perfectly aligned vertical lines both open and close times.
Lines automatically scale with your chart, adapt to any timeframe, and fade smoothly on higher intervals to keep your layout clean and professional.

Session VolumeThis script tracks and displays 30-minute volume segments during the Regular Trading Hours (RTH) session. It allows traders to visually compare each time block’s volume today vs. the same block from the previous day, helping spot early signs of strength, weakness, or divergence.
Features:
Tracks 13 blocks from 9:30 AM to 4:15 PM ET.
Compares today's volume against historical volume from the same time block yesterday.
Highlights percentage changes per block.
Summary row totals show overall volume trend today vs. yesterday.
This tool is useful for discretionary traders, auction market theorists, and anyone who incorporates market-generated information into their decision-making.

