Pine Script® indicator
Search in scripts for "session"
Pine Script® indicator

ICT Time-based Liquidity SessionsThis indicator plots the three primary index futures sessions (Asia, London, New York) using fixed Eastern Time windows to help traders visually track where liquidity is most likely to build and be attacked. The goal is not to mark exchange business hours, but to highlight behavioral time blocks where sweeps, displacement, and HTF inefficiency reactions statistically occur more often.
Session Windows (ET):
Asia: 18:00 – 03:00
Range construction, slower movement, sets highs/lows often targeted later.
London: 03:00 – 12:00
Increased volatility, frequent raids on Asia range, early displacement.
New York AM: 09:30 – 12:00
Highest probability window for liquidity sweeps, HTF FVG reactions, and expansion.
New York PM: 12:00 – 16:00
Secondary continuation or controlled reversals, generally lower volatility than AM.
Purpose
Visualize session ranges and transitions.
Identify likely sweep zones (Asia High/Low, London High/Low).
Align entries with time-of-day confluence instead of price alone.
Reduce noise by keeping session boxes clean while mentally noting overlaps (especially London–NY).
Use Case
Designed for equity index futures (NQ, ES, YM). Best paired with liquidity levels, HTF inefficiencies, and displacement/FVG models to improve timing and context rather than act as a standalone signal.
Pine Script® indicator

Range Multi-jour Double - SessionEnglish:
Allows you to display the daily highs and lows for two specific sessions, along with the RSI shown as a numerical value at the top. This lets you see at a glance if it's overbought or oversold (turning red). It provides an OPR for both the London and NY sessions in a single indicator.
Français:
Permet d'avoir le plus haut et le plus bas de 2 sessions pour chaque journée + le RSI afficher en haut en chiffre pour voir en un coup d'oeil s'il est en surachat ou en survente, il devient rouge. Ca permet d'avoir un OPR pour la session de londre et de NY en 1 indicateur.
Pine Script® indicator

Session High/LowSession High Low
Trading Sessions
Forex Sessions (oder Futures Sessions, je nachdem, was du handelst)
Pine Script Indicator
Intraday Levels
Market Sessions
High Low Lines
Day Trading Tools
Pine Script® indicator

Aude - Minimal Session IndicatorMinimal Session Indicator
- The indicator allows users to highlight specific sessions (time range) on the chart.
- There are options to change the visual settings of the session box (BG color, Border color, Border style).
- Max 500 sessions drawn
Pine Script® indicator

Session Volume Spike DetectorSession Volume Spike Detector (Buy/Sell, Dual Windows, MTF + Edge/Cooldown)
What it does
Detects statistically significant buy/sell volume spikes inside two DST-aware Mountain Time sessions and projects 1m / 5m / 10m signals onto any chart timeframe (even 1s). Spikes are confirmed at the close of their native bar and are edge-triggered with optional cooldowns to prevent duplicate alerts.
How spikes are detected
Volume ≥ SMA × multiplier
Optional jump vs recent highest volume
Optional Z-Score gate for significance
Separate Buy/Sell logic using your Direction Mode (Prev Close or Candle Body)
Multi-Timeframe (MTF) display
Shows 1m, 5m, 10m arrows on your current chart
Each HTF fires once on its bar close (no repaint after close)
Sessions (DST-aware, MT)
Morning: 05:30–08:30
Midday: 11:00–13:30
Spikes only count inside these windows.
Inputs & styling
Thresholds: SMA length, multipliers, recent lookback, Z-Score toggle/level
Toggles for which TFs to display (chart TF, 1m, 5m, 10m)
Per-TF colors + cooldowns (seconds) for Any TF, 1m, 5m, 10m
Alerts (edge + cooldown)
MTF Volume Spike (Any TF) — fires on the first qualifying spike across enabled TFs
1m / 5m / 10m Volume Spike — per-TF alerts, Buy or Sell
Recommended: set alert Trigger = Once per bar close. Cooldowns tame “triggered too often” warnings.
Great with
FVG zones, bank/insto levels, session range breaks, and trend filters. Use the MTF arrows as a participation/pressure tell to confirm or fade moves.
Notes
Works on any symbol/timeframe; best viewed on 1m or sub-minute charts.
HTF spikes appear on the bar close of 1m/5m/10m respectively.
No dynamic plot titles; Pine v6-safe.
Short summary (≤250 chars):
MTF volume-spike detector for intraday sessions (DST-aware, MT). Projects 1m/5m/10m buy/sell spikes onto any chart, with edge-triggered alerts and per-TF cooldowns to prevent duplicates. Ideal for spotting institutional participation.
Pine Script® indicator

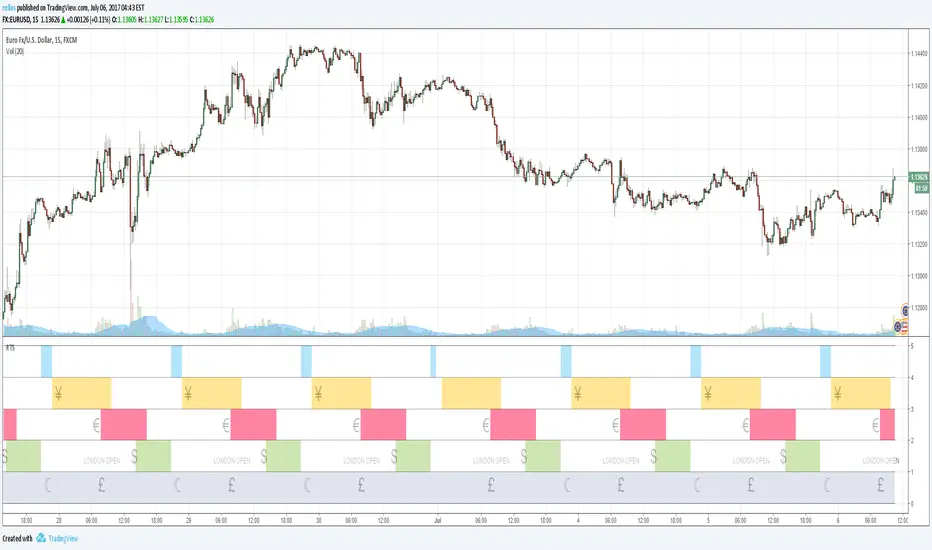
Watermark with Session Boxes (by Rufi)Watermark & Session Boxes - Chart Branding Tool
What it does: Combines professional chart watermarking with automated trading session visualization for clean, branded analysis.
Key Features:
Smart Session Boxes: Auto-draws boxes around Asia (8PM-11:59PM), London (2AM-5AM), and NY (7AM-10AM) sessions using high/low detection
Custom Watermark: Professional text overlay with your brand/tagline
Full Customization: Adjustable colors, transparency (0-100%), and display limits (1-30 days)
How it works: Uses Pine Script's time() function to detect session periods, tracks price extremes during each session, then draws filled rectangles from session high to low. Perfect for identifying key support/resistance levels from major trading periods.
Best for: Intraday traders who want branded charts with clear session-based S/R levels. Ideal for forex, indices, and crypto on lower timeframes.
Pine Script® indicator

Key Levels & Session Highs/Lows by OdegosProfessional multi-timeframe support and resistance level indicator that automatically tracks and displays key price levels across different trading sessions and timeframes.
🎯 What it shows:
Session Open - Daily market open reference line
Asia & London Sessions - High/low levels from major trading sessions
Previous Day - Yesterday's actual high and low levels
Weekly & Monthly - Higher timeframe support/resistance levels
⚡ Smart Features:
Auto-combines overlapping levels with merged labels
Break detection - Lines stop when price breaks through (optional)
Timezone support - Works with any global timezone
Universal colors - Optimized for both light and dark chart themes
Clean interface - Organized settings with intuitive dropdowns
🛠️ Fully Customizable:
Individual show/hide toggles for each level type
Custom colors, line styles, and widths
Adjustable label text and positioning
Global text color override option
Perfect for day traders, swing traders, and anyone who relies on key support/resistance levels for market analysis.
Pine Script® indicator

30 Second Futures Session Open RangeThis indicator displays 30 second opening ranges from Globex, Europe, and RTH sessions.
From the RTH session range, it also displays infinitely generating Price Targets based on a % of the opening range size.
I am retrieving the 30 second data using the new "request.security_lower_tf()" function.
The importance of these levels is based on the idea that when the market opens, algorithms establish their positions within the first 30 seconds.
These areas can also be seen as potential areas of support and resistance throughout the sessions.
Enjoy!
Pine Script® indicator

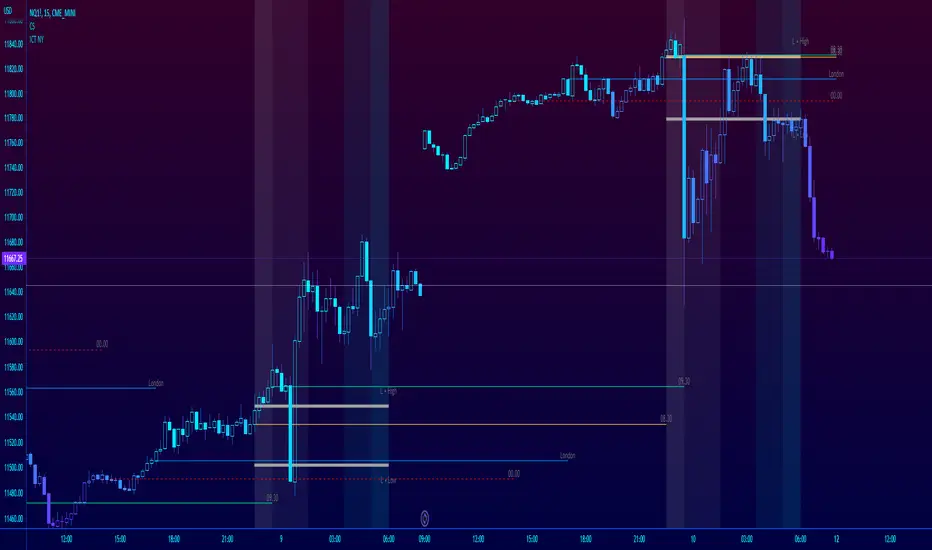
ICT NY Futures Indices Session Model - YT New York MentorshipThis indicator plots out the time periods and open lines as outlined in ICT's 2022 Mentorship and is designed specifically for the New York futures trading session.
Time zone is set to GMT-4 (NY) by default but can be changed for accommodate daylight saving in the menu.
Please note this indicator is to be used only on the 30min timeframe and below.
Here are its features:
The background color shows the morning session, in two parts (8.30am to 9.30am and 9.30am to 11.30am), then a two hour gap for lunch (ICT calls this "Dead time") and finally, the afternoon session, also to two (1.30pm to 3pm and 3pm to 4pm).
It not only shows the current killzones, but future zones as well.
These times are important; trades can be framed within these zones as taught in the mentorship.
Next are the open lines. These lines are automatically plotted and can be areas for price to react off of; they are the opening price of a candle at these times:
00.00 (New York Midnight, also known as "True Day Open")
8.30am (New York Equities pre-open)
9.30am (New York Equities open)
2.00am (London Stock Exchange open)
And lastly, London's trading session High and Low are projected forward onto the New York trading session.
These two price points are areas of liquidity that were pooled during London, but they can also often set the high or low of the day.
Please let me know if there are any bugs or if you have suggestions for the next update.
Pine Script® indicator
FX Sessions - All in OneFX Sessions - All In One
This Script offer a wide variety of goodies
SESSION OPEN
it will draw a line for the TOP, MID and LOW of the asian session (you can adjust the hours of the session)
It will draw a line for the TOP and LOW of the London Session (you can adjust the hours of the session)
It will draw a line for the TOP and LOW of the NY Session (you can adjust the hours of the session)
SEPARATORS
while on lower timeframe, you will have a separator for days that occurs at midnight NY time
While on Daily timeframe, you will have a separator that will separate every month, on the 1st trading day of that given month
IMBALANCE
The candle leaving imbalance (a candle where there is a portion that is not matched with a price action left or right)
NY Midnight opening price
a dotted line will be drawn (up to 500 bar limitation) from NY open until it reaches either the 500 bar or the end of the day.
on lower timeframe (below 3 minutes) the bar will not reach the end of the day
Pine Script® indicator

Trademinator Forex Sessions"Trademinator Forex Sessions" displays overlapping colored boxes on the chart delimited by the opening and closing times of the specific exchange on the horizontal axis, and the maximum and minimum trading prices on the vertical axis, respectively. It also displays the exchange name on top of the candle corresponding to the opening time for each exchange.
Sessions can be enabled or disabled on the chart for each individual exchange through the "Inputs" tab of the "Settings" dialog box of the indicator. The exchange names can also be enabled or disabled in the same tab.
The included exchange sessions in sequential opening order are:
1- Sydney
2- Tokio
3- Frankfurt
4- London
5- New York
And additional session is included to account for the 2 hour timespan between the New York close and the Sydney open, when all exchanges are closed but still there is someone out there trading the Forex. I don't need to nominate you, since by now you already know who you are.
A future release of the indicator is planned to automatically adjust the opening and closing times of each exchange by the Daylight Saving Time.
Pine Script® indicator

Crypto / Fx SessionsTrading sessions for crypto markets - the major time segments: London, NYC, Beijing. Times are set in UTC.
Quick experiment for now, may be edited.
More granular data around session breaks for these time zones at www.altcointrading.net or as CSVs daily updated on Keybase keybase.pub
Pine Script® indicator

Sakalau02 Weekly Daily SessionsSakalau02: Weekly Daily Sessions – The Architecture of the Trading Week
The "Sakalau02 Weekly Daily Sessions" is a high-definition visual mapping tool designed to dissect the trading week into distinct daily blocks. More than just a period separator, this script defines the "field of play" for each day, allowing you to visualize where liquidity builds and how price interacts with temporal boundaries.
Here is why this script is the cornerstone of a professional Top-Down analysis:
📅 High-Definition Daily Structure
The indicator transforms your chart into a logical map of the week, providing visual support for all 7 days, with a focus on active trading from Monday to Friday.
Visual Identity: Each day is assigned its own unique color, helping you instantly recognize repetitive market signatures (like the "Tuesday Reversal" or "Mid-week Expansion").
Timezone Precision: Featuring a dedicated Timezone Input, the script ensures that daily boxes open exactly at 00:00 according to your chosen financial hub (UTC, New York, London, etc.).
📐 Range and Liquidity Analysis
Through its Dynamic Box System, the script monitors price evolution in real-time:
High/Low Tracking: Automatically expands the box boundaries as price carves out new daily highs or lows.
The 0.5 Level (Daily Equilibrium): Automatically calculates the midpoint of the entire day. This is the critical "Fair Value" zone where price decides whether to trend or mean-revert.
Open/Close Trajectory: A discreet line tracks price relative to the daily open, providing an instant read on the intraday bias (Bullish/Bearish).
⚡ Precision Alert System
Never miss a structural shift. The indicator comes equipped with built-in alerts for:
Session Starts: Be notified the moment a new daily cycle begins.
Liquidity Sweeps (New High/Low): Receive alerts the second price breaches the current day’s high or low—perfect for executing Judas Swings or Expansion setups.
💎 Versatile Display Modes
Boxes Mode: Encapsulates price for a clear view of market structure.
Zones Mode: Highlights the background for a cleaner integration with secondary indicators.
Timeline Mode: Marks the base of the chart, keeping the price action area completely untouched.
Piața nu este doar preț, este ritm. În timp ce alții se pierd în zgomotul fiecărei secunde, eu definesc limitele zilei. O structură creată pentru traderul care știe că volumul urmează timpul, iar profitul urmează disciplina — păstrați ochii pe echilibrul zilei!" — Semnat, Andrei (Sakalau02) ⏳
Pine Script® indicator

BD SessionsSession boxes indicator for intraday charts.
Highlights up to four customizable market sessions using transparent boxes with clearly defined high/low ranges and labels.
Each session can be individually configured by name, time, timezone, and color.
Pine Script® indicator

BRIMSTONE SESSION INDICATOR🧭 Brimstone Session Indicator
Brimstone Session Indicator highlights global trading sessions (Asia, London/Frankfurt, New York) and key Kill Zones, showing when real liquidity and volatility enter the market.
⸻
🔍 Why It’s Useful
Markets move in time cycles, not just price.
This tool makes institutional timing visible — so you instantly see:
• Session ranges & volatility shifts
• Liquidity grabs and reversals in Kill Zones
• Perfect timing for precision entries (ICT / SMC style)
⸻
⚔️ Kill Zones
Fully customizable timing windows for liquidity hunts, stop raids, and engineered moves — where the market is most likely to attack highs/lows.
⸻
🎯 Built For
• ICT / Smart Money Traders
• Intraday scalpers & bias traders
• Anyone who trades price + time, not price alone
Pine Script® indicator

FX Sessions (DTS)FX Sessions (DST-Safe)
This indicator highlights the four main Forex trading sessions — Sydney, Tokyo, London, and New York — using the local timezone of each market.
• DST handled automatically: Sessions shift correctly when London or New York move clocks forward/back.
• Clear visualization: Light background shading for each session, with the London–New York overlap emphasized for peak liquidity.
• Customizable: Toggle individual sessions, labels, and the on-chart legend table.
• Intraday focus: Works best on lower timeframes (1m–1h) for identifying active trading hours and volatility windows.
Use this tool to instantly spot when liquidity and volatility are likely to increase, so you know where to focus your trading.
Pine Script® indicator

NRD Sessions Basic FunctionsThis script is an extension and modification of a popular BackGround color script.
Added
1. Style and programming standards to make is easier to read and modify
2. broke out Asia to Sydney and Tokyo Sessions
3. added override to show ICT Kill zones for London and New York
4. Made all this configurable via settings Menu
Enjoy
watch this space as I intend to do more complex session scripts to allow for High and Lows and Mondays too :-)
Pine Script® indicator

USA SessionThe USA session (9:30am to 4:00pm) is the most volatile session during market hours. Because of this, previous day OHLC values during that time frame are important to stock traders. For future traders, these and the overnight high/low are important. This indicator overlays the open, previous day open, previous day close, previous day high and previous day low (of the USA session) onto most stock chart. And for most future charts, this indicator will also plot the overnight high and low.
How to use
Currently, this indicator is only intended to work on stock and future assets. I'm not sure what will happen when used with other assets, but that's not my problem. This will also only work on a 5 minute chart, but I am working to have it function with all intraday time frames. When viewing stocks, you have to turn off the Extended Hours view in chart settings, else the calculated values will be garbage.
Assuming your chart meets those 3 constraints, this indicator should work automatically, all values are displayed by default. It may take a while to process when you first add this indicator. If you are only viewing stocks, you may want to disable the overnight levels as they will always be n/a. When viewing stocks, levels are not drawn on the last bar for the US session (3:55pm) to avoid ugly connecting lines between sessions. If you want those lines to connect, it can be enables in the indicator settings.
If levels are not flat across the whole session or you are still experiencing difficulties/inconsistencies please review the known issues below.
Knows issues
This indicator breaks when the asset is missing data. If a bar is missing, this indicator will break and move to a different level that is no longer valid. You can tell a bar is missing because the time will jump, for example, from 2:15 to 2:25 instead of 2:20. Unfortunately, I think this is an issue with the data feed and I have no way of correcting this. From the test I have done with the data feed I have, this has not been a big problem with more popular assets, but results will vary. A more professional data feed may be required for consistent and proper results.
During my tests, I found that my future assets are always missing data from 3:10pm to 3:25pm. It was so consistent, I put code in to correct it. However, I'm not sure if other people will experience this same issue, or if the issue varies. Because of this, I there is a 'Fix missing data bug' input in the indicator settings that is enabled by default. If you are missing data from 3:10pm to 3:25pm on your futures chart (like myself) make sure this stays on. If you have data during this time, you need to turn that setting off.
This indicator only works when the USA session opens/closes at its regular time. Days that do no follow this rule may produce garbage levels. Don't worry, they will work fine the next day!
Pine Script® indicator

Sakalau02 Yearly Monthly Sessions Sakalau02 Yearly Monthly Sessions is an advanced time-mapping tool designed to highlight monthly cycles throughout the year. The indicator converts raw price data into a clean visual structure, using arrays for optimized performance.
Macro Perspective: It allows you to visualize how price interacts with previous monthly highs and lows, making it ideal for identifying seasonal trends.
Array-Based Structure: Unlike traditional scripts, this dynamically handles data for all 12 months, ensuring low resource consumption even with a multi-year lookback.
Display Modes: Offers full flexibility by using Boxes (monthly price range), Zones (full-height background shading), or Timeline (discrete bottom markers).
Key Features:
Reference Levels: Includes the monthly Open price and the Equilibrium level (0.5 Level) for every session.
Individual Customization: Each month can be toggled and colored separately to highlight specific quarters or fiscal periods.
Alert System: Automated notifications for month starts and breakouts of monthly extremes (High/Low).
By Sakalau02 ( Andrei )
Pine Script® indicator

Sakalau02 Monthly Weekly SessionsSakalau02 Monthly Weekly Sessions is a visual analysis tool designed to automatically identify and highlight the 5 weeks of each calendar month. The indicator tracks price action throughout each week and offers several display modes:
Boxes: Draws rectangular zones covering the weekly High and Low.
Zones: Shades the chart background based on the active week.
Timeline: Adds discrete markers at the bottom of the chart.
Key Features:
Automated Levels: Displays the weekly Open price and the equilibrium line (0.5 Level) for each session.
Full Customization: Allows users to modify colors, line styles, and labels for each individual week.
Integrated Alerts: Notifies you when a new week starts or when the price hits a new weekly High or Low.
Performance Optimization: Includes a lookback setting to limit calculations to a specific number of months, keeping the chart responsive.
By Sakalau02 (Andre)
Pine Script® indicator
