MM Session Open AlgoThe MM Session Open Algo is a strategy to catch the opening breakout of a security
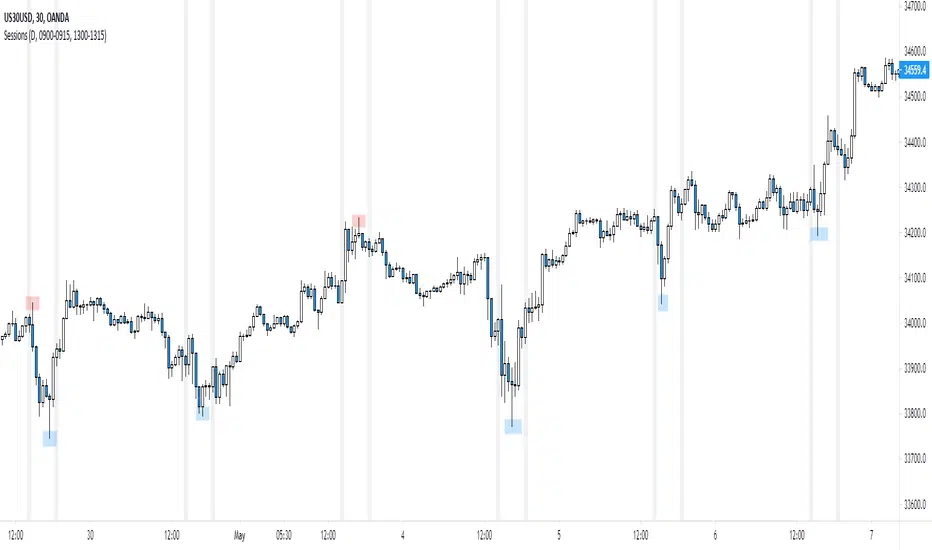
displays the current session with background color
Entry, Stop Loss Based on Atr, and two Take Profit levels
Kill zone entries for New york and London session
provides valid signal for entry once price crosses entry line
and set "opening session price" to determine what signal you are looking for. based on time frame
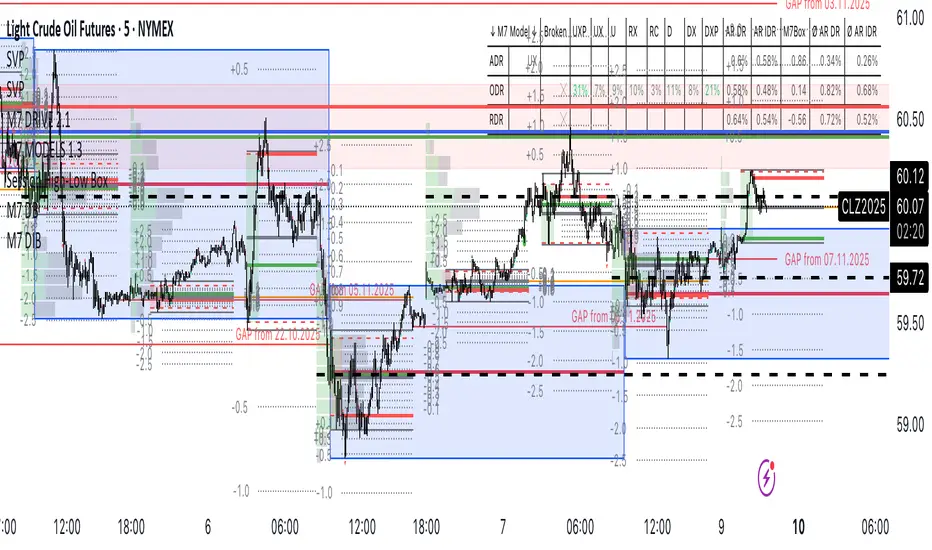
shows the Daily,Weekly,Monthly high and low
average daily range
and comes with trend filter.
Directions are Simple
when price crosses and closes above entry line. you get in with the set inputs of Tp and Sl
or you can set buy/sell stops with the price provided for you and ride the wave of the direction it goes with he Tp and Sl provided
Link below or PM us for access to this indicator Happy Trading
Pine Script® indicator