Session Range Breakouts With Targets [AlgoAlpha]⛓️💥Session Range Breakouts With Targets 🚀
Introducing the "Session Range Breakouts With Targets" indicator by AlgoAlpha, a powerful tool for traders to capitalize on session-based range breakouts and identify precise target zones using ATR-based calculations! Whether you trade the Asian, American, European, or Oceanic sessions, this script highlights key breakout levels and targets that adapt to market volatility, ensuring you're always prepared for those crucial price movements. 🕒📊
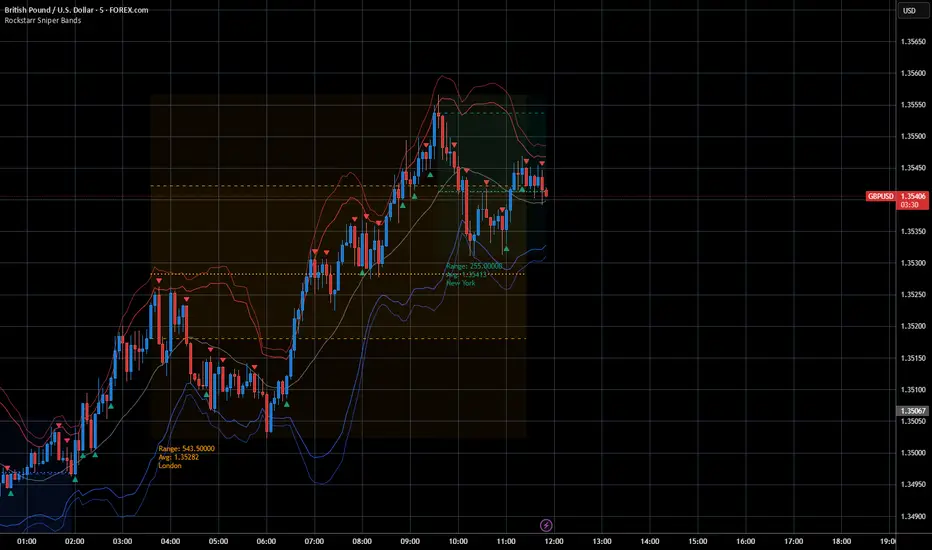
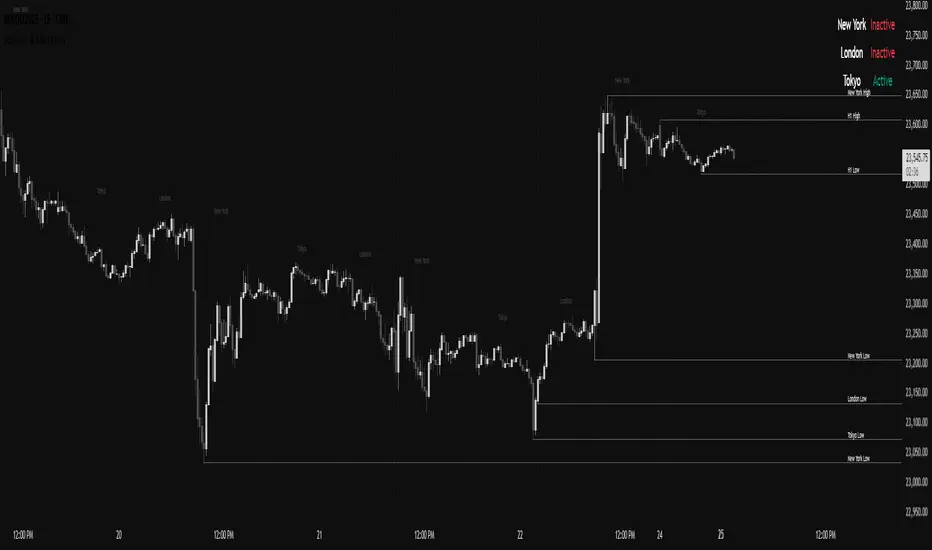
Session-based Trading : The indicator highlights session-specific ranges, offering clear breakouts for Asian, American, European, Oceanic, and even custom sessions 🌍.
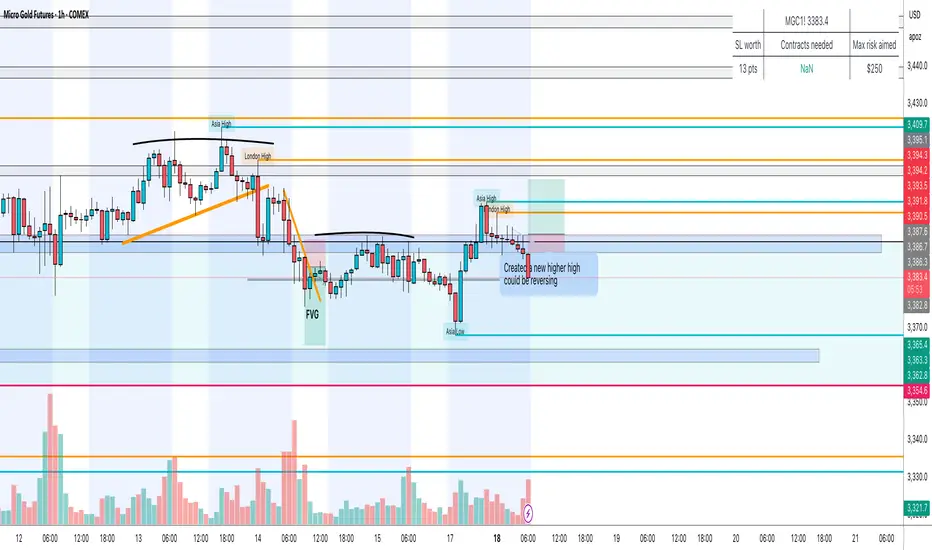
Adaptive Volatility Zones : Uses ATR to determine dynamic zone widths, filtering out fakeouts and adjusting to market conditions ⚡.
Precise Take-Profit Targets : Set multiple levels of take-profits based on ATR multipliers, ensuring you can manage both aggressive and conservative trades 🎯.
Customizable Appearance : Tailor the look with customizable colors for session highlights and breakout zones to fit your chart style 🎨.
Alerts on Key Events : Built-in alert conditions for breakouts and take-profit hits, so you never miss a trading opportunity 🔔.
🚀 Quick Guide to Using the Indicator
🛠 Add the Indicator : Add the indicator to favorites by pressing the star icon. Choose your session (Asia, America, Europe, Oceana, or Custom) and adjust the ATR length, zone width multiplier, and target multipliers to suit your strategy.
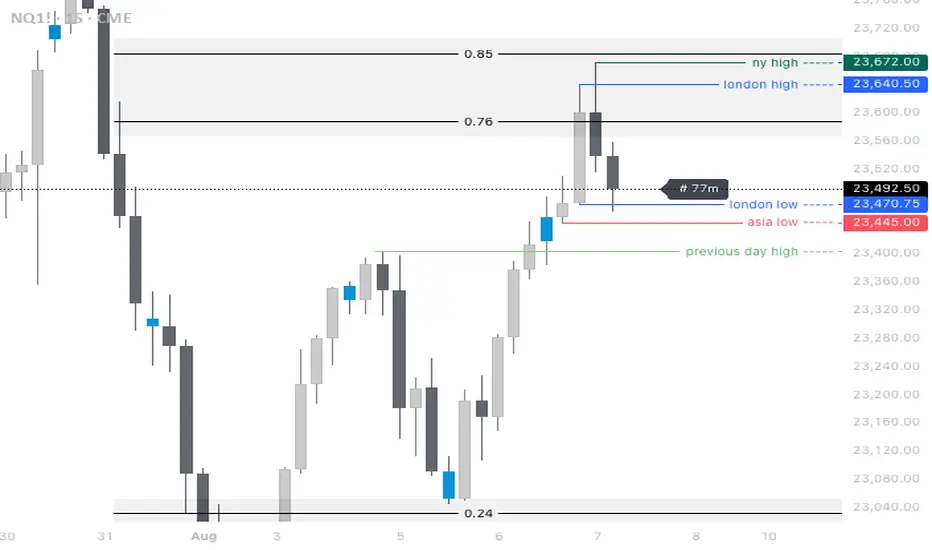
📊 Analyze Breakouts : Watch for the indicator to plot upper and lower range boxes based on session highs and lows. Price breaking through these boxes will signal a potential entry.
📈 Monitor Targets : Track bullish and bearish targets as price moves, with up to three take-profit levels based on ATR multipliers.
🔔 Set Alerts : Enable alerts for session breakouts or when price hits your designated take-profit targets.
🔍 How It Works
This script operates by identifying session-specific ranges based on highs and lows from the beginning of the selected session (Asia, America, Europe, or others). After a user-defined wait period (default: 120 bars), it calculates the highest and lowest points and creates upper and lower zones using the Average True Range (ATR) to adapt to market volatility. If the price breaks above or below these zones, it is identified as a breakout, and the script dynamically calculates up to three take-profit targets for both bullish and bearish scenarios using an ATR multiplier. The indicator also includes alerts for breakouts and take-profit hits, providing real-time trading signals.
Pine Script® indicator