SESSIONS liquidity***This script is only for my students.***
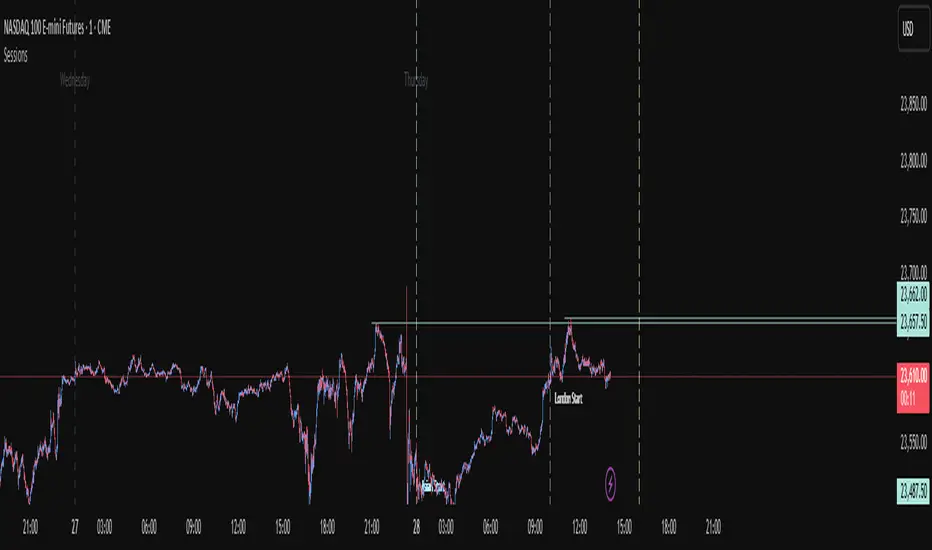
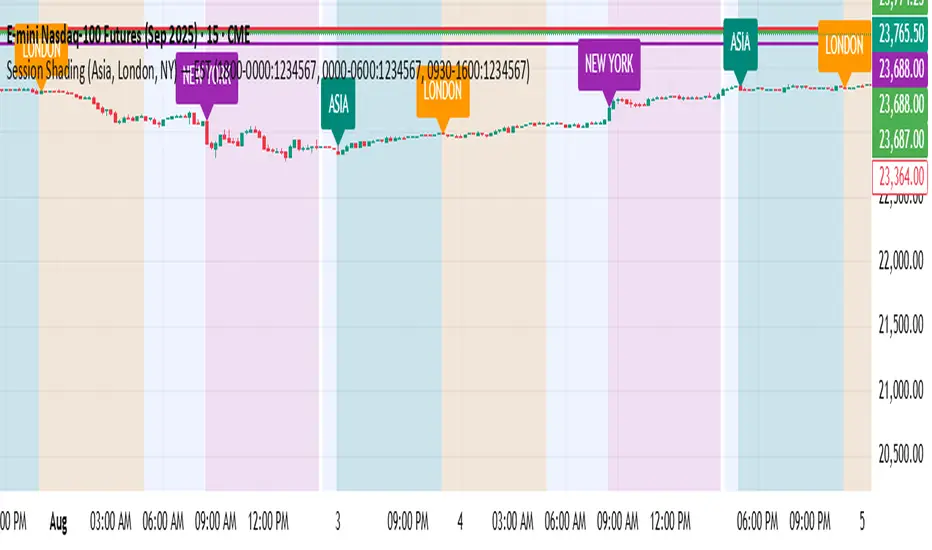
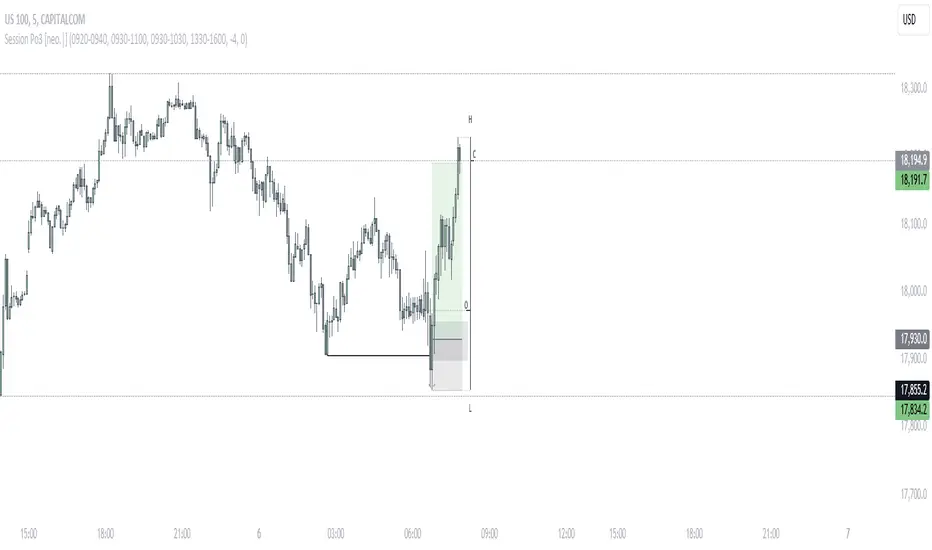
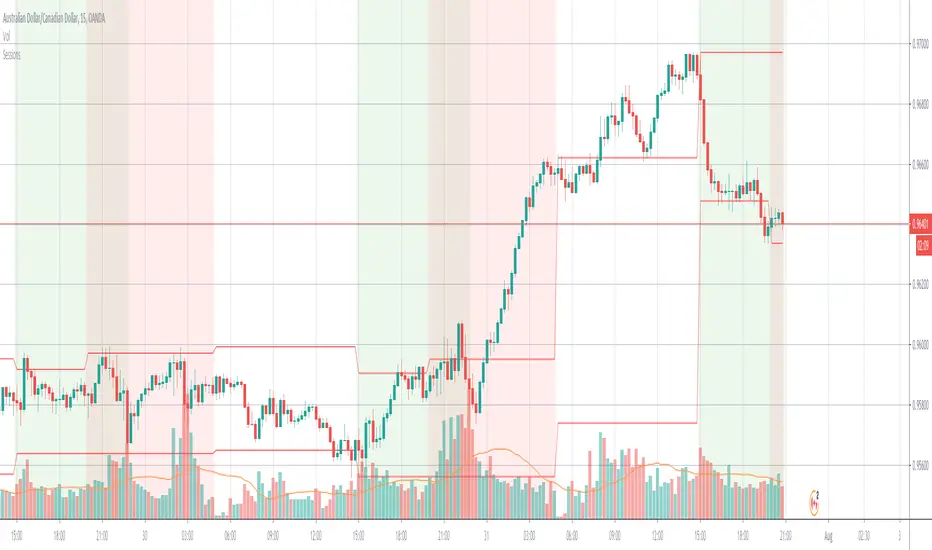
This script shows sessions, first hour of each session and first hour close price. This gives you opportunity to see liqudity of session, first hour and first hour close price line
Pine Script® indicator