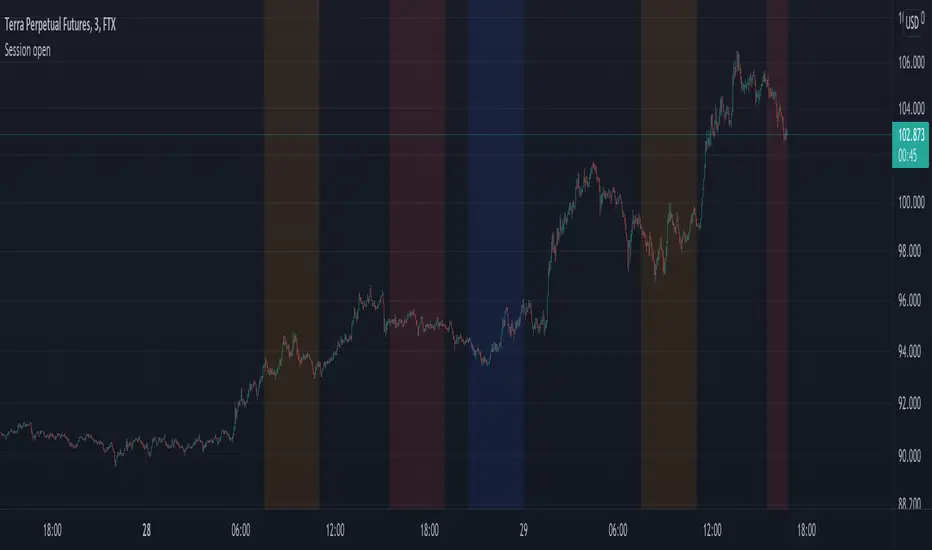
Session Sweep + Retrace (London + NY) - FixedORB Strategy with confluence. This sets out the 5 min session sweep from London and NY, and highlights a test back into the order zone with fib retracement. Pine Script® indicatorby madelinehill1015
Session High/Low by BKMarks all session highs and lows Asia High/Low London High/Low New York High/LowPine Script® indicatorby k6thi03Updated 5
Session H/L + Mid + 25%/75% — EvolvingPlots Session High and Low + the Midpoint between the two and also plots at 25% and 75% (Good for initial and rolling up/down stops)Pine Script® indicatorby DaLondonBoy883
Session Lines - 6 Lines AvailableTo be used to show the start of NYK session & close of the day.Pine Script® indicatorby TimsarASDUpdated 2
Session Anchor Lines (Asia, London, NY)futures relative to 4 HR chart ( it draws a line for each session open ) Pine Script® indicatorby Saluki20124
Session Anchor Lines (Asia, London, NY)it draws a line at each session open ( in relative to the 4 HR candle ) Pine Script® indicatorby Saluki20123
Session Highs and Lows - TWThis indicator plots the following: - Previous day's high and low (based on previous daily candle) - purple - Asia high and low (1800-0200) - red - London high and low (0300-0930) - blue Once a high or low is hit or passed during the NY session, the line reduces in thickness to show that this point of interest has been taken. The thinner lines remain on the chart as a reference so it's easy to discern POIs that are still in play vs. those that have been taken. Pine Script® indicatorby worldmomUpdated 111142
Session Highs and LowsThis indicator plots the following: - Previous day high and low (based on previous daily candle) - purple lines - Asian high and low (1800-0200) - red lines - London high and low (0300-0930) - blue lines During NY session, once one of these point of interest has been hit or passed, the line thickness reduces so you can tell at a glance which points have been taken, but they still remain on the chart for reference. Pine Script® indicatorby worldmom1117
Session H/LsShows the session highs and lows for USA, Asia, and LondonPine Script® indicatorby imorton77713
Session Prep (RTH only, UTC-4)corrected Session Prep (RTH only, UTC-4) now its working properly. hope it helps! :)Pine Script® indicatorby hermanmak9
Session TPO ProfileON TPO session TPO TPO TPO TPO Kryštof ON TPO TPO TPOPine Script® indicatorby TheTopTraders30
Session TPO ProfileFree TPO layout Kryštof analýzy dneska tady Ahoj tpo TPO sessionPine Script® indicatorby TheTopTraders1151
Session LiquidityDescribes if markets are liquid enough for institutions to manipulate. Its often difficult to determine if markets will trend or chop, but by looking at how much volume we have at the open, we can determine of the session will be choppy or trendy, and take trades based on that. Settings predefined for 1m timeframe on SPY. May work with other tickers, but I have not tested it out yet. Designed for stocks(as of now, may update later)Pine Script® indicatorby drop_trades63
Session High Low TimestampDescription: Displays the timestamp of the session's high/low. Useful for finding a pattern to day dips/spikes. Note: Most useful for ETH (extended hours timeframe)Pine Script® indicatorby chrisjunlee21
Central Session Time LinesSession Breaks for Central Time Zone 1. Asian 2. London 3. New York 4. Frankfurt 5. Pre New York 6. Australian Pine Script® indicatorby Dem-Gains2231
Session London; NYTool for UTC +1 with London open/close + NY open/closePine Script® indicatorby the_bejan11102
Session Background Alternator - WeeklyAlternate background shading every other weekPine Script® indicatorby optictropic2267
Trading Sessions with Highs and LowsTrading Sessions with Highs and Lows is designed to visually highlight specific trading sessions on the chart, providing traders with key insights into market behavior during these time periods. Here’s a detailed explanation of how the indicator works: Key Features 1. Session Boxes: • The indicator plots colored boxes on the chart to represent the price range of defined trading sessions. • Each box spans the session’s start and end times and encapsulates the high and low prices during that period. • Two trading sessions are defined by default: • USA Trading Session: 9:30 AM - 4:00 PM (New York Time). • UK Trading Session: 8:00 AM - 4:30 PM (London Time). 2. Session Labels: • The name of the session (e.g., “USA” or “UK”) is displayed above the session box for clear identification. 3. High and Low Markers: • Markers are added to the chart at the session’s high and low points: • High Marker: A green label indicating the session high. • Low Marker: A red label indicating the session low. 4. Dynamic Reset: • After the session ends, the session high and low values are reset to na to prepare for the next trading day. 5. Customizable Background Colors: • Each session’s box has a distinct, semi-transparent background color for better visual separation. How It Works 1. Core Functionality: • A function, plot_box, takes the session name, start time, end time, and background color as input. • It calculates whether the current time is within the session. • During the session: • It tracks the session’s highest and lowest prices. • It identifies the bars where the high and low occurred. • At the session’s end: • It plots a box on the chart covering the session’s time and price range. • Labels are created for the session name and its high/low points. 2. Session Timing: • Timestamps for the USA and UK trading sessions are calculated using the timestamp function with respective time zones. 3. Visual Elements: • The box.new function draws the session boxes on the chart. • The label.new function creates session name and high/low labels. Usage • Overlay Mode: The indicator is applied directly on the price chart (overlay=true), making it easy to visualize session-specific price behavior. • Trading Strategy: • Identify session-specific support and resistance levels. • Observe price action trends during key trading periods. • Align trading decisions with session dynamics. Customization While the indicator is preset for the USA and UK trading sessions, it can be easily modified: 1. Add/Remove Sessions: Define additional sessions by providing their start and end times. 2. Change Colors: Update the background_color in the plot_box calls to use different colors for sessions. 3. Adjust Time Zones: Replace the current time zones with others relevant to your trading style. Visualization Example • USA Session: • Time: 9:30 AM - 4:00 PM (New York Time). • Box Color: Semi-transparent orange. • UK Session: • Time: 8:00 AM - 4:30 PM (London Time). • Box Color: Semi-transparent green. Why Use This Indicator? 1. Market Awareness: Easily spot price behavior during high-liquidity trading periods. 2. Trend Analysis: Analyze how sessions overlap or affect each other. 3. Session Boundaries: Use session high/low levels as dynamic support and resistance zones. This indicator is an essential tool for intraday and swing traders who want to align their strategies with key market timings.Pine Script® indicatorby djanmamur298
[AlbaTherium] Sessional & Daily's liquidities - Beta Sessional & Daily Liquidities - Beta: Harnessing the Power of the Institutional Funding Candle (IFC) in Trading Introduction: The Sessional & Daily Liquidities - Beta indicator places the Institutional Funding Candle (IFC) at its core. Within the realm of trading, the IFC stands as a key signal for identifying Points of Interest (POIs) , offering traders invaluable insights into market dynamics. This document aims to illuminate the central role of the IFC within the Sessional & Daily Liquidities - Beta indicator, explaining how it can be effectively utilized to spot significant changes in the market and seize trading opportunities. Chapter 1: Sessional Liquidity concepts The forex market can be broken up into four major trading sessions: the Sydney session, the Tokyo session, the London session, and Trump’s favorite time to tweet (before he was banned), the New York session. Historically, the forex market has three peak trading sessions. Traders often focus on one of the three trading periods, rather than attempt to trade the markets 24 hours per day. This is known as the “forex 3-session system“. These sessions consist of the Asian, European, and North American sessions, which are also called Tokyo, London, and New York sessions. For that reason, a lot of trader put their stoploss right at the High or Low of their session, filling these price levels with liquidities. The market loves liquidities, they are like the “fuel” of the market. Price usually goes to these levels, takes out all the liquidities, and then returns to its original direction. This price behaviour indicates the presence of players – banks, institutions,... – driving the market to their own profit. The same logic applies with Daily, Weekly and Monthly high/low levels. Chapter 2: Deciphering the Institutional Funding Candle 2.1 Unveiling the Essence of the Institutional Funding Candle (IFC) - IFC concept is the core of this indicator. It is recommended to use this indicator on high timeframes, like 1H or 4H charts, as those are the timeframes which big players look at. - The presence of IFC candles means a significant amount of stop loss is triggered, and price have a tendency to reverse. 2.2 Criteria for IFC Identification The definition of specific conditions that characterize an IFC within the Sessional & Daily Liquidities - Beta indicator: - A breach of Previous day, Previous week, or Previous month’s High or Low levels or a breach of major Session Highs or Lows. - Price made an immediate reverse, creating a decent distance from the wicks. Chapter 2: Trading Strategies with the IFC User should treat these signals with cautions, and only take trades with multi confluences. This pictures below demonstrate a strategy to trade with this indicator, taking 1H HTF trend and 5m LTF ChoCh and Single Candle Order Block as confluences. Conclusion: The Sessional & Daily Liquidities - Beta indicator, centered around the Institutional Funding Candle (IFC), stands as a potent tool for traders, offering them the means to spot critical inflection points in the market. By understanding the role of the IFC in violating significant swing highs or lows and major session highs or lows, traders can make informed decisions and seize opportunities within the ever-evolving realm of financial markets. It's crucial to note that while IFC candle colors can provide insights, they do not unilaterally dictate market direction. Furthermore, candle closure can be a valuable consideration in specific situations, particularly when evaluating other High Time Frame POIs. The real-world examples presented in this document within the Sessional & Daily Liquidities - Beta indicator offer a tangible insight into the world of IFC trading. Harness the potential of the Institutional Funding Candle within the Sessional & Daily Liquidities - Beta indicator to elevate your trading strategies and make well-informed decisions in the dynamic landscape of financial markets. Pine Script® indicatorby AlbaTherium143
Market Sessions - by Alexander RottasMarket Sessions - Alexander Rottas This TradingView indicator displays market sessions for USA, EUROPE, and ASIA on your chart. It provides a clear and intuitive way to identify the active market periods, making it easier to plan your trades. Features: Session Display: Optionally show market sessions for USA, EUROPE, and ASIA. Customizable Timings: Set start and end times in UTC for each market session. Visual Indicators: Color-coded squares indicate active sessions and their combinations: USA Session: Blue EUROPE Session: Purple ASIA Session: Dull Orange Combined Sessions: Lighter shades to show overlapping sessions Session Labels: Dynamic labels at the start of each session to easily identify session beginnings on weekdays. User-Friendly Design: This indicator is designed to be non-intrusive and easy to use, with a simple setup and clear visual cues. Unlike other complex tools, it integrates seamlessly into your chart without overwhelming your view, making it an ideal choice for traders seeking a straightforward way to track market sessions. DISCLAIMER: This script is provided for educational purposes only. It cannot be used for commercial purposes or plagiarized. All rights reserved by the author. Unauthorized use or distribution of this script is prohibited. For more details, please contact the author directly.Pine Script® indicatorby AlexanderRottas33103
ICT Session by LasinsName: ICT Session by Lasins Purpose: To visually identify and differentiate between the Asian, London, and New York trading sessions on the chart. Features: Highlights the background of the chart during each session. Includes a mini dashboard in the top-right corner to show the active session. Allows customization of time zones (exchange timezone or UTC). Displays copyright and author information. Key Components Inputs: useExchangeTimezone: A boolean input to toggle between using the exchange timezone or UTC for session times. showDashboard: A boolean input to toggle the visibility of the mini dashboard. Session Times: The script defines three trading sessions: Asian Session: 2000-0000 UTC (or adjusted for exchange timezone). London Session: 0200-0500 UTC (or adjusted for exchange timezone). New York Session: 0700-1000 UTC (or adjusted for exchange timezone). Session Detection: The is_session function checks if the current time falls within a specified session using the time function. Background Coloring: The bgcolor function is used to highlight the chart background during each session: Asian Session: Red background. London Session: Green background. New York Session: Blue background. Mini Dashboard: A table is created in the top-right corner of the chart to display the active session and its corresponding color. The dashboard includes: A header row with "Session" and "Color". Rows for each session (Asian, London, New York) with their respective colors. Copyright and Author Information: A label is added to the chart to display the copyright and author information ("© ICT Session by Lasins Raj"). How It Works The script checks the current time and compares it to the predefined session times. If the current time falls within a session, the chart background is highlighted with the corresponding color. The mini dashboard updates to reflect the active session. The copyright and author information is displayed at the bottom of the chart. Customization You can adjust the session times in the script to match your preferred timezone or trading hours. The useExchangeTimezone input allows you to switch between UTC and the exchange timezone. The showDashboard input lets you toggle the visibility of the mini dashboard. Example Use Case Traders who follow the ICT (Inner Circle Trader) methodology can use this indicator to identify key trading sessions and plan their trades accordingly. The visual representation of sessions helps traders quickly recognize when major markets are open and active.Pine Script® indicatorby lasinsrajUpdated 26
SPX Iron Fly Session TrackerOverview This indicator provides visual tracking for iron fly option structures designed for SPX 0-day-to-expiration (0DTE) intraday trading. It implements a two-phase position management system that adapts to different market conditions throughout the trading day. This is a visualization and tracking tool only. It does not execute trades, access real options data, or calculate actual profit and loss. All displayed positions are theoretical representations based on underlying price movement. Strategy Goal and Context The Core Objective: The strategy aims to have SPX price expire within your iron fly positions at end of day. When price expires inside a fly's profit zone (between the wings), that position captures maximum premium. The challenge is that price moves throughout the day, so static positioning rarely succeeds. The Solution: Active Management Rather than setting positions and hoping price cooperates, this approach continuously manages and repositions flies to keep price centered within your profit zones. As SPX drifts during the trading session, you add new flies at current price levels and close flies that price has moved away from. The Goal: Multiple Profitable Expirations By session end, you want as many flies as possible to have price expire within their center zones. This requires: Adding new flies as price moves away from existing positions Closing flies when price crosses beyond their optimal range Building layered coverage in the afternoon to increase probability of capture Adapting wing widths to time of day and volatility The Reality: Capital and Time Intensive This is not a passive strategy. Successful implementation requires: Substantial capital (each fly requires margin, multiple flies compound this) Active monitoring throughout trading sessions Quick decision-making as positions trigger Multiple position adjustments per session Disciplined adherence to management rules How This Indicator Helps: For backtesting: Use replay mode to study how positions would have managed on historical sessions Test different parameter combinations to find optimal settings Observe position behavior during various market conditions Understand timing and frequency of position adds and closes Validate whether your capital can support the required position count For live session support: Real-time visual tracking shows current position coverage Alerts notify you immediately when new positions should be added Position closure alerts help you manage exits promptly Reference strike tracking shows where you're measuring movement from History table provides audit trail of all position activity The indicator handles the complex tracking and rule application, allowing you to focus on execution and risk management. Key Use Cases 1. Replay Mode - Backtest and Study Use TradingView's replay feature to validate the strategy on historical sessions: Step through past SPX sessions bar-by-bar See exactly when positions would have opened and closed Count how many flies would have expired profitably Analyze different parameter settings on the same historical data Study position behavior during trending vs ranging conditions Calculate approximate capital requirements for your setup Refine your parameters before risking real capital 2. Live Session Alerts Set up real-time notifications for active trading sessions: Get alerted immediately when new positions trigger Receive notifications when positions close Alerts include strike level, wing width, and closure reason Works on mobile, desktop, email, or webhook Never miss a position signal during active trading Maintain awareness even when away from screens briefly 3. Fully Customizable Parameters Adapt every aspect to your risk tolerance and capital: Adjust trigger distances for more or fewer position adds Modify wing widths for different volatility environments Change session timing to match your trading schedule Set maximum concurrent positions to your capital limits Fine-tune spacing to match available strike increments Iron Fly Structure An iron fly is a neutral options strategy with four legs: - Short 1 ATM Call - Short 1 ATM Put - Long 1 OTM Call (upper wing protection) - Long 1 OTM Put (lower wing protection) The structure creates a defined risk zone. Maximum profit occurs when price expires at the center strike. Loss increases as price moves toward the wings (breakeven points). Maximum loss is defined and occurs beyond the wings. Expiration Goal: You want SPX to close inside the fly's wings. If SPX expires at the strike, you capture maximum premium. If SPX expires between the strike and either wing, you still profit (reduced). If SPX expires beyond the wings, you realize a loss (but it's defined and limited by the wings). Two-Phase Management System The indicator tracks positions across two distinct trading phases with different management rules: Phase 1: TWO_GLASS - Morning Session (Default 10am-1pm ET) Conservative positioning with active repositioning: - Trigger new positions when price moves 7.5 points from reference strike (configurable) - Maintain maximum 2 concurrent positions (configurable) - 10-point spacing between position strikes (configurable) - 40-point wing width (configurable) - Exit rule: When two positions are active and price crosses to one strike level, close the OTHER position This phase uses a "follow the price" approach. You're not trying to stack multiple positions yet - you're maintaining one or two flies centered on wherever price currently is. As price drifts, you add a new fly at the current level and close the old one when price moves too far away. Phase 2: THREE_GLASS - Afternoon Session (Default 1pm-4pm ET) Accumulation mode with layered coverage: - Trigger new positions every 2.5 points of price movement (configurable) - Maintain maximum 6 concurrent positions (configurable) - 5-point spacing between strikes (configurable) - 20-point wings early, reducing to 10 points after 3pm (configurable) - Exit rule: Positions only close when price reaches wing extremes This phase builds a stacked profit zone. Instead of swapping positions, you accumulate multiple flies as price moves. The goal is to have several flies active at expiration, creating a wider net to capture price. Tighter spacing and more frequent triggers create this layered coverage. Why Two Different Phases? Morning (Phase 1): Earlier in the day, price has more time to move substantially. Maintaining many concurrent positions is riskier because price could trend and hit multiple wings. The strategy uses selective positioning with wider wings and active replacement. Afternoon (Phase 2): Closer to expiration, price movements typically compress. Time for large moves decreases. The strategy shifts to accumulation, building a net of positions to increase probability that final expiration price falls within at least one (ideally several) of your flies. Tighter wings and more positions become appropriate. Exit Mechanisms Strike Cross Exit (Phase 1 Only) When two positions are active, if price moves to or beyond one position's strike level, the OTHER position closes. This keeps your coverage centered on current price action rather than maintaining positions price has moved away from. Example: Flies at 5900 and 5910 are open. Price moves to 5910. The fly at 5900 closes because price has moved to the 5910 level. You're now positioned at current price (5910) rather than maintaining coverage at old price (5900). Wing Extreme Exit (Both Phases) Any position closes immediately when price touches its upper or lower wing boundary. This represents the breakeven/maximum loss point, so the position is closed to prevent further deterioration. Dynamic Wing Adjustment Wing widths automatically adjust based on time of day: - Phase 1 (Morning): 40 points (customizable) - Phase 2 Early (1pm-3pm): 20 points (customizable) - Phase 2 Late (3pm-4pm): 10 points (customizable) This progressive tightening reflects decreasing price movement potential as expiration approaches. Wider wings earlier provide more protection when price could move substantially. Tighter wings later allow more precise positioning when price movements typically compress. All values are fully adjustable to match your risk parameters and observed market volatility. Customization Guide Every parameter can be modified to suit your trading style, risk tolerance, and capital: Session Timing - TWO_GLASS Start Hour: When Phase 1 begins (default: 10am ET) - THREE_GLASS Start Hour: When Phase 2 begins (default: 1pm ET) - Wing Width Change Hour: When wings tighten (default: 3pm ET) - Session End Hour: When tracking stops (default: 4pm ET) Phase 1 Parameters (Fully Adjustable) - Trigger Distance: How far price must move from reference strike to add new position (default: 7.5, range: 0.1+) - Fly Spacing: Distance between position strikes (default: 10, range: 1.0+) - Wing Width: Distance from strike to wings (default: 40, range: 5.0+) - Max Flies: Maximum concurrent positions (default: 2, range: 1-10) Phase 2 Early Parameters (Fully Adjustable) - Trigger Distance: Movement needed to add new position (default: 2.5, range: 0.1+) - Fly Spacing: Distance between strikes (default: 5, range: 1.0+) - Wing Width: Strike to wing distance (default: 20, range: 5.0+) - Max Flies: Maximum concurrent positions (default: 6, range: 1-20) Phase 2 Late Parameters - Wing Width: Reduced width after 3pm (default: 10, range: 5.0+) General Settings - Strike Rounding: Round strikes to nearest multiple (default: 5.0, range: 1.0+) - Bars Before Check: Bars to wait before allowing closure (default: 2, prevents premature exits) Display Options - Show History Table: Toggle detailed position log (default: on) - History Table Rows: Number of positions displayed (default: 15, range: 5-30) Alert Settings - Enable Alerts: Toggle notifications for opens/closes (default: on) How to Use For Backtesting in Replay Mode: Select a historical SPX trading session Apply indicator to 1-5 minute timeframe Configure your preferred parameters Activate TradingView's replay feature Play through the session (step-by-step or continuous) Observe when positions open (green boxes appear) Watch position closures (boxes turn gray) Count how many flies would have expired with price inside (green at session end) Note total number of position adds throughout session Calculate approximate capital needed (positions × margin per fly) Test different parameter combinations on same historical data Study position behavior during trending vs ranging sessions For Live Trading Sessions: Apply indicator to SPX on 1-5 minute timeframe Configure parameters based on your backtest results Create alerts for "Iron Fly Opened" and "Iron Fly Closed" Set alert frequency to "Once Per Bar Close" Choose notification method (popup, mobile app, email, webhook) Monitor the status table (top-right) for current session and reference strike Review history table (bottom-right) for position log with timestamps When alert triggers, use visual cues to manually place actual option orders Execute position adds and closes as indicated by the tracker Visual Interpretation: Green boxes = Active positions (theoretical profit zones) White lines (Phase 1) / Aqua lines (Phase 2) = Strike levels Red/Blue dotted lines = Wing boundaries (breakeven/risk limits) Gray boxes = Closed positions (historical reference) Current SPX price line = Shows where price is relative to positions Top-right table = Current session status, reference strike, open/closed counts Bottom-right table = Complete position history with open/close timestamps Alert System Details The indicator generates detailed alert messages for position management: Position Opened: - Strike level where fly should be placed - Wing width (±points from strike) - Session phase (Phase 1 or Phase 2) - Alert format example: "Iron Fly OPENED | Strike: 5900 | Wings: ±40 | Session: TWO_GLASS" Position Closed: - Strike level of fly being closed - Closure reason (strike cross, wing extreme, etc.) - Session phase - Alert format example: "Iron Fly CLOSED | Strike: 5900 | Reason: Price crossed to lower fly | Session: TWO_GLASS" Configure alerts once before market open, then receive automatic notifications as positions trigger throughout the trading session. Parameter Optimization Suggestions For Higher Volatility Environments: - Increase trigger distances (e.g., Phase 1: 10-15 points, Phase 2: 3-5 points) - Widen wing widths (e.g., Phase 1: 50-60 points, Phase 2: 25-30 points early, 15-20 late) - Increase strike spacing to reduce position frequency For Lower Volatility Environments: - Decrease trigger distances (e.g., Phase 1: 5-7 points, Phase 2: 1.5-2 points) - Tighten wing widths (e.g., Phase 1: 30-35 points, Phase 2: 15-18 points early, 8-10 late) - Reduce strike spacing for more granular coverage For Conservative Risk Management: - Reduce maximum concurrent positions (Phase 1: 1, Phase 2: 3-4) - Widen wing widths for more breathing room - Increase bars before check to avoid whipsaws - Use wider trigger distances to reduce position frequency For Aggressive Positioning: - Increase maximum concurrent positions (Phase 2: 8-10) - Tighten trigger distances for more frequent adds - Reduce bars before check for faster responses - Use tighter spacing to create denser coverage Capital Considerations: Remember that each fly requires margin. If Phase 2 allows 6 concurrent flies and each requires $10,000 margin, you need $60,000 in available capital just for position requirements, plus additional cushion for adverse movement. Use replay mode to count maximum concurrent positions that would have occurred on historical sessions with your parameters, then calculate total capital needed. Practical Application This tool provides visual guidance and management support. To implement the strategy: Backtest thoroughly in replay mode first Validate capital requirements for your parameter settings Confirm you can actively monitor positions during trading hours Use displayed positions as reference for manual order placement Match indicator parameters to your actual option contracts Account for real-world factors: commissions, slippage, bid-ask spreads, option availability Implement proper position sizing based on available capital Set up alerts before market open to catch all signals Execute actual trades manually in your brokerage platform Track actual results versus indicator expectations Important Limitations Theoretical tracking only - not an automated trading system No access to real option prices, Greeks, or implied volatility No profit/loss calculations or risk metrics Does not account for time decay (theta), delta, gamma, vega changes Assumes continuous price action - gaps or halts not handled Designed for 0DTE SPX options - not suitable for other timeframes or instruments Assumes option availability at all strike levels - may not reflect reality Does not model actual option bid/ask spreads or liquidity Assumes instant execution at desired strikes - slippage not considered Historical replay shows theoretical behavior only - actual market conditions may differ Does not adjust for changing implied volatility throughout session Position count and timing may not match what's executable in real markets Capital and Time Requirements This strategy is resource-intensive: Capital Requirements: Each iron fly requires margin (varies by broker and strike width) Multiple concurrent positions multiply capital needs Example: 6 flies at $10,000 each = $60,000 minimum Additional cushion needed for adverse movement Pattern Day Trader rules may apply (requires $25,000 minimum) Time Requirements: Active monitoring during trading hours (typically 10am-4pm ET) Quick response to position add/close signals Multiple position adjustments per session possible Cannot be passive or set-and-forget Requires ability to place orders promptly when alerted Use replay mode to understand the commitment level before attempting live implementation. Risk Considerations Iron fly trading involves substantial risk. This indicator provides visualization and management support only - it does not constitute financial advice or trading recommendations. Options trading can result in total loss of capital. The indicator's theoretical positions do not reflect actual trading results. Backtest analysis and historical visualization do not guarantee similar future outcomes. Multiple concurrent positions multiply both profit potential and loss risk. Always conduct independent research, understand all risks, validate capital requirements, and never trade with funds you cannot afford to lose. Consider starting with paper trading to validate execution capability before risking real capital. Technical Notes The indicator uses price-based triggers only. It does not: Connect to options data feeds Calculate theoretical option values or Greeks Execute trades automatically Provide specific trading signals or recommendations Account for option-specific factors (implied volatility, time decay, bid/ask spreads) All displayed information represents theoretical position placement based solely on underlying SPX price movement and user-configured parameters. The tool helps visualize the management framework but requires the trader to handle all actual execution and risk management decisions. This is an educational and analytical tool for understanding iron fly position management concepts. It requires active interpretation, backtesting validation, and manual implementation by the user. Pine Script® indicatorby luiscaballeroUpdated 1
Manipulation Model [FB]GENERAL OVERVIEW: The Manipulation Model indicator is a complete rule-based system that identifies and confirms setups from the Funded Brothers Manipulation Model. It detects large impulsive candles, called Manipulation Candles and Almost Manipulation Candles, that form around key market levels such as session highs/lows, daily, weekly, and monthly levels, or higher timeframe Fair Value Gaps (FVGs). Using this structure, the indicator automatically marks long, short, bulltrap, and beartrap setups with predefined entry, stop loss, and take profit areas. This indicator was developed by Flux Charts in collaboration with the Funded Brothers. ATTRIBUTION NOTICE: This indicator incorporates concepts and source code from the indicator “MCs with Alerts” authored by @hamza_xau on TradingView. We have received full written permission from the original author to use and commercialize this code within this invite-only script. Original script: MCs with Alerts: What is the purpose of the indicator?: The indicator automates detection of the Manipulation Model trading strategy setups by combining candle structure, key levels, session timing, and higher timeframe Fair Value Gaps. It removes discretion by enforcing fixed conditions for valid signals and automatically managing entry, stop-loss, and take-profit logic. What is the theory behind the indicator?: The indicator is built on how price interacts with major reference points such as session highs and lows, or daily and weekly levels. These levels are commonly referenced in technical analysis as areas where price previously reversed or consolidated. Manipulation Candles identify moments when price breaks past these reference points on both sides of the prior candle before closing firmly in one direction. When these candles form near higher timeframe Fair Value Gaps, it reflects price reacting inside an area that previously showed directional imbalance. The higher timeframe EMA filter aligns all detected setups with the broader market trend, allowing only signals that match the dominant direction. MANIPULATION MODEL FEATURES: Manipulation Candlesticks Almost Manipulation Candlesticks Higher Timeframe Fair Value Gaps Sessions Key Levels Signals Dashboard Alerts MANIPULATION CANDLESTICKS: Manipulation Candlesticks (MCs) are candles that sweep both sides of the previous candle’s range and close outside of it. In the Manipulation Model indicator, these candles form the foundation for the long/short setups. Once one forms, the indicator checks its position relative to sessions, key levels, and higher timeframe Fair Value Gaps to determine if a valid setup exists. 🔹What is a Manipulation Candlestick? A Manipulation Candlestick (MC) is defined by structure rather than size. It forms when price takes out both the high and low of the previous candle, then closes outside that range. A bullish Manipulation Candle occurs when price sweeps below the previous candle’s low and then closes above the previous candle’s high. A bearish Manipulation Candle occurs when price sweeps above the previous candle’s high and then closes below the previous candle’s low. 🔹How to interpret and use Manipulation Candlesticks: Manipulation Candlesticks show where price made a strong one-sided move after taking both sides of the previous candle’s range. When one forms, it marks an area where buyers or sellers were likely trapped as price moved aggressively in one direction. A bullish MC shows strong buying after a false move lower. Price sweeps below the prior low, takes out the prior high, and closes above the previous range, confirming buyers are in control. A bearish MC shows strong selling after a false move higher than the previous candle’s high. Price sweeps above the prior high, drops below the prior low, and closes beneath the previous range, confirming sellers are dominant. 🔹How Manipulation Candlesticks are identified: The indicator confirms Manipulation Candles using three filters once a candle closes: Sweep Condition: Price must take both sides of the previous candle’s range, moving above its high and below its low, before closing outside that range. Directional Close: A bullish MC must close above the previous high, and a bearish MC must close below the previous low. Wick Confirmation: A bullish MC must have a smaller upper wick (high - close) than lower wick (open - low), and a bearish MC must have a smaller lower wick (close - low) than upper wick (high - open). Once these conditions are met at candle close, it is confirmed as a bullish or bearish Manipulation Candle. 🔹Bullish Manipulation Candle A bullish Manipulation Candle forms when price sweeps below the previous candle’s low, then breaks above its high, and closes above it. The lower wick must be larger than the upper wick, showing little pullback as price pushed upward and confirming strong buying pressure. 🔹Bearish Manipulation Candle A bearish Manipulation Candle forms when price sweeps above the previous candle’s high, then drops below its low, and closes beneath it. The upper wick must be larger than the lower wick, showing little pullback as price moved downward and confirming strong selling pressure. 🔹Manipulation Candle Visuals When the indicator detects a Manipulation Candle, it automatically changes the candle’s color on the chart. Both bullish and bearish Manipulation Candles use the same color. Users can change this color in the settings by adjusting the “Manipulation Candlestick” option found under the “Style Customization” section. The candle coloring feature can also be turned off entirely, which only removes the visual highlight from the chart and does not affect the signals or any of the indicator’s underlying logic that uses Manipulation Candlesticks. ALMOST MANIPULATION CANDLESTICKS: Almost Manipulation Candlesticks (AMCs) are similar to Manipulation Candles, except they close inside the previous candle’s range instead of outside it. In the Manipulation Model indicator, these candles help identify when price is showing the same sweeping behavior but hasn’t yet confirmed full displacement. They act as early warnings that a manipulation event may be developing. Just like Manipulation Candles, the indicator checks an AMC’s position relative to sessions, key levels, and higher timeframe Fair Value Gaps to determine if a valid setup exists. 🔹What is an Almost Manipulation Candlestick? An Almost Manipulation Candlestick (AMC) forms when price sweeps both the high and low of the previous candle and closes inside that candle’s range. A bullish AMC occurs when price sweeps below the previous low, moves above the previous high, and closes within the previous candle’s body instead of above it. A bearish AMC occurs when price sweeps above the previous high, drops below the previous low, and closes within the previous candle’s body instead of beneath it. 🔹How to Interpret and Use Almost Manipulation Candlesticks: Almost Manipulation Candles highlight hesitation or early signs of manipulation. A bullish AMC indicates buyers pushed price up after sweeping lower, but price did not close decisively above the prior high. A bearish AMC indicates sellers pushed price down after sweeping higher, but price did not close decisively below the prior low. 🔹How Almost Manipulation Candlesticks are identified: The indicator confirms Almost Manipulation Candles using the same sweep and wick logic as Manipulation Candles, except the candle’s close must remain inside the previous candle’s range: Sweep Condition: Price must take both sides of the previous candle’s range, moving above its high and below its low. Candle Close Location: The candle’s close must stay within the prior candle’s range. Wick Confirmation: For a bullish AMC, the lower wick must be larger than the upper wick. For a bearish AMC, the upper wick must be larger than the lower wick. Once these conditions are met at candle close, it is confirmed as a bullish or bearish Almost Manipulation Candle. 🔹Bullish Almost Manipulation Candle A bullish AMC forms when price sweeps below the previous candle’s low, moves above the prior candle’s high, and closes back inside the previous candle’s range. The lower wick must be larger than the upper wick, showing that buyers defended lower prices but the move did not close decisively upward. 🔹Bearish Almost Manipulation Candle A bearish AMC forms when price sweeps above the previous candle’s high, drops below the previous candle’s low, and closes back inside the previous candle’s range. The upper wick must be larger than the lower wick, showing that sellers rejected higher prices but the candle did not close decisively lower. 🔹Almost Manipulation Candle Visuals When the indicator detects an Almost Manipulation Candle, it automatically changes the candle’s color on the chart. Both bullish and bearish Almost Manipulation Candles use the same color. Users can change this color in the settings by adjusting the “Almost Manipulation Candlestick” option found under the “Style Customization” section. The candle coloring feature can also be turned off entirely, which only removes the visual highlight from the chart and does not affect the signals or any of the indicator’s underlying logic that uses Almost Manipulation Candlesticks. HIGHER TIMEFRAME FAIR VALUE GAPS: The Manipulation Model indicator automatically plots Fair Value Gaps from two user-selected higher timeframes. 🔹What is a Fair Value Gap?: A Fair Value Gap (FVG) is an area where the market’s perception of fair value suddenly changes. On your chart, it appears as a three-candle pattern: a large candle in the middle, with smaller candles on each side that don’t fully overlap it. A bullish FVG forms when a bullish candle is between two smaller bullish/bearish candles, where the first and third candles’ wicks don’t overlap each other at all. A bearish FVG forms when a bearish candle is between two smaller bullish/bearish candles, where the first and third candles’ wicks don’t overlap each other at all. Bullish & Bearish FVGs: 🔹Why are Fair Value Gaps important?: Fair Value Gaps (FVGs) show where price moved so quickly that one side of the market never got a chance to trade. They represent sudden shifts in what traders believe something is worth, where “fair value” changed. When a large candle drives straight through an area without overlap from the candles before and after it, it means buyers or sellers were so aggressive that the market skipped that price zone entirely. These gaps matter because they mark the moment when confidence in price changes. If price rallies and never pulls back, it signals that traders accept the new higher prices as fair and are willing to keep buying there. The same logic applies in reverse for bearish gaps. They tell you where the market re-priced aggressively and where value was last accepted. 🔹How are Fair Value Gaps used?: Higher Timeframe FVGs are used as a confluence for all setups within the Manipulation Model indicator. The indicator automatically detects and plots these imbalances from the chosen higher timeframe onto the current chart. When a Manipulation or Almost Manipulation Candle forms near or inside a higher timeframe Fair Value Gap, it adds context to the setup. They are not trade signals by themselves but act as a supporting element that contextualizes setups. 🔹When are Higher Timeframe Fair Value Gaps mitigated? A Higher Timeframe Fair Value Gap is considered mitigated when the selected higher timeframe closes above the gap for a bearish FVG or below the gap for a bullish FVG. 🔹Higher Timeframe FVG Settings: Timeframe 1 / Timeframe 2: Select up to two higher timeframes to use for Fair Value Gaps. Disabling either one removes it visually from the chart but does not affect signal generation. However, the timeframes you select will be used for signal generation logic. For example, if you select the 1-hour and 4-hour timeframes, then the 1-hour and 4-hour FVGs will be used for signal generation logic, which is explained in the signals section below. Combine Zones: When enabled, overlapping FVGs on the same higher timeframe are merged into a single zone. This keeps the chart clean and prevents duplicate zones from displaying. Midline: Adds a center line through each higher timeframe FVG. Labels: Displays a “ FVG” label beside each zone. This helps users see which timeframe the FVG is detected from. Color Customization: Each timeframe has separate color settings for bullish and bearish FVGs. Users can adjust these colors independently for both timeframes to fit their chart layout. FVG Display Limit: Controls how many higher timeframe FVGs are shown at once. Only the nearest X active gaps to current price will appear, helping maintain a clear view of relevant imbalances. SESSIONS: The Manipulation Model indicator includes six customizable trading sessions: Asia, London, NY AM, NYSE, London Close, and NY PM. All session times and visuals are fully user-configurable. Each session has adjustable start and end times that can be set to match your preferred schedule. Users can also customize visuals for each session, including the color, opacity, and visibility of session zones. Session highs and lows are automatically tracked and used within the indicator’s signal logic. When a Manipulation or Almost Manipulation Candle forms near a session high or low, it is recognized within the indicator’s signal detection. Default times used for each session (in EST): Asia: 20:00 - 00:00 London: 02:00 - 05:00 NY AM: 08:00 - 09:30 NYSE: 09:30 - 10:00 London Close: 10:00 - 11:00 NY PM: 11:00 - 14:00 🔹Session Settings: Session Boxes: Each session has a box that outlines its active time window. These boxes can be toggled on or off independently. When active, they visually separate each part of the trading day. Users can adjust the color and opacity of each session box. Session Highs/Lows: Every session can display its own high and low as horizontal lines. Users can customize the line style for session highs/lows, choosing between solid, dashed, or dotted. The color of the lines will match the same color used for the session box. Labels and Price Display: Labels can be toggled on for all session highs and lows. Users can adjust label color, text size, and choose whether to show the price next to the label. Users can adjust the text size, choosing between tiny, small, normal, large, and huge. Extend Levels: When enabled, each session’s high and low levels can be extended forward by a set number of bars. Session Titles: Titles for each enabled session (e.g., “Asia,” “London,” “NY AM”) can be displayed directly on the chart. Show Last: The “Show Last” setting allows you to choose how many recent sessions of each type appear on the chart. For example, if you only have the Asia session enabled and have this setting set to 2, the recent two Asia sessions will be displayed. 🔹Sessions Used Under the “Sessions Used” section in the settings, users can choose which sessions are active for signal generation. Only sessions enabled here will produce signals. For example, if you want setups to form only during the London session, turn off all other sessions in this section. Disabling a session under the main Sessions section only hides its visuals (boxes, lines, or labels). It does not impact signal detection or logic. However, changing a session’s start and end time in either section will affect signals, since signals are tied to the exact session windows defined by the user. This distinction ensures you have full control over what’s displayed visually versus what contributes to active trade signal logic. Please Note: Signals are only detected and plotted on your chart during sessions. Signals can not be detected outside of session time windows. KEY LEVELS: The Manipulation Model indicator includes 10 key market levels that outline important structural price areas across daily, weekly, and monthly timeframes. These levels include the Daily Open, Previous Day High/Low, Weekly Open, Previous Week High/Low, Monthly Open, Previous Month High/Low, and Midnight Open. The levels can be enabled or disabled and customized in color and line style. These levels are used for the indicator’s signal logic. 🔹Daily Open The Daily Open marks where the current trading day began. 🔹Previous Day High/Low The Previous Day High (PDH) marks the highest price reached during the previous regular trading session. It shows where buyers pushed price to its highest point before the market closed. This value is automatically pulled from the daily chart and projected forward onto intraday timeframes. The Previous Day Low (PDL) marks the lowest price reached during the previous regular trading session. It shows where selling pressure reached its lowest point before buyers stepped in. Like the PDH, this level is retrieved from the prior day’s data and extended into the current session. 🔹Weekly Open The Weekly Open marks the first price of the current trading week. 🔹Previous Week High/Low The Previous Week High (PWH) marks the highest price reached during the previous trading week. It shows where buying pressure reached its peak before the weekly close. This value is automatically pulled from the weekly chart and extended forward into the current week for easy reference on intraday timeframes. The Previous Week Low (PWL) marks the lowest price reached during the previous trading week. It shows where sellers pushed price to its lowest point before buyers regained control. Like the PWH, this level is sourced from the prior week’s data and projected onto the current week’s chart. 🔹Monthly Open The Monthly Open marks the opening price of the current month. 🔹Previous Month High/Low The Previous Month High (PMH) marks the highest price reached during the previous calendar month. It represents the point at which buyers achieved the strongest push before the monthly close. This level is automatically retrieved from the monthly chart and extended into the new month on all lower timeframes. The Previous Month Low (PML) marks the lowest price reached during the previous calendar month. It shows where selling pressure was strongest before buyers stepped back in. Like the PMH, this value is pulled from the prior month’s data and extended into the new month on all lower timeframes. 🔹Midnight Open The Midnight Open marks the first price of the trading day at 00:00 EST. 🔹Customization Options: Users can fully customize the appearance of all key levels, including the following: Daily Levels: Daily Open, PDH, and PDL Weekly Levels: Weekly Open, PWH, and PWL Monthly Levels: Monthly Open, PMH, and PML Midnight Open Color Settings: Each group of levels (Daily, Weekly, Monthly) shares a single color for the Open, High, and Low lines. For example, the Daily Open, PDH, and PDL all use the same color. Colors can be changed for each group, but not for individual levels within the same group. Line Style: Users can select a global line style, choosing between solid, dashed, or dotted, for all Daily, Weekly, and Monthly levels. This style applies to all levels within those groups. For example, the Weekly Open, PWH, and PWL must all share the same line style. The Midnight Open has its own independent line style setting and can use a different style from the other key levels. Show Labels: When enabled, text labels appear to the right of each key level. Users can adjust label color, but only one label color is applied to all levels for consistency. 🔹Key Levels Used: Under the “Key Levels Used” section, users can choose which Key Levels and Session Levels (Session Highs/Lows) are factored into signal generation. Only levels enabled here are considered within the logic that confirms setups. Users can choose between the following levels: Daily Open Previous Day High/Low Weekly Open Previous Week High/Low Monthly Open Previous Month High/Low Asia Session High/Low London Session High/Low NY AM Session High/Low NY Lunch Session High/Low NY PM Session High/Low London Close Session High/Low Midnight Open For example, if you only want to see setups that form using the Daily and Weekly levels, you should only enable the Daily Open, Previous Day High/Low, Weekly Open, and Previous Week High/Low. Disabling a level in the main “Key Levels” section only hides its visuals, while disabling it in “Key Levels Used” removes it entirely from the signal logic. Adjusting or removing any level in this section directly affects how setups are detected since the indicator references these levels when confirming Long, Short, Bulltrap, and Beartrap setups. SIGNALS: The Manipulation Model indicator automatically identifies Long, Short, Bulltrap, and Beartrap setups based on the interaction between Manipulation Candles (MCs), Almost Manipulation Candles (AMCs), and two main entry conditions: Key Levels and Fair Value Gaps (FVGs). Each signal type uses the structure of a Manipulation or Almost Manipulation Candle as its foundation. When one of these candles forms and aligns with the entry conditions, the indicator automatically plots labels for an entry, stop loss (SL), and take profit (TP). Every signal follows a mechanical set of rules and is marked in real time. Once confirmed on a candle close, the signal remains fixed on the chart and does not repaint. 🔹Higher Timeframe Bias Filter Before a signal is generated, the indicator automatically determines directional bias using the 50-period Exponential Moving Average (EMA) on the 1-hour timeframe. If price is above the 50 EMA, only bullish setups are allowed. If price is below the 50 EMA, only bearish setups are allowed. 🔹Stop Loss and Take Profit Logic: For every setup, the stop loss is placed at the low of the Manipulation or Almost Manipulation Candle for bullish setups, and at the high for bearish setups. The take profit is automatically calculated at a 1:1 risk-to-reward ratio relative to that distance. Users can adjust both the SL Multiplier and TP Multiplier in the settings, under the “General Configuration” section, to extend or contract these levels. For example, increasing the TP Multiplier to 1.5 sets the take profit at 1.5x the distance between the entry and stop loss. 🔹Signal Input Settings: Candle Type: Choose which candle type is used to generate signals. Options include: Manipulation Candle (MC) only Almost Manipulation Candle (AMC) only Both (signals are generated from either candle type) Entry Method: Determines whether signals are generated based on: Key Levels only Fair Value Gaps only Both (signals are generated from Key Levels AND Fair Value Gaps) Setup Types: You can enable or disable specific setup types. Only the selected setup types will appear on your chart: Long Setups Short Setups Bulltrap Setups Beartrap Setups 🔹Long Setup – Manipulation Candle + Key Level: A long setup forms when a bullish Manipulation Candle touches a toggled-on key level under the “Key Levels Used” section and closes above it during a toggled-on session from the “Sessions Used” section. After the candle closes and price is above the 1-hour 50 EMA, the indicator marks: Entry: At the close of the bullish Manipulation Candle Stop Loss: At the low of the same candle Take Profit: Equal distance above the entry, based on TP multiplier In this example, a bullish MC touches the PDH during the London Session and closes above the level: 🔹Short Setup – Manipulation Candle + Key Level A short setup forms when a bearish Manipulation Candle touches a toggled-on key level under the “Key Levels Used” section and closes below it during a toggled-on session from the “Sessions Used” section. After the candle closes and price is below the 1-hour 50 EMA, the indicator marks: Entry: At the close of the bearish Manipulation Candle Stop Loss: At the high of the same candle Take Profit: Equal distance below the entry, based on the TP Multiplier In this example, a bearish MC touches the Daily Open during the NY AM Session and closes below the level: 🔹Trap Confirmation Settings Two settings control how bulltrap and beartrap setups are confirmed once a Manipulation or Almost Manipulation Candle forms. Candles Between Confirmation: This setting defines the maximum number of candles allowed between the initial Manipulation Candle and the confirmation candle that closes back in the opposite direction. For example, if this value is set to 2, the confirmation candle must appear within two bars of the Manipulation Candle for the setup to remain valid. If too many candles form in between, the bull/bear trap setup is ignored. Trap Wick-to-Body Ratio: This input measures the ratio of the confirmation candle’s wick size to its body size for bulltrap and beartrap setups. Lower values require a larger body compared to the wick, meaning the confirmation candle must close more decisively. If the ratio is above the threshold set by the user, the confirmation candle for a bulltrap/beartrap setup is considered valid. For example, if the wick is 10 points and the body is 10 points, the ratio is 1.0 (10 / 10). If the wick is 10 points and the body is 20 points, the ratio is 0.5 (10 / 20). 🔹Beartrap Setup – Manipulation Candle + Key Level A beartrap setup forms when a bearish Manipulation Candle touches a toggled-on key level under the “Key Levels Used” section. The candle does not need to close above or below the level, it only needs to touch it. After this bearish MC forms, a confirmation candle must close back above the MC’s high during an enabled session under the “Sessions Used” section. The sweep or initial touch can occur before or outside the session, but the confirmation candle must close within an active session window. To confirm the setup, the following conditions must be met: The confirmation candle must close within the limit set by the Candles Between Confirmation input. Its wick-to-body ratio must be less than or equal to the Trap Wick-to-Body Ratio input Once these conditions are met and price is above the 1-hour 50 EMA, the indicator marks: Entry: At the close of the confirmation candle Stop Loss: At the low of the confirmation candle Take Profit: Equal distance above the entry, measured 1:1 from the candle’s body and scaled by the TP Multiplier In this example, a bearish Manipulation Candle touches the Daily Open level before price reverses and a confirmation candle closes above it. The confirmation candle occurs during the Asia Session, has a strong body with minimal wicks, meeting the Trap Wick-to-Body Ratio requirement, and it forms just two candles after the bearish MC which is within the limit set by the Candles Between Confirmation input. 🔹Bulltrap Setup – Manipulation Candle + Key Level A bulltrap setup forms when a bullish Manipulation Candle touches a toggled-on key level under the “Key Levels Used” section. The MC does not need to close above or below the level, it only needs to touch it. After this bullish MC forms, a confirmation candle must close back below the MC’s low during an enabled session under the “Sessions Used” section. The initial key level touch from the MC can occur before or outside the session, but the confirmation candle must close within an active session window. To confirm the setup, the following conditions must be met: The confirmation candle must close within the limit set by the Candles Between Confirmation input. Its wick-to-body ratio must be less than or equal to the Trap Wick-to-Body Ratio input. Once these conditions are met and price is below the 1-hour 50 EMA, the indicator marks: Entry: At the close of the confirmation candle Stop Loss: At the high of the confirmation candle Take Profit: Equal distance below the entry, measured 1:1 from the candle’s body and scaled by the TP Multiplier In this example, a bullish Manipulation Candle touches the Daily Open level before price reverses and a confirmation candle closes below it. The confirmation candle forms during the NY AM Session, has a strong body with minimal wicks that meet the Trap Wick-to-Body Ratio requirement, and it appears two candles after the bullish MC which is within the limit defined by the Candles Between Confirmation input. 🔹Long Setup – Almost Manipulation Candle + Key Level A long setup forms when a bullish Almost Manipulation Candle (AMC) touches a toggled-on key level under the “Key Levels Used” section and closes above it during a toggled-on session from the “Sessions Used” section. After the candle closes and price is above the 1-hour 50 EMA, the indicator marks: Entry: At the close of the bullish Almost Manipulation Candle Stop Loss: At the low of the same candle Take Profit: Equal distance above the entry, based on the TP Multiplier In this example, a bullish AMC touches the Daily Open during the NYSE Session and closes above the level. 🔹Short Setup – Almost Manipulation Candle + Key Level A short setup forms when a bearish Almost Manipulation Candle (AMC) touches a toggled-on key level under the “Key Levels Used” section and closes below it during a toggled-on session from the “Sessions Used” section. After the candle closes and price is below the 1-hour 50 EMA, the indicator marks: Entry: At the close of the bearish Almost Manipulation Candle Stop Loss: At the high of the same candle Take Profit: Equal distance below the entry, based on the TP Multiplier In this example, a bearish AMC touches the Midnight Open during the NY AM Session and closes below the level. 🔹Beartrap Setup – Almost Manipulation Candle + Key Level A beartrap setup forms when a bearish Almost Manipulation Candle (AMC) touches a toggled-on key level under the “Key Levels Used” section. The candle does not need to close above or below the level, it only needs to touch it. After this bearish AMC forms, a confirmation candle must close back above the AMC’s high during an enabled session under the “Sessions Used” section. The initial touch can occur before or outside the session, but the confirmation candle must close within an active session window. To confirm the setup, the following conditions must be met: The confirmation candle must close within the limit set by the Candles Between Confirmation input. Its wick-to-body ratio must be less than or equal to the Trap Wick-to-Body Ratio input. Once these conditions are met and price is above the 1-hour 50 EMA, the indicator marks: Entry: At the close of the confirmation candle Stop Loss: At the low of the confirmation candle Take Profit: Equal distance above the entry, measured 1:1 from the candle’s body and scaled by the TP Multiplier In this example, a bearish AMC touches the Midnight Open before price reverses and a confirmation candle closes above it. The confirmation candle forms during the London Session, has a large body with minimal wicks that meet the Trap Wick-to-Body Ratio requirement, and appears seven candles after the bearish AMC which is within the Candles Between Confirmation limit (10 by default). 🔹Bulltrap Setup – Almost Manipulation Candle + Key Level A bulltrap setup forms when a bullish AMC touches a toggled-on key level under the “Key Levels Used” section. The candle does not need to close above or below the level; it only needs to touch it. After this bullish AMC forms, a confirmation candle must close back below the AMC’s low during an enabled session under the “Sessions Used” section. The initial touch can occur before or outside the session, but the confirmation candle must close within an active session window. To confirm the setup, the following conditions must be met: The confirmation candle must close within the limit set by the Candles Between Confirmation input. Its wick-to-body ratio must be less than or equal to the Trap Wick-to-Body Ratio input. Once these conditions are met and price is below the 1-hour 50 EMA, the indicator marks: Entry: At the close of the confirmation candle Stop Loss: At the high of the confirmation candle Take Profit: Equal distance below the entry, measured 1:1 from the candle’s body and scaled by the TP Multiplier In this example, a bullish AMC touches the NY Lunch Session Low before price reverses and a confirmation candle closes below it. The confirmation candle forms during the Asia Session, has a strong body with minimal wicks that meet the Trap Wick-to-Body Ratio requirement, and appears six candles after the bullish AMC which is within the Candles Between Confirmation limit. 🔹Long Setup – Manipulation Candle + Fair Value Gap A long setup forms when a bullish Manipulation Candle touches a bullish higher timeframe Fair Value Gap (FVG) from one of the two higher timeframe inputs under the “Fair Value Gaps” section. The candle must close during an enabled session under the “Sessions Used” section. After the candle closes and price is above the 1-hour 50 EMA, the indicator marks: Entry: At the close of the bullish Manipulation Candle Stop Loss: At the low of the same candle Take Profit: Equal distance above the entry, scaled by the TP Multiplier In this example, a bullish MC taps into a bullish 1-hour FVG during the Asia Session. 🔹Short Setup – Manipulation Candle + Fair Value Gap A short setup forms when a bearish Manipulation Candle touches a bearish higher timeframe FVG from one of the two selected higher timeframe inputs under the “Fair Value Gaps” section. The candle must also close during an enabled session under the “Sessions Used” section. After the candle closes and price is below the 1-hour 50 EMA, the indicator marks: Entry: At the close of the bearish Manipulation Candle Stop Loss: At the high of the same candle Take Profit: Equal distance below the entry, scaled by the TP Multiplier In this example, a bearish MC taps a bearish 1-hour FVG during the Asia Session. 🔹Beartrap Setup – Manipulation Candle + Fair Value Gap A beartrap setup forms when a bearish Manipulation Candle touches a bullish or bearish higher timeframe FVG from one of the two higher timeframe inputs under the “Higher Timeframe FVG Settings” section. After the bearish MC forms, price must reverse and a confirmation candle must close above the bearish MC’s high during an enabled session under the “Sessions Used” section. The initial touch of the FVG can occur before or outside the session, but the confirmation candle must close within an active session window. To confirm the setup, the following conditions must be met: The confirmation candle must close within the limit set by the Candles Between Confirmation input. Its wick-to-body ratio must be less than or equal to the Trap Wick-to-Body Ratio input. Once these conditions are met and price is above the 1-hour 50 EMA, the indicator marks: Entry: At the close of the confirmation candle Stop Loss: At the low of the confirmation candle Take Profit: Equal distance above the entry, measured 1:1 from the candle’s body and scaled by the TP Multiplier In this example, a bearish MC taps a 1-hour bearish FVG, price reverses, and a confirmation candle closes above the bearish MC’s high. The confirmation candle forms during the London Session, has a strong body with minimal wicks that meet the Trap Wick-to-Body Ratio requirement, and appears two candles after the bearish MC which is within the Candles Between Confirmation limit. 🔹Bulltrap Setup – Manipulation Candle + Fair Value Gap A bulltrap setup forms when a bullish MC touches a bearish or bullish higher timeframeFVG from one of the two higher timeframe inputs under the “Higher Timeframe FVG Settings” section. After the bullish MC forms, price must reverse and a confirmation candle must close below the MC’s low during an enabled session under the “Sessions Used” section. The initial touch of the FVG can occur before or outside the session, but the confirmation candle must close within an active session window. To confirm the setup, the following conditions must be met: The confirmation candle must close within the limit set by the Candles Between Confirmation input. Its wick-to-body ratio must be less than or equal to the Trap Wick-to-Body Ratio input. Once these conditions are met and price is below the 1-hour 50 EMA, the indicator marks: Entry: At the close of the confirmation candle Stop Loss: At the high of the confirmation candle Take Profit: Equal distance below the entry, measured 1:1 from the candle’s body and scaled by the TP Multiplier In this example, a bullish MC taps a 4-hour bearish FVG, price reverses, and a confirmation candle closes below the bullish MC’s low. The confirmation candle forms during the NY PM Session, has a strong body with minimal wicks that meet the Trap Wick-to-Body Ratio requirement, and appears six candles after the bullish MC which is within the Candles Between Confirmation limit. 🔹Long Setup – Almost Manipulation Candle + Fair Value Gap A long setup forms when a bullish AMC touches a bullish higher timeframe FVG from one of the two higher timeframe inputs under the “Fair Value Gaps” section. The candle must close during an enabled session under the “Sessions Used” section. After the candle closes and price is above the 1-hour 50 EMA, the indicator marks: Entry: At the close of the bullish AMC Stop Loss: At the low of the same candle Take Profit: Equal distance above the entry, scaled by the TP Multiplier In this example, a bullish AMC taps into a bullish 1-hour FVG during the London Session. 🔹Short Setup – Almost Manipulation Candle + Fair Value Gap A short setup forms when a bearish AMC touches a bearish higher timeframe FVG from one of the two selected higher timeframe inputs under the “Fair Value Gaps” section. The candle must also close during an enabled session under the “Sessions Used” section. After the candle closes and price is below the 1-hour 50 EMA, the indicator marks: Entry: At the close of the bearish AMC Stop Loss: At the high of the same candle Take Profit: Equal distance below the entry, scaled by the TP Multiplier In this example, a bearish AMC taps a bearish 1-hour FVG during the NY PM Session. 🔹Beartrap Setup – Almost Manipulation Candle + Fair Value Gap A beartrap setup forms when a bearish AMC touches a bullish or bearish higher timeframe FVG from one of the two higher timeframe inputs under the “Higher Timeframe FVG Settings” section. After the bearish AMC forms, price must reverse and a confirmation candle must close above the bearish AMC’s high during an enabled session under the “Sessions Used” section. The initial touch of the FVG can occur before or outside the session, but the confirmation candle must close within an active session window. To confirm the setup, the following conditions must be met: The confirmation candle must close within the limit set by the Candles Between Confirmation input. Its wick-to-body ratio must be less than or equal to the Trap Wick-to-Body Ratio input. Once these conditions are met and price is above the 1-hour 50 EMA, the indicator marks: Entry: At the close of the confirmation candle Stop Loss: At the low of the confirmation candle Take Profit: Equal distance above the entry, measured 1:1 from the candle’s body and scaled by the TP Multiplier In this example, a bearish AMC taps a 4-hour bearish FVG, price reverses, and a confirmation candle closes above the bearish AMC’s high. The confirmation candle forms during the NY PM Session, has a strong body with minimal wicks that meet the Trap Wick-to-Body Ratio requirement, and appears seven candles after the bearish AMC, which is within the Candles Between Confirmation limit. 🔹Bulltrap Setup – Almost Manipulation Candle + Fair Value Gap A bulltrap setup forms when a bullish AMC touches a bearish or bullish higher timeframe FVG from one of the two higher timeframe inputs under the “Higher Timeframe FVG Settings” section. After the bullish AMC forms, price must reverse and a confirmation candle must close below the AMC’s low during an enabled session under the “Sessions Used” section. The initial touch of the FVG can occur before or outside the session, but the confirmation candle must close within an active session window. To confirm the setup, the following conditions must be met: The confirmation candle must close within the limit set by the Candles Between Confirmation input. Its wick-to-body ratio must be less than or equal to the Trap Wick-to-Body Ratio input. Once these conditions are met and price is below the 1-hour 50 EMA, the indicator marks: Entry: At the close of the confirmation candle Stop Loss: At the high of the confirmation candle Take Profit: Equal distance below the entry, measured 1:1 from the candle’s body and scaled by the TP Multiplier In this example, a bullish AMC taps a 1-hour bullish FVG, price reverses, and a confirmation candle closes below the bullish AMC’s low. The confirmation candle forms during the Asia Session, has a strong body with minimal wicks that meet the Trap Wick-to-Body Ratio requirement, and appears six candles after the bullish AMC, which is within the Candles Between Confirmation limit. 🔹Signal Style Customization The Manipulation Model indicator provides full visual customization for all signal elements, allowing users to easily adjust the appearance of entry, stop loss, and take profit labels. Label Colors: Users can customize the label color for Long Setups (Long and Beartrap) and Short Setups (Short and Bulltrap). Long and Beartrap setups share the same label color. Short and Bulltrap setups share the same label color. Label text color can also be customized and applied globally to all signal labels. Stop Loss (SL) and Take Profit (TP) Labels: The SL and TP label colors can be customized independently. Users can toggle SL Labels and TP Labels on or off. When turned off, the corresponding labels are hidden, but their levels remain active on the chart. Entry, Stop Loss, and Take Profit Lines: Each of these lines can be individually toggled on or off. Entry Line: Marks the entry price level. Stop Loss Line: Displays the SL level derived from each setup’s logic. Take Profit Line: Displays the TP level calculated using the Take Profit Multiplier setting. Users can also toggle the labels for each line on or off and adjust the color for each line type independently. WIN RATE DASHBOARD: The Win Rate Dashboard gives traders a quick way to see the recent performance of their enabled setups. It automatically calculates and displays win rates for each signal type turned on under the “General Configuration” section, based on the sessions and key levels currently active in the settings. The dashboard updates in real time, showing both the win rate percentage and total trade count for all enabled signal types combined. It looks back at a set number of bars to calculate results, providing a simple performance snapshot directly on your chart. How It Works: When a signal triggers, the indicator tracks whether price first reaches the Take Profit (TP) or Stop Loss (SL) level. A winning trade is recorded when the take profit is hit before the stop loss. A losing trade is recorded when the stop loss is hit before the take profit. The win rate = (Winning Trades / Total Trades) x 100 🔹Dashboard Customization: Users can adjust the dashboard’s appearance with the following settings: Background Color Frame Color Border Color Text Color You can also toggle the dashboard on or off from the settings menu. It appears in the top-right corner of the chart by default and its position cannot be changed. 🔹Disclaimer: The Win Rate Dashboard provides historical performance data based on the signals and conditions you’ve enabled. These results are calculated from past bars and are not indicative of future performance or profitability. ALERTS: The Manipulation Model indicator includes full alert functionality powered by AnyAlert(), allowing users to receive notifications for all major setups and level breaks in real time. Users can choose exactly which alerts they want to receive under the “Alerts” section of the settings. Once your preferred alerts are toggled on, you can create a TradingView alert using the AnyAlert() condition. This will automatically trigger alerts for all selected events as they occur on your chart. Available Alerts: Long Setup Short Setup Bulltrap Setup Beartrap Setup Manipulation Candle Almost Manipulation Candle Previous Day High/Low Break Current Day Open Break Previous Week High/Low Break Current Week Open Break Previous Month High/Low Break Current Month Open Break Asia Session High/Low Break London Session High/Low Break NY AM Session High/Low Break NYSE Session High/Low Break London Close Session High/Low Break NY PM Session High/Low Break Midnight Open Break To receive alerts: Open the alert creation window in TradingView Select “Manipulation Model ” as the condition Choose AnyAlert() from the dropdown Create the alert IMPORTANT NOTES: TradingView has limitations when running features on multiple timeframes, which can result in the following restriction: Computation Error: The computation of using MTF features is very intensive on TradingView. This can sometimes cause calculation timeouts. When this occurs, simply force the recalculation by modifying one indicator’s settings or by removing the indicator and adding it to your chart again. UNIQUENESS: The Manipulation Model is unique because every setup type is fully rule-based and tied to strict structural logic. Traders can control exactly how signals form by selecting which candle types are used, which key levels and sessions are active, and whether entries trigger from Key Levels, Fair Value Gaps, or both. All setups use objective rules for confirmation, wick-to-body ratio, and higher timeframe bias. The indicator also provides full customization for visuals, alerts, and trade parameters like TP and SL multipliers. A built-in Win Rate Dashboard tracks real-time performance for all enabled setup types based on the user’s active sessions and signal filters. Together, these features make it a complete, mechanical implementation of the Funded Brothers Manipulation Model and it works across all asset classes including stocks, crypto, forex, and futures.Pine Script® indicatorby fluxchartUpdated 33570