Asia Sessions AutoPlotting**Asia Sessions AutoPlotting**
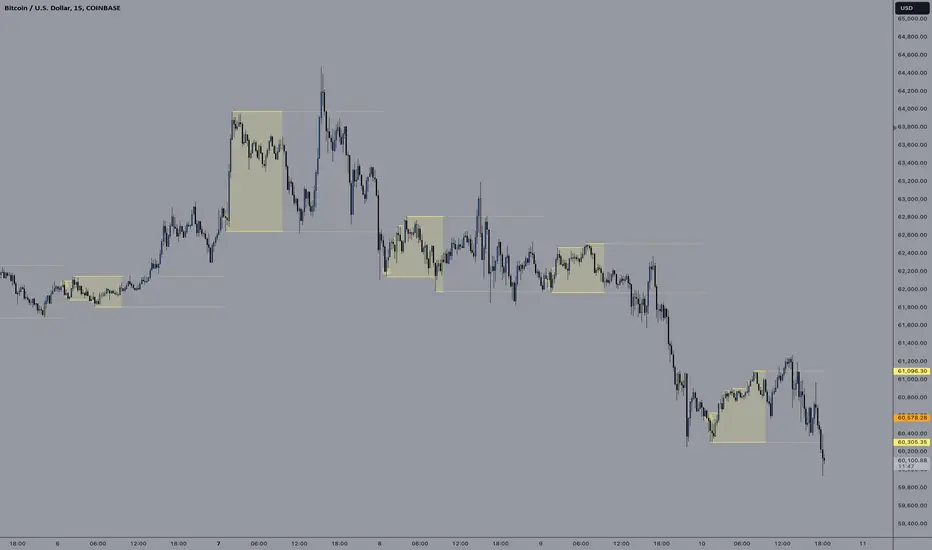
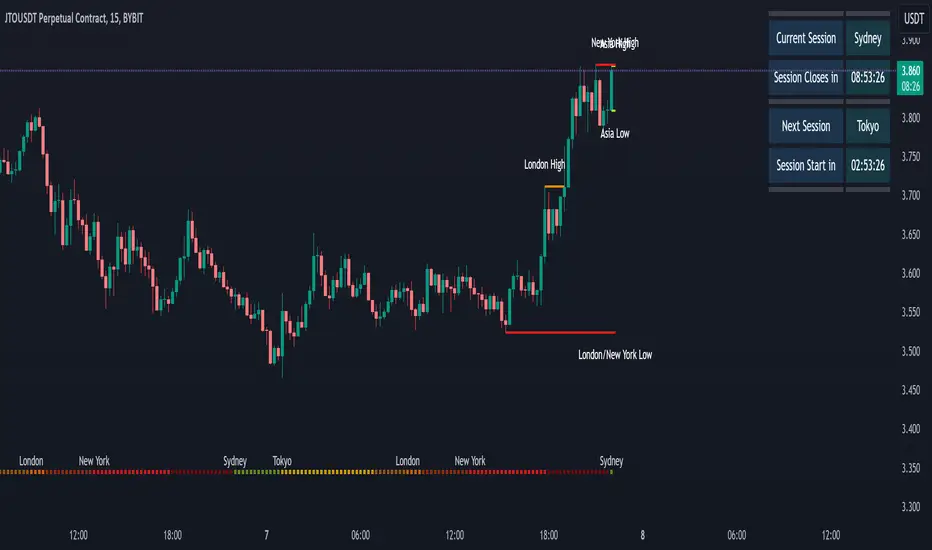
This script is designed to automatically detect and plot the Asia session high and low levels directly on your chart, providing key session data for trading analysis. It is highly customizable, making it an essential tool for traders who rely on session data for decision-making.
### Key Features:
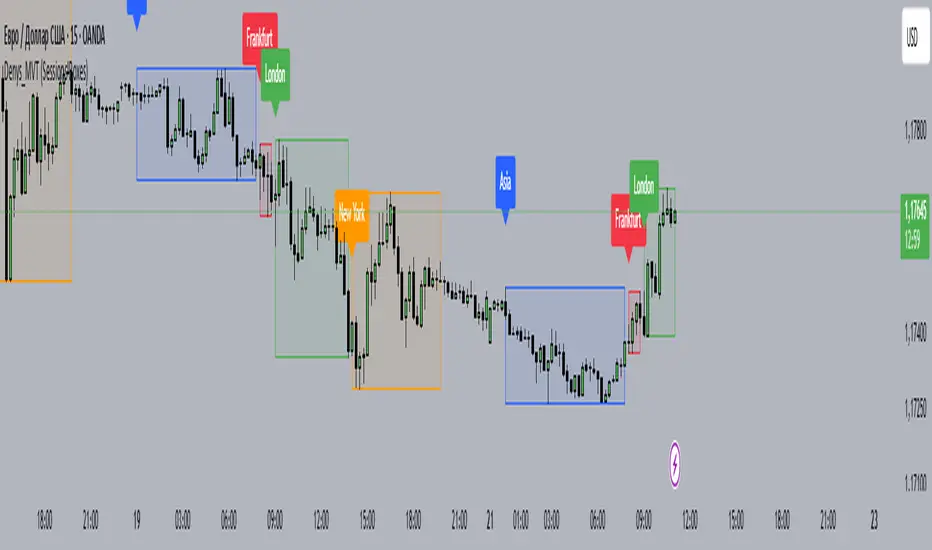
- **Asia Session Detection**: Automatically identifies the Asia session based on user-defined time settings (default: 0000-0845 UTC).
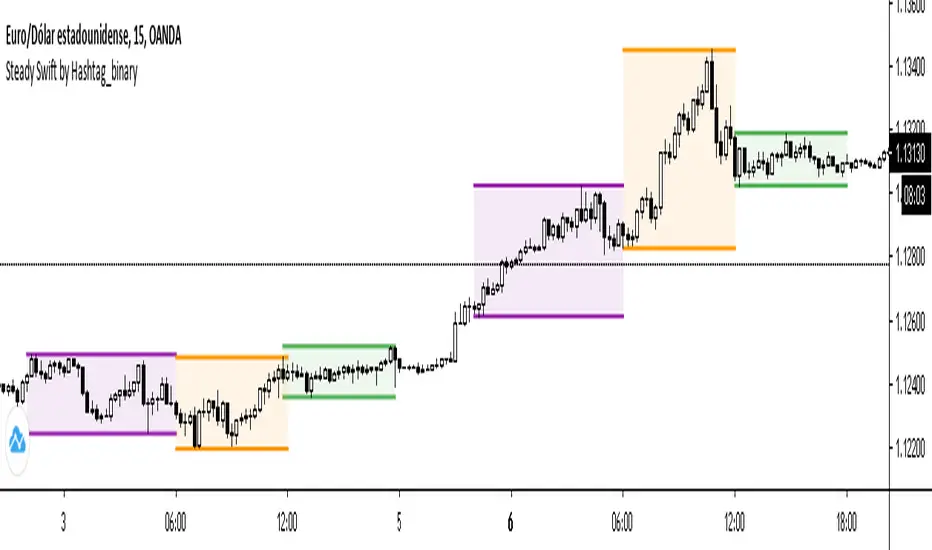
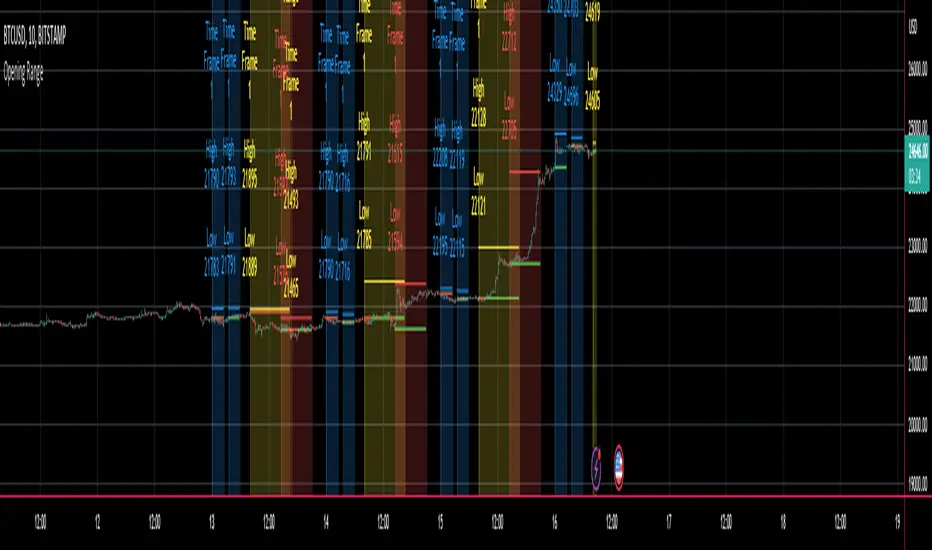
- **High/Low Line Plotting**: Displays high and low price levels for the session with customizable colors and line styles.
- **Line Extensions**: Option to extend session high/low lines for future price action reference.
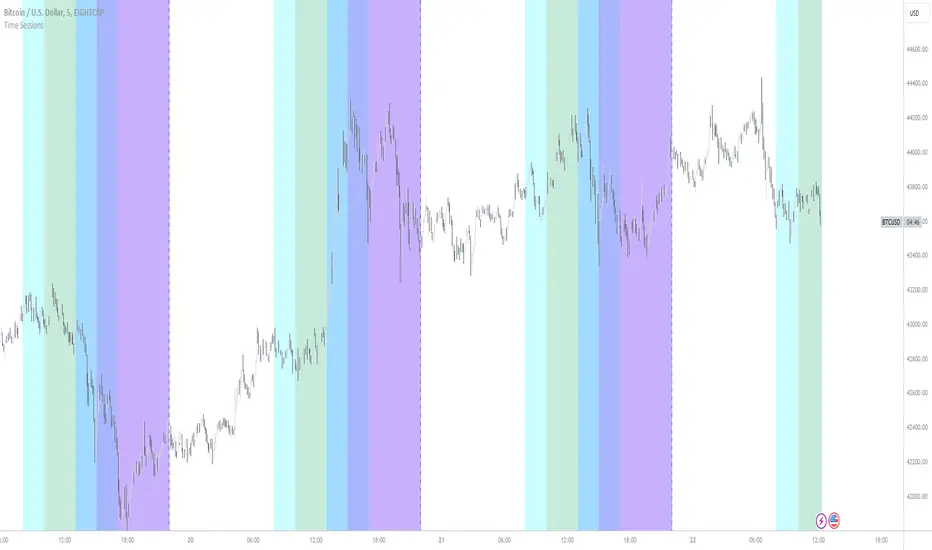
- **Session Background Fill**: Adds an optional colored background to highlight the Asia session period.
- **Day Labels**: Includes labels for the session high/low levels with the corresponding day of the week.
- **Dynamic Session History**: Limits the display to a user-specified number of past sessions (default: 7) to keep the chart clean and focused.
- **Customizable Colors**: Highlights Mondays with unique colors for easy identification, while other weekdays use a different scheme.
### Use Cases:
- Identify key session levels for trading strategies.
- Monitor Asia session dynamics and their impact on subsequent sessions.
- Spot significant price reactions around session highs/lows.
### Inputs:
- **Session Time**: Adjust the session time to match your preferred Asia trading hours.
- **Toggle High/Low Lines**: Enable or disable the plotting of session highs and lows.
- **Line Extensions**: Extend the session high/low lines into future bars for better visualization.
- **Background Highlight**: Toggle a colored background for the Asia session.
- **Maximum Sessions**: Define how many past sessions to display for clarity.
This script is perfect for intraday traders, scalpers, and swing traders looking to gain insight into the Asia session and its influence on global markets. Fully adjustable and easy to use, it enhances your chart with critical information at a glance.
Simply add it to your TradingView chart, configure your settings, and let it do the work for you!
Pine Script® indicator