Liquidity, SMC & SessionsLiquidity, SMC & SessionsOverview
The Liquidity, SMC & Sessions Master is an all-in-one comprehensive toolkit designed for traders utilizing Smart Money Concepts (SMC) and ICT methodologies.
Trading often requires juggling multiple tools to see the full picture: market structure for direction, liquidity levels for targets, and time-based sessions for volatility. This indicator consolidates these critical data points into a single, clean chart overlay, allowing you to focus on execution rather than analysis.
1. The Concepts
This indicator is built on three pillars of institutional trading:
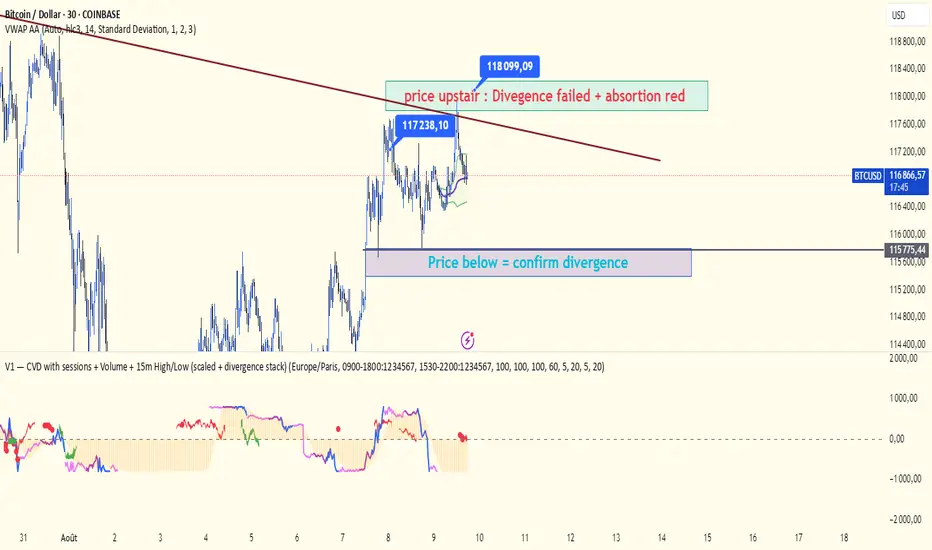
Liquidity : Markets seek liquidity. This script automatically identifies Buy-Side Liquidity (BSL) and Sell-Side Liquidity (SSL) across multiple timeframes (Daily, 4H, 1H, 15m). These levels act as magnets for price, often marking areas where a reversal or acceleration will occur.
Market Structure : Understanding who is in control is vital. The indicator maps out both Swing Structure (Major trends) and Internal Structure (Minor trends), marking Break of Structure (BOS) for continuations and Change of Character (CHoCH) for potential reversals.
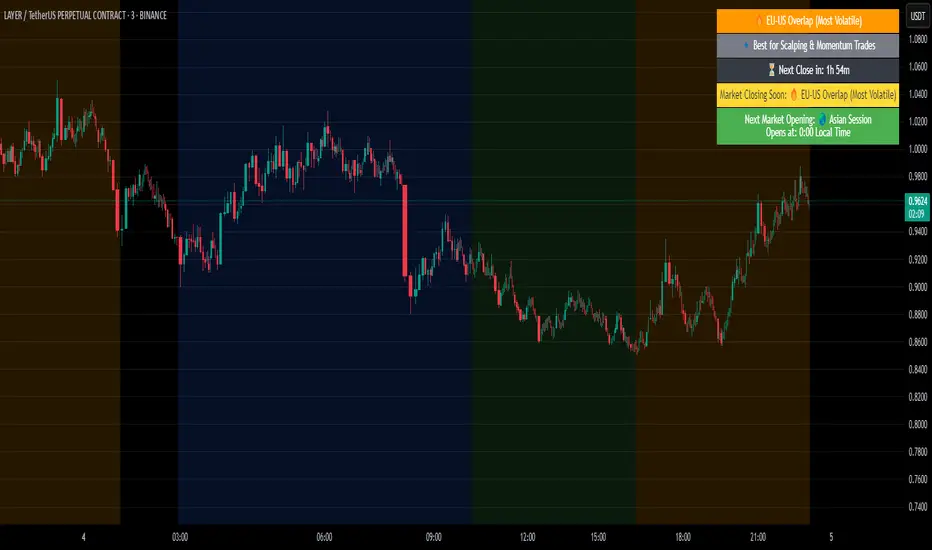
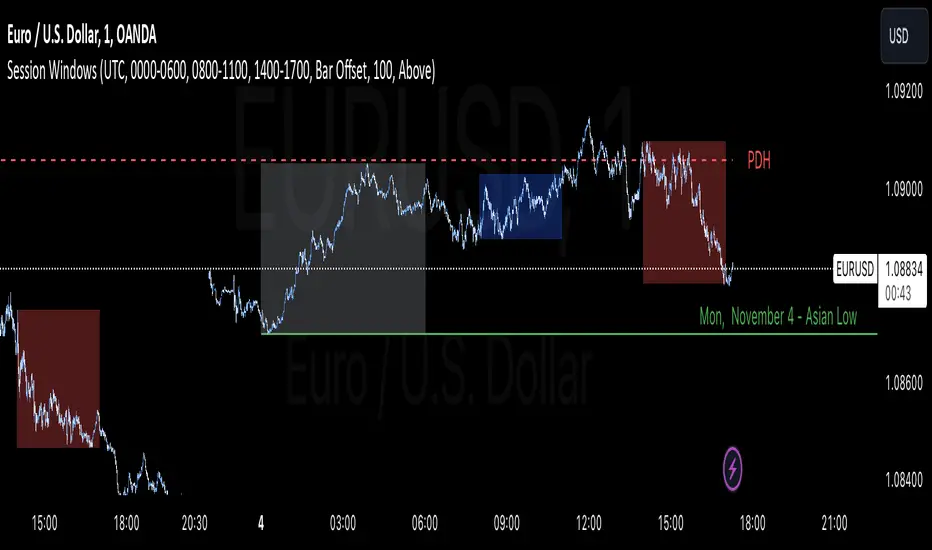
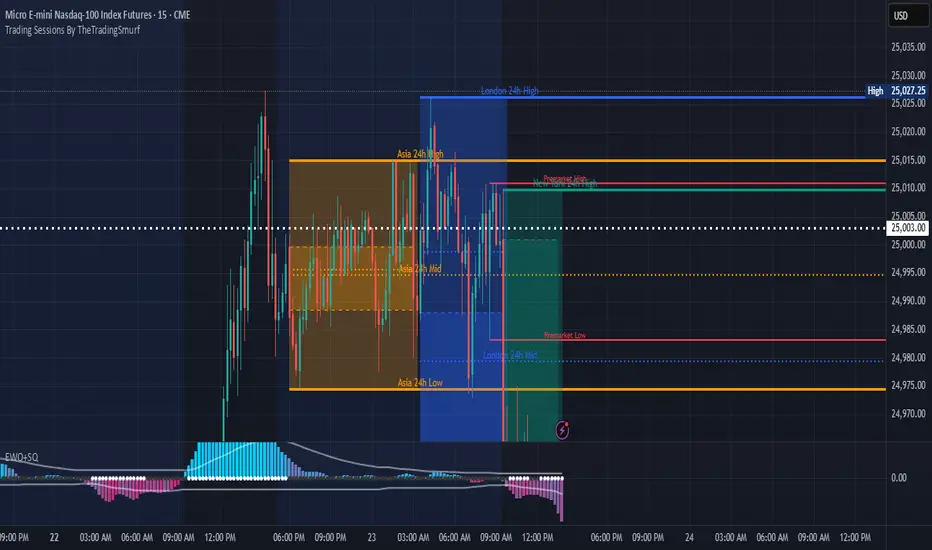
Sessions : Price delivery is algorithmic. The indicator highlights key trading sessions (Asian, London, NY) and specific models like the Asian Stop Hunt and Central Bank Dealer Range (CBDR), helping you anticipate when volatility is likely to inject into the market.
2. Key Features
Multi-Timeframe Liquidity: Automatically plots previous Highs and Lows (BSL/SSL) for D, 4H, 1H, and 15m timeframes with customizable lookbacks.
Advanced Market Structure:
Real-time labeling of BOS and CHoCH.
Differentiation between Swing (Macro) and Internal (Micro) structure.
Strong vs. Weak High/Low labels to identify protected structural points.
SMC Arrays:
Fair Value Gaps (FVG): Auto-detection of imbalances with customizable width filters.
Balanced Price Ranges (BPR): Highlights aggressive rebalancing areas with mitigation tracking.
Premium & Discount Zones: Automatically draws Fibonacci zones based on the current dealing range to help you buy low and sell high.
Session Models:
Asian Stop Hunt Model: Highlights the Asian session range to trade the subsequent breakout/fakeout.
CBDR & IPDA: Visualizes the Central Bank Dealer Range and includes a manual bias checklist.
Educational Dashboard: An on-screen panel to keep your daily trading rules or targets front and center.
3. How to Use
This tool is designed to support a "Top-Down" analysis approach directly on your execution chart.
Strategy A: The Liquidity Sweep & Reversal
Identify Targets: Look for price approaching a Higher Timeframe BSL or SSL line (e.g., a Daily High).
Wait for the Sweep: Watch for price to pierce this level but fail to close beyond it (a wick rejection).
Confirm Reversal: Wait for a Change of Character (CHoCH) label to appear in the opposite direction on your trading timeframe.
Entry: Enter on the return to a Fair Value Gap (FVG) or BPR created during the displacement.
Strategy B: Trend Continuation
Determine Bias: Observe the Swing Structure labels. If the market is printing "Bullish BOS", the trend is up.
Wait for Pullback: Allow price to retrace into the Discount Zone (Green box automatically drawn < 50% of range).
Entry Trigger: Look for an Internal CHoCH (Bullish) inside the Discount Zone to align with the Swing Trend.
Target: Aim for the Weak High (Swing High) as your take-profit level.
Strategy C: The Asian Stop Hunt
Enable the Asian Model in settings.
Wait for the Frankfurt/London open.
If price aggressively breaks the Asian High but creates a reversal pattern (CHoCH) immediately after, this is a potential "Judas Swing" (Fakeout).
Target the opposing side of the Asian Range (Asian Low) as liquidity.
Settings & Customization
Style: Choose between "Colored" or "Monochrome" to fit your chart aesthetic.
Visibility: Every feature (Liquidity, Structure, Sessions, FVG) can be toggled on or off individually to keep your chart clean.
Alerts: Built-in alerts for BOS, CHoCH, and FVG detection allow you to step away from the charts without missing setups.
Disclaimer
This indicator is for educational and analytical purposes only. Past performance of any trading system or methodology is not necessarily indicative of future results. Always practice proper risk management.
Pine Script® indicator