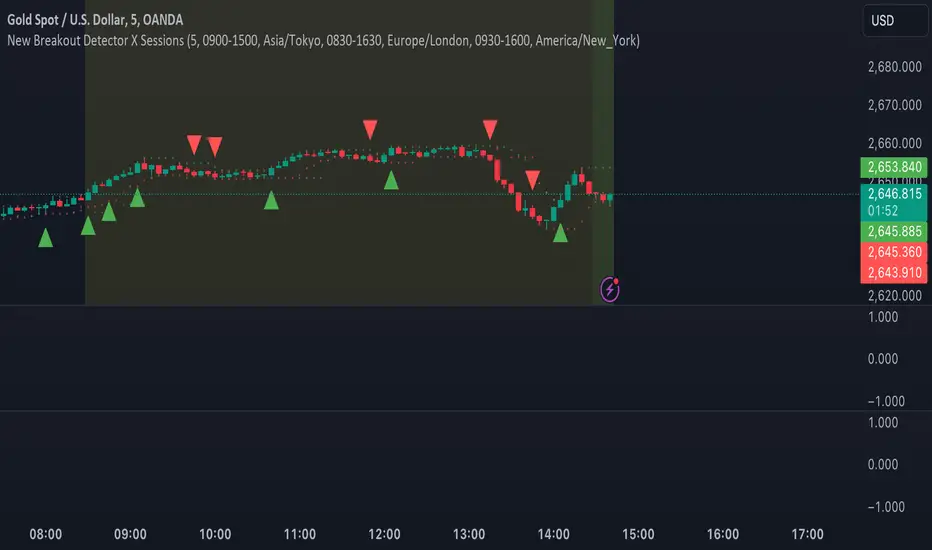
MJForex Breakout Detector X SessionsThis Pine Script code is a Breakout Detector with Trading Session highlights for use on a financial chart. Here's a detailed breakdown of its functionality:
1. Breakout Detection
The main purpose of this script is to detect breakouts based on specific price levels (like highs and lows) within a given lookback period. It identifies different types of breakouts in real time, specifically:
Higher High (HH): The highest price in the lookback period is exceeded, suggesting bullish momentum.
Higher Low (HL): A low that is higher than the previous low, which might indicate a potential upward trend continuation.
Lower High (LH): The price makes a lower high than the previous high, indicating a possible downward reversal.
Lower Low (LL): A low that is lower than the previous low, indicating bearish momentum.
Breakout Logic:
A buy signal is generated when there is a breakout above a Higher High or a Higher Low, signaling a potential bullish trend.
A sell signal is generated when there is a breakout below a Lower High or a Lower Low, signaling a potential bearish trend.
These signals are plotted on the chart using shapes (green triangles for buy signals and red triangles for sell signals).
2. Candle Body vs. Wick Consideration
The indicator allows you to choose whether the breakout is detected based on the candle body (the open and close prices) or the wick (the high and low prices).
This is controlled by a user input (use_body), so you can switch between these modes depending on your preference.
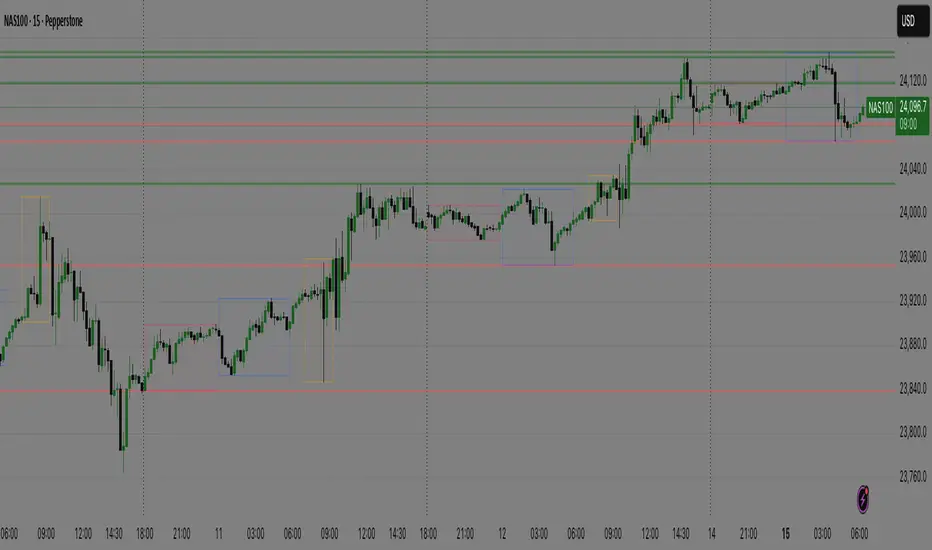
3. Trading Session Highlights
The script also visually highlights different trading sessions on the chart. Three sessions can be configured:
First Session (e.g., Asia/Tokyo)
Second Session (e.g., Europe/London)
Third Session (e.g., America/New York)
Each session is colored differently on the chart's background (blue, yellow, and green), helping you easily visualize which trading session is currently active.
4. Real-Time Alerts
The script generates real-time alerts when a breakout occurs.
Alerts are sent based on the current price action without waiting for the candle to close, which helps traders respond quickly to potential breakout signals and be aware of the particular zone or area.
Alerts:
A Buy alert is triggered when there's a Higher High (HH) or Higher Low (HL) breakout.
A Sell alert is triggered when there's a Lower High (LH) or Lower Low (LL) breakout.
These alerts can be used to notify traders when certain breakout conditions are met, allowing them to take action immediately.
5. Customizability
The script allows for several customizable inputs:
Lookback Period: The number of bars used to calculate the highest high and lowest low (default is 5).
Breakout Detection Toggle: You can choose whether to show the breakout signals on the chart.
Session Visibility: You can turn on/off the visual highlights for the trading sessions.
Body/Wick Toggle: You can select whether to consider the candle body or the wick when detecting breakouts.
In Summary:
Breakout Detection: Detects and highlights Higher High, Higher Low, Lower High, and Lower Low breakouts on the chart, generating buy/sell signals.
Candle Body/Wick Option: You can choose to detect breakouts based on the body or wick of the candle.
Real-Time Alerts: Sends alerts as soon as a breakout occurs, without waiting for the candle to close.
Trading Session Highlights: Highlights different global trading sessions for easy visual reference on the chart.
This indicator is particularly useful for traders who want to identify key breakouts and visually track trading sessions across different markets.
Pine Script® indicator