How To Limit Repeating SignalsAn example of how to limit the input number of allowed signals using a function containing a condition counter with a reset.
Search in scripts for "signal"

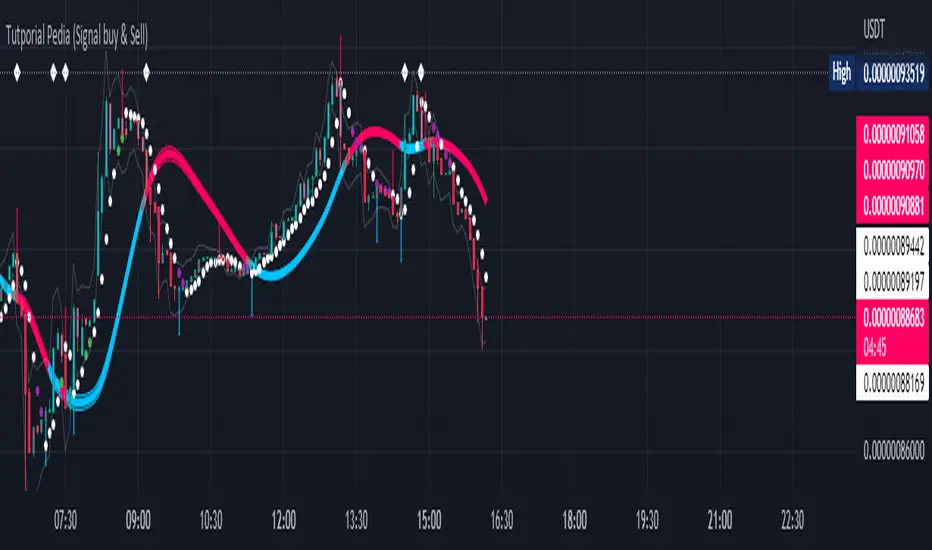
Tutporial Pedia (Signal buy & Sell)Untuk mempermudah kita dalam bermain dan memahami Signal Trade View Rate 98 %
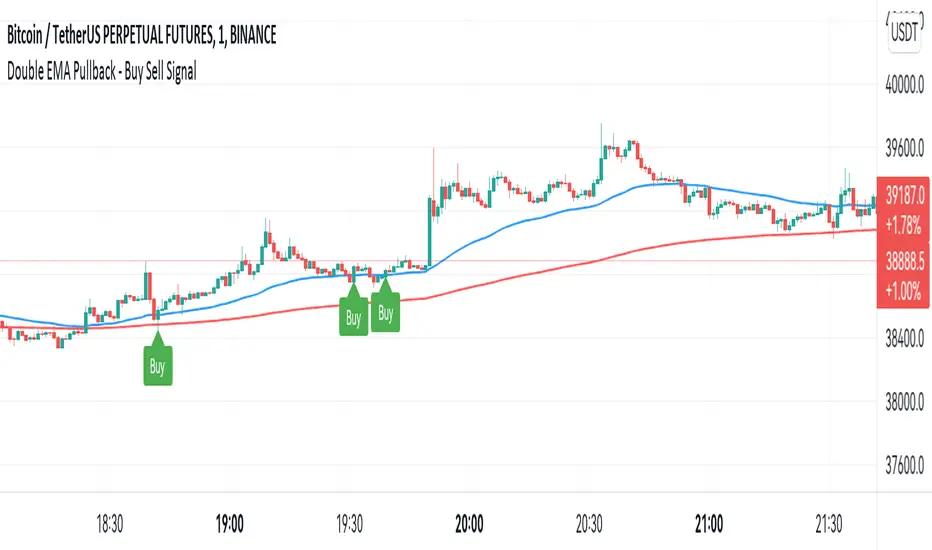
Double EMA WIth Pullback Buy Sell Signal - Smarter AlgoBuilt with love "Double EMA With Pullback Buy Sell Signal "
This indiator will help you to find a Double EMA Pullback Signal
You can combine with your own strategy, or use this purely
DISCLAIMER :
Measure the risk first before use it in real market
Backtest The Strategy was very important, so you know the probability
Fundamentally Logical :
Pullback (Some Previous candle is Red for Bull Pullback vice versa)
the Entry candle must be a Candlestick Pattern
Features :
1. Double EMA
2. Pullback Signal
How to use it :
1. Adjust the Pullback Backstep
2. Adjust the EMA Period
3. Adjust the Style to your preferences
Regards,
Hanabil
Average True Range (VStop) Cloud SignalsThis indicator extends the built-in Volatility Stop indicator to a visual signals type indicator based on the crossover of a small VStop value (default 1.5x ATR) and a larger VStop value (default 3x ATR). The two values form a "cloud" with default coloring based on RSI/strength of trend.

P-Signal GravityP-Signal Gravity will help you choose a trading strategy, taking into account volatility and exchange commissions. The white circles indicate the probabilistic position of the virtual center of gravity. The reliability parameter determines the probability of finding such a center of gravity. The table shows the latest price and the expected P/L, taking into account the exchange commission, which is also a parameter. Due to the overlay type of indicator, the table also contains p-signal values and its increment.

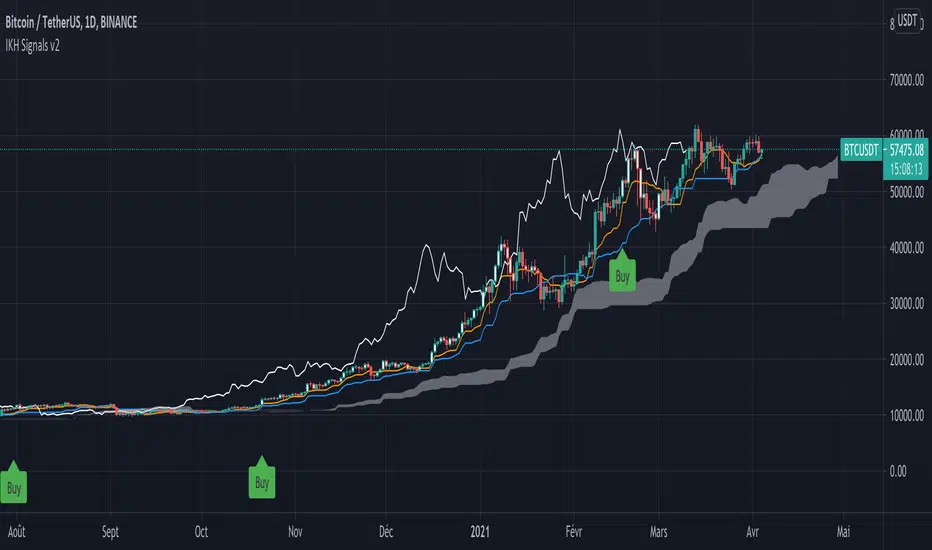
IKH Signals v2Hi,
I'm happy to release this new update after few weeks working.
Fixes
Fix kumo break-out of Chiku span and close price
Fix buy trigger and strong buy trigger
Improvement
Signals take now the kumo thickness and kumo angle
Signals does not trigger on doji candles
Multi time frame validation is now available
I hope this fixes and new features will improve the signals for you too.
Let me know if you find strange behavior or possible improvments.
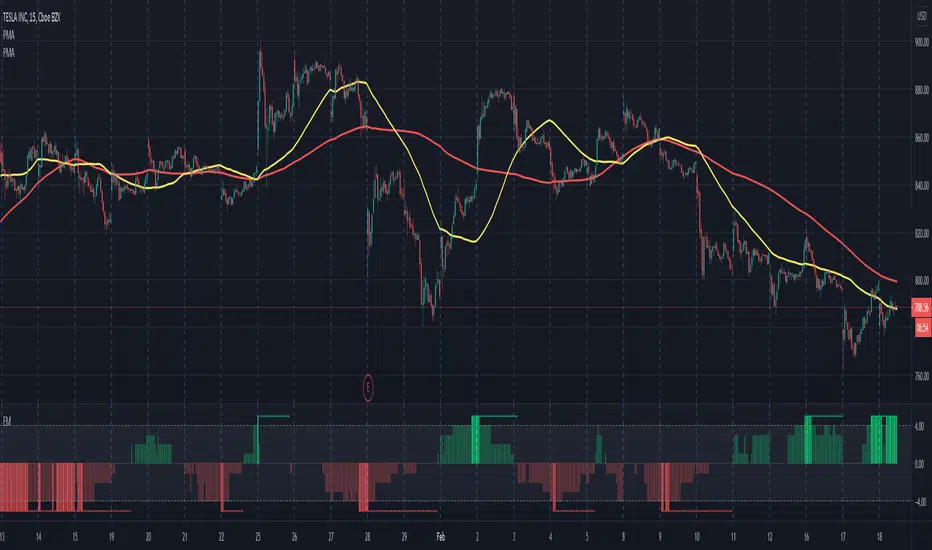
Electrified Momentum Signal (Prototype)This indicator uses an ensemble of different indicators to help in identifying significant changes in momentum.
It's time-frame is constant and is based up on the length of the configurable period. This allows for a consistent signal across multiple time-frames.
This is not a buy or sell signal but can be used for alerts to indicate a change in momentum that might be worth paying attention to.
If looking for an long entry point, a negative (red) value can signal "don't buy yet" or may simple mean "it's risky". In a similar way if looking for a short, a positive (green) value can signal "not now".
Note: "Electrified" does not mean this has anything to do with electric vehicles or the power grid. :P
MACD and EMA200 With SignalsThis is my first indicator. It PROVIDES BUY, SHORT, and FALSE Signals by taking the MACD and the 200EMA.

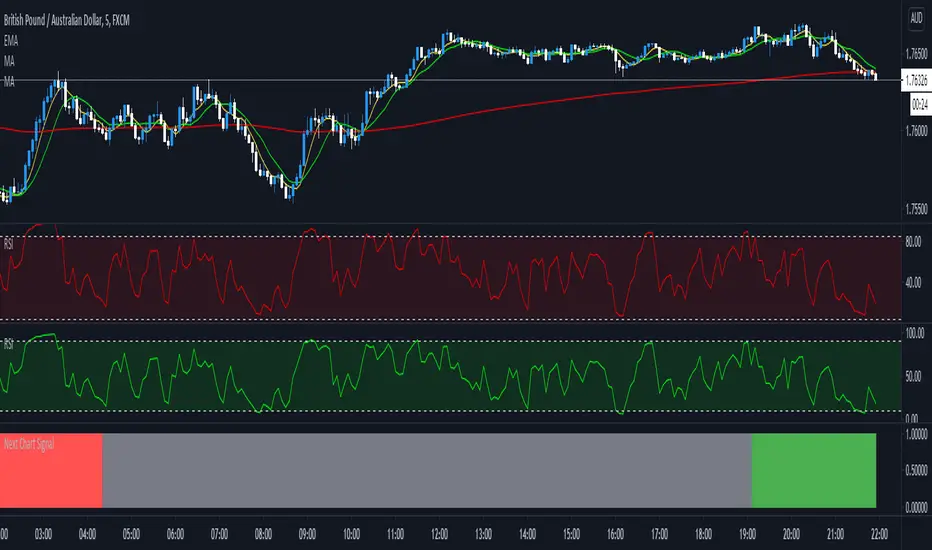
Next Chart SignalGives you the signal when 3 MA's are crossing from the higher time frame above the current chart.
Elliott Wave Oscillator Signals by DGTElliott Wave Principle , developed by Ralph Nelson Elliott, proposes that the seemingly chaotic behaviour of the different financial markets isn’t actually chaotic. In fact the markets moves in predictable, repetitive cycles or waves and can be measured and forecast using Fibonacci numbers. These waves are a result of influence on investors from outside sources primarily the current psychology of the masses at that given time. Elliott wave predicts that the prices of the a traded currency pair will evolve in waves: five impulsive waves and three corrective waves. Impulsive waves give the main direction of the market expansion and the corrective waves are in the opposite direction (corrective wave occurrences and combination corrective wave occurrences are much higher comparing to impulsive waves)
The Elliott Wave Oscillator (EWO) helps identifying where you are in the 5-3 Elliott Waves, mainly the highest/lowest values of the oscillator might indicate a potential bullish/bearish Wave 3. Mathematically expressed, EWO is the difference between a 5-period and 35-period moving average based on the close. In this study instead 35-period, Fibonacci number 34 is implemented for the slow moving average and formula becomes ewo = ema(source, 5) - ema(source, 34)
The application of the Elliott Wave theory in real time trading gets difficult because the charts look messy. This study (EWO-S) simplifies the visualization of EWO and plots labels on probable reversals/corrections. The good part is that all plotting’s are performed on the top of the price chart including a histogram (optional and supported on higher timeframes). Additionally optional Keltner Channels Cloud added to help confirming the price actions.
What to look for:
Plotted labels can be used to follow the Elliott Wave occurrences and most importantly they can be considered as signals for possible trade setup opportunities. Elliott Wave Rules and Fibonacci Retracement/Extensions are suggested to confirm the patters provided by the EWO-S
Trading success is all about following your trading strategy and the indicators should fit within your trading strategy, and not to be traded upon solely
Disclaimer : The script is for informational and educational purposes only. Use of the script does not constitutes professional and/or financial advice. You alone the sole responsibility of evaluating the script output and risks associated with the use of the script. In exchange for using the script, you agree not to hold dgtrd TradingView user liable for any possible claim for damages arising from any decision you make based on use of the script

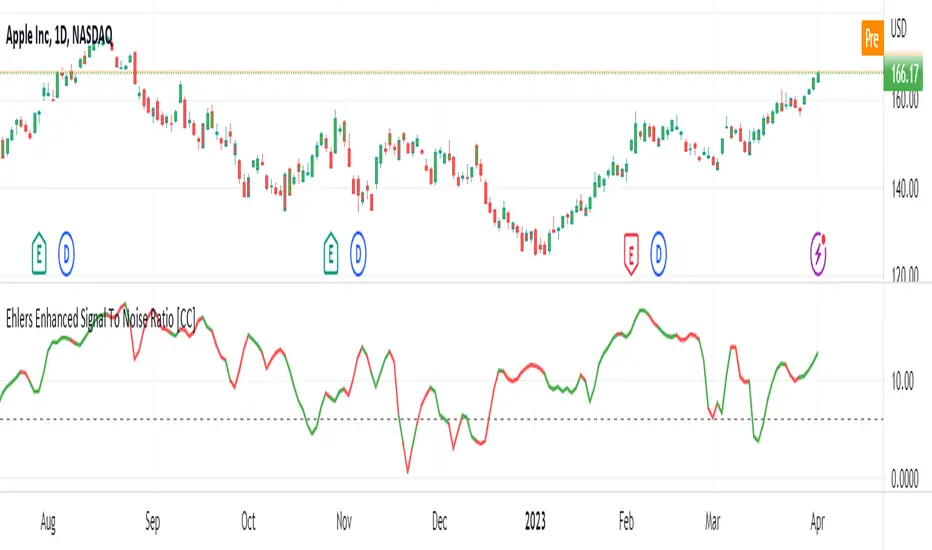
Ehlers Enhanced Signal To Noise Ratio [CC]The Enhanced Signal To Noise Ratio was created by John Ehlers (Rocket Science For Traders pgs 87-88) and this is my favorite Ehlers Signal To Noise Ratio indicator. Scalpers like to use this indicator because when it is above the dotted line then the stock is trending and not trading sideways. Buy when the indicator line is green and sell when it is red.
Let me know when you want to see me publish other indicators or if you want something custom done!
Ehlers Signal To Noise Ratio [CC]The Signal To Noise Ratio was created by John Ehlers (Rocket Science For Traders pgs 81-82) and this indicator is perfect for all of the scalpers out there! This will let you know when the stock is at a high volatility or not and when to buy or sell. If the indicator crosses over the dotted line then that means the stock is volatile and it is trading flat then it will be below the dotted line. Buy when the indicator line is green and sell when it is red.
This was a custom request so let me know if there are any other scripts you would like me to publish or if you want something custom done!

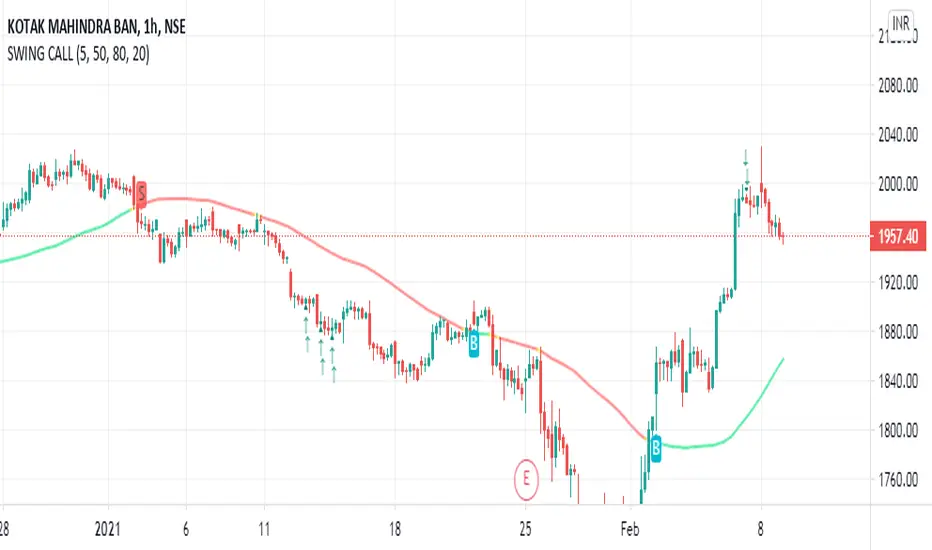
SWING TRADE SIGNALSBUY & SELL Signals for higher timeframes based on Ema & Sma with RSI overbought/oversold dots for possible reversal indication.
It can be used for booking profit in the existing trade and take fresh position once the new candle breaks the high/low of alert candle depending upon the side.
Best work with 1h+ timeframes.
QQE signalsConverted the QQE oscillator to in-chart long and short signals with built in alerts. This is multi-timeframe and quite robust.

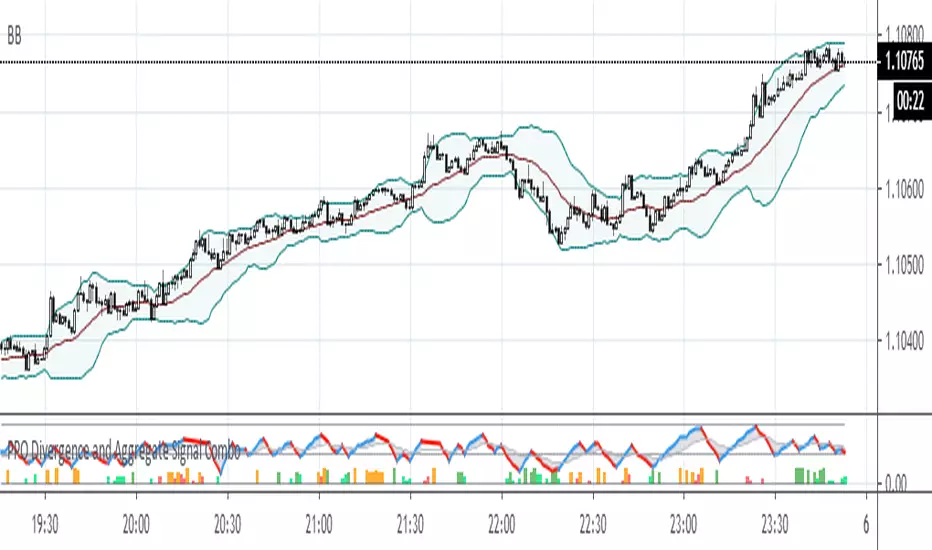
PPO Divergence and Aggregate Signal ComboThis is a further development of the last two posts on aggregated signal generation. It shows how to implement the idea in conjunction with another indicator. In this case general rule for long and short entry: the aggregated curve (gray) must cross the mid-line. Colored columns serve as an early warning. Settings were tested with EURUSD in 5m, 30m and 1H TFs.
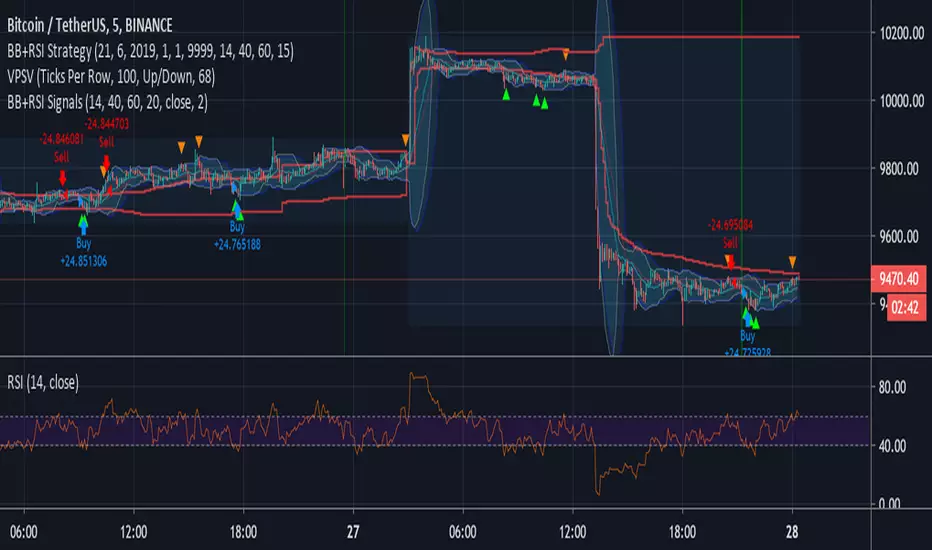
Bollinger + RSI Signals (by Bader Kamal)This idea originally by ChartArt on January 14, 2015 as Strategy, and I modify it to become as Signals on 26 July 2019.
This signals uses a modified RSI to sell when the RSI increases over the value of 60 (or to buy when the value falls below 40), with the classic Bollinger Bands strategy to sell when the price is above the upper Bollinger Band (and to buy when this value is below the lower band).
This signals only triggers when both the RSI and the Bollinger Bands indicators are at the same time in a overbought or oversold condition.
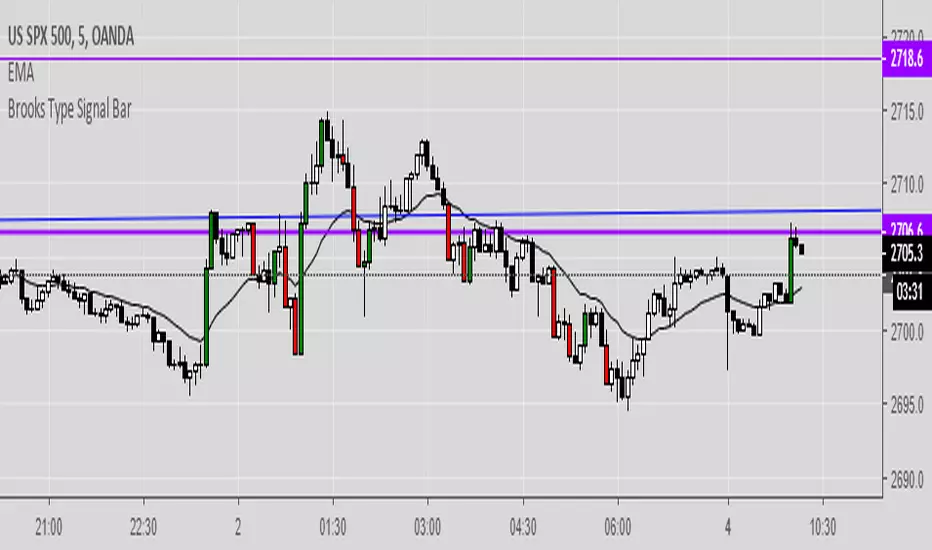
Brooks Type Signal BarIndicates "strong bars" similar to how Al Brooks defines them in his book-- these don't necessarily trigger entries but can be points of interest.
2-3 points as a signal bar size seems to work well, depending upon volatility.
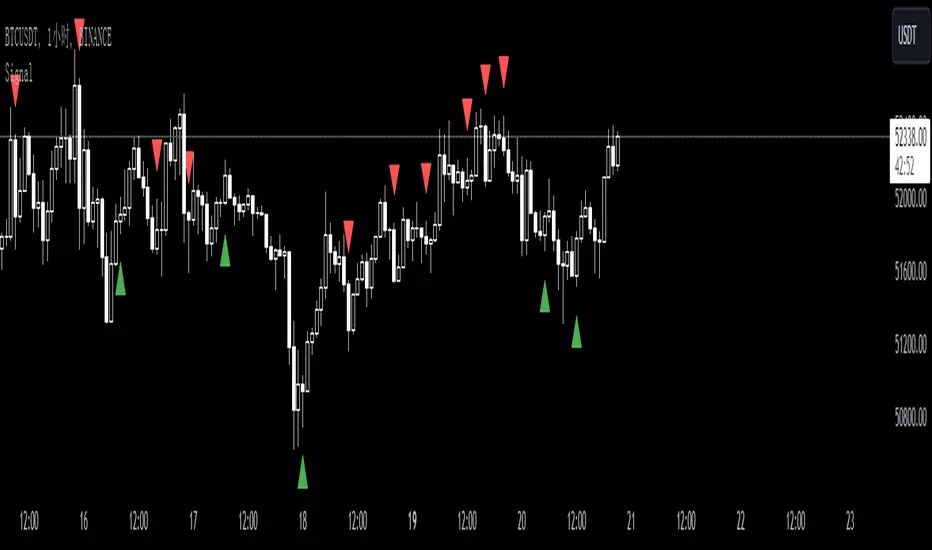
SignalThis custom TradingView indicator, named "Signal," is designed to generate buy and sell signals based on the Stochastic Oscillator, a momentum indicator that compares a particular closing price of an asset to a range of its prices over a certain period of time. The indicator is set to overlay on the price chart, providing visual cues for potential trading opportunities.
Key features of the "Signal" indicator include:
1. **Dynamic Period Adjustment**: The indicator automatically adjusts its settings based on the chart's time frame. For a 1-hour (60 minutes) chart, the stochastic length is set to 15, while for a 15-minute chart, the length is set to 10.
2. **Stochastic Calculation**: It calculates the %K line as a smoothed moving average (SMA) of the stochastic ratio, and the %D line as an SMA of the %K line, with both lines smoothed over a period derived from the dynamic length setting.
3. **Signal Detection**: The indicator identifies bullish crossovers (golden crosses) when the %K line crosses above the %D line and the average of both lines is below 50. Conversely, it detects bearish crossovers (death crosses) when the %K line crosses below the %D line and the average is above 50.
4. **Signal Confirmation**: Signals are confirmed using historical data with an offset of 1 bar to ensure that the crossover is evaluated after the close of the candlestick, thus avoiding repainting issues.
5. **Visual Indicators**: Buy signals are represented by green upward-pointing triangles placed below the bars, while sell signals are indicated by red downward-pointing triangles above the bars.
6. **Alerts**: The indicator includes alert conditions for both golden crosses and death crosses, notifying users when a potential buy or sell signal has been identified based on the stochastic crossover.
This indicator can be a valuable tool for traders who follow stochastic momentum signals and prefer to have dynamic adjustments based on the chart's time frame. It is important to note that, as with all trading indicators, the "Signal" indicator should be used in conjunction with other forms of analysis to confirm trading signals and manage risk effectively.
SignalsThis script allows you to calculate position size, and future profit, loses.
- You can add 3 target values and 1 stop loss
- Optionally you can display table, position it as you like, and see risk ratio
Plans:
- add profit loss to the labels

Signals Pro [traderslog]The "Signals Pro" indicator is an advanced and versatile trading tool designed to help traders accurately identify key buy and sell signals using a combination of technical analysis factors such as candle patterns , RSI (Relative Strength Index) , and candle stability . It is highly customizable and offers a range of options that make it suitable for both short-term and long-term traders. By filtering market noise and providing actionable insights, this indicator enhances decision-making and helps traders capitalize on market movements.
At the core of the "Signals Pro" indicator is the concept of Candle Stability . The Candle Stability Index measures the ratio between a candle's body and its wicks, providing insight into the strength of the price movement during that period. A higher value indicates that the candle is more stable, meaning that the price has moved significantly without much retracement. This stability filter is crucial because it prevents the generation of signals during volatile or choppy market conditions where price direction is uncertain. Traders can adjust the Candle Stability Index from 0 to 1, allowing for precise control over how stable a candle must be for the indicator to generate a signal.
Another key feature is the use of RSI (Relative Strength Index) , a momentum oscillator that measures the speed and change of price movements. The RSI index parameter in the indicator can be customized to detect overbought or oversold conditions. When the RSI falls below the defined threshold, it signals that the market may be oversold , which can indicate a potential buying opportunity . Conversely, when the RSI exceeds a certain value, it suggests that the market is overbought , signaling a potential selling opportunity . This allows traders to time their trades more effectively by entering when market conditions are favorable and exiting before a potential reversal occurs.
The Candle Delta Length is another critical element of the "Signals Pro" indicator. This parameter measures how much the price has increased or decreased over a specific number of candles. By adjusting the Candle Delta Length , traders can define how many periods the indicator should analyze before generating a signal. A longer Candle Delta Length means the price has been trending in one direction for a longer period, providing more reliable signals. For instance, if the price has been steadily decreasing for five candles, this could signal a bullish reversal , triggering a buy signal .
To further enhance its accuracy, the "Signals Pro" indicator includes a unique feature that allows traders to disable repeating signals . This is particularly useful in situations where the market is moving sideways or during low volatility periods, where multiple signals may cluster close together, creating confusion. By enabling the disable repeating signals option, traders can prevent these repeated signals and focus on the most important and confirmed signals, ensuring cleaner charts and reducing the risk of overtrading.
A key technical aspect of the indicator is its ability to detect bullish and bearish engulfing patterns . The indicator looks for bullish engulfing patterns, which occur when a bullish candle fully engulfs the body of the previous bearish candle, signaling a potential bullish reversal . Conversely, bearish engulfing patterns occur when a bearish candle fully engulfs the previous bullish candle, indicating a bearish reversal . By incorporating these candle patterns with the Candle Stability Index and RSI levels , the indicator provides highly reliable signals based on price action and market sentiment.
Visual customization is another major advantage of the "Signals Pro" indicator. Traders can choose from several different label styles , such as text bubbles , triangles , or arrows to mark the buy and sell signals on the chart. This makes the signals stand out and easy to interpret at a glance. Furthermore, the color of these signals can be customized: green for buy signals and red for sell signals , along with options to adjust the text size and label styles for even more personalization. Traders can make the signals more or less prominent based on their preference, enhancing readability and workflow efficiency.
The indicator also includes a comprehensive alert system , ensuring traders never miss an opportunity. Alerts can be set for both buy and sell signals , and the system triggers in real-time when a valid signal is generated. This is especially useful for active traders who want to stay on top of the markets without constantly monitoring their screens. The alert system helps ensure that traders are notified of potential trading opportunities as soon as they arise, allowing them to act quickly in volatile markets.
From a practical standpoint, the "Signals Pro" indicator is designed to work seamlessly across multiple timeframes, making it suitable for scalpers, day traders, swing traders, and even long-term investors. Its flexibility allows it to adapt to different trading styles and time horizons, providing value for a wide range of market participants.
In summary, the Signals Pro indicator offers a robust and customizable solution for identifying buy and sell signals . By combining candle stability , RSI analysis , and engulfing patterns , the indicator provides traders with reliable signals to enter or exit trades. The ability to customize signal appearance, coupled with a real-time alert system , makes the "Signals Pro" indicator an invaluable tool for traders looking to improve their timing and decision-making. Whether you are looking to capture short-term price movements or want to time entries and exits in longer-term trends, this indicator offers the insights needed to navigate the markets with confidence.

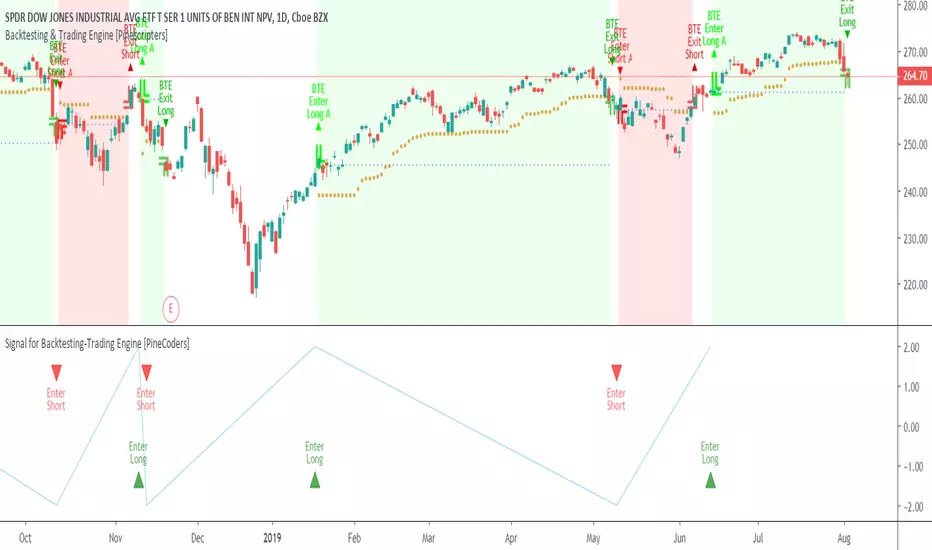
Signal for Backtesting-Trading Engine [PineCoders]This is a companion script to the PineCoders Backtesting-Trading Engine. It illustrates how to build a signal plot in another script, which can in turn be fed in the Engine to provide entry, exit, filter and stop information.
Connection to the Engine is done through its “External Indicator” input field at the very bottom of the Engine’s Settings/Inputs.
The Engine must be operating in study mode to be able to connect an external indicator to it.
The way this script builds the signal is straightforward, as you will see in the code. Two aspects are worth mentioning:
The “FudgeStop()” function used to fudge the stop value by one tick for the rare cases where it will match one of the protocol reserved values, i.e. 1, 2 or 3.
The priority and exclusivity given to the different types of signals in the signal-building “Signal = …” line. No two signals can be sent simultaneously through the signal plot, except for the entry and stop combination.
You can determine in this script’s Settings/Inputs the type of signals that will go through the signal plot.
This script respects the following protocol:
EXTERNAL SIGNAL PROTOCOL
Only one external indicator can be connected to a script; in order to leverage its use to the fullest, the engine provides options to use it as either an entry signal, an entry/exit signal or a filter. When used as an entry signal, you can also use the signal to provide the entry’s stop. Here’s how this works:
For filter state: supply +1 for bull (long entries allowed), -1 for bear (short entries allowed).
For entry signals: supply +2 for long, -2 for short.
For exit signals: supply +3 for exit from long, -3 for exit from short.
To send an entry stop level with an entry signal: Send positive stop level for long entry (e.g. 103.33 to enter a long with a stop at 103.33), negative stop level for short entry (e.g. -103.33 to enter a short with a stop at 103.33). If you use this feature, your indicator will have to check for exact stop levels of 1.0, 2.0 or 3.0 and their negative counterparts, and fudge them with a tick in order to avoid confusion with other signals in the protocol.
Remember that mere generation of the values by your indicator will have no effect until you explicitly allow their use in the appropriate sections of the Engine’s Settings/Inputs.
Look first. Then leap.