ICT Base Candle with Volume Filter📘 ICT BASE CANDLE WITH VOLUME FILTER
Institutional Base Candle Detection System
Smart Money Concepts (SMC/ICT)
🔍 What This Indicator Does
ICT Base Candle with Volume Filter automatically detects institutional Base Candles—also known as pause candles, decision candles, compression candles, or repricing pauses.
These candles often appear at key algorithmic points:
After a displacement
After a liquidity sweep
Before a fair value gap reaction
Inside an Order Block (OB)
At premium/discount zones
Before large expansions
This tool highlights these candles using:
✔ Body-percentage filtering
✔ Optional volume-based filtering
✔ Bullish/Bearish color coding
✔ Optional labels (+ / –)
✔ Accurate fixed historical plotting
✔ Customizable settings
This makes it extremely useful for SMC, ICT, and algorithmic orderflow traders.
🎯 Why Base Candles Matter (SMC/ICT Context)
The market moves in an algorithmic sequence:
Liquidity Sweep (grab stops above/below)
Displacement (strong impulse candle)
Base Candle (pause candle before continuation)
Expansion / Reversal
Base candles indicate:
Loss of momentum
Repricing
Order absorption (buy/sell programs)
Potential mitigation zones
Possible entry (continuation)
Possible reversal (if sweep + base + displacement)
They act as footprints of algorithmic activity, confirming where smart money is momentarily active.
🎨 Indicator Features
✔ Customizable Base Candle Colors
Choose unique colors for bullish and bearish base candles.
Option to use the same color for both.
✔ Volume Filter
Enable/disable volume filtering
Adjust lookback and threshold values.
✔ Label Toggles
Display “+” above bullish base candles
Display “–” below bearish base candles
✔ Fixed Historical Markers
All detected base candles remain consistent as bars update.
✔ Tooltip-Enhanced Inputs
Includes advanced trading notes inside input tooltips.
📈 How to Use (Practical Guide)
1️⃣ Identify the Impulse
Look for strong displacement or impulsive candles.
2️⃣ Locate the Base Candle
A small-body candle directly following a displacement.
3️⃣ Validate With Volume (Optional)
Low volume confirms a pause in the algorithm's movement.
4️⃣ Use It With SMC Tools
Base candles work best when aligned with:
FVGs
Order Blocks
BOS / CHoCH
Liquidity sweeps
Premium/discount equilibrium
5️⃣ Entry Model (Example)
Continuation Model:
Displacement
Base Candle forms (small body)
Enter on break of base candle
SL beyond candle wick
TP at liquidity / FVG end
📌 Example Explanation
A bullish impulse appears → price pauses → forms a bullish base candle → FVG below → price mitigates → resumes trend.
This indicator marks the base candle and helps you visualize where the algorithm slowed down before continuing the move.
🚫 Limitations & Notes
This is not a buy/sell signal indicator
It highlights context, not trades
Must be combined with structure & liquidity analysis
Volume filter is optional and should be tested per asset
🔒 Invite-Only Access (If Applicable)
If published as Invite-Only, include this:
Access is manually approved
Redistribution is not allowed
Do not share access publicly
Contact the author to request access
Unauthorized reselling is strictly prohibited
🏁 Final Notes
This indicator is designed for traders who understand:
Smart Money Concepts
Institutional orderflow
Liquidity models
Algorithmic ranges
Candle behavior within displacement
Use it as part of a full trading framework—not as a standalone signal.
📜 Credits
Created by: Manish Kumar Gupta / ask2maniish
Inspired by ICT / SMC price delivery concepts
Search in scripts for "smart"

VV Moving Average Convergence Divergence # VMACDv3 - Volume-Weighted MACD with A/D Divergence Detection
## Overview
**VMACDv3** (Volume-Weighted Moving Average Convergence Divergence Version 3) is a momentum indicator that applies volume-weighting to traditional MACD calculations on price, while using the Accumulation/Distribution (A/D) line for divergence detection. This hybrid approach combines volume-weighted price momentum with volume distribution analysis for comprehensive market insight.
## Key Features
- **Volume-Weighted Price MACD**: Traditional MACD calculation on price but weighted by volume for earlier signals
- **A/D Divergence Detection**: Identifies when A/D trend diverges from MACD momentum
- **Volume Strength Filtering**: Distinguishes high-volume confirmations from low-volume noise
- **Color-Coded Histogram**: 4-color system showing momentum direction and volume strength
- **Real-Time Alerts**: Background colors and alert conditions for bullish/bearish divergences
## Difference from ACCDv3
| Aspect | VMACDv3 | ACCDv3 |
|--------|---------|---------|
| **MACD Input** | **Price (Close)** | **A/D Line** |
| **Volume Weighting** | Applied to price | Applied to A/D line |
| **Primary Signal** | Volume-weighted price momentum | Volume distribution momentum |
| **Use Case** | Price momentum with volume confirmation | Volume flow and accumulation/distribution |
| **Sensitivity** | More responsive to price changes | More responsive to volume patterns |
| **Best For** | Trend following, breakouts | Volume analysis, smart money tracking |
**Key Insight**: VMACDv3 shows *where price is going* with volume weight, while ACCDv3 shows *where volume is accumulating/distributing*.
## Components
### 1. Volume-Weighted MACD on Price
Unlike standard MACD that uses simple price EMAs, VMACDv3 weights each price by its corresponding volume:
```
Fast Line = EMA(Price × Volume, 12) / EMA(Volume, 12)
Slow Line = EMA(Price × Volume, 26) / EMA(Volume, 26)
MACD = Fast Line - Slow Line
```
**Benefits of Volume Weighting**:
- High-volume price movements have greater impact
- Filters out low-volume noise and false moves
- Provides earlier trend change signals
- Better reflects institutional activity
### 2. Accumulation/Distribution (A/D) Line
Used for divergence detection, measuring buying/selling pressure:
```
A/D = Σ ((2 × Close - Low - High) / (High - Low)) × Volume
```
- **Rising A/D**: Accumulation (buying pressure)
- **Falling A/D**: Distribution (selling pressure)
- **Doji Handling**: When High = Low, contribution is zero
### 3. Signal Lines
- **MACD Line** (Blue, #2962FF): The fast-slow difference showing momentum
- **Signal Line** (Orange, #FF6D00): EMA or SMA smoothing of MACD
- **Zero Line**: Reference for bullish (above) vs bearish (below) bias
### 4. Histogram Color System
The histogram uses 4 distinct colors based on **direction** and **volume strength**:
| Condition | Color | Meaning |
|-----------|-------|---------|
| Rising + High Volume | **Dark Green** (#1B5E20) | Strong bullish momentum with volume confirmation |
| Rising + Low Volume | **Light Teal** (#26A69A) | Bullish momentum but weak volume (less reliable) |
| Falling + High Volume | **Dark Red** (#B71C1C) | Strong bearish momentum with volume confirmation |
| Falling + Low Volume | **Light Pink** (#FFCDD2) | Bearish momentum but weak volume (less reliable) |
Additional shading:
- **Light Cyan** (#B2DFDB): Positive but not rising (momentum stalling)
- **Bright Red** (#FF5252): Negative and accelerating down
### 5. Divergence Detection
VMACDv3 compares A/D trend against volume-weighted price MACD:
#### Bullish Divergence (Green Background)
- **Condition**: A/D is trending up BUT MACD is negative and trending down
- **Interpretation**: Volume is accumulating while price momentum appears weak
- **Signal**: Smart money accumulation, potential bullish reversal
- **Action**: Look for long entries, especially at support levels
#### Bearish Divergence (Red Background)
- **Condition**: A/D is trending down BUT MACD is positive and trending up
- **Interpretation**: Volume is distributing while price momentum appears strong
- **Signal**: Smart money distribution, potential bearish reversal
- **Action**: Consider exits, avoid new longs, watch for breakdown
## Parameters
| Parameter | Default | Range | Description |
|-----------|---------|-------|-------------|
| **Source** | Close | OHLC/HLC3/etc | Price source for MACD calculation |
| **Fast Length** | 12 | 1-50 | Period for fast EMA (shorter = more sensitive) |
| **Slow Length** | 26 | 1-100 | Period for slow EMA (longer = smoother) |
| **Signal Smoothing** | 9 | 1-50 | Period for signal line (MACD smoothing) |
| **Signal Line MA Type** | EMA | SMA/EMA | Moving average type for signal calculation |
| **Volume MA Length** | 20 | 5-100 | Period for volume average (strength filter) |
## Usage Guide
### Reading the Indicator
1. **MACD Lines (Blue & Orange)**
- **Blue Line (MACD)**: Volume-weighted price momentum
- **Orange Line (Signal)**: Smoothed trend of MACD
- **Crossovers**: Blue crosses above orange = bullish, below = bearish
- **Distance**: Wider gap = stronger momentum
- **Zero Line Position**: Above = bullish bias, below = bearish bias
2. **Histogram Colors**
- **Dark Green (#1B5E20)**: Strong bullish move with high volume - **most reliable buy signal**
- **Light Teal (#26A69A)**: Bullish but low volume - wait for confirmation
- **Dark Red (#B71C1C)**: Strong bearish move with high volume - **most reliable sell signal**
- **Light Pink (#FFCDD2)**: Bearish but low volume - may be temporary dip
3. **Background Divergence Alerts**
- **Green Background**: A/D accumulating while price weak - potential bottom
- **Red Background**: A/D distributing while price strong - potential top
- Most powerful at key support/resistance levels
### Trading Strategies
#### Strategy 1: Volume-Confirmed Trend Following
1. Wait for MACD to cross above zero line
2. Look for **dark green** histogram bars (high volume confirmation)
3. Enter long on second consecutive dark green bar
4. Hold while histogram remains green
5. Exit when histogram turns light green or red appears
6. Set stop below recent swing low
**Example**:
```
Price: 26,400 → 26,450 (rising)
MACD: -50 → +20 (crosses zero)
Histogram: Light teal → Dark green → Dark green
Volume: 50k → 75k → 90k (increasing)
```
#### Strategy 2: Divergence Reversal Trading
1. Identify divergence background (green = bullish, red = bearish)
2. Confirm with price structure (support/resistance, chart patterns)
3. Wait for MACD to cross signal line in divergence direction
4. Enter on first **dark colored** histogram bar after divergence
5. Set stop beyond divergence area
6. Target previous swing high/low
**Example - Bullish Divergence**:
```
Price: Making lower lows (26,350 → 26,300 → 26,250)
A/D: Rising (accumulation)
MACD: Below zero but starting to curve up
Background: Green shading appears
Entry: MACD crosses signal line + dark green bar
Stop: Below 26,230
Target: 26,450 (previous high)
```
#### Strategy 3: Momentum Scalping
1. Trade only in direction of MACD zero line (above = long, below = short)
2. Enter on dark colored bars only
3. Exit on first light colored bar or opposite color
4. Quick in and out (1-5 minute holds)
5. Tight stops (0.2-0.5% depending on instrument)
#### Strategy 4: Histogram Pattern Trading
**V-Bottom Reversal (Bullish)**:
- Red histogram bars start rising (becoming less negative)
- Forms "V" shape at the bottom
- Transitions to light red → light teal → **dark green**
- Entry: First dark green bar
- Signal: Momentum reversal with volume
**Λ-Top Reversal (Bearish)**:
- Green histogram bars start falling (becoming less positive)
- Forms inverted "V" at the top
- Transitions to light green → light pink → **dark red**
- Entry: First dark red bar
- Signal: Momentum exhaustion with volume
### Multi-Timeframe Analysis
**Recommended Approach**:
1. **Higher Timeframe (15m/1h)**: Identify overall trend direction
2. **Trading Timeframe (5m)**: Time entries using VMACDv3 signals
3. **Lower Timeframe (1m)**: Fine-tune entry prices
**Example Setup**:
```
15-minute: MACD above zero (bullish bias)
5-minute: Dark green histogram appears after pullback
1-minute: Enter on break of recent high with volume
```
### Volume Strength Interpretation
The volume filter compares current volume to 20-period average:
- **Volume > Average**: Dark colors (green/red) - high confidence signals
- **Volume < Average**: Light colors (teal/pink) - lower confidence signals
**Trading Rules**:
- ✓ **Aggressive**: Take all dark colored signals
- ✓ **Conservative**: Only take dark colors that follow 2+ light colors of same type
- ✗ **Avoid**: Trading light colored signals during high volatility
- ✗ **Avoid**: Ignoring volume context during news events
## Technical Details
### Volume-Weighted Calculation
```pine
// Volume-weighted fast EMA
fast_ma = ta.ema(src * volume, fast_length) / ta.ema(volume, fast_length)
// Volume-weighted slow EMA
slow_ma = ta.ema(src * volume, slow_length) / ta.ema(volume, slow_length)
// MACD is the difference
macd = fast_ma - slow_ma
// Signal line smoothing
signal = ta.ema(macd, signal_length) // or ta.sma() if SMA selected
// Histogram
hist = macd - signal
```
### Divergence Detection Logic
```pine
// A/D trending up if above its 5-period SMA
ad_trend = ad > ta.sma(ad, 5)
// MACD trending up if above zero
macd_trend = macd > 0
// Divergence when trends oppose each other
divergence = ad_trend != macd_trend
// Specific conditions for alerts
bullish_divergence = ad_trend and not macd_trend and macd < 0
bearish_divergence = not ad_trend and macd_trend and macd > 0
```
### Histogram Coloring Logic
```pine
hist_color = (hist >= 0
? (hist < hist
? (vol_strength ? #1B5E20 : #26A69A) // Rising: dark/light green
: #B2DFDB) // Positive but falling: cyan
: (hist < hist
? (vol_strength ? #B71C1C : #FFCDD2) // Rising (less negative): dark/light red
: #FF5252)) // Falling more: bright red
```
## Alerts
Built-in alert conditions for divergence detection:
### Bullish Divergence Alert
- **Trigger**: A/D trending up, MACD negative and trending down
- **Message**: "Bullish Divergence: A/D trending up but MACD trending down"
- **Use Case**: Potential reversal or continuation after pullback
- **Action**: Look for long entry setups
### Bearish Divergence Alert
- **Trigger**: A/D trending down, MACD positive and trending up
- **Message**: "Bearish Divergence: A/D trending down but MACD trending up"
- **Use Case**: Potential top or trend reversal
- **Action**: Consider exits or short entries
### Setting Up Alerts
1. Click "Create Alert" in TradingView
2. Condition: Select "VMACDv3"
3. Choose alert type: "Bullish Divergence" or "Bearish Divergence"
4. Configure: Email, SMS, webhook, or popup
5. Set frequency: "Once Per Bar Close" recommended
## Comparison Tables
### VMACDv3 vs Standard MACD
| Feature | Standard MACD | VMACDv3 |
|---------|---------------|---------|
| **Price Weighting** | Equal weight all bars | Volume-weighted |
| **Sensitivity** | Fixed | Adaptive to volume |
| **False Signals** | More during low volume | Fewer (volume filter) |
| **Divergence** | Price vs MACD | A/D vs MACD |
| **Volume Analysis** | None | Built-in |
| **Color System** | 2 colors | 4+ colors |
| **Best For** | Simple trend following | Volume-confirmed trading |
### VMACDv3 vs ACCDv3
| Aspect | VMACDv3 | ACCDv3 |
|--------|---------|--------|
| **Focus** | Price momentum | Volume distribution |
| **Reactivity** | Faster to price moves | Faster to volume shifts |
| **Best Markets** | Trending, breakouts | Accumulation/distribution phases |
| **Signal Type** | Where price + volume going | Where smart money positioning |
| **Divergence Meaning** | Volume vs price disagreement | A/D vs momentum disagreement |
| **Use Together?** | ✓ Yes, complementary | ✓ Yes, different perspectives |
## Example Trading Scenarios
### Scenario 1: Strong Bullish Breakout
```
Time: 9:30 AM (market open)
Price: Breaks above 26,400 resistance
MACD: Crosses above zero line
Histogram: Dark green bars (#1B5E20)
Volume: 2x average (150k vs 75k avg)
A/D: Rising (no divergence)
Action: Enter long at 26,405
Stop: 26,380 (below breakout)
Target 1: 26,450 (risk:reward 1:2)
Target 2: 26,500 (risk:reward 1:4)
Result: High probability setup with volume confirmation
```
### Scenario 2: False Breakout (Avoided)
```
Time: 2:30 PM (slow period)
Price: Breaks above 26,400 resistance
MACD: Slightly positive
Histogram: Light teal bars (#26A69A)
Volume: 0.5x average (40k vs 75k avg)
A/D: Flat/declining
Action: Avoid trade
Reason: Low volume, no conviction, potential false breakout
Outcome: Price reverses back below 26,400 within 10 minutes
Saved: Avoided losing trade due to volume filter
```
### Scenario 3: Bullish Divergence Bottom
```
Time: 11:00 AM
Price: Making lower lows (26,350 → 26,300 → 26,280)
MACD: Below zero but curving upward
Histogram: Red bars getting shorter (V-bottom forming)
Background: Green shading (divergence alert)
A/D: Rising despite price falling
Volume: Increasing on down bars
Setup:
1. Divergence appears at 26,280 (green background)
2. Wait for MACD to cross signal line
3. First dark green bar appears at 26,290
4. Enter long: 26,295 (next bar open)
5. Stop: 26,265 (below divergence low)
6. Target: 26,350 (previous swing high)
Result: +55 points (30 point risk, 1.8:1 reward)
Key: Divergence + volume confirmation = high probability reversal
```
### Scenario 4: Bearish Divergence Top
```
Time: 1:45 PM
Price: Making higher highs (26,500 → 26,520 → 26,540)
MACD: Positive but flattening
Histogram: Green bars getting shorter (Λ-top forming)
Background: Red shading (bearish divergence)
A/D: Declining despite rising price
Volume: Decreasing on up bars
Setup:
1. Bearish divergence at 26,540 (red background)
2. MACD crosses below signal line
3. First dark red bar appears at 26,535
4. Enter short: 26,530
5. Stop: 26,555 (above divergence high)
6. Target: 26,475 (support level)
Result: +55 points (25 point risk, 2.2:1 reward)
Key: Distribution while price rising = smart money exiting
```
### Scenario 5: V-Bottom Reversal
```
Downtrend in progress
MACD: Deep below zero (-150)
Histogram: Series of dark red bars
Pattern Development:
Bar 1: Dark red, hist = -80, falling
Bar 2: Dark red, hist = -95, falling
Bar 3: Dark red, hist = -100, falling (extreme)
Bar 4: Light pink, hist = -98, rising!
Bar 5: Light pink, hist = -90, rising
Bar 6: Light teal, hist = -75, rising (crosses to positive momentum)
Bar 7: Dark green, hist = -55, rising + volume
Action: Enter long on Bar 7
Reason: V-bottom confirmed with volume
Stop: Below Bar 3 low
Target: Zero line on histogram (mean reversion)
```
## Best Practices
### Entry Rules
✓ **Wait for dark colors**: High-volume confirmation is key
✓ **Confirm divergences**: Use with price support/resistance
✓ **Trade with zero line**: Long above, short below for best odds
✓ **Multiple timeframes**: Align 1m, 5m, 15m signals
✓ **Watch for patterns**: V-bottoms and Λ-tops are reliable
### Exit Rules
✓ **Partial profits**: Take 50% at first target
✓ **Trail stops**: Use histogram color changes
✓ **Respect signals**: Exit on opposite dark color
✓ **Time stops**: Close positions before major news
✓ **End of day**: Square up before close
### Avoid
✗ **Don't chase light colors**: Low volume = low confidence
✗ **Don't ignore divergence**: Early warning system
✗ **Don't overtrade**: Wait for clear setups
✗ **Don't fight the trend**: Zero line dictates bias
✗ **Don't skip stops**: Always use risk management
## Risk Management
### Position Sizing
- **Dark green/red signals**: 1-2% account risk
- **Light signals**: 0.5% account risk or skip
- **Divergence plays**: 1% account risk (higher uncertainty)
- **Multiple confirmations**: Up to 2% account risk
### Stop Loss Placement
- **Trend trades**: Below/above recent swing (20-30 points typical)
- **Breakout trades**: Below/above breakout level (15-25 points)
- **Divergence trades**: Beyond divergence extreme (25-40 points)
- **Scalp trades**: Tight stops at 10-15 points
### Profit Targets
- **Minimum**: 1.5:1 reward to risk ratio
- **Scalps**: 15-25 points (quick in/out)
- **Swing**: 50-100 points (hold through pullbacks)
- **Runners**: Trail with histogram color changes
## Timeframe Recommendations
| Timeframe | Trading Style | Typical Hold | Advantages | Challenges |
|-----------|---------------|--------------|------------|------------|
| **1-minute** | Scalping | 1-5 minutes | Fast profits, many setups | Noisy, high false signals |
| **5-minute** | Intraday | 15-60 minutes | Balance of speed/clarity | Still requires quick decisions |
| **15-minute** | Swing | 1-4 hours | Clearer trends, less noise | Fewer opportunities |
| **1-hour** | Position | 4-24 hours | Strong signals, less monitoring | Wider stops required |
**Recommendation**: Start with 5-minute for best balance of signal quality and opportunity frequency.
## Combining with Other Indicators
### VMACDv3 + ACCDv3
- **Use**: Confirm volume flow with price momentum
- **Signal**: Both showing dark green = highest conviction long
- **Divergence**: VMACDv3 bullish + ACCDv3 bearish = examine price action
### VMACDv3 + RSI
- **Use**: Overbought/oversold with momentum confirmation
- **Signal**: RSI < 30 + dark green VMACD = strong reversal
- **Caution**: RSI > 70 + light green VMACD = potential false breakout
### VMACDv3 + Elder Impulse
- **Use**: Bar coloring + histogram confirmation
- **Signal**: Green Elder bars + dark green VMACD = aligned momentum
- **Exit**: Blue Elder bars + light colors = momentum stalling
## Limitations
- **Requires volume data**: Will not work on instruments without volume feed
- **Lagging indicator**: MACD inherently follows price (2-3 bar delay)
- **Consolidation noise**: Generates false signals in tight ranges
- **Gap handling**: Large gaps can distort volume-weighted values
- **Not standalone**: Should combine with price action and support/resistance
## Troubleshooting
**Problem**: Too many light colored signals
**Solution**: Increase Volume MA Length to 30-40 for stricter filtering
**Problem**: Missing entries due to waiting for dark colors
**Solution**: Lower Volume MA Length to 10-15 for more signals (accept lower quality)
**Problem**: Divergences not appearing
**Solution**: Verify volume data available; check if A/D line is calculating
**Problem**: Histogram colors not changing
**Solution**: Ensure real-time data feed; refresh indicator
## Version History
- **v3**: Removed traditional MACD, using volume-weighted MACD on price with A/D divergence
- **v2**: Added A/D divergence detection, volume strength filtering, enhanced histogram colors
- **v1**: Basic volume-weighted MACD on price
## Related Indicators
**Companion Tools**:
- **ACCDv3**: Volume-weighted MACD on A/D line (distribution focus)
- **RSIv2**: RSI with A/D divergence detection
- **DMI**: Directional Movement Index with A/D divergence
- **Elder Impulse**: Bar coloring system using volume-weighted MACD
**Use Together**: VMACDv3 (momentum) + ACCDv3 (distribution) + Elder Impulse (bar colors) = complete volume-based trading system
---
*This indicator is for educational purposes. Past performance does not guarantee future results. Always practice proper risk management and never risk more than you can afford to lose.*

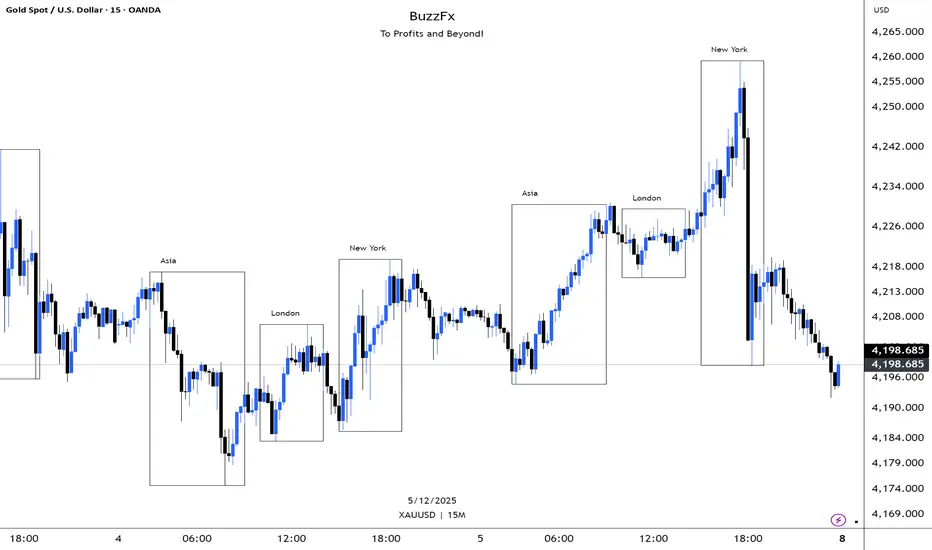
BuzzFx Market SessionsBuzzFx Market Sessions is a clean and powerful tool that highlights the most important trading sessions directly on your chart.
It automatically marks:
London Session
New York Session
Asian Session
Pre-New York
Session highs & lows (optional)
Session ranges & volatility zones
This indicator helps traders instantly understand:
When major liquidity enters the market
When volatility typically increases
How price reacts inside each session
Which session is driving the current trend
Designed for both beginners and advanced traders, BuzzFx Market Sessions gives you a clearer view of market structure and timing—so you can trade smarter, not harder.
Perfect for day traders, scalpers, and SMC traders who rely on timing, volatility, and session behavior.
OBV + A/D Accumulation Score# OBV + A/D Accumulation Score
This script fuses **On-Balance Volume (OBV)** and **Chaikin Accumulation/Distribution Line** into one perfectly normalized, weighted, smoothed score that reveals **exactly** what smart money is doing on a **daily basis** — even when you're watching lower timeframes.
It only moves when real institutional order flow is present. Zero-line crosses and extreme levels have an uncanny ability to call major turns before price even blinks.
Institutional accumulation/distribution, distilled into one clean line.
### Why This Indicator Is Special
- **Z-Score Normalization** → OBV and A/D are forced onto the exact same scale so neither dominates (most combined indicators fail here)
- **Weighted Composite** → Default 50/50, but you can slide it to favor OBV or A/D depending on the asset (huge edge on crypto vs stocks)
- **Daily Resolution Forced** → Shows true daily smart-money flow no matter what chart you're on (add to 1H/4H for god-tier context)
- **Extreme Thresholds** (±1.2 default) with lime/maroon coloring → When these hit, institutions are going nuclear
- **Optional Histogram Mode** + subtle pane background tint → Instant bias recognition
- **Full Alert Suite** → Zero-cross + Extreme breaches (with current score value in the message)
### How to Trade It (The Signals That Actually Print)
**Primary Signals**
- Green triangle + alert → Accumulation just turned ON (smart money buying pressure now dominant)
- Red triangle + alert → Distribution just turned ON (smart money exiting)
**Nuclear Signals**
- Lime color + "EXTREME ACCUMULATION" alert → Institutions aggressively piling in → one of the strongest buy signals on daily
- Maroon color + "EXTREME DISTRIBUTION" alert → Institutions dumping hard → one of the strongest sell/short signals
**Best Uses**
- Zero-cross up + price above daily EMA-9/21 → Swing long bias god mode
- Divergences on daily (price new high + score lower high = top incoming)
- Extreme accumulation while price is basing → Buy the breakout and thank me later
Works insanely well on BTC/ETH, SPX/QQQ, NVDA, TSLA — anything with real institutional volume.
### Settings Explained
- **Z-Score Lookback** (50): Longer = only major regime changes
- **Signal Smoothing** (10): Lower = more responsive, higher = smoother trend
- **OBV Weight** (0.5): Slide toward 1.0 for pure direction-based strength, toward 0.0 for close-location sensitivity
- **Extreme Threshold**: 1.2 is perfect balance — raise to 1.8+ for only the absolute strongest moves
- **Show as Histogram**: MACD-style bars (great for ranging markets)
- **Background tint**: Subtle green/red — you'll love it or disable it

DarkPool FlowDarkPool Flow is a professional-grade technical analysis tool designed to align retail traders with the dominant "smart money" flow. Unlike standard moving average crossovers that often generate false signals during consolidation, this script employs a multi-layered filtering engine to isolate high-probability trends.
The core philosophy of this indicator is that Trends are fractal. A sustainable move on a lower timeframe must be supported by momentum on a higher timeframe. By comparing a "Fast Signal Trend" against a "Slow Anchor Trend" (e.g., Daily vs. Weekly), the script identifies the market bias used by institutional algorithms.
This edition features a Smart Recovery Engine, ensuring that valid trends are not missed simply because momentum started slowly, and a Dynamic Cloud that visually represents the strength of the trend spread.
Key Features
1. Auto-Adaptive Timeframe Logic
The script eliminates the guesswork of Multi-Timeframe (MTF) selection. By enabling "Auto-Adapt," the indicator detects your current chart timeframe and automatically maps it to the mathematically correct institutional pairings:
Scalping (<15m): Uses 15-Minute Trend vs. 1-Hour Anchor.
Day Trading (15m - 1H): Uses 4-Hour Trend vs. Daily Anchor.
Swing Trading (4H - Daily): Uses Daily Trend vs. Weekly Anchor (The classic "Golden" setup).
Investing (Weekly): Uses 21-Week EMA vs. 50-Week SMA (Bull Market Support Band logic).
2. Smart Recovery Signal Engine
Standard crossover scripts often miss major moves if the specific breakout candle has low volume or weak ADX. This script utilizes a state-machine logic that "remembers" the trend direction. If a trend begins during low volatility (gray candles), the script waits. The moment volatility and momentum confirm the move, a Smart Recovery Signal is triggered, allowing you to enter an existing trend safely.
3. Chop Protection (Gray Candles)
Preservation of capital is the priority. The script analyzes the Average Directional Index (ADX) and Volatility (ATR).
Colored Candles (Green/Red): The market is trending with sufficient strength. Trading is permitted.
Gray Candles: The market is in a low-energy chop or consolidation (ADX < 20). Trading is discouraged.
4. Dynamic Trend Cloud
The space between the Fast and Slow trends is filled with a dynamic cloud.
Darker/Opaque Cloud: Indicates a widening spread, suggesting accelerating momentum.
Lighter/Transparent Cloud: Indicates a narrowing spread, suggesting the trend may be weakening or consolidating.
5. Pullback & Retest Signals (+)
While triangles mark the start of a trend, the Plus (+) signs mark low-risk opportunities to add to a position. These appear when price dips into the cloud, finds support at the "Fair Value" zone, and closes back in the direction of the trend with confirmed momentum.
User Guide & Strategy
Setup
Add the indicator to your chart.
For Beginners: Enable "Auto-Adaptive Timeframes" in the settings.
For Advanced Users: Disable Auto-Adapt and manually configure your Fast/Slow pairings (Default is Daily 50 EMA / Weekly 50 EMA).
Signal Mode: Choose "First Breakout Only" for a cleaner chart, or "All Signals" if you wish to see re-entry points during choppy starts.
Long Entry Criteria (Buy)
Trend: The Cloud must be Green (Fast Trend > Slow Trend).
Signal: A Green Triangle appears below the bar.
Confirmation: The signal candle must not be Gray.
Re-Entry: A small Green (+) sign appears, indicating a successful test of the cloud support.
Short Entry Criteria (Sell)
Trend: The Cloud must be Red (Fast Trend < Slow Trend).
Signal: A Red Triangle appears above the bar.
Confirmation: The signal candle must not be Gray.
Re-Entry: A small Red (+) sign appears, indicating a successful test of the cloud resistance.
Stop Loss & Risk Management
Stop Loss: A standard institutional stop loss is placed just beyond the Slow Trend Line (the outer edge of the cloud). If price closes beyond the Slow Trend, the macro thesis is invalid.
Take Profit: Target liquidity pools or use a trailing stop based on the Fast Trend line.
Settings Overview
Mode Selection: Toggle between Auto-Adaptive logic or Manual control.
Manual Configuration: Define the specific Timeframe, Length, and Type (EMA, SMA, WMA) for both Fast and Slow trends.
Signal Logic: Toggle "Show Pullback Signals" on/off. Switch between "First Breakout" or "All Signals."
Quality Filters: Toggle individual filters (ATR, RSI, ADX) to adjust sensitivity. Turning these off makes the script more responsive but increases false signals.
Visual Style: Customize colors for Bullish, Bearish, and Neutral (Gray) states. Adjust cloud transparency.
Disclaimer
Risk Warning: Trading financial markets involves a high degree of risk and is not suitable for all investors. You could lose some or all of your initial investment.
Educational Use Only: This script and the information provided herein are for educational and informational purposes only. They do not constitute financial advice, investment advice, trading advice, or any other recommendation.
No Guarantee: Past performance of any trading system or methodology is not necessarily indicative of future results. The "Institutional Trend" indicator is a tool to assist in technical analysis, not a crystal ball. The creators of this script assume no responsibility or liability for any trading losses or damages incurred as a result of using this tool. Always perform your own due diligence and consult with a qualified financial advisor before making investment decisions.

SMC Fib Range Signals [@gyanapravah]SMC Fib Range Signals
This indicator blends Smart Money Concepts (SMC) with a Range Filter Trend System and Fibonacci Retracement & Extensions to generate high-probability automated Buy/Sell signals.
Designed to avoid noise and focus on market structure + trend + price confluence, this tool is ideal for:
1. Intraday traders
2. Swing traders
3. Index & stock traders
4. Crypto & Forex traders
CORE FEATURES
Range Filter Trend Detection
Smooth adaptive filter identifies true trend direction
Visual confirmation:
🟢 Green filter = bullish pressure
🔴 Red filter = bearish pressure
🟡 Yellow filter = neutral
Upper & Lower Bands act as dynamic support/resistance zones
Smart Money Order Blocks (SMC)
Automatically detects important pivot highs & lows
Marks:
OB High → supply / resistance zone
OB Low → demand / support zone
Continuously tracks latest OB levels for live price interaction
Fibonacci Engine
Detects the current swing zone and plots:
Retracement levels
0.236 – 0.382 – 0.500 – 0.618 – 0.786 (editable)
Extension targets
1.272 – 1.618
All levels update dynamically on new market structure and pivots.
SIGNAL ENGINE
This indicator generates signals from three independent confirmation systems:
BUY SIGNALS trigger when:
1. Trend flips bullish (price crosses above the Filter)
2.Bullish trend + price reacts near:
Order Block support
Fibonacci 0.382 / 0.618 levels
Bounce from the Lower Band with trend support
All setups require volume confirmation to filter fake breakouts.
SELL SIGNALS trigger when:
1. Trend flips bearish (price crosses below the Filter)
2. Bearish trend + price reacts near:
Order Block resistance
Fibonacci 0.382 / 0.618 levels
Rejection from the Upper Band with trend support
ALERTS READY
Two built-in alerts:
BUY Alert — fires on bullish signal
SELL Alert — fires on bearish signal
INPUT SETTINGS
Trend Engine
1.Source
2.Sampling Period
3.Range Multiplier
Smart Money
Pivot detection sensitivity (Left / Right bars)
Fibonacci
1.Swing lookback length
2.Editable Fib retracement and extension values
3.Toggle show/hide Fib levels
BEST USE CASE
Works extremely well on:
⏱️ 3M – 15M Intraday scalping
⏱️ 30M – 1H positional entries
⏱️ 4H – D1 swing trading
Tested on:
NIFTY / BANKNIFTY / FINNIFTY
Stocks
Crypto
Forex
DISCLAIMER
This indicator is for educational purposes only.
It does NOT guarantee profits.
Always use:
Proper risk management
Stop-loss rules
Your own confirmation before entering trades.
AUTHOR
Built & shared by @gyanapravah (Odisha, India)
Open-source for learning and community improvement.

Price Action Strategy v2.0 [Ista]💎 Overview
Price Action Strategy v2.0 is a comprehensive, all-in-one institutional trading toolkit designed for visual traders who demand precision. Unlike standard indicators, this tool focuses on the narrative of price by combining advanced Market Structure, Institutional Order Flow, and Predictive Analytics into a single, non-cluttered interface.
The core philosophy of this script is "Clean Precision". It filters out noise and presents only the most critical decision-making data via smart chart overlays and a state-of-the-art Analytic Dashboard.
🚀 Key Features
1. 🏛️ Institutional Order Blocks (Origin Scan Engine)
This is not a standard pivot-based OB indicator. We utilize a proprietary "Origin Scan" algorithm that:
Detects the exact origin candle responsible for a structural break (BOS).
Filters out weak blocks, keeping only the most significant institutional footprints.
Smart Management: Limits active blocks to the 3 most recent per side (Support/Resistance) to keep charts clean.
Ghost Mode: When an Order Block is broken, it doesn't just disappear; it turns into a faint "Ghost" level, allowing you to see historical reactions without visual clutter.
2. 🔮 Echo Forecast (Predictive Path)
A powerful forecasting engine based on Pattern Similarity:
Scans historical price action (Evaluation Window) to find patterns mathematically similar to the current market state.
Projects the most likely future path (Forecast Window) directly onto the chart.
Uses a cumulative calculation method to smooth out noise and provide a realistic trajectory.
Visual Coding: The forecast line thickens and changes color based on the Confidence Score (Correlation %). High confidence patterns (>80%) are highlighted in deep green.
3. 📊 ISTA Command Center (Analytic Dashboard)
A professional, compact, and right-aligned dashboard that acts as your trading HUD. It monitors 8 vital market vitals in real-time:
Market Structure: Real-time Swing trend direction.
HTF Trend: Higher Timeframe bias (Price Action based).
Momentum: Current & HTF RSI status (Overbought/Oversold).
MACD: Signal crossover status.
Smart Money Flow (MFI): Detects institutional accumulation/distribution.
Volatility (ATR%): Current market volatility percentage.
Forecast Confidence: The statistical reliability of the current Echo Forecast.
4. 📉 Dynamic EMAs
Includes three key moving averages (20, 200, 1440) with dynamic transparency logic. They fade into the background when not interacting with price, ensuring they are there when you need them but invisible when you don't.
🛠️ How to Use
Identify Trend: Look at the Dashboard. If Structure and HTF Trend align (e.g., both Bullish), look for longs.
Wait for Pullback: Wait for price to return to a Bullish Order Block.
Confirm: Check the Forecast line. Does it suggest a bounce? Check MFI and RSI on the dashboard for oversold conditions.
Execute: Use the Order Block edges for precise entry and invalidation points.
⚙️ Settings
Swing Length: Adjust sensitivity of the structure (Default: 10).
Evaluation Window: How far back the Echo Forecast looks for patterns (Default: 300).
Dashboard: Fully customizable position and size.
Developed by Soheil_kheiri | Ista Web Analytics

ICT Complete SuiteICT Complete Suite - Advanced SMC & Liquidity Analysis
A comprehensive indicator combining ICT (Inner Circle Trader) methodology with Smart Money Concepts for professional trading analysis.
🔹 KEY FEATURES:
- Market Structure Detection (MSS, CISD, BOS, CHoCH)
- Smart Money Liquidity Analysis (BSL/SSL Sweeps)
- Premium Discount Arrays (Order Blocks, FVG, Breaker Blocks)
- OTE Zones (0.62-0.79 Fibonacci)
- Session & Killzone Tracking (Asian, London, NY)
- Silver Bullet Time Windows
- Real-time Info Dashboard
- Multi-timeframe Support
🔹 MODULES:
1. Market Structure & Trend Analysis
2. Liquidity Hunter (BSL/SSL Detection)
3. PD Arrays (OB, FVG, Breaker Blocks)
4. Sessions & Killzones
Perfect for traders who follow ICT concepts and Smart Money trading strategies.
⚠️ Best on M15-H1 timeframes
⚠️ Compatible with XAUUSD, EURUSD, GBPUSD, and major pairs

STM APEX Pro📊 STM APEX Pro - SMC + ICT + SOM Combined Indicator
The ULTIMATE Smart Money trading tool that combines three powerful concepts into ONE indicator:
━━━━━━━━━━━━━━━━━━━━━━━━━━━━━━
🔷 SMC (Smart Money Concepts)
- Order Blocks (Supply & Demand)
- Fair Value Gaps (FVG/Imbalance)
- Break of Structure (BOS)
- Change of Character (CHoCH)
- Liquidity Sweeps (BSL/SSL)
🔷 ICT (Inner Circle Trader)
- Kill Zones (London, New York, Asia)
- Premium & Discount Zones
- Optimal Trade Entry (OTE)
- Equilibrium Line
🔷 SOM (Swing of MACD)
- MACD Swing Detection
- Multi-Timeframe Confirmation
- Momentum Analysis
━━━━━━━━━━━━━━━━━━━━━━━━━━━━━━
✅ KEY FEATURES:
📌 Smart Signal System
- 4 Signal Modes: Confluence, Custom, Aggressive, Conservative
- Confluence scoring (1-6) for signal quality
- Customizable entry requirements
📌 Advanced SL/TP
- Structure-based (Swing High/Low)
- ATR-based
- Fixed Risk:Reward
- Hybrid method
📌 Real-time Dashboard
- Trend direction
- Premium/Discount zone
- Kill Zone status
- Confluence score
- Multi-TF confirmation
📌 Full Customization
- Every feature can be toggled ON/OFF
- Adjustable colors and styles
- Mobile-friendly mode
━━━━━━━━━━━━━━━━━━━━━━━━━━━━━━
⚙️ SETTINGS GUIDE:
Signal Mode:
- Confluence: Signal when X conditions are met
- Custom: Define your own requirements
- Aggressive: Quick signals (BOS + SOM)
- Conservative: High-quality signals only (4+ confluence)
Recommended Timeframes: M15, H1, H4
Best Pairs: XAUUSD, EURUSD, GBPUSD, US30
━━━━━━━━━━━━━━━━━━━━━━━━━━━━━━
📱 Works on both Desktop and Mobile
🔔 Alert Conditions included for:
- Buy/Sell Signals
- BOS/CHoCH
- Liquidity Sweeps
━━━━━━━━━━━━━━━━━━━━━━━━━━━━━━
⚠️ DISCLAIMER:
This indicator is for educational purposes. Past performance does not guarantee future results. Always use proper risk management.
━━━━━━━━━━━━━━━━━━━━━━━━━━━━━━
💬 Support:
Tags: SMC, ICT, Smart Money, Order Block, FVG, BOS, CHoCH, Liquidity, Kill Zone, MACD

Linear Trajectory & Volume StructureThe Linear Trajectory & Volume Structure indicator is a comprehensive trend-following system designed to identify market direction, volatility-adjusted channels, and high-probability entry points. Unlike standard Moving Averages, this tool utilizes Linear Regression logic to calculate the "best fit" trajectory of price, encased within volatility bands (ATR) to filter out market noise.
It integrates three core analytical components into a single interface:
Trend Engine: A Linear Regression Curve to determine the mean trajectory.
Volume Verification: Filters signals to ensure price movement is backed by market participation.
Market Structure: Identifies previous high-volume supply and demand zones for support and resistance analysis.
2. Core Components and Logic
The Trajectory Engine
The backbone of the system is a Linear Regression calculation. This statistical method fits a straight line through recent price data points to determine the current slope and direction.
The Baseline: Represents the "fair value" or mean trajectory of the asset.
The Cloud: Calculated using Average True Range (ATR). It expands during high volatility and contracts during consolidation.
Trend Definition:
Bullish: Price breaks above the Upper Deviation Band.
Bearish: Price breaks below the Lower Deviation Band.
Neutral/Chop: Price remains inside the cloud.
Smart Volume Filter
The indicator includes a toggleable volume filter. When enabled, the script calculates a Simple Moving Average (SMA) of the volume.
High Volume: Current volume is greater than the Volume SMA.
Signal Validation: Reversal signals and structure zones are only generated if High Volume is present, reducing the likelihood of trading false breakouts on low liquidity.
Volume Structure (Smart Liquidity)
The script automatically plots Support (Demand) and Resistance (Supply) boxes based on pivot points.
Creation: A box is drawn only if a pivot high or low is formed with High Volume (if the volume filter is active).
Mitigation: The boxes extend to the right. If price breaks through a zone, the box turns gray to indicate the level has been breached.
3. Signal Guide
Trend Reversals (Buy/Sell Labels)
These are the primary signals indicating a potential change in the macro trend.
BUY Signal: Appears when price closes above the upper volatility band after previously being in a downtrend.
SELL Signal: Appears when price closes below the lower volatility band after previously being in an uptrend.
Pullbacks (Small Circles)
These are continuation signals, useful for adding to positions or entering an existing trend.
Long Pullback: The trend is Bullish, but price dips momentarily below the baseline (into the "discount" area) and closes back above it.
Short Pullback: The trend is Bearish, but price rallies momentarily above the baseline (into the "premium" area) and closes back below it.
4. Configuration and Settings
Trend Engine Settings
Trajectory Length: The lookback period for the Linear Regression. This is the most critical setting for tuning sensitivity.
Channel Multiplier: Controls the width of the cloud.
1.0: Aggressive. Results in narrower bands and earlier signals, but more false positives.
1.5: Balanced (Default).
2.0+: Conservative. Creates a wide channel, filtering out significant noise but delaying entry signals.
Signal Logic
Show Trend Reversals: Toggles the main Buy/Sell labels.
Show Pullbacks: Toggles the re-entry circle signals.
Smart Volume Filter: If checked, signals require above-average volume. Unchecking this yields more signals but removes the volume confirmation requirement.
Volume Structure
Show Smart Liquidity: Toggles the Support/Resistance boxes.
Structure Lookback: Defines how many bars constitute a pivot. Higher numbers identify only major market structures.
Max Active Zones: Limits the number of boxes on the chart to prevent clutter.
5. Timeframe Optimization Guide
To maximize the effectiveness of the Linear Trajectory, you must adjust the Trajectory Length input based on your trading style and timeframe.
Scalping (1-Minute to 5-Minute Charts)
Recommended Length: 20 to 30
Multiplier: 1.2 to 1.5
Logic: Fast-moving markets require a shorter lookback to react quickly to micro-trend changes.
Day Trading (15-Minute to 1-Hour Charts)
Recommended Length: 55 (Default)
Multiplier: 1.5
Logic: A balance between responsiveness and noise filtering. The default setting of 55 is standard for identifying intraday sessions.
Swing Trading (4-Hour to Daily Charts)
Recommended Length: 89 to 100
Multiplier: 1.8 to 2.0
Logic: Swing trading requires filtering out intraday noise. A longer length ensures you stay in the trade during minor retracements.
6. Dashboard (HUD) Interpretation
The Head-Up Display (HUD) provides a summary of the current market state without needing to analyze the chart visually.
Bias: Displays the current trend direction (BULLISH or BEARISH).
Momentum:
ACCELERATING: Price is moving away from the baseline (strong trend).
WEAKENING: Price is compressing toward the baseline (potential consolidation or reversal).
Volume: Indicates if the current candle's volume is HIGH or LOW relative to the average.
Disclaimer
*Trading cryptocurrencies, stocks, forex, and other financial instruments involves a high level of risk and may not be suitable for all investors. This indicator is a technical analysis tool provided for educational and informational purposes only. It does not constitute financial advice, investment recommendations, or a guarantee of profit. Past performance of any trading system or methodology is not necessarily indicative of future results.

Market Internals Dashboard: Trend, Breadth, Volume PressureOverview
The Market Internals Dashboard Pro is a professional-grade toolkit modeled after what prop firms and institutional desks use to understand real intraday market conditions.
Instead of relying solely on price, this indicator analyzes three critical internal forces:
USI:TICK : Microstructure buying/selling pressure
USI:ADD : Market breadth participation (advancers vs decliners proxy)
USI:VOLD : Volume pressure (buying vs selling volume)
These internals determine whether the market is:
Trending or ranging
Bullish or bearish
Likely to follow through or mean-revert
Favoring continuation trades or fade setups
The script also produces a Market Environment Score (–3 to +3) and a real-time Trade Recommendation Table that updates every bar. This helps answer the single most important question in intraday trading: “What type of trades should I be taking right now given current market conditions?”
1. TICK Proxy: Microstructure Pressure
Measures buying vs. selling aggressiveness across the market This proxy simulates the NYSE TICK index by evaluating whether bars close above or below the prior bar.
Positive TICK → Buyers lifting offers
Negative TICK → Sellers hitting bids
Neutral TICK → No microstructure conviction
Why it matters:
Strong TICK is often the earliest sign of:
Trend initiation
Algorithmic buy/sell programs
Shifts in short‑term sentiment
Weak or choppy TICK often signals:
Range conditions
Failed breakouts
Low‑quality trend attempts
2. ADD Proxy: Market Breadth Strength
Shows how many stocks are participating in a move Because real USI:ADD data isn't available for all users, this script uses a self-contained breadth approximation built from:
Price slope
Volatility expansion
Volume‑weighted directional pressure
Why it matters? Breadth reveals whether the move is:
Broad and healthy → likely to continue
Narrow and weak → vulnerable to reversal
Strong trends require strong breadth. Weak breadth often precedes:
Failed breakouts
Reversal setups
Chop (ewww)
3. VOLD Proxy: Volume Pressure
The most important internal of all. This proxy measures whether trading volume is flowing into up bars or down bars.
Positive VOLD → Net buying pressure
Negative VOLD → Net selling pressure
Why it matters:
VOLD is considered the "truth serum" of the tape:
Strong VOLD drives trend days
Negative VOLD kills long setups
Mixed VOLD creates chop
You should rarely trend trade against VOLD.
4. Market Environment Score (–3 to +3)
The Environment Score combines the three internals into a single view:
|| Score || Interpretation || Market Type ||
| +3 | Strong Bull | Trend Day (Long) |
| +2 | Bull | Pullback Buys / Breakout Continuation |
| +1 | Mild Bull | Conservative Long Scalps |
| 0 | Neutral | CHOP – VWAP Reversions / Fades |
| -1 | Mild Bear | Short Failed Breakouts |
| -2 | Bear | Trend Shorts / Breakdown Continuation |
| -3 | Strong Bear | Trend Day (Short) |
Why it matters:
The market behaves differently depending on internal alignment. This score prevents traders from:
Forcing trend trades on chop days
Chasing breakouts when breadth is weak
Fading strong directional days
It tells you in real time whether conditions favor:
Trend following
Mean reversion
Breakout continuation
Liquidity grabs
Or sitting out
5. Trade Recommendation Engine
Based on the Environment Score, the indicator outputs a real-time playbook recommending which trade types have the highest probability of success right now.
Examples:
Score = 0 (Neutral)
VWAP Reversions
Liquidity Grabs
Failed Breakouts
Quick Scalps
Score = +2/+3 (Strong Bull)
Pullback Buys
Breakout Continuation
Trend Longs
Score = -2/-3 (Strong Bear)
Pullback Shorts
Breakdown Continuation
Trend Shorts Only
This turns the internals into a trade selection engine, not just a data display.
Why Market Internals Matter
Most indicators look only at price, but price is the result, not the cause.
Market internals show:
Where volume is flowing
Whether buying is aggressive or passive
How many stocks are participating
Whether algorithms are supporting or fighting the move
This dashboard helps traders:
Avoid chop
Stay out of low‑quality setups
Time entries with institutional flows
Improve win rate by trading the right setups at the right times
Final Notes
Works on any symbol or timeframe
Fully customizable colors
Two clean visual tables: Internals + Trade Playbook
Ideal for futures, ETFs, and options day traders
If you enjoy this tool, please like, comment, or follow. More enhancements are coming.
Trade smart.

NWOG & NDOG - Opening Gaps 🧪 [Pro +] | cephxsNWOG & NDOG - OPENING GAPS 🧪
Smart Gap Detection with Intelligent Filtering
Visualizes New Week Opening Gaps (NWOGs) and New Day Opening Gaps (NDOGs) with built-in intelligence to show you only what matters. No more cluttered charts with gaps from 3 months ago that price will never revisit.
The Display chart is on default settings with the size filter set to "Juicy Gaps only"
THE PROBLEM WITH GAP INDICATORS
Most gap indicators dump every single gap on your chart and call it a day. You end up with 100+ boxes cluttering your screen, half of which are miles away from current price and the other half are so tiny they're basically noise.
This one's different (That's what they all say).
SMART FILTERING (THE GOOD STUFF)
Two filters work together to keep your chart clean:
Size Filter: Uses ATR-based detection to filter out insignificant gaps
- Filter None: Show everything (if you really want chaos)
- Filter Insignificant: Hide the micro-gaps that don't matter
- Juicy Gaps Only: Only show gaps worth paying attention to (Mostly for HTF trading)
Distance Filter: Only displays gaps within range of current price
- Really Close: 0.5 ATR - tight focus on immediate levels
- Balanced: 1 ATR - sweet spot for most traders
- Slightly Far: 3 ATR - wider view for swing traders
- ✨ Or just turn off the filter by distance and it becomes like other indicators ✨
The magic: gaps appear and disappear as price moves toward or away from them. Old gaps that price has left behind fade out, and gaps that become relevant fade back in. Remove auto scaling if price is not trending and gaps keep flashing in and out.
GAP TYPES EXPLAINED
New Week Opening Gaps (NWOGs):
The gap between Friday's close and Monday's open. These form over the weekend when markets are closed and often act as significant support/resistance.
Two classifications:
Void Gaps: Gap direction aligns with Friday's candle direction (continuation)
Overlap Gaps: Gap direction conflicts with Friday's candle (potential reversal)
New Day Opening Gaps (NDOGs):
The gap between one day's close and the next day's open. Smaller but frequent - useful for intraday traders looking for fill targets.
FEATURES
Automatic Week/Day Detection: Handles forex (17:00 ET open) and futures (18:00 ET open) correctly
DST-Aware: Uses New York timezone with automatic daylight saving adjustments
50% Equilibrium Line: Marks the midpoint of each gap - key level for entries
Days Ago Labels: Shows how old each gap is at a glance
Extension Modes: Choose between live-extending boxes or fixed-width boxes
Separate Color Schemes: Different colors for void vs overlap NWOGs, bullish vs bearish NDOGs
INPUTS
NWOG/NDOG Display
Show NWOGs / NDOGS: Master toggle
Extension Modes:
Maximum NWOGs: Limit displayed gaps
Show Void/Overlap Gaps: Toggle each type independently
Filter Settings
Size Filter:
Only Show Near Price: Enable/disable distance filtering
Distance Filter: Really Close / Balanced / Slightly Far
Styling
Box Transparency: Fill and border opacity
Midline Style: Solid / Dotted / Dashed
Label Style: Simple ("NWOG, 5d ago") or Descriptive ("NWOG (Void Bull), 5d ago")
Label Size: Tiny / Small / Normal / Large
RECOMMENDED SETTINGS
For intraday (1m-15m):
Size Filter: Filter Insignificant
Distance Filter: Really Close or Balanced
Show NDOGs: On
Maximum NDOGs: 5-10
For swing trading (1H-4H):
Size Filter: Juicy Gaps Only
Distance Filter: Balanced or Slightly Far
Show NWOGs: On
Maximum NWOGs: 10-20
TIMEFRAME NOTES
Works on daily timeframe and below. Above daily, the indicator disables itself since NWOG/NDOG gap detection requires daily open/close data.
ASSET SUPPORT
Automatically handles different market open times:
Forex:
Futures:
Stocks/indices:
FAQ
Why do gaps appear and disappear?
That's the distance filter working. As price moves, gaps that were far away become relevant and appear. Gaps that price leaves behind disappear. This keeps your chart focused on actionable levels.
What's the difference between void and overlap gaps?
Void gaps continue Friday's direction (trend continuation). Overlap gaps conflict with Friday's direction and don't actually have a volume gap in price. Different traders prefer different types so i chose to differentiate them.
Why can't I see any gaps?
Check your filter settings. "Juicy Gaps Only" with "Really Close" distance filter is very selective. Try "Filter Insignificant" with "Balanced" for more gaps. Or simply turn off the filter if you are on an asset that has very few/no gaps... The indicator has gone through rigorous testing.
DISCLAIMER
This indicator is for educational purposes only. Opening gaps are one tool among many - they don't guarantee fills or reversals. Always use proper risk management and never trade based on a single indicator. Past gap fills don't guarantee future performance. Do your own analysis.
CHANGELOG
Pro +: Added smart size/distance filtering, void/overlap classification, NDOG support, DST-aware timezone handling. Tradingview handles the actual time shift.
Base: Initial NWOG visualization
Made with ❤️ by cephxs
Nexural ORB Nexural ORB - Multi-Timeframe Opening Range Breakout Indicator
Introduction
This indicator was built out of frustration. After testing dozens of ORB tools, both free and paid, I found that most of them either did too little or cluttered the chart with unnecessary information. The Opening Range Breakout is one of the oldest and most reliable intraday strategies, yet most indicators treat it as an afterthought - just a box on the chart with no context.
This is not that kind of indicator.
The Nexural Ultimate ORB tracks the Opening Range across three timeframes simultaneously, provides quality scoring to help you identify high-probability setups, detects when multiple levels align for confluence, and now includes historical ORB data so you can scroll back and review previous sessions. It does not tell you when to buy or sell. It does not promise profits. What it does is give you clean, accurate levels with the context you need to make informed decisions.
I am going to be completely transparent about what this indicator does, how it works, what it does well, and where it falls short. If you are looking for a magic solution that prints money, this is not it. If you are looking for a professional-grade tool that will become a permanent part of your charting setup, keep reading.
What Is The Opening Range Breakout
Before diving into the indicator itself, let me explain the strategy it is built around.
The Opening Range is simply the high and low price established during the first portion of the trading session. For US equities and futures, this typically begins at 9:30 AM Eastern Time. The theory behind trading the Opening Range is straightforward: the first 15, 30, or 60 minutes of trade often sets the tone for the rest of the day. Institutional traders, algorithms, and market makers are all actively positioning during this window, and the levels they establish become reference points for the remainder of the session.
When price breaks above the Opening Range High, it suggests bullish momentum and the potential for continuation higher. When price breaks below the Opening Range Low, it suggests bearish momentum and the potential for continuation lower. The strategy has been used by floor traders for decades and remains relevant today because the underlying market dynamics have not changed - the open is when the most information gets priced in, and the levels established during that period matter.
This indicator does not trade the ORB for you. It identifies the levels, tracks multiple timeframes, and provides context. The actual trading decisions are yours.
How The Opening Range Is Calculated
The indicator calculates the Opening Range for three timeframes:
The 15-Minute ORB captures the high and low from 9:30 AM to 9:45 AM. This is the shortest timeframe and typically produces the tightest range. Breakouts from the 15-minute ORB tend to occur earliest in the session and can provide early directional signals, though they are also more prone to false breakouts due to the narrow range.
The 30-Minute ORB captures the high and low from 9:30 AM to 10:00 AM. This is considered by many institutional traders to be the most significant timeframe. The 30-minute window allows enough time for the initial volatility to settle while still capturing the core opening activity. Many professional trading desks reference the 30-minute ORB as their primary intraday framework.
The 60-Minute ORB captures the high and low from 9:30 AM to 10:30 AM. This is the widest range and produces fewer signals, but those signals tend to be more reliable. The 60-minute ORB is particularly useful on high-volatility days when the 15 and 30-minute ranges get quickly violated.
The calculation itself is simple. As each bar completes during the opening period, the indicator compares the current high and low to the stored values and updates them if new extremes are reached. Once the timeframe completes, the levels lock in and do not change for the rest of the session.
I want to be absolutely clear about one thing: there is no repainting. The ORB levels are calculated in real-time as the opening period develops. Once a timeframe completes, those levels are final. You will not look back at your chart and see different levels than what appeared in real-time. This is critically important for any indicator you use for actual trading decisions.
Visual Hierarchy and Line Styles
One of the main problems with multi-timeframe indicators is visual clutter. When you have six lines on the chart representing three different ORBs, it becomes difficult to quickly identify which level belongs to which timeframe.
This indicator solves that problem through a clear visual hierarchy. Each timeframe has its own color, line width, and line style, all of which are fully customizable.
By default, the 15-Minute ORB uses solid lines with the heaviest weight. This makes it the most prominent on the chart because it is typically the first level to be tested and often the most actively traded.
The 30-Minute ORB uses dashed lines with a medium weight. This keeps it visible but clearly secondary to the 15-minute levels.
The 60-Minute ORB uses dotted lines with a medium weight. This places it in the background as a reference level rather than an active trading zone.
You can change any of these settings. If you prefer to trade the 30-minute ORB exclusively, you can make it solid and bold while keeping the others subtle. If you only want to see the 60-minute ORB, you can disable the other two entirely. The flexibility is there because every trader has different preferences.
The dashboard in the top right corner of the chart displays the corresponding line style next to each timeframe, so you always know which line on the chart matches which row in the dashboard.
The Quality Scoring System
Not every Opening Range is worth trading. Some days produce tight, clean ranges with strong follow-through. Other days produce wide, choppy ranges that lead to multiple false breakouts. One of the most valuable features of this indicator is the Quality Score, which grades each session from A-plus down to C.
The Quality Score is calculated based on several factors:
Range Size is the most important factor. The indicator compares the current ORB range to the average daily range over the past 20 sessions. A tight range, defined as less than 40 percent of the average daily range, receives the highest score. The logic here is simple: tight ranges indicate consolidation, and consolidation often precedes expansion. When the ORB is tight, a breakout has more room to run.
A normal range, between 40 and 80 percent of the average daily range, receives a moderate score. These are typical trading days without any particular edge from a range perspective.
A wide range, greater than 80 percent of the average daily range, receives the lowest score. When the ORB is already wide, much of the day's move may have already occurred during the opening period, leaving less opportunity for breakout continuation.
Volume is the second factor. Above-average volume during the opening period indicates genuine institutional participation. The indicator compares the current volume to the 20-bar average. Significantly elevated volume adds to the quality score, while below-average volume does not penalize the score but does not help it either.
Day of Week matters more than most traders realize. Statistical studies of market behavior consistently show that Tuesday, Wednesday, and Thursday produce cleaner trending days than Monday or Friday. Monday mornings often see erratic price action as the market digests weekend news and repositions. Friday afternoons often see reduced participation as traders close out positions before the weekend. The quality score reflects these tendencies by adding points for mid-week sessions and subtracting points for Monday mornings and Friday afternoons.
Overnight Activity is relevant primarily for futures traders. If the overnight session produced a significant range, defined as greater than half of the average true range, it suggests that institutions were active during the overnight hours. This often leads to more directional behavior during the regular session.
The quality score is displayed in the dashboard as a letter grade. A-plus indicates excellent conditions across multiple factors. A indicates good conditions. B indicates average conditions. C indicates below-average conditions that warrant caution.
I want to be honest about the limitations of this system. The quality score is a guideline, not a guarantee. A C-rated day can still produce a profitable breakout. An A-plus day can still result in a failed breakout that reverses. The score helps you calibrate your expectations and position sizing, but it does not predict the future.
Confluence Detection
Confluence occurs when multiple significant price levels cluster together within a tight range. When the 15-minute ORB high aligns with the overnight high, or when the ORB low sits right at the session opening price, you have confluence. These zones tend to produce stronger reactions because multiple types of traders are watching the same level.
The indicator automatically detects confluence using a tolerance-based system. By default, the tolerance is set to 0.15 percent of price. This means that if two levels are within 0.15 percent of each other, they are considered confluent.
The levels that are checked for confluence include the Session Opening Price, which is the exact price at 9:30 AM. This level matters because it represents the point where the market transitioned from overnight to regular session trading. Many traders reference the opening print throughout the day.
The Overnight High and Low are also checked. For futures markets, this includes all trading from 6:00 PM the previous evening through 9:29 AM. For stocks, this includes extended hours trading. These levels represent the extremes established before the regular session began.
Finally, the indicator checks whether the ORB levels from different timeframes align with each other. When the 15-minute high matches the 30-minute high, that level gains additional significance.
When confluence is detected, two things happen on the chart. First, the affected ORB line changes color to gold, making it visually obvious that this level has additional significance. Second, the dashboard displays a Confluence row at the bottom, alerting you to the condition.
The Confluence label also appears directly on the chart, positioned within the ORB zone so you can immediately see where the confluence exists.
Smart Label System
A common problem with indicators that display multiple price levels is label overlap. When you have six ORB levels plus auxiliary levels like the session open and overnight high and low, the right side of the chart can become a cluttered mess of overlapping text.
This indicator solves that problem with a smart labeling system that combines matching levels. If the 15-minute low, 30-minute low, and 60-minute low are all at the same price, instead of displaying three separate labels, the indicator displays a single label that reads 15L/30L/60L followed by the price.
The system uses a tolerance of 2 percent of the ORB range to determine whether levels are close enough to combine. This keeps the labels clean while still displaying separate labels when levels are meaningfully different.
The labels are positioned to the right of the current price action, extending beyond the last bar so they remain visible as new bars form. Each label includes the level identifier and the exact price value.
Historical ORB Display
This feature addresses one of the most common limitations of ORB indicators: the inability to see previous sessions when scrolling back through your chart.
With the history feature enabled, the indicator stores ORB data for up to 20 previous sessions. When you scroll back in time, you will see the ORB levels for each historical session, drawn from the session start to the session end.
Historical ORBs are displayed with slightly faded colors, using 50 percent transparency compared to the current session. This creates a clear visual distinction between current and historical levels while still allowing you to analyze past price action relative to those levels.
The history depth is configurable. You can set it anywhere from 1 to 20 days depending on your needs. If you primarily care about the current session and the previous day for context, set it to 1 or 2. If you want to analyze an entire week or more of ORB behavior, increase the setting.
You can also disable the history feature entirely by enabling Current Session Only mode. This returns the indicator to showing only the active session, which some traders prefer for a cleaner chart during live trading.
Breakout Detection and Filters
The indicator marks breakouts with triangle signals. A green triangle below the bar indicates a bullish breakout above the ORB high. A red triangle above the bar indicates a bearish breakout below the ORB low.
However, not every crossing of an ORB level represents a valid breakout worth acting on. The indicator includes several filters to reduce false signals.
The Volume Filter requires that volume on the breakout bar be at least 1.2 times the 20-bar average volume. You can adjust this multiplier in the settings. The logic is straightforward: breakouts on weak volume are more likely to fail. A genuine breakout that is going to follow through should be accompanied by above-average participation.
The Time Filter prevents breakout signals after a specified hour. The default is 2:00 PM Eastern. The rationale is that late-session breakouts often lack follow-through because there is not enough trading time remaining for the move to develop. You can adjust or disable this filter based on your trading style.
The Single Trigger mechanism ensures that each breakout fires exactly once per session. If price crosses above the ORB high, you will see one bullish signal on the bar where the crossing occurred. If price subsequently pulls back and crosses above again, you will not see a second signal. This prevents signal spam and keeps your chart clean.
The indicator also includes Reclaim Detection. If price breaks out and then returns back inside the ORB zone, you will see a warning signal marked with an X. This condition often indicates a failed breakout and potential reversal. It is not a trade signal, but rather information that the breakout you just witnessed may not be valid.
Range Extensions
Once the ORB is established, many traders look for profit targets based on the range itself. The indicator includes extension levels that project multiples of the ORB range above and below the extremes.
By default, two extension levels are shown: 1.0 times the range and 1.5 times the range. If the 15-minute ORB is 50 points, the 1.0 extension above the high would be 50 points above the high, and the 1.5 extension would be 75 points above the high.
These extensions serve as potential profit targets for breakout trades. The 1.0 extension represents a measured move equal to the ORB itself. The 1.5 extension represents a slightly more ambitious target.
You can adjust the extension multipliers in the settings. Some traders prefer 0.5 and 1.0. Others prefer 1.0 and 2.0. The flexibility is there to match your trading approach.
The extension lines are displayed as faint dotted lines so they do not compete visually with the ORB levels themselves. The labels show the multiplier value along with the exact price.
## The Midline
The 50 percent level of the ORB, known as the midline, is displayed as a dashed line within the ORB zone. This level matters because it often acts as short-term support or resistance during consolidation periods within the range.
When price is trading inside the ORB and approaches the midline, you may see a reaction. The midline can also serve as a reference for whether price is showing strength or weakness within the range. If price is spending most of its time above the midline, that suggests a bullish bias even before a breakout occurs. If price is spending most of its time below the midline, that suggests a bearish bias.
The midline can be disabled in the settings if you prefer a cleaner chart.
The Dashboard
The dashboard is positioned in the top right corner of the chart and provides all relevant ORB information at a glance.
The header row displays the indicator name, the current Quality Score grade, the Range Classification, and the Session Status.
The Range Classification shows whether the current 15-minute ORB is Tight, Normal, or Wide compared to the 20-day average. This gives you immediate context about whether the range is unusual in either direction.
The Session Status shows whether the market is currently in session or closed. A green Live indicator means the session is active. A red Closed indicator means the session has ended.
Below the header, each timeframe row displays the following information:
The Timeframe column shows 15m, 30m, or 60m along with a visual indicator of the line style you have selected for that timeframe.
The High column displays the ORB high price for that timeframe.
The Low column displays the ORB low price for that timeframe.
The Range column displays the distance between high and low.
The Status column shows the current state. Before the ORB completes, this shows a countdown of minutes remaining. After completion, it shows whether the price has broken out bullish, broken out bearish, or remains in range.
Below the timeframe rows, the Distance row shows how far the current price is from the nearest ORB level. This helps you gauge whether price is approaching a potential breakout zone.
If confluence is detected, a highlighted row appears at the bottom of the dashboard indicating that significant level alignment exists.
Supported Markets and Sessions
The indicator supports multiple market types with appropriate session times:
US Stocks use a session from 9:30 AM to 4:00 PM Eastern.
US Futures use a session from 9:30 AM to 4:00 PM Eastern, with overnight tracking from 6:00 PM the previous evening.
Forex uses a 24-hour session since the market trades continuously.
Crypto uses a 24-hour session since the market trades continuously.
Custom allows you to define your own session times for markets not covered by the presets.
The timezone is configurable. The default is America/New_York, but you can change it to Chicago, Los Angeles, London, Tokyo, or UTC depending on your location and preference.
Settings Overview
The settings are organized into logical groups:
General settings include the market type, current session only toggle, and history days.
Session settings include custom session times and timezone selection.
ORB Timeframes settings include individual toggles for showing or hiding each timeframe, color selection, line width, and line style. This is where you customize the visual appearance of each ORB level.
Quality Scoring settings include the ATR period and range comparison lookback. These affect how the quality score is calculated.
Confluence Detection settings include the tolerance percentage and toggles for the session open and overnight high and low levels.
Breakout Settings include the volume filter toggle and multiplier, time filter toggle and cutoff hour, and reclaim detection toggle.
Visuals settings include toggles for the fill zone, labels, dashboard, distance display, and midline.
Extensions settings include toggles for showing extensions and the multiplier values for each extension level.
How I Use This Indicator
I will share my personal approach, though you should adapt it to your own style.
First, I wait for the ORB to complete. I do not trade during the first 15 to 30 minutes of the session. The levels are still forming, and the price action during this window is often erratic. I let the dust settle and the range establish itself.
Second, I check the Quality Score. If it is an A or A-plus day with a tight range and good volume, I am more aggressive. If it is a C day with a wide range on a Friday afternoon, I am either sitting on my hands or trading with reduced size.
Third, I look for confluence. If the 15-minute high is sitting right at the overnight high, that level has additional significance. Breakouts through confluence zones tend to be more decisive.
Fourth, I confirm with volume. Even though the indicator filters for volume, I still glance at the volume bars. I want to see that breakout candle have conviction.
Fifth, I manage expectations based on range type. If the ORB is tight, I expect an explosive move and give the trade room to develop. If the ORB is wide, I expect choppier action and tighten my parameters.
Sixth, I use the distance reading. If price is already 50 points beyond the ORB high and the range was only 40 points, I have missed the move. Chasing extended price is not smart trading.
Honest Pros and Cons
What this indicator does well:
It provides clean, accurate ORB levels that do not repaint. This is the foundation, and it is done correctly.
It offers multi-timeframe tracking with clear visual differentiation. You can see all three ORBs at once without confusion.
The quality scoring system helps you avoid low-probability setups. It is not perfect, but it adds valuable context.
The confluence detection highlights significant level alignment automatically. This saves you from manually checking multiple levels.
The smart label system prevents visual clutter. Labels combine when appropriate and remain readable.
The historical ORB display allows you to scroll back and review previous sessions. This is valuable for analysis and pattern recognition.
The customization is extensive. Every visual element can be adjusted to match your preferences.
It works across stocks, futures, forex, and crypto with appropriate session handling.
What this indicator does not do:
It does not give you buy and sell signals with entries and exits. This is a levels and analysis tool, not a trading system.
It does not include backtesting or performance tracking. You need a separate strategy tester for that.
It does not guarantee that breakouts will follow through. The filters help, but failed breakouts still occur.
The quality score is a guideline, not a prediction. Low-quality days can still produce good trades. High-quality days can still produce losing trades.
The confluence detection is proximity-based. It identifies when levels are near each other but does not know if those levels are actually significant to other traders.
Technical limitations to be aware of:
On chart timeframes larger than 15 minutes, the ORB calculation becomes less precise because you have fewer bars in the opening period. This indicator works best on 1 to 15 minute charts.
The overnight high and low tracking works best on futures. Stocks do not have true overnight sessions in the same way.
If your chart does not have volume data, the volume filter will not function properly.
Risk Management
This section is not about the indicator. It is about trading.
No indicator, no matter how well designed, can protect you from poor risk management. Before you trade any ORB breakout, you need to define your risk.
Where is your stop? A common approach is to place the stop on the opposite side of the ORB zone. If you are taking a bullish breakout above the high, your stop goes below the low. This means your risk is the full ORB range plus any slippage.
Is that risk acceptable? If the ORB range is 100 points and you are trading a 50 dollar per point contract, your risk is 5000 dollars plus commissions. Can you afford that loss? If not, either reduce your size or skip the trade.
Where is your target? The extensions provide potential targets, but you need to decide in advance where you will take profits. Hoping for an unlimited run while watching your profits evaporate is not a strategy.
What is your win rate? ORB breakouts do not work every time. Depending on the market and conditions, you might win 50 to 60 percent of the time. That means you will have losing trades. Are you prepared for a string of three or four losers in a row? It will happen.
None of this is specific to this indicator. It applies to all trading. But I include it here because I see too many traders focus on the indicator while ignoring the fundamentals of risk management. The indicator can help you identify setups. It cannot manage your risk for you.
Final Thoughts
I built this indicator for my own trading, then refined it to the point where I felt comfortable sharing it. It is not a holy grail. It will not make you profitable if you do not already have a trading process. What it will do is give you clean, accurate ORB levels with context that most indicators do not provide.
The Opening Range Breakout works because institutions and algorithms reference these same levels. When the first 30 or 60 minutes of trading establishes a range, that becomes a reference point for the rest of the session. This indicator makes those levels visible and adds intelligence around when they are worth paying attention to.
Use it as a tool, not a crutch. Combine it with your own analysis. Manage your risk properly. And please, do not trade with money you cannot afford to lose.
If you have questions or feedback, I am actively maintaining this indicator and will consider feature requests for future updates.
Trade well.
Tags
ORB, Opening Range Breakout, Intraday, Day Trading, Futures, Stocks, Multi-Timeframe, Breakout, Support Resistance, Session, NQ, ES, SPY, QQQ, Opening Range, Institutional Levels
Recommended Timeframes
This indicator works best on 1-minute, 2-minute, 3-minute, 5-minute, 10-minute, and 15-minute charts. It can be used on higher timeframes, but the ORB calculation becomes less precise.
Recommended Markets
US Stock Indices and Futures including ES, NQ, YM, RTY, SPY, QQQ, DIA, IWM. Individual stocks with sufficient liquidity. Forex major pairs. Cryptocurrency with defined trading sessions.

Bollinger Bands Delta Matrix Analytics [BDMA] Bollinger Bands Delta Matrix Analytics (BDMA) v7.0
Deep Kinetic Engine – 5x8 Volatility & Delta Decision Matrix
1. Introduction & Concept
Bollinger Bands Delta Matrix Analytics (BDMA) v7.0 is an analytical framework that merges:
- Spatial analysis via Bollinger Bands (%B location),
- with a 4-factor Deep Kinetic Engine based on:
• Total Volume
• Buy Volume
• Sell Volume
• Delta (Buy – Sell) Z-Scores
and converts them into an expanded 5×8 decision matrix that continuously tracks where price is trading and how the underlying orderflow is behaving.
BDMA is not a trading system or strategy. It does not generate entry/exit signals.
Instead, it provides a structured contextual map of volatility, volume, and delta so traders can:
- identify climactic extensions vs. fakeouts,
- distinguish strong initiative moves vs. passive absorption,
- and detect squeezes, traps, and liquidity voids with a unified visual dashboard.
2. Spatial Engine – Bollinger S-States (S1–S5)
The spatial dimension of BDMA comes from classic Bollinger Bands.
Price location is expressed as Percent B (%B) and mapped into 5 spatial states (S-States):
S1 – Hyper Extension (Above Upper Band)
Price has pushed beyond the upper Bollinger Band.
Often associated with parabolic or blow-off behavior, late-stage momentum, and elevated reversal risk.
S2 – Resistance Test (Upper Zone)
Price trades in the upper Bollinger region but remains inside the bands.
Represents a sustained test of resistance, typically within an established or emerging uptrend.
S3 – Neutral Zone (Middle)
Price hovers around the mid-band.
This is the mean reversion gravity field where the market often consolidates or transitions between regimes.
S4 – Support Test (Lower Zone)
Price trades in the lower Bollinger region but inside the bands.
Represents a sustained test of support within range or downtrend structures.
S5 – Hyper Drop (Below Lower Band)
Price extends below the lower Bollinger Band.
Often aligned with panic, forced liquidations, or capitulation-type behavior, with increased snap-back risk.
These 5 S-States define the vertical axis (rows) of the BDMA matrix.
3. Deep Kinetic Engine – 4-Factor Z-Score & D-States (D1–D8)
The Deep Kinetic Engine transforms raw volume and delta into standardized Z-Scores to measure how abnormal current activity is relative to its recent history.
For each bar:
- Raw Buy Volume is estimated from the candle’s position within its range
- Raw Sell Volume is complementary to buy volume
- Raw Delta = Buy Volume – Sell Volume
- Total Volume = Buy Volume + Sell Volume
These 4 series are then normalized using a unified Z-Score lookback to produce:
1. Z_Vol_Total – overall activity and liquidity intensity
2. Z_Vol_Buy – aggression from buyers (attack)
3. Z_Vol_Sell – aggression from sellers (defense or attack)
4. Z_Delta – net victory of one side over the other
Thresholds for Extreme, Significant, and Neutral Z-Score levels are fully configurable, allowing you to tune the sensitivity of the kinetic states.
Using Z_Vol_Total and Z_Delta (plus threshold logic), BDMA assigns one of 8 Deep Kinetic states (D-States):
D1 – Climax Buy
Extreme Total Volume + Extreme Positive Delta → Buying climax or blow-off behavior.
D2 – Strong Buy
High Volume + High Positive Delta → Confirmed bullish initiative activity.
D3 – Weak Buy / Fakeout
Low Volume + High Positive Delta → Bullish delta without commitment, low-liquidity breakout risk.
D4 – Absorption / Conflict
High Volume + Neutral Delta → Aggressive two-way trade, strong absorption, war zone behavior.
D5 – Neutral
Low Volume + Neutral Delta → Low-energy environment with low conviction.
D6 – Weak Sell / Fakeout
Low Volume + High Negative Delta → Bearish delta without commitment, low-liquidity breakdown risk.
D7 – Strong Sell
High Volume + High Negative Delta → Confirmed bearish initiative activity.
D8 – Capitulation
Extreme Volume + Extreme Negative Delta → Panic selling or capitulation regime.
These 8 D-States define the horizontal axis (columns) of the BDMA matrix.
4. The 5×8 BDMA Decision Matrix
The core of BDMA is a 5×8 matrix where:
- Rows (1–5) = Spatial S-States (S1…S5)
- Columns (1–8) = Kinetic D-States (D1…D8)
Each of the 40 possible combinations (SxDy) is pre-computed and mapped to:
- a Status or Regime Title (for example: Climax Breakout, Bear Trap Spring, Capitulation Breakdown),
- a Bias (Climactic Bull, Neutral, Strong Bear, Conflict or Reversal Risk, and similar labels),
- and a Strategic Signal or Consideration (for example: High reversal risk, Wait for confirmation, Low probability zone – avoid).
Internally, BDMA resolves all 40 regimes so the current state can be displayed on the dashboard without performance overhead.
5. Key Regime Families (How to Read the Matrix)
5.1. Breakouts and Breakdowns
Climax Breakout (Top-side)
Spatial S1 with Kinetic D1 or D2
Bias: Explosive or Extreme Bull
Signal:
- Strong or climactic upside extension with abnormal bullish orderflow.
- Trend continuation is possible, but reversal risk is extremely high after blow-off phases.
Low-Conviction Breakout (Fakeout Risk)
S1 with D3 (Weak Buy, low liquidity)
Bias: Weak Bull – Caution
Signal:
- Breakout not supported by volume.
- Elevated risk of failed auction or bull trap.
Capitulation Breakdown (Bottom-side)
Spatial S5 with Kinetic D8
Bias: Climactic Bear (panic)
Signal:
- Capitulation-type selling or forced liquidations.
- Trend can still proceed, but snap-back or violent short-covering risk is high.
Initiative Breakdown vs. Weak Breakdown
- Strong, high-volume breakdown typically corresponds to D7 (Strong Sell).
- Low-volume breakdown often corresponds to D6 (Weak Sell or Fakeout) with potential for failure.
5.2. Absorption, Traps and Springs
Absorption at Resistance (Top-side conflict)
S1 or S2 with D4 (Absorption or Conflict)
Bias: Conflict – Extreme Tension
Signal:
- Heavy two-way trade near resistance.
- Potential distribution or reversal if sellers begin to dominate.
Bull Trap or Failed Auction
Typically S1 with D6 (Weak Sell breakdown behavior after a top-side attempt)
Indicates a breakout attempt that fails and reverses, often after poor liquidity structure.
Absorption at Support and Bear Trap (Spring)
S4 or S5 with D4 or D3
Bias: Conflict or Weak Bear – Reversal Risk
Signal:
- Aggressive buying into lows (spring or shakeout behavior).
- Potential bear trap if price reclaims lost territory.
5.3. Trend Phases
Strong Uptrend Phases
Typically seen when S2–S3 combine with strong bullish kinetic behavior.
Bias: Strong or Extreme Bull
Signal:
- Pullbacks into S3 or S4 with supportive kinetic states often act as trend continuation zones.
Strong Downtrend Phases
Typically seen when S3–S4 combine with strong bearish kinetic behavior.
Bias: Strong or Extreme Bear
Signal:
- Rallies into resistance with strong bearish kinetic backing may act as continuation sell zones.
5.4. Neutral, Exhaustion and Squeeze
Exhaustion or Liquidity Void
S1 or S5 with D5 (Neutral kinetics)
Bias: Neutral or Exhaustion
Signal:
- Spatial extremes without kinetic confirmation.
- Often marks the end of a move, with poor follow-through.
Choppy, Low-Activity Range
S3 with D5
Bias: Neutral
Signal:
- Low volume, low conviction market.
- Typically a low-probability environment where standing aside can be logical.
Squeeze or High-Tension Zone
S3 with D4 or tightly clustered kinetic values
Bias: Conflict or High Tension
Signal:
- Hidden battle inside a volatility contraction.
- Often precedes large directionally-biased moves.
6. Dashboard Layout & Reading Guide
When Show Dashboard is enabled, BDMA displays:
1. Title and Status Line
Name of the current regime (for example: Climax Breakout, Bear Trap Spring, Mean Reversion).
2. Bias Line
Plain-language summary of directional context such as Climactic Bull, Strong Bear, Neutral, or Conflict and Reversal Risk.
3. Signal or Strategic Notes
Concise guidance focused on risk and context, not entries. For example:
- High reversal risk – aggressive traders only
- Wait for confirmation (break or rejection)
- Low probability zone – avoid taking new positions
4. Kinetic Profile (4-Factor Z-Score)
Shows the current Z-Scores for Total Volume (Activity), Buy Volume (Attack), Sell Volume (Defense), and Delta (Net Result).
5. Matrix Heatmap (5×8)
Visual representation of S-State vs. D-State with color coding:
- Bullish clusters in a green spectrum
- Bearish clusters in a red spectrum
- Conflict or exhaustion zones in yellow, amber, or neutral tones
The dashboard can be repositioned (top right, middle right, or bottom right) and its size can be adjusted (Tiny, Small, Normal, or Large) to fit different layouts.
7. Inputs & Customization
7.1. Core Parameters (Bollinger and Z-Score)
- Bollinger Length and Standard Deviation define the spatial engine.
- Z-Score Lookback (All Factors) defines how many bars are used to normalize volume and delta.
7.2. Deep Kinetic Thresholds
- Extreme Threshold defines what is considered climactic (D1 or D8).
- Significant Threshold distinguishes strong initiative vs. weak or fakeout behavior.
- Neutral Threshold is the band within which delta is treated as neutral.
These thresholds allow you to tune the sensitivity of the kinetic classification to fit different timeframes or instruments.
7.3. Calculation Method (Volume Delta)
Geometry (Approx)
- Fast, non-repainting approach based on candle geometry.
- Suitable for most users and real-time decision-making.
Intrabar (Precise)
- Uses lower-timeframe data for more precise volume delta estimation.
- Intrabar mode can repaint and requires compatible data and plan support on the platform.
- Best used for post-analysis or research, not blind automation.
7.4. Visuals and Interface
- Toggle Bollinger Bands visibility on or off.
- Switch between Dark and Light color themes.
- Configure dashboard visibility, matrix heatmap display, position, and size.
8. Multi-Language Semantic Engine (Asia and Middle East Focus)
BDMA v7.0 includes a fully integrated multi-language layer, targeting a wide geographic user base.
Supported Languages:
English, Türkçe, Русский, 简体中文, हिन्दी, العربية, فارسی, עברית
All dashboard labels, regime titles, bias descriptions, and signal texts are dynamically translated via an internal dictionary, while semantic meaning is kept consistent across languages.
This makes BDMA suitable for multi-language communities, study groups, and educational content across different regions.
However, due to the heavy computational load of the Deep Kinetic Engine and TradingView’s strict Pine Script execution limits, it was not possible to expand support to additional languages. Adding more translation layers would significantly increase memory usage and exceed runtime constraints. For this reason, the current language set represents the maximum optimized configuration achievable without compromising performance or stability.
9. Practical Usage Notes
BDMA is most powerful when used as a contextual overlay on top of market structure (HH, HL, LH, LL), higher-timeframe trend, key levels, and your own execution framework.
Recommended usage:
- Identify the current regime (Status and Bias).
- Check whether price location (S-State) and kinetic behavior (D-State) agree with your trade idea.
- Be especially cautious in climactic and absorption or conflict zones, where volatility and risk can be elevated.
Avoid treating BDMA as an automatic green equals buy, red equals sell tool.
The real edge comes from understanding where you are in the volatility or kinetic spectrum, not from forcing signals out of the matrix.
10. Limitations & Important Warnings
BDMA does not predict the future.
It organizes current and recent data into a structured context.
Volume data quality depends on the underlying symbol, exchange, and broker feed.
Forex, crypto, indices, and stocks may all behave differently.
Intrabar mode can repaint and is sensitive to lower-timeframe data availability and your plan type.
Use it with extra caution and primarily for research.
No indicator can remove the need for clear trading rules, disciplined risk management, and psychological control.
11. Disclaimer
This script is provided strictly for educational and analytical purposes.
It is not a trading system, signal service, financial product, or investment advice.
Nothing in this indicator or its description should be interpreted as a recommendation to buy or sell any asset.
Past behavior of any indicator or market pattern does not guarantee future results.
Trading and investing involve significant risk, including the risk of losing more than your initial capital in leveraged products.
You are solely responsible for your own decisions, risk management, and results.
By using this script, you acknowledge that you understand these risks and agree that the author or authors and publisher or publishers are not liable for any loss or damage arising from its use.

Volume Intelligence Pro [Abusuhil]═══════════════════════════════════════════════════════════════════════════════
📊 VOLUME INTELLIGENCE TABLE - PROFESSIONAL VOLUME ANALYSIS INDICATOR
═══════════════════════════════════════════════════════════════════════════════
🌐 BILINGUAL SUPPORT: Full support for English and Arabic languages - switch instantly from settings!
🎯 COMPREHENSIVE VOLUME ANALYSIS DASHBOARD
This advanced indicator provides institutional-grade volume analysis through an elegant, customizable table that displays critical volume metrics in real-time. Designed for professional traders who need deep insights into market volume dynamics, order flow, and smart money movements.
═══════════════════════════════════════════════════════════════════════════════
✨ KEY FEATURES
═══════════════════════════════════════════════════════════════════════════════
🔷 BILINGUAL INTERFACE
• Seamless switching between English and Arabic
• All metrics, labels, and signals fully translated
• Perfect for international traders
🔷 VOLUME FUNDAMENTALS
• Current Volume: Real-time volume tracking
• Volume SMA: Moving average for volume comparison
• Volume Ratio: Current volume vs average (identifies abnormal activity)
• Volume % Change: Percentage change from previous bar
• Volume Delta: Difference between buying and selling pressure
🔷 VOLUME SPIKE DETECTION (4 LEVELS)
• Weak Spike: 1.5x average volume
• Medium Spike: 2.0x average volume
• Strong Spike: 2.5x average volume
• Extreme Spike: 3.0x+ average volume
• Visual alerts with color-coded indicators
🔷 ADVANCED BUY/SELL PRESSURE ANALYSIS
• Buy Volume: Bullish candle volume accumulation
• Sell Volume: Bearish candle volume accumulation
• Buy Pressure %: Percentage of buying pressure
• Sell Pressure %: Percentage of selling pressure
• Pressure Dominance: Who controls the market (Buyers/Sellers/Neutral)
• Candle Body Strength: Measures conviction in price movement
• Imbalance Volume: Detects wick imbalances
• Volume Delta (HLC3): Advanced delta calculation
• Weighted Delta: Volume-weighted price movement
• Pressure Lookback: Multi-candle pressure analysis (optimized for performance)
🔷 TECHNICAL INDICATORS INTEGRATION
• VWMA (Volume Weighted Moving Average): Price vs VWMA positioning
• OBV (On Balance Volume): Trend detection with EMA smoothing
• OBV Divergence: Bullish/Bearish divergence detection
• MFI (Money Flow Index): Overbought/oversold conditions
• A/D Line (Accumulation/Distribution): Smart money tracking
🔷 AI-POWERED VOLUME INTELLIGENCE SCORING
• Entry Power: Measures volume strength combined with price movement
• Effort vs Result: Identifies climax situations (buying/selling exhaustion)
• Reversal Volume Analysis: Tracks volume at reversal candles
• Trend Integration: Combines trend direction with volume confirmation
• Bullish/Bearish Points: 11-point scoring system
• Volume Score: -100 to +100 scale (positive = bullish, negative = bearish)
• Confidence Level: Reliability percentage of the signal
• Final Signal: Clear BULLISH/BEARISH/NEUTRAL verdict
🔷 TRIPLE SIGNAL SYSTEM (Optional)
• Signal 1: Volume Score Based (customizable thresholds)
• Signal 2: Volume Spike + Candle Color (spike level selection)
• Signal 3: OBV Divergence Detection
• Independent on/off toggles for each signal
• Visual signals plotted on chart with triangles
• Combined signal alerts
🔷 COMPREHENSIVE ALERT SYSTEM
• Volume spike alerts (configurable levels)
• Signal 1, 2, 3 individual alerts
• Combined buy/sell signal alerts
• OBV trend change alerts
• Strong buying/selling pressure alerts
• Customizable alert frequency
═══════════════════════════════════════════════════════════════════════════════
📊 TABLE STRUCTURE & DISPLAY
═══════════════════════════════════════════════════════════════════════════════
The indicator features a professional 3-column table with the following sections:
📌 COLUMN HEADERS:
• INDICATOR: Metric name
• VALUE: Current reading
• STATUS: Visual status indicator (color-coded dots/icons)
📌 SECTION 1: VOLUME BASICS
Displays fundamental volume metrics with ratio indicators and percentage changes. Essential for understanding current market activity levels.
📌 SECTION 2: VOLUME SPIKE DETECTION
Real-time spike detection with 4 severity levels. Color-coded for instant recognition of abnormal volume.
📌 SECTION 3: BUY/SELL PRESSURE (ADVANCED)
Comprehensive order flow analysis with 10+ metrics. Includes advanced calculations like weighted delta, imbalance volume, and multi-candle pressure lookback.
📌 SECTION 4: VWMA ANALYSIS
Shows price position relative to volume-weighted moving average. Critical for identifying volume-supported moves.
📌 SECTION 5: OBV ANALYSIS
On Balance Volume trend and divergence detection. Helps identify smart money accumulation/distribution.
📌 SECTION 6: MFI ANALYSIS
Money Flow Index readings with overbought/oversold signals. Combines price and volume for comprehensive analysis.
📌 SECTION 7: A/D LINE
Accumulation/Distribution line trend analysis. Tracks institutional buying and selling.
📌 SECTION 8: VOLUME INTELLIGENCE
AI-powered scoring system with 11 evaluation points:
1. Volume strength assessment
2. Current buy/sell pressure
3. Multi-candle pressure lookback
4. Entry power calculation
5. Reversal volume tracking
6. VWMA position
7. OBV trend
8. OBV divergence
9. MFI signal
10. A/D trend
11. Trend-volume integration
Final output: Volume Score, Confidence Level, and highlighted FINAL SIGNAL.
═══════════════════════════════════════════════════════════════════════════════
⚙️ CUSTOMIZATION OPTIONS
═══════════════════════════════════════════════════════════════════════════════
🎨 TABLE DISPLAY
• Position: 9 locations (top-left, top-center, top-right, middle-left, etc.)
• Size: 5 sizes (tiny, small, normal, large, huge)
• Colors: Fully customizable background and text colors
• Sections: Show/hide any section independently
🎯 VOLUME SETTINGS
• Volume Average Length (default: 20)
• Spike Thresholds: Adjustable multipliers for each level
• Advanced Metrics: Lookback periods (optimized: 10 candles)
• Reversal Analysis: Candle count (optimized: 5 candles)
📊 INDICATOR LENGTHS
• OBV Smoothing: Default 14
• MFI Period: Default 14
• VWMA Length: Default 20
• A/D Length: Default 14
🎯 SIGNAL SYSTEM
• Enable/disable each signal independently
• Customizable thresholds for Signal 1 (score & confidence)
• Spike level selection for Signal 2
• Show/hide signals on chart
• Alert configuration for each signal type
═══════════════════════════════════════════════════════════════════════════════
🚀 PERFORMANCE & OPTIMIZATION
═══════════════════════════════════════════════════════════════════════════════
✅ REPLAY MODE OPTIMIZED
• Works flawlessly in TradingView Replay mode
• Optimized calculations for fast historical analysis
• No lag or freezing issues
✅ REAL-TIME EFFICIENCY
• Lightweight code structure (50 labels/lines limit)
• Smart caching of repeated calculations
• Limited loop iterations for optimal performance
• Updates only on last bar (table rendering)
✅ NON-REPAINTING
• All signals are confirmed on bar close
• No retrospective changes to historical signals
• Reliable for backtesting and strategy development
═══════════════════════════════════════════════════════════════════════════════
💡 USAGE RECOMMENDATIONS
═══════════════════════════════════════════════════════════════════════════════
📈 FOR DAY TRADING:
• Use 15m-1H timeframes
• Enable all sections for comprehensive analysis
• Focus on Volume Spike and Buy/Sell Pressure sections
• Set alerts for Strong and Extreme spikes
📈 FOR SWING TRADING:
• Use 4H-1D timeframes
• Focus on Volume Intelligence and OBV sections
• Enable Signal 1 and Signal 3 for swing entries
• Monitor divergences for trend reversals
📈 FOR SCALPING:
• Use 1m-5m timeframes
• Focus on Buy/Sell Pressure and Volume Basics
• Enable Signal 2 for quick spike-based entries
• Hide less relevant sections to reduce visual clutter
═══════════════════════════════════════════════════════════════════════════════
🎓 INDICATOR METHODOLOGY
═══════════════════════════════════════════════════════════════════════════════
This indicator combines classical volume analysis with modern algorithmic intelligence:
1. Volume Profiling: Identifies abnormal volume relative to historical averages
2. Order Flow Analysis: Separates buying and selling pressure using candle structure
3. Divergence Detection: Compares price action with volume indicators
4. Multi-Timeframe Approach: Uses smoothing and lookback for context
5. Scoring Algorithm: 11-point evaluation system for objective signal generation
6. Confluence Integration: Combines multiple indicators for higher probability setups
═══════════════════════════════════════════════════════════════════════════════
⚠️ DISCLAIMER
═══════════════════════════════════════════════════════════════════════════════
This indicator is a tool for analysis and should not be used as the sole basis for trading decisions. Always combine with your own analysis, risk management, and trading plan. Past performance does not guarantee future results.
═══════════════════════════════════════════════════════════════════════════════
📞 SUPPORT & UPDATES
═══════════════════════════════════════════════════════════════════════════════
• Regular updates and improvements
• Bug fixes and optimization
• Feature requests considered
• Community feedback welcomed
═══════════════════════════════════════════════════════════════════════════════
🌟 Happy Trading! May your volume analysis lead to profitable decisions! 🚀
═══════════════════════════════════════════════════════════════════════════════
═══════════════════════════════════════════════════════════════════════════════
═══════════════════════════════════════════════════════════════════════════════
📊 جدول معلومات الفوليوم - مؤشر احترافي لتحليل حجم التداول
═══════════════════════════════════════════════════════════════════════════════
🌐 دعم ثنائي اللغة: دعم كامل للغتين الإنجليزية والعربية - التبديل الفوري من الإعدادات!
🎯 لوحة معلومات شاملة لتحليل الفوليوم
مؤشر متقدم يوفر تحليلاً احترافياً للفوليوم من خلال جدول أنيق وقابل للتخصيص يعرض مقاييس الفوليوم الحيوية في الوقت الفعلي. مصمم للمتداولين المحترفين الذين يحتاجون إلى رؤى عميقة حول ديناميكيات حجم السوق، تدفق الأوامر، وحركة الأموال الذكية.
═══════════════════════════════════════════════════════════════════════════════
✨ الميزات الرئيسية
═══════════════════════════════════════════════════════════════════════════════
🔷 واجهة ثنائية اللغة
• التبديل السلس بين الإنجليزية والعربية
• جميع المقاييس والتسميات والإشارات مترجمة بالكامل
• مثالي للمتداولين العرب والدوليين
🔷 أساسيات الفوليوم
• الفوليوم الحالي: تتبع حجم التداول في الوقت الفعلي
• متوسط الفوليوم: المتوسط المتحرك للمقارنة
• نسبة الفوليوم: الحجم الحالي مقابل المتوسط (يحدد النشاط غير الطبيعي)
• تغير الفوليوم %: نسبة التغيير من الشمعة السابقة
• دلتا الفوليوم: الفرق بين ضغط الشراء والبيع
🔷 اكتشاف انفجارات الفوليوم (4 مستويات)
• انفجار ضعيف: 1.5 ضعف المتوسط
• انفجار متوسط: 2.0 ضعف المتوسط
• انفجار قوي: 2.5 ضعف المتوسط
• انفجار شديد: 3.0+ ضعف المتوسط
• تنبيهات بصرية مع مؤشرات ملونة
🔷 تحليل متقدم لضغط الشراء/البيع
• حجم الشراء: تراكم حجم الشموع الصاعدة
• حجم البيع: تراكم حجم الشموع الهابطة
• ضغط الشراء %: نسبة ضغط الشراء
• ضغط البيع %: نسبة ضغط البيع
• سيطرة الضغط: من يتحكم في السوق (المشترين/البائعين/محايد)
• قوة جسم الشمعة: يقيس قوة حركة السعر
• عدم التوازن: يكتشف اختلال توازن الفتائل
• دلتا الفوليوم (HLC3): حساب متقدم للدلتا
• الدلتا المرجح: حركة السعر المرجحة بالحجم
• تحليل الضغط متعدد الشموع: تحليل عدة شموع (محسّن للأداء)
🔷 تكامل المؤشرات الفنية
• VWMA (المتوسط المرجح بالحجم): موقع السعر مقابل VWMA
• OBV (الحجم التراكمي): اكتشاف الاتجاه مع تمهيد EMA
• تباعد OBV: كشف التباعدات الصعودية/الهبوطية
• MFI (مؤشر تدفق الأموال): حالات التشبع الشرائي/البيعي
• خط A/D (التراكم/التوزيع): تتبع الأموال الذكية
🔷 نظام تقييم ذكي مدعوم بالذكاء الاصطناعي
• قوة الدخول: يقيس قوة الفوليوم مع حركة السعر
• الجهد مقابل النتيجة: يحدد حالات الذروة (استنزاف الشراء/البيع)
• تحليل حجم الانعكاس: يتتبع الحجم عند شموع الانعكاس
• تكامل الاتجاه: يجمع اتجاه الترند مع تأكيد الفوليوم
• النقاط الصعودية/الهبوطية: نظام تقييم من 11 نقطة
• تقييم الفوليوم: مقياس من -100 إلى +100 (موجب = صعودي، سالب = هبوطي)
• مستوى الثقة: نسبة موثوقية الإشارة
• الإشارة النهائية: حكم واضح (صعودي/هبوطي/محايد)
🔷 نظام الإشارات الثلاثي (اختياري)
• الإشارة 1: بناءً على تقييم الفوليوم (عتبات قابلة للتخصيص)
• الإشارة 2: انفجار الفوليوم + لون الشمعة (اختيار مستوى الانفجار)
• الإشارة 3: كشف تباعد OBV
• تفعيل/إلغاء مستقل لكل إشارة
• إشارات بصرية على الشارت بمثلثات
• تنبيهات إشارات مجمعة
🔷 نظام تنبيهات شامل
• تنبيهات انفجار الفوليوم (مستويات قابلة للتهيئة)
• تنبيهات فردية للإشارات 1، 2، 3
• تنبيهات إشارات الشراء/البيع المجمعة
• تنبيهات تغيير اتجاه OBV
• تنبيهات ضغط الشراء/البيع القوي
• تردد التنبيهات قابل للتخصيص
═══════════════════════════════════════════════════════════════════════════════
📊 بنية الجدول والعرض
═══════════════════════════════════════════════════════════════════════════════
يتميز المؤشر بجدول احترافي من 3 أعمدة مع الأقسام التالية:
📌 عناوين الأعمدة:
• المؤشر: اسم المقياس
• القيمة: القراءة الحالية
• الحالة: مؤشر الحالة البصري (نقاط/رموز ملونة)
📌 القسم 1: أساسيات الفوليوم
يعرض مقاييس الفوليوم الأساسية مع مؤشرات النسب والتغيرات المئوية. ضروري لفهم مستويات نشاط السوق الحالي.
📌 القسم 2: كشف انفجارات الفوليوم
كشف فوري للانفجارات مع 4 مستويات من الشدة. ملون للتعرف الفوري على الحجم غير الطبيعي.
📌 القسم 3: ضغط الشراء/البيع (متقدم)
تحليل شامل لتدفق الأوامر مع أكثر من 10 مقاييس. يتضمن حسابات متقدمة مثل الدلتا المرجح، حجم عدم التوازن، وتحليل الضغط متعدد الشموع.
📌 القسم 4: تحليل VWMA
يعرض موقع السعر بالنسبة للمتوسط المرجح بالحجم. حاسم لتحديد الحركات المدعومة بالحجم.
📌 القسم 5: تحليل OBV
اتجاه الحجم التراكمي وكشف التباعدات. يساعد في تحديد تراكم/توزيع الأموال الذكية.
📌 القسم 6: تحليل MFI
قراءات مؤشر تدفق الأموال مع إشارات التشبع. يجمع بين السعر والحجم للتحليل الشامل.
📌 القسم 7: خط A/D
تحليل اتجاه خط التراكم/التوزيع. يتتبع الشراء والبيع المؤسسي.
📌 القسم 8: الذكاء الاصطناعي للفوليوم
نظام تقييم ذكي مع 11 نقطة تقييم:
1. تقييم قوة الفوليوم
2. ضغط الشراء/البيع الحالي
3. تحليل الضغط متعدد الشموع
4. حساب قوة الدخول
5. تتبع حجم الانعكاس
6. موقع VWMA
7. اتجاه OBV
8. تباعد OBV
9. إشارة MFI
10. اتجاه A/D
11. تكامل الاتجاه مع الفوليوم
الناتج النهائي: تقييم الفوليوم، مستوى الثقة، والإشارة النهائية المميزة.
═══════════════════════════════════════════════════════════════════════════════
⚙️ خيارات التخصيص
═══════════════════════════════════════════════════════════════════════════════
🎨 عرض الجدول
• الموقع: 9 مواقع (أعلى-يسار، أعلى-وسط، أعلى-يمين، وسط-يسار، إلخ)
• الحجم: 5 أحجام (صغير جداً، صغير، عادي، كبير، ضخم)
• الألوان: خلفية ونص قابل للتخصيص بالكامل
• الأقسام: إظهار/إخفاء أي قسم بشكل مستقل
🎯 إعدادات الفوليوم
• طول متوسط الفوليوم (افتراضي: 20)
• عتبات الانفجار: مضاعفات قابلة للتعديل لكل مستوى
• مقاييس متقدمة: فترات التحليل (محسّن: 10 شموع)
• تحليل الانعكاس: عدد الشموع (محسّن: 5 شموع)
📊 أطوال المؤشرات
• تمهيد OBV: افتراضي 14
• فترة MFI: افتراضي 14
• طول VWMA: افتراضي 20
• طول A/D: افتراضي 14
🎯 نظام الإشارات
• تفعيل/إلغاء كل إشارة بشكل مستقل
• عتبات قابلة للتخصيص للإشارة 1 (التقييم والثقة)
• اختيار مستوى الانفجار للإشارة 2
• إظهار/إخفاء الإشارات على الشارت
• تهيئة التنبيهات لكل نوع إشارة
═══════════════════════════════════════════════════════════════════════════════
🚀 الأداء والتحسين
═══════════════════════════════════════════════════════════════════════════════
✅ محسّن لوضع الريبلاي
• يعمل بسلاسة في وضع Replay في TradingView
• حسابات محسّنة للتحليل التاريخي السريع
• لا توجد مشاكل تأخير أو تجميد
✅ كفاءة الوقت الفعلي
• بنية كود خفيفة (حد 50 علامة/خط)
• تخزين ذكي للحسابات المتكررة
• تكرارات محدودة للحلقات للأداء الأمثل
• تحديثات فقط على آخر شمعة (عرض الجدول)
✅ غير قابل لإعادة الرسم
• جميع الإشارات مؤكدة عند إغلاق الشمعة
• لا توجد تغييرات بأثر رجعي على الإشارات التاريخية
• موثوق للاختبار الخلفي وتطوير الاستراتيجيات
═══════════════════════════════════════════════════════════════════════════════
💡 توصيات الاستخدام
═══════════════════════════════════════════════════════════════════════════════
📈 للتداول اليومي:
• استخدم فريمات 15د-1س
• فعّل جميع الأقسام للتحليل الشامل
• ركز على أقسام انفجار الفوليوم وضغط الشراء/البيع
• ضع تنبيهات للانفجارات القوية والشديدة
📈 للتداول المتأرجح:
• استخدم فريمات 4س-1ي
• ركز على أقسام الذكاء الاصطناعي و OBV
• فعّل الإشارة 1 والإشارة 3 لدخولات التأرجح
• راقب التباعدات لانعكاسات الاتجاه
📈 للمضاربة:
• استخدم فريمات 1د-5د
• ركز على ضغط الشراء/البيع وأساسيات الفوليوم
• فعّل الإشارة 2 لدخولات سريعة بناءً على الانفجارات
• أخفِ الأقسام الأقل صلة لتقليل الفوضى البصرية
═══════════════════════════════════════════════════════════════════════════════
🎓 منهجية المؤشر
═══════════════════════════════════════════════════════════════════════════════
يجمع هذا المؤشر بين تحليل الفوليوم الكلاسيكي والذكاء الخوارزمي الحديث:
1. تحديد الفوليوم: يحدد الحجم غير الطبيعي نسبة للمتوسطات التاريخية
2. تحليل تدفق الأوامر: يفصل ضغط الشراء والبيع باستخدام بنية الشمعة
3. كشف التباعد: يقارن حركة السعر مع مؤشرات الفوليوم
4. نهج متعدد الفريمات: يستخدم التمهيد والتحليل الرجعي للسياق
5. خوارزمية التقييم: نظام تقييم من 11 نقطة لتوليد إشارات موضوعية
6. تكامل التقاء: يجمع عدة مؤشرات لإعدادات ذات احتمالية أعلى
═══════════════════════════════════════════════════════════════════════════════
⚠️ إخلاء المسؤولية
═══════════════════════════════════════════════════════════════════════════════
هذا المؤشر هو أداة للتحليل ولا ينبغي استخدامه كأساس وحيد لقرارات التداول. اجمع دائماً مع تحليلك الخاص وإدارة المخاطر وخطة التداول. الأداء السابق لا يضمن النتائج المستقبلية.
═══════════════════════════════════════════════════════════════════════════════
📞 الدعم والتحديثات
═══════════════════════════════════════════════════════════════════════════════
• تحديثات وتحسينات منتظمة
• إصلاحات الأخطاء والتحسين
• طلبات الميزات قيد الاعتبار
• ملاحظات المجتمع مرحب بها
═══════════════════════════════════════════════════════════════════════════════
🌟 تداول سعيد! نتمنى أن يقودك تحليل الفوليوم إلى قرارات مربحة! 🚀
═══════════════════════════════════════════════════════════════════════════════
═══════════════════════════════════════════════════════════════════════════════

Order Blocks, Breakers & Trend LinesSyntropy OB — Professional Order Blocks, Breakers & Trend Lines Toolkit
A clean, institutional-grade Price Action tool trusted by thousands of smart traders.
What makes Syntropy OB different:
• Dual-layer Order Block detection (two independent ZigZag sensitivities)
• Smart Breaker Blocks (OBs violated but never retested)
• Second independent Breaker Block engine for higher-timeframe confirmation
• Violated & retested OBs with strength + proximity filters (no chart clutter)
• Two fully automatic dynamic Trend Line sets with configurable channel width (ATR-based)
• Real-time extension of lines and blocks to the current bar
• Minimalist, beautiful and highly customizable colors
• Zero repainting — 100% reliable structure
Perfect for:
→ ICT / Smart Money Concepts
→ Supply & Demand
→ Classic Price Action
→ Swing & intraday trading on any market (Crypto, Forex, Stocks, Futures)
No lag. No nonsense. Just pure, clean structure.
Add to favorites — this is the last Order Block + Trend Line tool you’ll ever need.
Enjoy the edge,
Syntropy Labs
