Institutional Engine SAFEThis indicator is designed for traders who want to visualize institutional-level market execution patterns across multiple timeframes. It combines high-timeframe trend analysis, liquidity sweeps, fair value gaps (FVG), intermarket divergence (SMT), inverse FVGs, and change-in-state-of-delivery (CSID) to identify high-probability long and short setups.
Search in scripts for "smt"

Fibonacci Entry Zone [OTE] (@ath.snipr)🇬🇧 English Description
📌 Fibonacci Entry Zone – @ath.snipr
Fibonacci Entry Zone is an indicator designed to automatically detect market structure, identify Change of Character (CHoCH), and project Optimal Trade Entry (OTE) zones using Fibonacci retracements.
It is suitable for scalping, day trading, and swing trading across all markets (Forex, indices, crypto, commodities).
🎯 Indicator Purpose
This indicator helps traders to:
✔ Detect significant swing highs and lows
✔ Identify structure shifts (CHoCH)
✔ Automatically draw Fibonacci retracement levels
✔ Highlight the Golden Zone (OTE)
✔ Dynamically track new swings in real-time
The goal is to patiently wait for price to retrace into a high-probability value area instead of chasing price.
🧠 How It Works
1️⃣ Market Structure Detection
The algorithm detects price pivots to identify:
📈 Bullish structure: Higher High / Higher Low
📉 Bearish structure: Lower High / Lower Low
When a structure shift occurs, a CHoCH label appears and a new Fibonacci projection is automatically created.
2️⃣ Fibonacci OTE Levels
Fibonacci levels are calculated between the latest swing high and swing low.
Default levels:
0.50
0.618
These represent the Optimal Trade Entry (OTE) zone where price statistically reacts more often.
The Golden Zone can be filled for better visualization.
3️⃣ Dynamic Updates
When Swing Tracker is enabled:
Fibonacci levels automatically update as new swings form.
The projection always stays aligned with the current market structure.
4️⃣ Visual Elements
The indicator displays:
✔ CHoCH labels
✔ Break of Structure lines
✔ Swing trend line (dotted)
✔ Swing price labels
✔ Extended Fibonacci levels
Everything is fully customizable.
🛠️ Key Settings
Structure
Structure Period – Swing sensitivity (higher = stronger structure).
Bullish / Bearish – Enable bullish or bearish structures.
BoS Width – Structure line thickness.
Fibonacci Mode
Swing Tracker – Auto-update Fibonacci levels.
Swing Line – Show swing connection line.
Swing Labels – Show swing price labels.
Fibonacci
Extend – Extend levels to current price.
Previous – Keep previous levels.
Fill Golden Zone – Highlight OTE zone.
Levels – Customize Fibonacci levels.
📈 How to Trade with It (example)
▶ Bullish Scenario
A bullish CHoCH appears.
Price impulsively moves up.
Wait for a retracement into the Golden Zone (0.5 – 0.618).
Confirm with your strategy (price action, liquidity, SMT, etc.).
Enter long with stop below the last swing low.
▶ Bearish Scenario
Same logic in reverse.
⚠️ Disclaimer
This indicator is a decision-support tool only.
It does not guarantee profits and must be used with proper risk management and personal confirmation.

ZOE IFVG+his indicator combines the original ICT Inversion Fair Value Gap (iFVG) Detector by ote618 with a manual checklist panel for trade analysis.
Features:
ICT iFVG Detector
Automatically identifies bullish and bearish inversion fair value gaps (iFVGs) based on 3-candle formation logic.
Draws colored boxes on the chart to highlight confirmed iFVG zones.
Sends optional alerts when iFVGs are confirmed, respecting your selected timeframe.
Works exactly like the original ote618 iFVG script, with no modifications to the core detection logic.
Manual Checklist Panel
Displays a customizable checklist to track key market factors:
Liquidity Sweep
HTF FVG
V-Shape Recovery
Inversion FVG
Clear Opposite DOL
SMT Divergence
Assigns a score and grade (A+ to F) based on selected conditions.
Panel position and background can be customized.
Allows traders to visually track trade quality alongside iFVG zones.
Usage:
Use the iFVG boxes to identify high-probability zones for entries and liquidity hunts.
Use the manual checklist to evaluate trades based on additional criteria, creating a structured workflow for market analysis.
Fully compatible with your existing iFVG workflow — the core detection and alerts remain unchanged.
Ideal For:
Traders following ICT concepts, liquidity hunts, and structure-based strategies who want to combine automated FVG detection with a manual trade-quality checklist.

15M Swing Sweep Lines + SMT (ES vs NQ)15M Swing Sweep Lines (NY Killzones)Visualize liquidity sweeps of 15-minute swing highs/lows exclusively during high-impact London & New York killzones.This ICT-inspired indicator detects when price sweeps (wicks beyond) the most recent confirmed 15-minute swing high or low — classic signs of liquidity raids or stop hunts — but only if the sweep happens during key "killzone" sessions where institutional activity is typically highest.Key Features15M Swing Detection: Uses confirmed pivot highs/lows (length 2) on the 15-minute timeframe for reliable structure points.
Killzone Filters (New York time):London Killzone: 3:00 AM – 4:59 AM
New York Killzone: 9:30 AM – 10:59 AM (captures the high-volatility NY open overlap)
Sweep Visualization:Bearish Sweep (high > last 15M swing high): Thick red horizontal line from the swing point to the sweep bar.
Bullish Sweep (low < last 15M swing low): Thick green horizontal line from the swing point to the sweep bar.
Lines use xloc.bar_time for precise placement and extend only to the bar where the sweep occurs.
No duplicates: Prevents multiple lines for the same swing sweep.
Non-repainting logic with lookahead_off for clean, trustworthy signals.
Why Killzones MatterMany ICT/SMC traders focus on these windows because they often feature aggressive manipulation, equal highs/lows sweeps, and the setup for strong directional moves. This tool helps you instantly spot when buy-side or sell-side liquidity has been raided on the 15M structure during these prime times.Ideal ForConfirming potential reversals or inducements after liquidity grabs.
Adding confluence to entries during London or NY sessions.
Futures traders (ES, NQ, etc.) looking for clean visual cues of smart money engineering.
Lightweight, overlay-friendly, and focused — add it to your chart for clearer insight into 15M liquidity sweeps when it matters most. Perfect companion for killzone-based strategies!

Killzones (EST)Asian Range
19:00 – 00:00 EST
Consolidation, liquidity build
London Open
02:00 – 05:00 EST
Initial expansion, Judas Swing
New York Open
07:00 – 10:00 EST
Main move, SMT, MSS setups
NY Lunch/Reversal
11:30 – 13:00 EST
Rebalancing, exit window

🟡 GOLD 4H HUD v8.9 — Loose ICT OB + Strong/Weak + FVG/HVN/LVNGOLD 4H HUD v8.9 is a clean, structured Smart Money Concepts (SMC)–based analysis tool designed exclusively for XAUUSD on the 4-hour timeframe.
It focuses on the three most important elements for institutional orderflow analysis:
✔ Loose ICT Order Blocks (Demand/Supply)
✔ Fair Value Gaps (FVG)
✔ Volume Profile Zones (HVN/LVN/POC)
The script builds a professional-style HUD that displays the key institutional regions and structural levels that matter most for gold traders.
📌 Key Features
1 — Market Structure Engine (HH/HL & BOS)
The indicator detects:
Minor swing Highs and Lows
Last confirmed HH / HL levels
Break of Structure (BOS) for directional bias
EMA-200 trend filter (UP / DOWN / NEUTRAL)
This gives traders a clean structural read without clutter or noise.
2 — Loose FVG Engine (Tolerance-Based ICT Gaps)
A soft-threshold FVG engine detects “loose” Fair Value Gaps using a 0.1% price tolerance.
This method ensures:
Fewer missed imbalances
Cleaner OB/FVG alignment
Higher accuracy on 4H gold displacement legs
FVGs automatically shift to the right side of the chart for clean visualization.
3 — Order Block Engine (Demand/Supply + Strong/Weak Classification)
A simplified ICT-style OB engine scans the past few candles whenever BOS is detected.
It identifies:
Demand OB during bullish BOS
Supply OB during bearish BOS
Strong OB if fully nested inside an active FVG
Weak OB otherwise
OB boxes include:
Clear color coding (strong vs. weak)
Price range labels inside each box
Automatic right-shift for visual clarity
4 — Volume Profile Engine (POC / HVN / LVN / VAH / VAL)
Based on a rolling window (default 120 bars), the script builds a lightweight volume distribution.
It displays:
POC (Point of Control)
HVN (High Volume Node)
LVN (Low Volume Node)
Value Area High / Low
HVN/LVN zones are shown as right-shifted colored boxes with price labels.
These zones help identify:
Institutional accumulation
Low-liquidity rejection points
Areas where price tends to react strongly
5 — Support / Resistance Mapping
The script automatically generates:
OB-based support/resistance
Swing-high/swing-low levels
HVN/LVN structural levels
These are displayed in the HUD for fast reference.
6 — Professional HUD Panel
A compact, easy-to-read HUD summarizes:
Trend direction
Latest HH/HL
OB ranges (Strong/Weak)
HVN/LVN price zones
POC
Multi-layer support & resistance
This turns the script into a fully functional analysis dashboard.
📌 What This Indicator Is NOT
To avoid misunderstanding:
It does not take entries or generate buy/sell signals
It does not auto-detect CHOCH, MSS, SMT, or sweeps
It is not a trading bot
This tool is designed as an institutional-style map and analysis HUD, not a strategy.
📌 Best Use Case
This indicator is ideal for traders who want to:
Read institutional structure on XAUUSD
Identify clean Demand/Supply zones
Visualize FVG/OB/HVN interactions
Track high-value liquidity levels
Build directional bias on 4H before dropping to execution timeframes
⚠ Important Note
This tool is designed exclusively for the 4H timeframe.
Using it on lower timeframes will display a warning.

Sniper BB + VWAP System (with SMT Divergence Arrows)STEP 1: Load two correlated futures charts.
Example: CL + RB/SI+GC/ NQ+ES
STEP 2: Add Bollinger Bands (20, 2.0) on both.
Optional add (20, 3.0).
STEP 3: Watch for a BB tag on one chart but not the other.
STEP 4: Wait for a reclaim candle back inside the band.
STEP 5: Enter with stop below/above the wick + 3.0 BB.
STEP 6: Scale out midline, then opposite band.
STEP 7: Hold partials when both pairs confirm trend.
*You can take the vwap bands off the chart if it is too cluttered.

stormytrading orb botshows entries for 15m orb based on 5m break and retest made solely for mnq or nq, works good with smt
shows trades for ldn, nyc, nyc overlap and Asia session, pls follow stormy trading on insta for more

BifaneiroSinaleiro V3 ULTIMATEBifaneiroSinaleiro V3 ULTIMATE - Complete ICT Analysis System & Signal Generator
This isn't just an indicator - it's your 24/7 ICT analyst that does the manual work for you.
━━━━━━━━━━━━━━━━━━━━━━━━━━━━━━━━━━━━━━
🔥 WHAT IT DOES FOR YOU:
━━━━━━━━━━━━━━━━━━━━━━━━━━━━━━━━━━━━━━
✅ Marks ALL ICT Concepts Automatically:
- Fair Value Gaps (LTF + HTF with priority)
- Market Structure (BOS/CHoCH in real-time)
- Breaker Blocks (validated with volume + killzone)
- Liquidity Sweeps (Asian High/Low runs)
- Premium/Discount Arrays + OTE Zones
- Institutional Sessions (London, NY Silver Bullets)
✅ Advanced Pattern Recognition:
- Turtle Soup (sweep + reversal)
- Unicorn Model (sweep → BOS → FVG)
- SMT Divergences (monitors correlated pairs)
- PO3/AMD Phases (Accumulation → Manipulation → Distribution)
✅ Intelligent Scoring System:
- 12+ confluence factors analyzed
- Minimum score 12 for signals (configurable)
- Score 20+ = EXTREME (enables 2nd trade in session)
- Visual score display on every signal
✅ Professional Trade Management:
- 1 trade per session (London, NY AM, NY PM) = max 3/day
- EXTREME mode: 2 trades per session = max 6/day
- Automatic stop loss (session range-based)
- Dynamic take profit (score-adjusted multiplier)
- Auto breakeven after 2.5x move
- EOD close (23:59) with P&L label
- Weekend close (Fri 23:55) with P&L label
✅ 100% ICT Pure Methodology:
- NO EMAs, NO ATR, NO lagging indicators
- Pure price action: High/Low/Range only
- HTF confirmation via Premium/Discount (not EMAs!)
- Stop loss via Asian Range (not ATR!)
━━━━━━━━━━━━━━━━━━━━━━━━━━━━━━━━━━━━━━
⚡ WHY IT'S DIFFERENT:
━━━━━━━━━━━━━━━━━━━━━━━━━━━━━━━━━━━━━━
Traditional indicators show 1-2 concepts. This shows 10+ simultaneously.
Manual ICT takes 2-3 hours per session. This does it in milliseconds.
Other systems guess. This scores with objective confluence.
You save hours daily. You trade better. You profit more consistently.
━━━━━━━━━━━━━━━━━━━━━━━━━━━━━━━━━━━━━━
📊 WHAT YOU GET:
━━━━━━━━━━━━━━━━━━━━━━━━━━━━━━━━━━━━━━
- Real-time dashboard (scores, confluences, structure)
- Precision signals (only in killzones, only with confluences)
- Trade tracking (win rate, RR, P&L by session)
- Multi-timeframe analysis (automatic)
- News block filter (configurable)
- Full customization (colors, thresholds, sessions)
- Comprehensive alerts (8+ types)
Works on: Forex, Indices, Commodities, Crypto
Best on: 1m-5m for execution, 15m+ for swing
Timezone: Configured for CET (UTC+1), easily adjustable
⚠️ This is a professional tool requiring ICT/SMC understanding.
Not magic - it's methodology, automated.
🚀 Stop drawing. Start trading. Add to chart now.

Chop + MSS/FVG Retest (Ace v1.6) – IndicatorWhat this indicator does
Name: Chop + MSS/FVG Retest (Ace v1.6) – Indicator
This is an entry model helper, not just a BOS/MSS marker.
It looks for clean trend-side setups by combining:
MSS (Market Structure Shift) using swing highs/lows
3-bar ICT Fair Value Gaps (FVG)
First retest back into the FVG
A built-in chop / trend filter based on ATR and a moving average
When everything lines up, it plots:
L below the candle = Long candidate
S above the candle = Short candidate
You pair this with a higher-timeframe filter (like the Chop Meter 1H/30M/15M) to avoid pressing the button in garbage environments.
How it works (simple explanation)
Chop / Trend filter
Computes ATR and compares each bar’s range to ATR.
If the bar is small vs ATR → more likely CHOP.
If the bar is big vs ATR → more likely TREND.
Uses a moving average:
Above MA + TREND → trendLong zone
Below MA + TREND → trendShort zone
MSS (Market Structure Shift)
Uses swing highs/lows (left/right bars) to track the last significant high/low.
Bullish MSS: close breaks above last swing high with displacement.
Bearish MSS: close breaks below last swing low with displacement.
Those events are marked as tiny triangles (MSS up/down).
A MSS only stays “valid” for a certain number of bars (Bars after MSS allowed).
3-bar ICT FVG
Bullish FVG: low > high
→ gap between bar 3 high and bar 2 low.
Bearish FVG: high < low
→ gap between bar 3 low and bar 2 high.
The indicator stores the FVG boundaries (top/bottom).
Retest of FVG
Watches for price to trade back into that gap (first touch).
That retest is the “entry zone” after the MSS.
Final Long / Short condition
Long (L) prints when:
Recent bullish MSS
Bullish FVG has formed
Price retests the bullish FVG
Environment = trendLong (ATR + above MA)
Not CHOP
Short (S) prints when:
Recent bearish MSS
Bearish FVG has formed
Price retests the bearish FVG
Environment = trendShort (ATR + below MA)
Not CHOP
So the L/S markers are “model-approved entry candles”, not just any random BOS.
Inputs / Settings
Key inputs you’ll see:
ATR length (chop filter)
How many bars to use for ATR in the chop / trend filter.
Lower = more sensitive, twitchy
Higher = smoother, slower to change
Max chop ratio
If barRange / ATR is below this → treat as CHOP.
Min trend ratio
If barRange / ATR is above this → treat as TREND.
Hide MSS/BOS marks in CHOP?
ON = MSS triangles disappear when the bar is classified as CHOP
Keeps your chart cleaner in consolidation
Swing left / right bars
Controls how tight or wide the swing highs/lows are for MSS:
Smaller = more sensitive, more MSS points
Larger = fewer, more significant swings
Bars after MSS allowed
How many bars after a MSS the indicator will still allow FVG entries.
Small value (e.g. 10) = MSS must deliver quickly or it’s ignored.
Larger (e.g. 20) = MSS idea stays “in play” longer.
Visual RR (for info only)
Just for plotting relative risk-reward in your head.
This is not a strategy tester; it doesn’t manage positions.
What you see on the chart
Small green triangle up = Bullish MSS
Small red triangle down = Bearish MSS
“L” triangle below a bar = Long idea (MSS + FVG retest + trendLong + not chop)
“S” triangle above a bar = Short idea (MSS + FVG retest + trendShort + not chop)
Faint circle plots on price:
When the filter sees CHOP
When it sees Trend Long zone
When it sees Trend Short zone
You do not have to trade every L or S.
They’re there to show “this is where the model would have considered an entry.”
How to use it in your trading
1. Use it with a higher-timeframe filter
Best practice:
Use this with the Chop Meter 1H/30M/15M or some other HTF filter.
Only consider L/S when:
Chop Meter = TRADE / NORMAL, and
This indicator prints L or S in the right location (premium/discount, near OB/FVG, etc.)
If higher-timeframe says NO TRADE, you ignore all L/S.
2. Location > Signal
Treat L/S as confirmation, not the whole story.
For shorts (S):
Look for premium zones (previous highs, OBs, fair value ranges above mid).
Want purge / raid of liquidity + MSS down + bearish FVG retest → then S.
For longs (L):
Look for discount zones (previous lows, OBs/FVGs below mid).
Want stop raid / purge low + MSS up + bullish FVG retest → then L.
If you see L/S firing in the middle of a bigger range, that’s where you skip and let it go.
3. Instrument presets (example)
You can tune the ATR/chop settings per instrument:
MNQ (noisy, 1m chart):
ATR length: 21
Max chop ratio: 0.90
Min trend ratio: 1.40
Bars after MSS allowed: 10
GOLD (cleaner, 3m chart):
ATR length: 14
Max chop ratio: 0.80
Min trend ratio: 1.30
Bars after MSS allowed: 20
You can save those as presets in the TV settings for quick switching.
4. How to practice with it
Open replay on a couple of days.
Check Chop Meter → if NO TRADE, just observe.
When Chop Meter says TRADE:
Mark where L/S printed.
Ask:
Was this in premium/discount?
Was there SMT / purge on HTF?
Did the move actually deliver, or did it die?
Screenshot the A+ L/S and the ugly ones; refine:
ATR length
Chop / trend thresholds
MSS lookback
Your goal is to get it to where:
The L/S marks show up mostly in the same places your eye already likes,
and you ignore the rest.

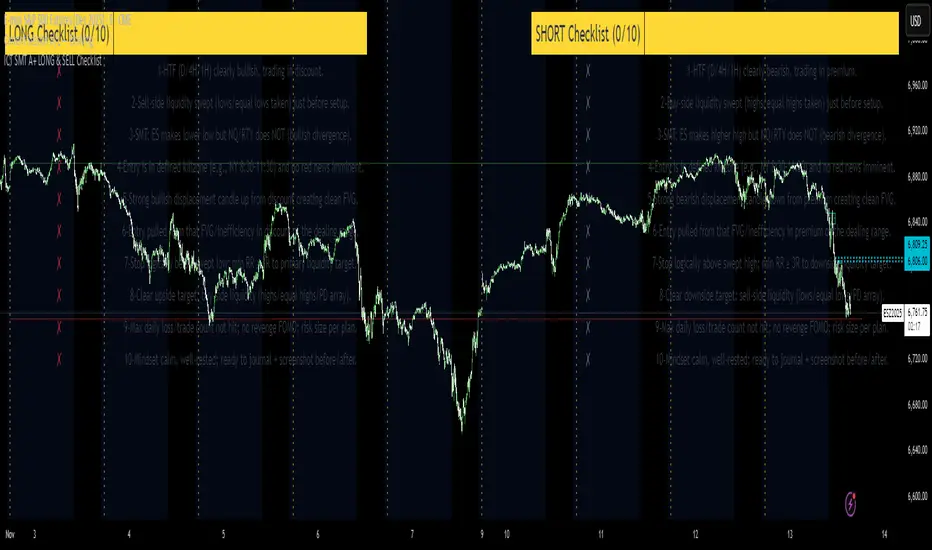
ICT SMT A+ LONG & SELL ChecklistTrade Checklist. Once all items checked color changes from yellow to green.
Quasimodo Pattern Strategy Back Test [TradingFinder] QM Trading🔵 Introduction
The QM pattern, also known as the Quasimodo pattern, is one of the popular patterns in price action, and it is often used by technical analysts. The QM pattern is used to identify trend reversals and provides a very good risk-to-reward ratio. One of the advantages of the QM pattern is its high frequency and visibility in charts.
Additionally, due to its strength, it is highly profitable, and as mentioned, its risk-to-reward ratio is very good. The QM pattern is highly popular among traders in supply and demand, and traders also use this pattern.
The Price Action QM pattern, like other Price Action patterns, has two types: Bullish QM and Bearish QM patterns. To identify this pattern, you need to be familiar with its types to recognize it.
🔵 Identifying the QM Pattern
🟣 Bullish QM
In the bullish QM pattern, as you can see in the image below, an LL and HH are formed. As you can see, the neckline is marked as a dashed line. When the price reaches this range, it will start its upward movement.
🟣 Bearish QM
The Price Action QM pattern also has a bearish pattern. As you can see in the image below, initially, an HH and LL are formed. The neckline in this image is the dashed line, and when the LL is formed, the price reaches this neckline. However, it cannot pass it, and the downward trend resumes.
🔵 How to Use
The Quasimodo pattern is one of the clearest structures used to identify market reversals. It is built around the concept of a structural break followed by a pullback into an area of trapped liquidity. Instead of relying on lagging indicators, this pattern focuses purely on price action and how the market reacts after exhausting one side of liquidity. When understood correctly, it provides traders with precise entry points at the transition between trend phases.
🟣 Bullish Quasimodo
A bullish Quasimodo forms after a clear downtrend when sellers start losing control. The market continues to make lower lows until a sudden higher high appears, signaling that buyers are entering with strength. Price then pulls back to retest the previous low, creating what is known as the Quasimodo low.
This area often becomes the final trap for sellers before the market shifts upward. A visible rejection or displacement from this zone confirms bullish momentum. Traders usually place entries near this level, stops below the low, and targets at previous highs or the next resistance zone. Combining the setup with demand zones or Fair Value Gaps increases its accuracy.
🟣 Bearish Quasimodo
A bearish Quasimodo forms near the top of an uptrend when buyers begin to lose strength. The market continues to make higher highs until a sudden lower low breaks the bullish structure, showing that selling pressure is entering the market. Price then retraces upward to retest the previous high, forming the Quasimodo high, where breakout buyers are often trapped.
Once rejection appears at this level, it indicates a likely reversal. Traders can enter short near this area, with stop-losses placed above the high and targets near the next support or previous lows. The setup gains more reliability when aligned with supply zones, SMT divergence, or bearish Fair Value Gaps.
🔵 Setting
Pivot Period : You can use this parameter to use your desired period to identify the QM pattern. By default, this parameter is set to the number 5.
Take Profit Mode : You can choose your desired Take Profit in three ways. Based on the logic of the QM strategy, you can select two Take Profit levels, TP1 and TP2. You can also choose your take profit based on the Reward to Risk ratio. You must enter your desired R/R in the Reward to Risk Ratio parameter.
Stop Loss Refine : The loss limit of the QM strategy is based on its logic on the Head pattern. You can refine it using the ATR Refine option to prevent Stop Hunt. You can enter your desired coefficient in the Stop Loss ATR Adjustment Coefficient parameter.
Reward to Risk Ratio : If you set Take Profit Mode to R/R, you must enter your desired R/R here. For example, if your loss limit is 10 pips and you set R/R to 2, your take profit will be reached when the price is 20 pips away from your entry point.
Stop Loss ATR Adjustment Coefficient : If you set Stop Loss Refine to ATR Refine, you must adjust your loss limit coefficient here. For example, if your buy position's loss limit is at the price of 1000, and your ATR is 10, if you set Stop Loss ATR Adjustment Coefficient to 2, your loss limit will be at the price of 980.
Entry Level Validity : Determines how long the Entry level remains valid. The higher the level, the longer the entry level will remain valid. By default it is 2 and it can be set between 2 and 15.
🔵 Results
The following examples show the backtest results of the Quasimodo (QM) strategy in action. Each image is based on specific settings for the symbol, timeframe, and input parameters, illustrating how the QM logic can generate signals under different market conditions. The detailed configuration for each backtest is also displayed on the image.
⚠ Important Note : Even with identical settings and the same symbol, results may vary slightly across different brokers due to data feed variations and pricing differences.
Default Properties of Backtests :
OANDA:XAUUSD | TimeFrame: 5min | Duration: 1 Year :
BINANCE:BTCUSD | TimeFrame: 5min | Duration: 1 Year :
CAPITALCOM:US30 | TimeFrame: 5min | Duration: 1 Year :
NASDAQ:QQQ | TimeFrame: 5min | Duration: 5 Year :
OANDA:EURUSD | TimeFrame: 5min | Duration: 5 Year :
PEPPERSTONE:US500 | TimeFrame: 5min | Duration: 5 Year :

5 SMA/EMA_ZigzagThis indicator combines five SMA/EMA/WMA lines with the “ZigZag with Fibonacci Levels” indicator by LonesomeTheBlue, designed to trade according to Thắng Đoàn SMT’s method.
EMA 21 34
Zigzag 3/5

Liquidity Sniper V3 (ANTI-FAKEOUT)An advanced institutional trading indicator combining liquidity pool targeting, smart money concepts, and momentum-based entries with comprehensive risk management.
🎯 CORE FEATURES:
- Liquidity Sniper Module: Identifies and targets major liquidity pools (PDH/PDL, PWH/PWL, Equal Highs/Lows, HVN/LVN edges)
- Anti-Fakeout Stack: 10-layer confirmation system including VWAP reclaim, micro BOS, displacement, relative volume, and mitigation entries
- Momentum Engulf Add-On: Catches high-velocity impulsive moves with engulfing candles, volume spikes, and volatility breakouts
- GARCH Volatility Filter: Dynamic volatility analysis to avoid choppy conditions
- Multi-Timeframe Confirmation: Ensures alignment across timeframes before entries
📊 SIGNAL CLASSIFICATION:
- BEST (Green): Highest probability setups with all confirmations aligned - 6.0+ score
- BETTER (Medium Green): Strong setups with most confirmations - 4.5-6.0 score
- GOOD (Light Green): Valid setups with basic confirmations - 3.0-4.5 score
🔍 TRADE SCENARIOS:
S1: Liquidity Reversal - Sweeps + reversals at key levels with displacement
S2: Continuation - Trend following with VWAP mean reversion
S3: Mean Reversion - Extreme deviations (2σ+) with Fibonacci exhaustion
S4: Deep Sweep - 3σ sweeps at major liquidity with high confluence
⚡ MOMENTUM TRIGGERS:
- MET (Momentum Engulf): Bullish/bearish engulfing with 1.5x+ volume spike and ATR impulse
- VBT (Volatility Breakout): Range breakouts with sigma bursts and participation
🛡️ RISK MANAGEMENT:
- Dynamic TP/SL based on ATR, VWAP bands, and liquidity pools
- 3-tier targets (T1: VWAP, T2: Nearest pool, T3: 5R extension)
- Early invalidation tracking (0.5R movement monitoring)
- Minimum 2:1 RR requirement with cooldown periods
- RTH session filters and anti-spam protection
📈 TECHNICAL EDGE:
- SMT Divergence detection vs ES correlation
- CVD (Cumulative Volume Delta) divergence confirmation
- FVG (Fair Value Gap) and Order Block mitigation entries
- Equal highs/lows clustering analysis
- Volume profile HVN/LVN identification
⚙️ FULLY CUSTOMIZABLE:
All parameters adjustable including cooldowns, proximity thresholds, ATR multipliers, RR floors, and scenario weights.
Perfect for: ES/NQ futures, forex majors, and liquid stocks. Works on 1-15 min timeframes. Best results during NY session (9:35-11:00 AM & 1:30-3:30 PM ET).
Created for serious traders seeking institutional-grade edge with quantifiable risk/reward and high-probability setups

ICT Liquidity Sweep Asia/London 1 Trade per High & Low🧠 ICT Liquidity Sweep Asia/London — 1 Trade per High & Low
This strategy is inspired by the ICT (Inner Circle Trader) concepts of liquidity sweeps and market structure, focusing on the Asia and London sessions.
It automatically identifies liquidity grabs (sweeps) above or below key session highs/lows and enters trades with a fixed risk/reward ratio (RR).
----------------------------------------------------------------------------------
----------------------------------------------------------------------------------
⚙️ Core Logic
-Asia Session: 8:00 PM – 11:59 PM (New York time)
-London Session: 2:00 AM – 5:00 AM (New York time)
-The script marks the Asia High/Low and London High/Low ranges for each day.
-When the market sweeps above a session high → potential Short setup
-When the market sweeps below a session low → potential Long setup
-A trade is triggered when the confirmation candle closes in the opposite direction of the sweep (bearish after a high sweep, bullish after a low sweep).
-Only one trade per sweep type (1 per High, 1 per Low) is allowed per session.
----------------------------------------------------------------------------------
----------------------------------------------------------------------------------
📈 Risk Management
-Configurable Risk/Reward Target (default = 2:1)
-Configurable Position Size (number of contracts)
-Each trade uses a fixed Stop Loss (beyond the wick of the sweep) and a Take Profit calculated from the RR setting.
-All trades are automatically logged in the Strategy Tester with performance metrics.
----------------------------------------------------------------------------------
----------------------------------------------------------------------------------
💡 Features
✅ Visual session highlighting (Asia = Aqua, London = Orange)
✅ Automatic liquidity line plotting (session highs/lows)
✅ Entry & exit labels (optional visual display)
✅ Customizable RR and contract size
✅ Works on any instrument (ideal for indices, futures, or forex)
✅ Compatible with all timeframes (optimized for 1M–15M)
----------------------------------------------------------------------------------
----------------------------------------------------------------------------------
⚠️ Notes
-Best used on New York time-based charts.
-Designed for educational and backtesting purposes — not financial advice.
-Use as a foundation for further optimization (e.g., SMT confirmation, FVG filter, or time-based restrictions).
----------------------------------------------------------------------------------
----------------------------------------------------------------------------------
🧩 Recommended Use
Pair this with:
-ICT’s concepts like CISD (Change in State of Delivery) and FVGs (Fair Value Gaps)
-Higher timeframe liquidity maps
-Session bias or daily narrative filters
----------------------------------------------------------------------------------
----------------------------------------------------------------------------------
Author: jygirouard
Strategy Version: 1.3
Type: ICT Liquidity Sweep Automation
Timezone: America/New_York

cd_Quarterly_cycles_SSMT_TPD_CxGeneral
This indicator is designed in line with the Quarterly Theory to display each cycle on the chart, either boxed and/or in candlestick form.
Additionally, it performs inter-cycle divergence analysis ( SSMT ) with the correlated symbol, Terminus Price Divergence ( TPD ), Precision Swing Point ( PSP ) analysis, and potential Power of Three ( PO3 ) analysis.
Special thanks to @HandlesHandled for his great indicator, which I used while preparing the cycles content.
Details & Usage:
Optional cycles available: Weekly, Daily, 90m, and Micro cycles.
Displaying/removing cycles can be controlled from the menu (cycles / candles / labels).
All selected cycles can be shown, or you can limit the number of displayed cycles (min: 2, max: 4).
The summary table can be toggled on/off and repositioned.
What’s in the summary table?
• Below the header, the correlated symbol used in the analysis is displayed (e.g., SSMT → US500).
• If available, live and previous bar results of the SSMT analysis are shown.
• Under the PSP & TPD section, results are displayed when conditions are met.
• Under Alerts, the real-time status of conditions defined in the menu is shown.
• Under Potential AMD, possible PO3 analysis results are displayed.
Analysis & Symbol Selection:
To run analyses, a correlated symbol must first be defined with the main symbol.
Default pairs are preloaded (see below), but users should adjust them according to their exchange and instruments.
If no correlated pair is defined, cycles are displayed only as boxes/candles.
Once defined pairs are opened on the chart, analyses load automatically.
Pairs listed on the same row in the menu are automatically linked, so no need to re-enter them across rows.
SSMT Analysis:
Based on the chart’s timeframe, divergences are searched across Weekly, Daily, 90m, and Micro cycles.
The code will not produce results for smaller cycles than the current timeframe.
(Example: On H1, Micro cycles will not be displayed.)
Results are obtained by comparing the highs and lows of consecutive cycles in the same period.
If one pair makes a new high/low while the other does not, this divergence is added to SSMT results.
The difference from classic SMT is that cycles are used instead of bars.
PSP & TPD Analysis:
A correlated symbol must be defined.
For PSP, timeframe options are added to the menu.
Users toggle timeframes on/off by checking/unchecking boxes.
In selected timeframes, PSP & TPD analysis is performed.
• PSP: If candlesticks differ in color (bullish/bearish) between symbols and the bar is at a high/low of the timeframe (and higher/lower than the bars before/after it), it is identified as a PSP. Divergences between pairs are interpreted as potential reversal signals.
• TPD: Once a PSP occurs, the closing price of the previous bar and the opening price of the next bar are compared. If one symbol shows continuation while the other does not, it is marked as a divergence.
Example:
Let’s assume Pair 1 and Pair 2 are selected in the menu with the H4 timeframe, and our cycle is Weekly (Box).
For Pair 1, the H4 candle at the Weekly high level:
• Is positioned at the Weekly high,
• Its high is above both the previous and the next candle,
• It closed bearish (open > close).
For Pair 2, the same H4 candle closed bullish (close > open).
→ PSP conditions are met.
For TPD, we now check the candles before and after this PSP (H4) candle on both pairs.
Comparing the previous candle’s close with the next candle’s open, we see that:
• In Pair 1, the next open is lower than the previous close,
• In Pair 2, the next open is higher than the previous close.
Pair 1 → close > open
Pair 2 → close < open
Since they are not aligned in the same direction, this is interpreted as a divergence — a potential reversal signal.
While TPD results are displayed in the summary table, whenever the conditions are met in the selected timeframes, the signals are also plotted directly on the chart. (🚦, X)
• Higher timeframe TPD example:
• Current timeframe TPD example:
Alerts:
The indicator can be conditioned based on aligned timeframes defined within the concept.
Example (assuming random active rows in the screenshot):
• Weekly Bullish SSMT → Tf2 (menu-selected) Bullish TPD → Daily Bullish SSMT.
Selecting “none” in the menu means that condition is not required.
When an alert is triggered, it will be displayed in the corresponding row of the table.
• Example with only condition 3 enabled:
Potential PO3 Analysis:
According to Quarterly Theory, price moves in cycles, and the same structures are assumed to continue in smaller timeframes.
From classical PO3 knowledge: before the main move, price first manipulates in the opposite direction to trap buyers/sellers, then makes its true move.
The cyclical sequence is:
(A)ccumulation → (M)anipulation → (D)istribution → (R)eversal / Continuation.
Within cycle candles, the first letter of each phase is displayed.
So how does the analysis work?
If the active cycle is in (M)anipulation or (D)istribution phase, and it sweeps the previous cycle’s high or low but then pulls back inside, this is flagged in the summary table as a possible PO3 signal.
In other words, it reflects the alignment of theoretical sequence with real-time price action.
Confluence with SSMT and TPD conditions further strengthens the expectation.
Final Note:
No single marking or alert carries meaning on its own — it must always be evaluated in the context of your concept knowledge.
Instead of trading purely on expectations, align bias + trend + entry confirmations to improve your success rate.
Feedback and suggestions are welcome.
Happy trading!

20/40/60Displays three consecutive, connected range boxes showing high/low price ranges for customizable periods. Boxes are positioned seamlessly with shared boundaries for continuous price action visualization.
Features
Three Connected Boxes: Red (most recent), Orange (middle), Green (earliest) periods
Customizable Positioning: Set range length and starting offset from current bar
Individual Styling: Custom colors, transparency, and border width for each box
Display Controls: Toggle borders, fills, and line visibility
Use Cases
Range Analysis: Compare volatility across time periods, spot breakouts
Support/Resistance: Use box boundaries as potential S/R levels
Market Structure: Visualize recent price development and trend patterns
Key Settings
Range Length: Bars per box (default: 20)
Starting Offset: Bars back from current to position boxes (default: 0)
Style Options: Colors, borders, and visibility controls for each box
Perfect for traders analyzing consecutive price ranges and comparing current conditions to recent historical periods.

Spirit Time SMT 1M DIVDivergences from 90Min-1Min
apparently i have to explain more of what this does.
pretty self explanatory
Hope this enough text

Gold Killzone Bias Suite🟡 Gold Killzone Bias Suite
The Gold Killzone Bias Suite is an advanced institutional-grade tool designed to generate high-confidence directional bias for XAU/USD (Gold) during the London and New York killzones.
Built for traders using a structured, confluence-driven approach, this tool blends price action, smart money principles, momentum, and volume into a real-time bias engine with a clean, easy-to-read dashboard.
🔧 Key Features
🕰️ Session-Based Bias (London / New York)
Independent bias calculation per session
Killzone times customizable with timezone support
Background highlighting (blue/red) for each session
📊 VWAP Engine
Reclaim & rejection detection
VWAP deviation alerts
Daily HTF VWAP integration
Score impact based on VWAP behaviour
📉 Market Structure (CHoCH / BOS)
Detects swing highs/lows
Labels bullish/bearish CHoCHs
Structure score contributes to session bias
💧 Liquidity Grabs
Detects stop hunts above highs / below lows
Confirms with candle rejection (body % filter)
Plots labels and adds to bias scoring
⚡ Momentum Filters
RSI: Bullish >55, Bearish <45
MACD: Histogram + Signal Line crossovers
Combined momentum score used in bias
🧠 Smart Money Proximity
Optional FVG/OB score toggle (placeholder for custom logic)
Adds static confluence for proximity-based setups
⏫ Higher Time Frame Context
Daily VWAP comparison
4H high/low structure breaks
Adds trend score to current session bias
🧠 How Bias Works
The suite uses a scoring model. Each confluence adds or subtracts points:
VWAP reclaim/reject: ±30
CHoCH/BOS: ±30
Liquidity grab: ±20
RSI/MACD: ±10
FVG/OB Proximity: +10
Daily VWAP trend: ±10
H4 Trend Break: ±10
Final Bias:
Bullish if score ≥ +20
Bearish if score ≤ -20
Neutral if between -19 and +19
A confidence % (capped at 100) is also shown, along with the contributing confluences (VWAP, Structure, Liquidity, etc.).
📋 Dashboard
A real-time dashboard shows for each session:
Session name and time
Bias (Bullish / Bearish / Neutral)
Confidence (%)
Confluences used
Position can be moved (Top Left, Top Right, etc.). Designed to be unobtrusive yet informative.
🧪 Best Practices
Use on 15m / 5m charts for intraday setups
Confirm with D1 or H4 structure for directional context
Combine with OB/FVG zones or SMT for entries
Use Trading View alerts for bias flips or liquidity grabs (custom logic can be added)
Bar Replay compatible for back testing and journaling bias shifts
🔐 Notes
Does not generate trade signals or alerts by default
Focused on bias generation and confluence stacking
Compatible with funded account trading models
📈 Built for traders who want a systematic, score-based approach to identifying directional edge in high-volume gold sessions.

BOS mark-out (by Lumiere)Advanced BOS Detection with Strict Swing Confirmation
This indicator implements BOS detection with several unique features:
🔹 Dual-Candle Swing Validation - Unlike most BOS indicators that use single candle swings, this uses a two-candle confirmation for swing highs/lows, analyzing both the candle wicks and body transitions.
🔹 Directional Lock System - Implements a state machine that prevents duplicate signals until an opposite-direction BOS occurs, reducing noise.
🔹 Precision Wick Analysis - Compares wicks between the reversal candle and confirmation candle to identify the true swing point.
🔹 Real-Time Update & Live Market Adaptation – The indicator continuously monitors price action and instantly updates BOS signals as new candles form, ensuring you never miss a BOS.
How It Differs From Other BOS Indicators:
Most public BOS indicators use simple HH/HL or LH/LL detection.
Many don't implement the directional locking mechanism.
Few use the two-candle wick comparison approach.
Wick-Based Precision uses the extreme wicks of two candles (not just the body).
Strict Confirmation requires a close beyond the swing point (no "wick breaks" counted).
Usage Examples:
🟦 Bullish BOS:
A green candle closes, followed by a red candle. This will be the new high, and if the next candle closes above the highest wick of those two, it will be a BOS (only if we had a bearish BOS before)
🟥 Bearish BOS:
A red candle closes, followed by a green candle. This will be the new low, and if the next candle closes below the lowest wick of those two, it will be a BOS (only if we had a Bullish BOS before)

The ICT Ultimate Grid | MarketMaverisk GroupThe ICT Ultimate Grid | MarketMaverisk Group
This script is a fully customizable checklist based on ICT (Inner Circle Trader) concepts. It helps traders validate entry conditions across three timeframes:
LTP (Long-Term), ITP (Intermediate-Term), and STP (Short-Term).
⸻
✅ Purpose & Utility:
Instead of generating simple buy/sell signals, this tool assists traders in making structured, confirmation-based decisions. It presents a visual checklist with 11 customizable columns—each can be individually toggled for each timeframe and displays ✅ or ❌ confirmation status.
⸻
🧠 Confirmation Structure:
The checklist covers the following core elements from the ICT methodology:
• ERL⇔IRL and IRL⇔ERL (presented as special confirmations below the table)
• DOL – Drow On liqudity Level
• PD – permium or discuant
• SMT – Smart Money Trap / Inter-market Divergence
• CSD – Change in State of dlivery
• MSS – Market Structure Shift
• MMXM – Market maker (buy or sell) model
• FVG – Fair Value Gap
• OB – Order Block
• BRK.B – breker Block
Each item can be enabled or disabled for LTP, ITP, and STP individually.
⸻
📊 Visual Design:
• Clean, compact table displayed in the top-right corner of the chart.
• Clear color scheme (✅ Green = Confirmed, ❌ Red = Not Confirmed, Grey = Hidden/Disabled).
• Timeframes are stacked row-wise (LTP, ITP, STP).
• Inputs allow fine-grained control over what elements are shown in each timeframe.
• Additional rows are used to confirm:
• HTF Key Level
• Direction: Reversal ↩️ or Continuation 🔂
• Bias: Bullish 🔼 or Bearish 🔽
⸻
📈 Use Case:
This tool is ideal for traders who follow:
• ICT-based trading approaches
• Market structure + Liquidity analysis
• Day trading, scalping, or swing setups
• Confirmation-based entries after higher-timeframe alignment
⸻
⚙️ Recommended Timeframe Settings:
• LTP = D1 or 4H
• ITP = 1H or 15min
• STP = 5min or 3min or 1min
• Session time: Best used between 02:00 and 05:00 on london killzone & 08:00 and 12:00 on New york killzone in New York timezone (UTC -5)
(you can customize this in strategy version)
⸻
🛠 Technical Note:
This version is an indicator and does not generate signals or alerts by itself. For full automation, a strategy version is also available upon request.
⸻
Let me know if you’d like me to also write a “strategy description” or help you prepare the public chart layout 📊 to make your publish clean and attractivE

CandelaCharts - Liquidity Key Zones (LKZ)📝 Overview
The Liquidity Key Zones indicator displays the previous high and low levels for daily, weekly, monthly, quarterly, and yearly timeframes. These levels serve as crucial price zones for trading any market or instrument. They are also high-probability reaction zones, ideal for trading using straightforward confirmation patterns.
Each of these levels plays a significant role in determining whether the market continues its momentum or reverses its bias. I like to think of these levels as dual magnets—they simultaneously attract and repel price. You might wonder how having opposing views can be useful. The key is to remain neutral about direction and establish your own rules to identify when these zones are likely to attract or repel price. I have my own set of rules, and you can develop yours.
📦 Features
MTF
Styling
⚙️ Settings
Day: Shows previous day levels
Week: Shows previous week levels
Month: Shows previous month levels
Quarter: Shows previous quarter levels
Year: Shows previous year levels
Show Average: Shows previous level average price
Show Open: Shows previous level open price
⚡️ Showcase
Daily
Weekly
Monthly
Quarterly
Yearly
Average
Open
📒 Usage
When the price breaks through a significant level, such as a daily, weekly, or monthly high or low, it often signals a potential reversal in market direction. This occurs because these levels represent key areas of support or resistance, where traders anticipate heightened activity, including profit-taking, stop-loss orders, or new positions being initiated.
Once the price breaches these levels, it may trigger a sharp reaction as market participants adjust their strategies, leading to a reversal. Monitoring price action and volume around these levels can provide valuable confirmation of such reversals.
Another effective approach to utilizing these pivot points is by incorporating them into a structured trading strategy, such as the X Model, which leverages multiple timeframes and technical tools to refine trade entries and exits.
X Model conditions:
(D1) Previous Day High (ERL)
(H1) Bullish FVG/IFVG/OB (IRL)
(m15) MSS / SMT
Only Short Above 00:00
By combining these elements, the X Model offers a comprehensive framework for leveraging pivot levels effectively, emphasizing confluence between liquidity zones, time-based rules, and multi-timeframe analysis to enhance trading accuracy and consistency.
🚨 Alerts
This script provides alert options for all signals.
Bearish Signal
A bearish signal is generated when the price breaks below the previous low level.
Bullish Signal
A bullish signal is generated when the price breaks above the previous low level.
⚠️ Disclaimer
Trading involves significant risk, and many participants may incur losses. The content on this site is not intended as financial advice and should not be interpreted as such. Decisions to buy, sell, hold, or trade securities, commodities, or other financial instruments carry inherent risks and are best made with guidance from qualified financial professionals. Past performance is not indicative of future results.

Correlated asset and Daye's Quarterly TheoryThis indicator is based on the Quarterly Theory concepts from Daye. You can find him mainly on X as traderdaye.
It works on a new panel and the quarters will be drawn over the chart of the correlated that you set on its settings.
You can use every asset to compare with the main one to make easier to find divergences between days, sessions and 90 minutes cycles.
In different timeframes, the indicator could show more or less information about quarters, but will always show the compared asset one. This is due to limitations of the candles start (for example, the Session's Q2 open won't be shown on an hourly chart because it starts after 30 minutes of candle's open).
What can this indicator do for you?
- Show the correlated asset chart.
- Show daily, session and 90 minutes cycle boxes.
- Show Midnight and every session's Q2 open.
- Make easier for the trained eye to determine if the model is AMDX or XAMD, find PO3, turtle soups, SMT divergences, etc.
Do you have any suggestion? Please, leave it on the comments. I'll try to improve this indicator regularly.
