2Mars - MA / BB / SuperTrend
The 2Mars strategy is a trading approach that aims to improve trading efficiency by incorporating several simple order opening tactics. These tactics include moving average crossovers, Bollinger Bands, and SuperTrend.
Entering a Position with the 2Mars Strategy:
Moving Average Crossover: This method considers the crossing of moving averages as a signal to enter a position.
Price Crossing Bollinger Bands: If the price crosses either the upper or lower Bollinger Band, it is seen as a signal to enter a position.
Price Crossing Moving Average: If the price crosses the moving average, it is also considered a signal to enter a position.
SuperTrend and Bars confirm:
The SuperTrend indicator is used to provide additional confirmation for entering positions and setting stop loss levels. "Bars confirm" is used only for entry to positions.
Moving Average Crossover Strategy:
A moving average crossover refers to the point on a chart where there is a crossover of the signal or fast moving average, above or below the basis or slow moving average. This strategy also uses moving averages for additional orders #3.
Basis Moving Average Length: Ratio * Multiplier
Signal Moving Average Length: Multiplier
Bollinger Bands:
Bollinger Bands consist of three bands: an upper band, a lower band, and a basis moving average. However, the 2Mars strategy incorporates multiple upper and lower levels for position entry and take profit.
Basis +/- StdDev * 0.618
Basis +/- StdDev * 1.618
Basis +/- StdDev * 2.618
Additional Orders:
Additional Order #1 and #2: closing price crosses above or below the Bollinger Bands.
Additional Order #3: closing price crosses above or below the basis or signal moving average.
Take Profit:
The strategy includes three levels for taking profits, which are based on the Bollinger Bands. Additionally, a percentage of the position can be chosen to close long or short positions.
Limit Orders:
The strategy allows for entering a position using a limit order. The calculation for the limit order involves the Average True Range (ATR) for a specific period.
For long positions: Low price - ATR * Multiplier
For short positions: High price + ATR * Multiplier
Stop Loss:
To manage risk, the strategy recommends using stop loss options. The stop loss is updated with each entry order and take-profit level 3. When using the SuperTrend Confirmation, the stop loss requires confirmation of a trend change. It allows for flexible adjustment of the stop loss when the trend changes.
There are three options for setting the stop loss:
1. ATR (Average True Range):
For long positions: Low price - ATR * Long multiplier
For short positions: High price + ATR * Short multiplier
2. SuperTrend + ATR:
For long positions: SuperTrend - ATR * Long multiplier
For short positions: SuperTrend + ATR * Short multiplier
3. StdDev:
For long positions: StdDev - ATR * Long multiplier
For short positions: StdDev + ATR * Short multiplier
Flexible Stop Loss:
There is also a flexible stop loss option for the ATR and StdDev methods. It is triggered when the SuperTrend or moving average trend changes unfavorably.
For long positions: Stop-loss price + (ATR * Long multiplier) * Multiplier
For short positions: Stop-loss price - (ATR * Short multiplier) * Multiplier
How configure:
Disable SuperTrend, take profit, stop loss, additional orders and begin setting up a strategy.
Pick soucre data
Number of bars for confirm
Pick up the ratio of the base moving average and the signal moving average.
Set up a SuperTrend
Time for set up of the Bollinger Bands and the take profit
And finaly set up of stop loss and limit orders
All done!
For OKX exchange:
Search in scripts for "stop loss"

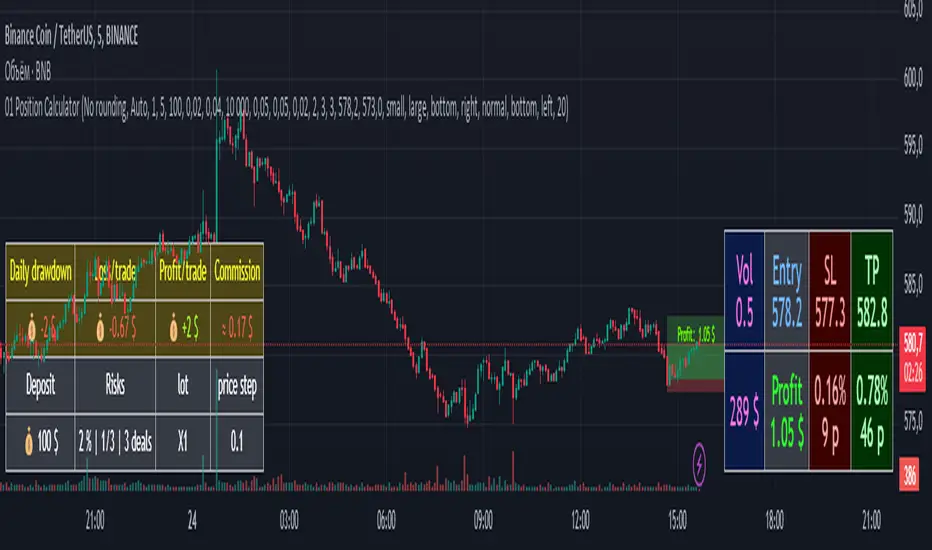
01 Position CalculatorI present to your attention a calculator for calculating the volume per position.
This calculator is tested on cryptocurrency trading and MOEX liquid shares!
This calculator is suitable for beginners to make it easier to study trading and not get confused at the very beginning with volume calculations, I also use it for virtual trading, a position is drawn on the chart in real time, which shows the amount of loss or profit, that is, with the help of it I I practice different strategies without losing real money on experiments.
All calculations are made at your risk.
You need to indicate what your working deposit is, what percentage of it you are willing to risk per day, the number of your losing trades for one trading session, after which you will stop trading for that day, the amount of risk will be divided by the number of unprofitable trades.
The principle of operation is as simple as possible, you need to indicate three lines on the chart 1 - time line: it is needed so that a position on the chart can be drawn from it. 2 – Entry line for entering a position: the price at which you want to buy an asset. 3 – stop loss line “SL”: the price upon reaching which your losing trade will be closed. If the 3-stop loss line is placed below the 2-Entry line, then a long position will be calculated, if the stop loss line is above the Entry line, then a short position will be calculated. take profit "TP" is calculated automatically according to your settings in the menu.
And so on in order through the menu from top to bottom.
1. Rounding the volume to a whole number: if you select “round”, then the volume of the acquired asset (shares, coins, etc.) will be rounded to a whole number, but be careful if your deposit is $100, and the cost of 1 unit of the asset is more than $1000, then the calculator will give error. MOEX shares are traded only in whole lots, so rounding occurs automatically.
2. Automatic calculation of SL in 1 ATR of the selected TF (auto/manual) (ATR...): if you select auto and specify, for example, ATR 1h, then your “SL” will be calculated automatically and set at a distance from Entry of 1 ATR of the hourly time frame (this is the average price change over 1 hour)
3. Cryptocurrency deposit commission, MOEX deposit commission: I made two different deposits on purpose so as not to change the settings each time, depending on the schedule you choose, MOEX or cryptocurrency, the required deposit and commission will be automatically taken into account.
4. Slippage: this is the percentage of slippage on closing a position at a stop loss.
5. Daily drawdown % (...): this is the percentage of your trading deposit that you are willing to risk for one trading session, the amount at risk.
6. Ratio rice /profit 1/ (...): you need to indicate the SL/TP ratio, based on this your income per trade is calculated and the distance to TP is outlined on the graph.
7. Number of losing trades (...): this is the number of your trades per trading session after receiving which you will end trading for that day, the amount of risk will be divided by the number of losing trades.
8. Position: you can enter the start date of the position and Entry and SL prices
9. ATR – specify the number of last candles to calculate the average price movement of the selected time frame
Now, as for the tables located by default on the left and right at the bottom of the screen, I made windows with descriptions; when you hover the cursor over a cell, a description pops up.
RU
Этот калькулятор проверен, на торговле криптовалюты и ликвидных акциях MOEX!
Этот калькулятор подойдет начинающим, чтоб облегчить изучение торговли и не запутаться в самом начале с расчётами объемов, так же я использую его для виртуальной торговли, на графике в реальном времени рисуется позиция, на которой видно суму убытка или прибыли, то есть с помощью него я отрабатываю разные стратегии, не теряя реальные деньги на эксперименты.
Все расчеты делаются от вашего риска.
Вам необходимо указать какой ваш рабочий депозит, каким процентом от него вы готовы рискнуть на день, количество ваших убыточных сделок на одну торговую сессию, после которых вы прекратите торговлю на этот день, сумма риска будет поделена на количество убыточных сделок.
Принцип работы максимально прост, вам нужно указать на графике три линии 1 - линия время: она нужна чтоб от нее рисовался позиция на графике. 2 –линия Entry входа в позицию: цена по которой вы хотите купить актив. 3 – линия stop loss «SL»: цена при достижении которой закроется ваша убыточная сделка. Если линию 3-stop loss разместить под линией 2-Entry то будет рассчитываться длинная позиция, ели лини stop loss будет над линией Entry то будет рассчитываться короткая позиция. take profit «TP» рассчитывается автоматически согласно вашим настройкам в меню.
И так по порядку по меню с верху в низ.
1. Округление объема до целого: если выбрать «round -округлить», то объем приобретаемого актива (акции, монеты и другого) будет округлен до целого числа, но будьте внимательны если ваш депозит 100$, а стоимость 1 единицы актива более 1000$ то калькулятор выдаст ошибку. Акции MOEX торгуются только целыми лотами потому округление происходит автоматически.
2. Авто расчёт SL в 1 ATR выбранного TF (auto/manual) (ATR…): если выбрать auto и указать, к примеру ATR 1h, то ваш «SL», будет рассчитан автоматически и выставлен на расстоянии от Entry в 1 ATR часового time frame (это усредненное изменение цены за 1 час)
3. Депозит крипто валюты комиссия, депозит MOEX комиссия: сделал специально два разных депозита чтоб каждый раз не менять настройки, в зависимости от выбранного вами графика, MOEX или криптовалюта, будет автоматически браться в расчет нужный депозит и комиссия.
4. Проскальзывание: это процент на проскальзывание закрытия позиции по stop loss.
5. Просадка на день % (…): это процент от вашего торгового депозита, которым вы готовы рискнуть на одну торговую сессию, сумма риска надень.
6. Соотношение рис /прибыль 1/ (…): вам нужно указать соотношение SL/TP на основе этого рассчитывается ваш доход на сделку и на графике обрисовывается расстояние до TP.
7. Количество убыточных сделок (…): это количество ваших сделок на торговую сессию после получения, которых вы закончите торговлю на этот день, сумма риска надень будет поделена на количество убыточных сделок.
8. Позиция: можно вписать дату начала позиции и цены Entry и SL
9. ATR – укажите количество последних свечей для расчета среднего движения цены выбранного time frame
Теперь что касается таблиц расположенных по умолчанию с лева и справа в низу экрана, я сделал окна с описаниями, при наведении курсора на ячейку всплывает описание.
PTS Pi-Osc V1
The PTS - Pi-Osc know as Precision Index Oscillator by Roger Medcalf - Precision Trading Systems.
How does the Pi-Osc work?
Pi-Osc is a highly sophisticated consensus type indicator comprising of many different component signals.
A technical traders tool that measures everything from divergences to probabilities all blended into one simple to use product.
The buy and selling opportunities are highlighted by the moves away from + or - 3.14.
Simple to use for all levels of experience from beginner to expert and offers a unique edge in terms of precision.
The components that go into computations are identified below.
Money flow index provides a simple snapshot of how sold out or pumped up a stock or future really is and when measured in three different time frames gives a slick consensus view of money flow.
Relative strength index (RSI) still the No1 most popular indicator in use today as its power to identify overbought and oversold qualities in sideways markets is exceptional.
Its poor performance in trends is greatly reduced when seamlessly integrated with the PI-Osc algorithm.
Demand index being one of the designers favourite indicators for measuring the future direction caused by a large volume trade is incorporated here as well as its exceptional efficiency as a divergence indicator.
James Sibbet's creation provides an additional stellar incisive cutting accuracy to the Pi-Osc. Sibbets creation is one of the only indicators with true predictive qualities as a leading indicator.
Divergences. Pi-Osc measures divergences which occur over many look back periods from two different indicators, realising that divergences are often spurious in their reliability, the indicator only factors 4% of the total indicator
reading from these. Paradoxically the buy and sell zones have to have at least one observation of a divergence to trigger a signal.
Volume is always a factor that precedes a price change, as stock prices cannot move without a real money value being assigned to it either as a recent trade or a bid-offer order being placed.
The designer's understanding of volume patterns is a very useful addition incorporated into the Pi-Osc indicators unique conception.
Momentum frequently decelerates prior to market turning points and PI-osc is monitoring several timeframes of smoothed momentum samples in its calculations.
But unlike a conventional rate of change or momentum indicator the Pi-Osc indicator scores a neutral reading when momentum is rising or falling fast, and a reading is only factored into the output when momentum is reducing, thus
indicating a higher probability of success.
Probability is another feature of this algorithm.
Although rarely used in industry standard oscillators, the designer has added a standard deviation (2.9) factor into this indicator as the more usual 2 standard deviations used in Bollinger bands is just not reliable enough to bet hard earned cash on.
Normally distributed price sets have a 99.9% containment within 3.3 standard deviations, so when this is breached the Pi-Osc adds or deducts a further value to its output number.
Stochastics have similar attributes to RSI oscillators and have contributed a factor into PI-osc due to their smooth and reliable ability to identify buying and selling points in non trending markets.
Price patterns. Generally the industry standard oscillators just use the closing price to calculate their values, and although some indicators such as the stochastic use the high and low in their mathematics, few oscillators are actually programmed to respond to unique candlestick chart set ups.
PI-osc is setting the standard with its intelligent programming to recognise when the current chart pattern is shouting buy signals. Several of the more reliable patterns are factored into the algorithm.
When all the maths is done, Pi-Osc does an exceptional job of determining true buying and selling points.
Basically the trading interpretation is made very simple for you, as the buy and sell zones are so logically determined, not by one factor but from a large consensus "vote" from more than one different computation.
The benefits of this indicator are that it saves valuable time in "confirming technical analysis signals" and all trades know time is precious as large price changes can be missed in seconds while checking other confirming factors.
It takes the hard work out of it, and lets your computer do the brain work.
Ideally this indicator is best as an entry signal, and exits are best done with a trailing stop which has a logical trend following exit, as its quite rare that the Pi-Osc will run right to the other extreme and issue a reverse signal.
Precision Index Oscillator has now got a new rule as a result of the gradual rise in market volatility.
Apart from the other well known main rules to wait for the bounce away from Pi and trade in the direction of the major trend, the new rule is to experiment to find the best historical timeframe.
In the old days it would fire up very nicely on a 10 minute chart of most things, and still does (sometimes) but the futures markets and the very volatile cryptocurrencies now go way out of the old extremities in terms of deviations from the norm.
So it is essential to know what the market volatility is capable of on each instrument.
The point being made here is that using this on very short term time frames is not as safe as used to be.
Institutions enjoy working together to drive the prices into areas where most traders did not expect them to go, taking out all the stops and getting a better price for themselves.
So the first task after ordering this product is to create multiple minute chart settings in your Trading View platform and then click through them and there you will find hopefully find the holy grail, just like finding the best guitar,
amplifier and effects pedal settings for creating your own personalized type of music, finding the best timeframe to use you Pi-Osc is the essential work.
The holy grail usually turns out to be nothing more complex than a stop watch:
If the best setting turns out to be 15 minutes or 30 seconds on a volatile market or a 4 hours minute chart on a very volatile market then so be it.
Who cares? Does it matter?
All that matters is you find the way to get to the best results from this product.
Precision Index Oscillator has eight rules
1. Trade in the direction of the major trend
2. Find the time frame that has worked best in historical testing ( This can be a different setting for each market )
3. ALWAYS use a stop loss
4. Wait for the bounce away from Pi
5. Wait for the bounce away from Pi
6 Wait for the bounce away from Pi
7 Wait for the bounce away from Pi
8. Remember the other seven rules.
Precision Index Oscillator clarification of rules 3 to 7
This indicator can stay locked at the extreme Pi level for many bars, days, hours, minutes, seconds etc.
Taking the signal before the bounce comes is like the well known phrase "catching the falling knife".
Taking the signal before the bounce is a "Pi-Crime" and is a bad idea. Ignoring this point will likely result in losses
As Ed Seykota puts it in his usual amusing style, the problem with catching falling knives is that there are more knives than we have fingers.
He is referring to a market sell off rather than a sell off in one market.
When everything is crashing and we buy all of the crashing things at once, yes you guessed it: A painful day for the fingers!
Suggested settings for various lengths:
There are no settings to change. The beauty of Pi-Osc is there are no settings to be changed.
Your testing of "Pi signal qualifications" is confined only to selecting a time frame which appears to have offered good Pi-trades in the past.
This does not guarantee future signals will be good, and this is why risk control is essential.
Of course it is smart to experiement with different time periods of chart.
Execution of trades:
Exercise caution with this product.
Risk control is essential and risking more than 1% to 1.5% of your capital from entry price to stop would NOT be advised:
As with hunting, firing out lots of small trades in a shot gun approach will lead to better results than gambling all on the first signal you see.
There is much more chance of hitting a bird with a shot gun than a canon and the ammunition is much cheaper.
Always always use a stop loss. Something like 3 to 7 times a fifty period average true range for example.
Whilst it is often possible that a Pi-bounce appears exactly at the precise high or low of the week and could be the only one you see it is risky just to pile into it instantly as some markets produce several failed signals which continue to move in the same direction.
The safest and least risky method is to wait for the trend to change after the Pi-bounce. This is subjective to your own definition of how to measure the trend as "changing" but I would suggest waiting for a 8-20 period Exponential average to turn around before entering a trade.
Once the trade is entered you can implement a trailing stop to allow maximum potential gains and if your style is one of wanting to take quick profits then it is wise to take only some partial profits and give the move a chance to go somewhere and exit the remainder when the trend changes.
If the move was picked up near the absolute top or bottom it could be a large mistake to bail out of all of it early.
Market selection is important:
Avoid markets in endless smooth trends. These are best trading with trend following products ( Pi-Osc is not a trend following product )
Look for a choppy up or down trend or sideways market with some cycle qualities to it.
Best results are on liquid markets, you can observe the past signals and often history repeats with the good previous signals tending to indicate that future signals may also be good. (This is not certain of course)
This is also true of a market showing several historically bad signals which may be leading to more bad signals.
If the past performance of this indicator is poor on the market you are viewing, then move to another market until one is found where the readings show good price action after the signals in historical data.
Time frames:
This product can be applied to any time frame of market but be aware as is stated above, the slower time frames yield more valid signals and shorter time frames lead to more randomness and noise ridden plots of lower significance.
That said, it provides a valid reason to enter a trade and can give good results providing good stops and risk control are used. I have seen plenty of valid signals on 30 second charts right up to weekly charts.
The reliability of short term intra day time frames is usually lower than weekly or daily time frames. As 10 minute time frame is more reliable than a 30 second chart.
Please take this into consideration, try slowing down the impulses to go fast.
I am now accepting payments in USD or CHF for this product
This is not because I expect a US Dollar collapse but as a precaution to spread currency risk over different classes.
As FX rates vary substantially you can find the option that is cheaper than the other and it is fine to do that and choose the cheaper payment option.
Thanks for reading and I hope you do well with Pi-Osc on Trading View, just remember all the eight rules. You do remember them don't you?
Roger Medcalf - Precision Trading Systems
Elliott Wave with Supertrend Exit - Strategy [presentTrading]## Introduction and How it is Different
The Elliott Wave with Supertrend Exit provides automated detection and validation of Elliott Wave patterns for algorithmic trading. It is designed to objectively identify high-probability wave formations and signal entries based on confirmed impulsive and corrective patterns.
* The Elliott part is mostly referenced from Elliott Wave by @LuxAlgo
Key advantages compared to discretionary Elliott Wave analysis:
- Wave Labeling and Counting: The strategy programmatically identifies swing pivot highs/lows with the Zigzag indicator and analyzes the waves between them. It labels the potential impulsive and corrective patterns as they form. This removes the subjectivity of manual wave counting.
- Pattern Validation: A rules-based engine confirms valid impulsive and corrective patterns by checking relative size relationships and fib ratios. Only confirmed wave counts are plotted and traded.
- Objective Entry Signals: Trades are entered systematically on the start of new impulsive waves in the direction of the trend. Pattern failures invalidate setups and stop out positions.
- Automated Trade Management: The strategy defines specific rules for profit targets at fib extensions, trailing stops at swing points, and exits on Supertrend reversals. This automates the entire trade lifecycle.
- Adaptability: The waveform recognition engine can be tuned by adjusting parameters like Zigzag depth and Supertrend settings. It adapts to evolving market conditions.
ETH 1hr chart
In summary, the strategy brings automation, objectivity and adaptability to Elliott Wave trading - removing subjective interpretation errors and emotional trading biases. It implements a rules-based, algorithmic approach for systematically trading Elliott Wave patterns across markets and timeframes.
## Trading Logic and Rules
The strategy follows specific trading rules based on the detected and validated Elliott Wave patterns.
Entry Rules
- Long entry when a new impulsive bullish (5-wave) pattern forms
- Short entry when a new impulsive bearish (5-wave) pattern forms
The key is entering on the start of a new potential trend wave rather than chasing.
Exit Rules
- Invalidation of wave pattern stops out the trade
- Close long trades on Supertrend downturn
- Close short trades on Supertrend upturn
- Use a stop loss of 10% of entry price (configurable)
Trade Management
- Scale out partial profits at Fibonacci levels
- Move stop to breakeven when price reaches 1.618 extension
- Trail stops below key swing points
- Target exits at next Fibonacci projection level
Risk Management
- Use stop losses on all trades
- Trade only highest probability setups
- Size positions according to chart timeframe
- Avoid overtrading when no clear patterns emerge
## Strategy - How it Works
The core logic follows these steps:
1. Find swing highs/lows with Zigzag indicator
2. Analyze pivot points to detect impulsive 5-wave patterns:
- Waves 1, 3, and 5 should not overlap
- Waves 3 and 5 must be longer than wave 1
- Confirm relative size relationships between waves
3. Validate corrective 3-wave patterns:
- Look for overlapping, choppy waves that retrace the prior impulsive wave
4. Plot validated waves and Fibonacci retracement levels
5. Signal entries when a new impulsive wave pattern forms
6. Manage exits based on pattern failures and Supertrend reversals
Impulsive Wave Validation
The strategy checks relative size relationships to confirm valid impulsive waves.
For uptrends, it ensures:
```
Copy code- Wave 3 is longer than wave 1
- Wave 5 is longer than wave 2
- Waves do not overlap
```
Corrective Wave Validation
The strategy identifies overlapping corrective patterns that retrace the prior impulsive wave within Fibonacci levels.
Pattern Failure Invalidation
If waves fail validation tests, the strategy invalidates the pattern and stops signaling trades.
## Trade Direction
The strategy detects impulsive and corrective patterns in both uptrends and downtrends. Entries are signaled in the direction of the validated wave pattern.
## Usage
- Use on charts showing clear Elliott Wave patterns
- Start with daily or weekly timeframes to gauge overall trend
- Optimize Zigzag and Supertrend settings as needed
- Consider combining with other indicators for confirmation
## Default Settings
- Zigzag Length: 4 bars
- Supertrend Length: 10 bars
- Supertrend Multiplier: 3
- Stop Loss: 10% of entry price
- Trading Direction: Both

[Volume Profile] Signal Clean Up Analysis with Backtest (TSO) This is a full-cycle trading system indicator, which uses Volume Profile for generating signals using a custom developed algorithm, TP (Take Profit) and SL (Stop Loss) levels. There are 2 SOURCES for signals (each can be used separately or both can be used at the same time, each signal SOURCE is using Volume Profile levels to open optimal trade direction) with chained (NOTE: You can select several or ALL of the features, this is not limited to either one) signal cleanup and analysis approach with scheduling and alerting capabilities. Works with most popular timeframes: 1M, 5M, 15M, 1H, 4H, D, great for intraday trading!
NOTE: Every calculation is done on a confirmed closed candle bar state, so the indicator will never repaint!
===========================================================================
Explanation of all the Features | Configuration Guide | Indicator Settings | Signal Cleanup Analysis
---------------------------------------------------------------------------
>>> Customizable Backtesting for a specific date range, results via TradingView strategy, which includes “Deep Backtesting” for largest amounts of data on trading results.
>>> Trading Schedule with customizable trading daily time range, automatic closing/alert trades before Power Hour or right before market closes or leave it open until next day.
>>> 3 Trading Systems.
>>> Multiple Signal SOURCEs for opening trades, either SOURCE can be used or both at the same time!
>>> Static/Dynamic Stop-Loss setups (HIGHLIGHT: Stop-Loss will be moved to Entry after TP1 is taken, which minimizes risk).
>>> Single or Multiple profit targets (up to 3).
>>> Take-Profit customizable offset feature (set your Take-Profit targets slightly before everyone is expecting it!).
>>> Candle bar signal analysis (matching candle color, skip opposite structured and/or doji candle uncertain signals).
>>> Additional analysis of VWAP/EMA/ATR/EWO (Elliot Wave Oscillator)/Divergence MACD+RSI/Volume signal confirmation (clean up your chart with indicator showing only the best potential signals!).
>>> Advanced Alerts setup, which can be potentially setup with a trading bot over TradingView Webhook (NOTE: This will require advanced programming knowledge).
===========================================================================
Labels, plots, colors explanations:
---------------------------------------------------------------------------
>>>>> Signal SOURCE(s): Green/Red arrows, which will be shown unconditionally, outside of trade engine and can be hidden if desired.
>>>>> LONG open: green "house" looking arrow below candle bar.
>>>>> SHORT open: red "house" looking arrow above candle bar.
>>>>> LONG/SHORT take-profit target: green/red circles (multi-profit > TP2/3/4/5 smaller circles).
>>>>> LONG/SHORT take-profit hits: green/red diamonds.
>>>>> LONG/SHORT stop-loss target: green/red + crosses.
>>>>> LONG/SHORT stop-loss hits: green/red X-crosses.
>>>>> LONG/SHORT EOD close (profitable trade): green/red squares.
>>>>> LONG/SHORT EOD close (loss trade): green/red PLUS(+)-crosses.
===========================================================================
Date Range and Trading Schedule Settings
---------------------------------------------------------------------------
>>>>> Date Range: Select your start and/or end dates (uncheck “End” for indicator to show results up to the very moment and to use for LIVE trading) for backtesting results, if not using backtesting – uncheck “Start”/“End” to turn it off.
>>>>> Use TradingView “Strategy Tester” to see backtesting results
NOTE: If Strategy Tester does not show any results with Date Ranged fully unchecked, there may be an issue where a script opens a trade, but there is not enough TradingView power to set the Take-Profit and Stop-Loss and somehow an open trade gets stuck and never closes, so there are “no trades present”. In such case you will need to manually check “Start”/“End” dates or use “Depp Backtesting” feature!
>>>>> Trading Schedule: This is where you can setup Intraday Session or any custom session schedule you wish. Turn it ON. Select trading hours. Select EOD (End of Day) setting (NOTE: If it will be OFF, the indicator will assume you are holding your position open until next day!).
>>> Trading Systems: 1) "Open Until Closed by TP or SL": the signal will only open a trade if no trades are currently open/trunning, a trade can only be closed by Take Profit, Stop Loss or End of Day close (if turned on) | 2) "Open Until Closed by TP or SL + OCA": Same as 1), but if there is an opposite signal to the trade which is currently open > it will immediately be closed with new trade open or End of Day close (if turned on) | 3) "OCA (no TP or SL)": There are is Take Profit or Stop Loss, only an opposite signal will close current trade and open an opposite one or End of Day close (if turned on)
>>>>> MULTIPROFIT | TP (Take-Profit) System: Once the trade is open, all Take-Profit target(s) are immediately calculated and set for the trade > once the target(s) is hit > trade will be partially closed (if candle bar closes beyond several Take-Profit targets > trade will be reduced accordingly to the amount of how many Take-Profit targets were hit)
>>>>> MULTIPROFIT | SL (Stop-Loss) System: 1) Static – Once the trade is open, Stop-Loss is calculated and set for the remaining of the trade ||| 2) Dynamic – At trade open, Stop-Loss is calculated and set the same way, however once 1st Take-Profit is taken > Stop-Loss is moved to Entry, reducing the risk.
>>>>> # of TPs (number of take profit targets): Just like it is named, this is where you select the number of Take-Profit targets for your trading system (NOTE: If "OCA (no TP or SL)" Trading System is selected, this setting won’t do anything, since there are no TP or SLs for that system).
>>>>> TP(s) offset: This is a special feature for all Take-Profit targets, where you can turn on a customizable offset, so that if the price is almost hitting the Take-Profit target, but never actually touches it > you will capture it. This is good to use with HHLL (Highest High Lowest Low), which is pretty much a Support/Resistance as often the price will nearly touch these strong areas and turn around…
===========================================================================
Take-Profit and Stop-Loss visual example:
---------------------------------------------------------------------------
1) A simply nice intraday trading day for SPY (S&P500 ETF TRUST) with a single Take-Profit target on each trade.
See how Take-Profit distances increase with price momentum and how Stop-Loss is following the trade reducing the risk!
2) Same intraday trading day for SPY (S&P500 ETF TRUST) with 3 Take-Profit targets with static Stop-Loss.
3) Same intraday trading day for SPY (S&P500 ETF TRUST) with 3 Take-Profit targets with dynamic Stop-Loss.
You can see how Stop-Loss was moved once TP1 is taken!
===========================================================================
Trade Analysis and Cleanup Settings
---------------------------------------------------------------------------
>>>>> Candle Analysis | Candle Color signal confirmation: If closed candle bar color does not match the signal direction > no trade will be open.
>>>>> Candle Analysis | Skip opposite candle signals: If closed candle bar color will match the signal direction, but candle structure will be opposite (for example: bearish green hammer, long high stick on top of a small green square) > no trade will be open.
>>>>> Candle Analysis | Skip doji candle signals: If closed candle bar will be the uncertain doji > no trade will be open.
>>>>> Divergence/Oscillator Analysis | EWO (Elliot Wave Oscillator) signal confirmation: LONG will only be open if at signal, EWO is green or will be at bullish slope (you can select which setting you desire), SHORT if EWO is red or will be at bearish slope.
>>>>> Divergence/Oscillator Analysis | VWAP signal confirmation: LONG will only be open if at signal, the price will be above VWAP, SHORT if below.
>>>>> Divergence/Oscillator Analysis | Moving Average signal confirmation: LONG will only be open if at signal, the price will be above selected Moving Average, SHORT if below.
>>>>> Divergence/Oscillator Analysis | ATR signal confirmation: LONG will only be open if at signal, the price will be above ATR, SHORT if below.
>>>>> Divergence/Oscillator Analysis | RSI + MACD signal confirmation: LONG will only be open if at signal, RSI + MACD will be bullish, SHORT if RSI + MACD will be bearish.
>>>>> Volume signal confirmation: LONG/SHORT will only be open if closing candle volume is 150% above average Volume based on the Volume Length.
===========================================================================
Alert Settings (you don’t have to touch this section unless you will be using TradingView alerts through a Webhook to use with trading bot)
---------------------------------------------------------------------------
Here is how a LONG OPEN alert looks like (each label is customizable + I can add up more items/labels if needed):
COIN: BTCUSD
TIMEFRAME: 15M
LONG: OPEN
ENTRY: 20000
TP1: 20500
TP2: 21000
TP3: 21500
SL: 19000
Leverage: 0
===========================================================================
Adding Alerts in TradngView
---------------------------------------------------------------------------
-Right-click anywhere on the TradingView chart
-Click on Add alert
-Condition: Select this indicator by it’s name
-Alert name: Whatever you want
-Hit “Create”
-Note: If you change ANY Settings within the indicator – you must DELETE the current alert and create a new one per steps above, otherwise it will continue triggering alerts per old Settings!
===========================================================================
If you have any questions or issues with the indicator, please message me directly via TradingView.
---------------------------------------------------------------------------
Good Luck! (NOTE: Trading is very risky, past performance is not necessarily indicative of future results, so please trade responsibly!)

[SPOILED]SuperTrench - ETH Super ScalperHi Traders,
I'm republishing this script as I finally polished it to perfection IMO. The script uses 5 coding sections: entry, trend filter, pivot filter, take profit, and stop loss. The script mainly uses trailing as take profit; this is probably the easiest way to make a profitable scalper strategy.
Backtest capital is set to 1000 USDT, 35% equity, 0.04% commission, limited backtest date from Jan 2022 to now, backtested on ETH/USDT prep contracts 15m timeframe, result as shown below.
It looks unreal right? Hell no, I actually tested this strategy on Binance from Dec 06 to Dec 10. I got 8.29% return with 4x leverage, 50% equity setup; 75% win rate,1.58 profit factor, with 4.3% max drawdown, it is amazingly close to the backtest result.
User Manual
Entry >>> Stoch RSI:
I added 5 MA types to the Stoch RSI which is HMA/VWMA/WMA/EMA/SMA, HMA with Length setting of 5, 8 seems to be most efficient, VWMA and WMA with 8, 13 will generate less entry signals but with less entry risks.
Entry >>> R Style:
It based on price action, with candlestick makes a U turn, after 2nd candlestick confirmed, it generates entry signal, this will give you some extra entries, better leave it enabled.
Entry >>> Price Step:
This probably is the core feature of this strategy; also my secret ingredient to making this strategy this efficient. It is recommended to enable step 1-5, more steps basically means more entries, but they are not necessarily profitable.
Trend Filter >>> Price Step:
I couldn't tell you much details about how this indicator works, but it is a reliable indicator, based on price action, and I got some ideas from Demark9 indicator. The bigger the level, the stronger the filter is, please note that if 'Price Step Entries' less than Price Step Trend, entries will be ignored.
Pivot Filter >>> RSI Pivot & Pinbar Pivot:
RSI Pivot detects if the RSI signal line making U turn in certain condition, Pinbar detection combines R Style entry when price action U turn took place, these 2 pivot filter will close the trade once it is counter trend, so it better enable and leave it as is.
Trend Filter >>> Trend Magic:
Trend Magic uses CCI and ATR to calculate trend status, green means uptrend, red means downtrend, pretty straight forward, the best value for this indicator would be, 21, 34, 55, 89.
Trend Filter >>> Alpha:
This filter combines R style pivot, price step, EMA all together to detects consolidation area, because EMA was involved, so the best look back period would be around 15-35, it is best to use default value IMO, in another hands, if you need stronger filter, feel free to use 10, 18, 20, 25, 30, 35, make sure look back period should increase or decrease by 5 every time.
Take Profit and Stop Loss:
The default value for tp is set to 0.4%, but I also give you option to switch to ATR TP; you can adjust in the ATR multiplier, default ATR trailing stop loss uses 1 ATR, but you can adjust it for better drawdown tolerance. Fixed ATR SL is also given when fixed ATR is enabled. There will be a failsafe SL default set to 1% if price moves counter direction of opened position, it will close trade no matter what happens.
Enjoy :)

Mean reversal QFL v3My aim is to make the bots trade as you would trading QFL manually and “by the book” or at least to my experience and understanding from the material out there of how you should plan a QFL trade.
Im absolutely not a pro trader, I have made my share of costly mistakes trying to be clever or Beeing impatient resulting in painful losses. QFL is we’re I’ve had consistently good results tough.
Is this where I have to say I’m not a financial advisor and all that? Well I’m not. As always Do your own research and backtest, backtest, backtest.
First: I believe no bot strategy are set and forget, while they can run unattended 80-90% of the time you're always going to find yourself in a situation where you will have to manually handle a bad deal. It would also make sense to be somewhat involved in the really good trades making the most out of them. That’s why understanding the strategy the bot Is using is really important, hence why I prefer QFL. It's an easy concept to understand, and proved to be a safe way of making steady profit in pretty much all market conditions if done right.
Some changes in how aggressive you are might be needed if you are the impatient kind of trader who needs to see a lot of deals happening. But it is an added risk. In those cases Luc would advise to start “nibbling” but that would be hard to implement in a bot but I will see if that’s something I can implement.
Same goes for going the more conservative route when market conditions calls for it.
QFL stands for Quickfingersluc, and sometimes it is referred to as the Base Strategy or Mean Reversals. Its main idea is about identifying the moment of panic selling and buying below the base level and utilizing Safety orders.
Base level or Support Level refers to the lowest price level that was reached before the moment the price started increasing again. At that level, you can notice that buyers of some cryptocurrencies make a strong reaction.
As a bit of a learning material i want to make a few points on important factors in trading using the QFL strategy:
• Identify strong bases
• Read the history of the chart
• No emotions
Trading QFL using a bot has it’s limitations:
· Some of the bases are questionable but im constantly trying to improve this
· The strategy don’t take into consideration chart history(success rate)*
· You need to follow a predefined (by you) buying ladder, hence not considering a particular coin's average price movement, which may vary quite a lot. This why I for now has limited the strategy to SIMPLE bots. So that unique alerts can be created for each pair.
· A set Take profit %, possibly making you miss out on higher profits(This is easy to change during a trade though), and no chance of selling in layers(This is coming soon).
1. Some of the bases are questionable
The strategy will start trades of bases that you wouldn’t consider being a strong base(or a base at all) when looking at the chart.
For those not as familiar with QFL. What is a base, and what qualifies as a strong base?
• A base is also called the Support Level, which is the lowest price level that was reached before the price started turning and increasing again.
• A strong base is recognized by a steep fall in price after breaking the base(Panic), followed by a big reaction pump.
• The reaction pump is the most important factor to say that it is a strong base.
• And also the last base, the one you are trading of is the one that counts
Tip: Look for V shapes on the chart, easy to spot when zoomed out.
2. The integrated signals don’t take into consideration chart history(success rate)*
How can you assess the success rate by looking at the chart?
After finding the bases based on the criterias from the 1st point. Looking at the, how many times did it respect the base after breaking it? 7/10, 8/10, 9/10 times? Great! Chances of the next trade also respecting the base is big, and I would consider raising the TP on that deal. Any lower than that I would keep a really close eye on the deal, or even consider closing the deal. And again remember the last base is the one that counts. If all the others are nice strong bases but that last one you are about to take a trade off is no good the base is invalidated so be cautious.
3. You need to follow a predefined (by you) buying ladder
Crypto is volatile, and there is a huge variation in price movements on all the coins.
Trading manually, looking at the chart gives you a good idea on how much a coin on avg. drops below base, and how big the following reaction is. This gives you an indication on how deep you need to set your layers, and where you can take profit.
Using the strategy you have the backtester to see how much max deviation has been in the past so that you can figure out what the optimal max deviation is.
4. A set Take profit %, possibly making you miss out on higher profits(This is easy to change during a trade though), and no chance of selling in layers.
Not going to say to much about this other than what I often do is:
When a bot has started a trade I usually take a look at the chart. If I like what I see, nice chart history, success rate and trading of a strong previous base etc, with the current base break resulting in a panic drop I will consider increasing the TP so that it will make more profit. This can be a bit risky but also very rewarding. Imagine filling all safeties and then selling just below base! Massive profits!! (Gotta be honest though, almost never stretch it that far with a bot though, but it is a possibility) .
If you have studied the chart and concluded that this particular trade has a 90% chance of success, there isn’t really any reason not to place TP just below base. This is where I would like to have the option of layering my sell orders as well so its something im working on implementing.
Trailing is an option in 3commas, but it’s slow to place orders making you miss a selling opportunity when the coin makes a sudden spike up.
ABOUT THIS STRATEGY
In this strategy we can also reverse the strategy and go short. But i must warn you that that is alot riskier.
QFL is meant to be used on higher TF's like 1hr, 2hr and 4hr. But this strategy also work well on lower Timeframes.
The script also simulates DCA strategy with parameters used in 3commas DCA bots for futures trading.
Experiment with parameters to find your trading setup.
Beware how large your total leveraged position is and how far can market go before you get liquidated!
Do that with the help of futures liquidation calculators you can find online!
Included:
An internal average price and profit calculating, instead of TV`s native one, which is subject to severe slippage.
A graphic interface, so levels are clearly visible and back-test analyzing made easier.
Long & Short direction of the strategy.
Table display a summary of past trades
Vertical colored lines appear when the new maximum deviation from the original price has
been reached
All the trading happens with total account capital, and all order sizes inputs are expressed in percent.
How to use:
- Add the script to the current chart
- Open the strategy settings
-Tweak the settings to to your liking.
-Make a SIMPLE bot in 3commas and use the same settings as you did in tradingview if you only want the strategy to send signals to open a deal and let 3commas handle the rest.
If you check safety orders, Take profit deal stop and Stop loss. The strategy will send all the orders to 3 commas. If that’s what you want set TP in 3commas to 50% set number of safety orders to 0 and keep stop loss unchecked.
- Insert bot details using the deal start condition message found in your 3commas bot.
- When happy, right click on the "..." next to the strategy name, then "Add alert'".
- Under "Condition", on the second line, chose "Any alert () function call". Add the webhook from 3commas( 3commas.io ), give it a name, use {{strategy.order.alert_message}} as a placeholder message and "create".
In the future this signal might make it to the 3commas marketplace. You can then subscribe to that signal where I have cherrypicked coins based on thorough backtesting and optimization.
How to obtain access to the script: send me a private message in Tradingview

GRID SPOT TRADING ALGORITHM - GRID BOT TRADING STRATEGYGRID SPOT TRADING ALGORITHM : LONG ONLY STRATEGY OPEN SOURCE
This is a long only strategy for spot assets.
HOW IT WORKS
Grid trading is a trading strategy where an investor creates a so-called "price grid". The basic idea of the strategy is to repeatedly buy at the pre-specified price and then wait for the price to rise above that level and then sell the position (and vice versa with shorting or hedging).
FEATURES
Grids: This algorithm has a total of 10 grids.
Take profit: The trader can increase or decrease the distance between the grids from the User Interface panel, the distance between one grid and another represents the take profit.
Management: The algorithm buys 10% of the capital every time the price breaks down a grid and sells during a rise to the next higher grid. The initial capital is invested in 10 sizes which represent 10% of the capital per trade.
Stop Loss: The algorithm knows no stop loss as long as it is not activated from the User Interface panel. By activating the stop loss from the User Interface panel the algorithm will insert a close condition on all trades which will be calculated from the last lower grid.
Trades: Trades are opened only if the price is within the grid. If the market leaves the grid the algorithm will not buy new positions or sell new positions.
Optimal market conditions: The favorable market for this algorithm is the sideways market.
LIMITATIONS OF THE MODEL
The trader must take into account that this is a static model. It only works perfectly well if the market is in a sideways phase and incurs heavy losses if the market takes a downward trend. The model is unusable for an uptrend. The trader must therefore carefully analyze the market where he intends to use this strategy, making sure that the price is in a sideways phase.
USES
Indispensable research and backtesting tool for those using bots for their investments. The algorithm produces a backtesting of the strategy for past history. It is used by professional traders to understand if this strategy has been profitable on a market and what parameters to use for bots using this strategy (Kucoin, Binance etc.).
If you would like to develop your own algorithm with customized conditions based on a grid strategy, please contact us.
If you need help in using this tool, please contact us without hesitation.

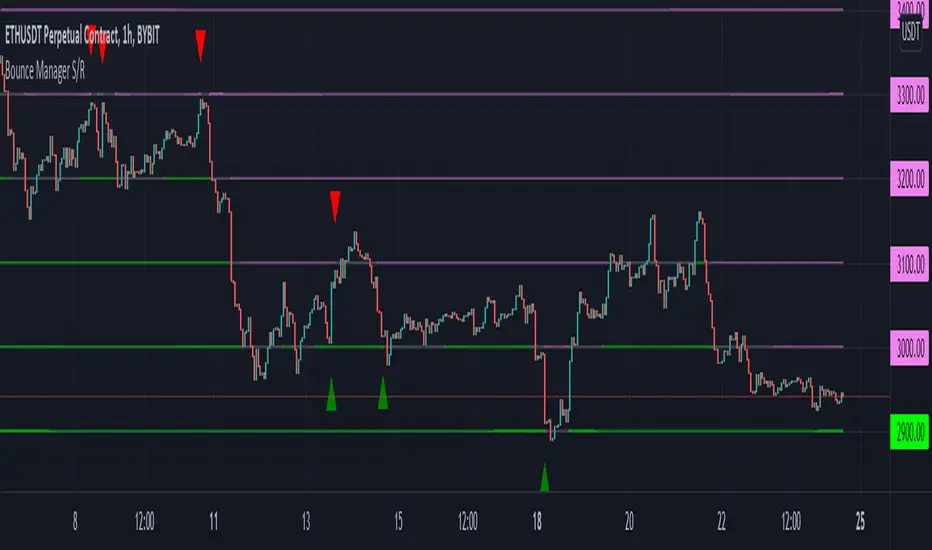
Bounce Manager S/RThis script is based on the bounce manager ATR script
The S/R script is made for manual input of horizontal S/R lines, the script will then see if price respects these levels by the parameters you input in settings panel. On a respectable bounce it will print buy/sell arrows. The script also has functionality to send alerts, this is helpful if you want to automate S/R lines.
An easy strategy to use would be the one you see in the preview using a grid of round numbers. This script in no way shape or form promises easy gains and like all algorithms should be forward tested on a paper trading account before using real money.
components:
- Max violation: When price moves past this the script will no longer look for entry until a new trend has been established. The line can also be used as a stop loss.
- Confirmation line: When price touches the line during a trend it
will wait to cross over this line to confirm a reaction from the line.
- Min past distance: A trend filtering system, this is a distance from
the line price has to break to confirm trend direction.
- Stop loss: This can be set to a percentage distance from the low after
bounce. Or it can be set to the max violation line
- Take profit: This can be a fixed take profit target or a risk to reward
based take profit. With risk to reward it will multiply the stop loss
distance by the input and use that to create target (green cross)
- ATR based or % based: there are 2 versions of the script, one for strict
percentage based logic and another one based on ATR values
Part of the Honest Algo service.
Bollinger Bands Strategy with StopLossThis is the default Bollinger Bands Strategy with a small change to support Stop Loss.
The default built-int BBS does not support Stop Loss and using it may cause large losses, specially in margin trading.
Added inputs:
Source
Stop Loss Percentage
[Wantrader] Volatility Breakout Strategy V3This is the Wantrader's volatility breakthrough version 9,
which developed Larry Williams' volatility breakthrough strategy.
The following elements are included.
- Entry : Enter the market price, calculated by the volatility (TR) * ratio (K) of the previous day.
- Exit : Based on the selected time frame, closing the closing price, closing the market price,
- Stop loss: When it breaks through the entry price and buys, returns to the market price (the previous day's closing price) and changes to bear candle, stop loss.
- Long/short comparison: When short version is selected, it shows the result of short instead of long.
This strategy is a low-level strategy.
When used in practice, it can be stronger and more compliant than expected, but it is not smart.
I recommend you to develop a more hidden edge and use it as a drawing paper to create your own strategy.
Through the option settings,
I'll check if it's right for my first salary or at different times.
It will be an opportunity to think about why there is a difference in profits between Long and Short.
Also, the result shows the big difference between having and not having a loss.
I hope it will be an opportunity to break the relationship in the future.
========================================================================================
래리윌리엄스의 변동성돌파전략을 발전시킨
원트레이더 변동성돌파 버전3 입니다.
아래 요소가 포함되어있습니다.
- 진입 : 전일변동성(TR) * 비율(K) 로 계산한 진입가에, 시장가 진입
- 청산 : 선택한 타임프레임 기준으로 종가에, 시장가 청산
- 손절 : 진입가 돌파하여 매수 후, 당일 시가(전일 종가)로 돌아와서 음봉으로 바뀔때 손절
- 롱/숏 비교 : 숏버전을 선택하면 롱대신 숏으로만 처리한 결과를 보여줌
본 전략은 레벨이 낮은 전략으로
실전에서 사용 시 생각보다 강건하고 준수할 순 있으나 스마트하진 못합니다.
더 숨겨진 엣지를 개발하여 자신만의 전략을 만들기 위한 도화지 처럼 사용하시길 추천드립니다.
옵션 설정을 통해
일봉에서 잘 맞는지 다른 시간대에서 맞는지 등을 확인하고
롱과 숏의 수익의 차이는 왜 나는 것인지 고민해보는 계기가 될 것입니다.
또한 손절이 있는 것과 없는 것의 큰 차이를 결과로 확인하여
앞으로 반드시 손절을 넣게 되는 계기가 되길 기원합니다.
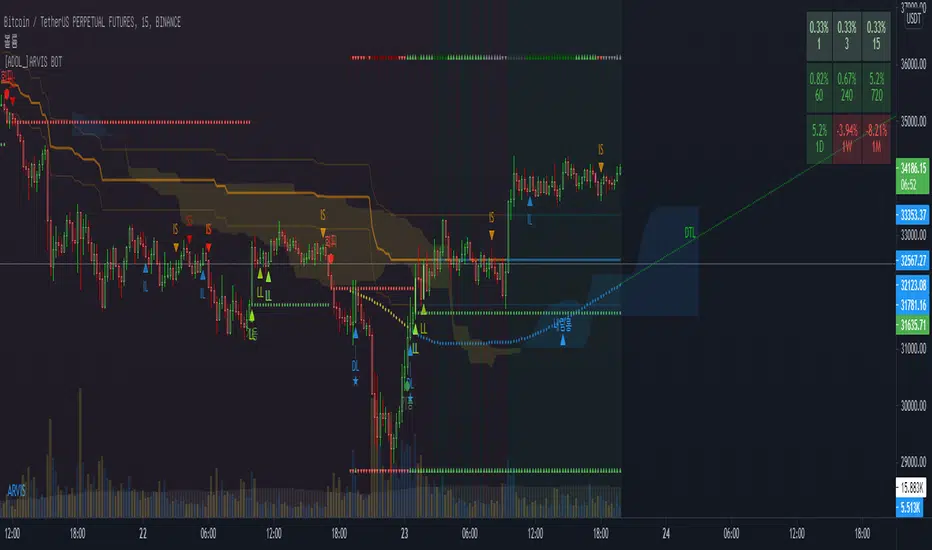
[ADOL_]ARVIS 3ENG) This is version 3 of ARVIS BOT. ARVIS 3
Since it is a new version with a completely different identity from Trend Break, we do not use the name Trend Break.
It is a version made lighter in the existing version and newly created logic.
Existing ARVIS users can use versions 1, 2, 3 and 3R auxiliary tools to be added without additional rights.
Optional use is possible.
principle)
Features of the new core logic:
It was created considering the relative strength RSI and the ICHIMOKU moving average.
Identify the trend strength to generate a long and short reversal signal at the reversal of the trend.
By using HTF signal, it is possible to bring the signal of the upper time to the smaller time.
By using HTF, the candle splits and the standard maintains the flow of time.
A method was used to reduce the whipsaw of frequent signal appearances.
option)
A volatility warning notification has been included. A function that alerts you before volatility increases.
It is indicated in the form of ■ at the bottom of the chart.
You can optionally set the signal range.
Dynamic Fibonacci moving along the candlestick was applied. 0.5 is used as a criterion for determining a large trend.
By combining the RSI and the moving average, you can apply a background that utilizes the RSI as a sensitivity.
By combining RSI and Stochastic, the overbought/oversold section was output as the background.
You can output overbought/oversold at the desired time as a background.
Up/down divergence included as background.
Black is downward divergence and white is upward divergence.
In the lower right corner, an indicator for the probability of a long is added by combining the multiple moving averages and the figures analyzed for the convergence trend.
50% is used as a reference point for long/short conversion, 10~20% is considered oversold section, and 80~90% is considered overbought section.
It can be used as a reference point for counter-trend trading. Probability indicators allow you to increase your judgment with visualized numbers.
principle example)
time frame)
Recommended time frame: 15-minute peaks >> 1-hour peaks > 1.3-minute peaks = 4 hour peaks = daily
alarm)
Various alert functions are available. based on the alert signal
When trading, various signals help to set specific conditions.
- HTF Long Short , Alert
- Volatility warning alert
- Basic long and short alerts
- Up/down divergence alert
trading method)
1. Utilize SIGNAL1 L,S signals. It is a similar approach to the existing manual bot mode.
2.SIGNAL2's , signals can bring high-time signals to buy and sell. This is a similar approach to the existing autobot mode.
If you bring a high time signal to a small time, you can refine the hit point, so in this case, use SIGNAL2 of 15 minutes or longer.
SIGNAL2 15-minute view at 3-minute peak, SIGNAL 1 hour view at 15-minute peak, and SIGNAL 4 hour view at 1-hour peak are recommended values.
3-1. Entry criteria/stop loss criteria (when trading hands and bots)
- entry criteria; Follow the signal.
- Stop loss criteria;
Use fixed stop loss: Set 1% fixed stop loss section from signal generation. (% is set individually)
Use Candle Stop Loss: Set a stop loss when the low or high point of the signal generating bar collapses.
Use flow stop loss: Set the stop loss considering the flow of the wave.
3-2. Entry criteria/stop loss criteria (in case of signal-based bot trading)
- It is not recommended to use more than 3x magnification. The above entry requires manual intervention and risk management.
It switches every time the opposite signal appears after entering without setting the stop loss separately.
Example of using the 15-minute HTF signal in the 3-minute scale
4. Note
You are solely responsible for any trading decisions you make.
ARVIS 3R indicator will be updated. Required for use of ARVIS 3
This is an additional feature. It is created as an indicator at the bottom, not as a candle chart.
5. How to use
It is set to be available only to invited users. When invited,
Tap Add Indicator to Favorites at the bottom of the indicator.
If you click the indicator at the top of the chart screen and look at the left tab, there is a Favorites tab.
Add an indicator by clicking the indicator name in the Favorites tab.
KOR) ARVIS BOT의 3버전입니다. ARVIS 3
Trend Break와 정체성을 완전히 달리한 신버전이므로
더이상 Trend Break 의 명칭을 쓰지 않습니다.
기존버전을 경량화하고 로직을 새롭게 만든 버전입니다.
기존의 ARVIS 이용자는 추가 권한 없이 1,2,3버전과 추가될 3R보조도구의
선택 활용이 가능합니다.
원리)
새로운 핵심적인 로직의 기능 :
상대강도인 RSI와 ICHIMOKU 이평선을 고려하여 만들어졌습니다.
추세강도를 파악해 추세의 전환자리에서 롱과 숏의 전환 신호를 발생시키도록 합니다.
HTF신호를 이용하여 상위 시간의 신호를 작은 시간대로 가져올 수 있습니다.
HTF를 활용함으로써 캔들은 쪼개고 기준은 상위 시간의 흐름을 유지해
잦은 신호출현의 휩쏘를 줄이는 방법을 사용하였습니다.
옵션)
변동성 경고 알림이 포함되었습니다. 변동성이 커지기 전에 미리 알려주는 기능으로
차트하단에 ■ 형태로 표기됩니다.
시그널의 범위를 옵션으로 설정할 수 있습니다.
캔들을 따라 움직이는 동적 피보나치가 적용되었습니다. 0.5를 큰 추세 판단 기준으로 활용합니다.
RSI와 이평선을 결합하여 RSI를 민감도로 활용한 배경을 적용할 수 있습니다.
RSI와 스토캐스틱을 결합하여 과매수/과매도구간을 배경으로 출력하였습니다.
원하는 시간의 과매수/과매도를 배경으로 출력할 수 있습니다.
상승/하락 다이버전스가 배경으로 포함되었습니다.
검은색은 하락다이버전스, 흰색은 상승다이버전스입니다.
우측하단에 다중이평선과 수렴추세를 분석한 수치를 종합하여 롱의 확률에 대한 표시기가 추가되었습니다.
50%는 롱/숏의 전환 기준점으로 활용하며, 10~20%는 과매도 구간, 80~90%는 과매수 구간으로 간주하여
역추세 매매의 기준점으로 활용할 수 있습니다. 확률 표시기를 통해 가시화된 수치로 판단을 높일 수 있습니다.
원리 예시)
타임프레임)
추천타임프레임 : 15분봉 >> 1시간봉 > 1,3분봉 = 4시간봉 = 일봉
알람)
다양한 얼러트 기능을 사용할 수 있습니다. 얼러트 신호를 기반으로
매매시 다양한 신호는 구체적 조건 설정에 도움이 됩니다.
- HTF 롱숏🥵,🥶 얼러트
- 변동성 경고 얼러트
- 기본 롱,숏 얼러트
- 상승/하락 다이버전스 얼러트
매매방법)
1. SIGNAL1 L,S 신호를 활용합니다. 기존의 수동봇 모드와 비슷한 접근입니다.
2.SIGNAL2의 🥵,🥶 신호는 높은 시간의 신호를 가져와 매매할 수 있습니다. 기존의 자동봇 모드와 비슷한 접근입니다.
높은 시간대의 신호를 작은시간으로 가져오면 타점을 정교화 할 수 있으므로, 이와같은 경우 15분 이상의 SIGNAL2를 활용합니다.
3분봉에서 SIGNAL2 15분 보기, 15분봉에서 SIGNAL 1시간 보기, 1시간봉에서 SIGNAL 4시간 보기가 추천값입니다.
3-1. 진입기준/손절기준(손,봇 매매시)
- 진입기준; 시그널을 따릅니다.
- 손절기준;
고정손절가 이용 : 시그널 발생으로부터 1% 고정 손절가 구간을 설정합니다.(%는 개별로 설정)
캔들손절가 이용 : 시그널 발생봉의 저점이나 고점이 무너지면 손절을 설정합니다.
흐름손절가 이용 : 파동의 흐름을 고려하여 손절을 설정합니다.
3-2. 진입기준/손절기준(신호기반 봇 매매시)
- 3배율 이상을 권장하지 않습니다. 이상의 진입은 수동개입으로 리스크관리가 필요합니다.
손절가를 따로 설정하지 않고 진입후 반대신호가 뜰때마다 스위칭을 합니다.
3분봉에서 15분HTF 신호사용의 예시
4. 참고
귀하가 내리는 모든 거래 결정은 전적으로 귀하의 책임입니다.
ARVIS 3R 지표가 업데이트 예정입니다. ARVIS 3의 활용에 필요한
부가적인 기능입니다. 캔들차트가 아닌 하단의 지표로 생성됩니다.
5. 사용방법
초대된 사용자만 사용할 수 있도록 설정이 되어있습니다. 초대를 받을 경우,
지표 하단의 즐겨찾기에 인디케이터 넣기를 누릅니다.
차트화면 상단에 지표를 눌러서 왼쪽탭에 보면 즐겨찾기 탭이 있습니다.
즐겨찾기 탭에서 지표이름을 눌러서 지표를 추가합니다.

[ADOL_]Trend Break Pro ARVIS BOTENG) Trend Break Pro Version : ARVIS BOT
It automatically draws trend lines and signals signals based on sophisticated standards.
It is an indicator that can be used as a tool for trading. from scalping
It was made as an all-round player that can even use the swing.
It contains all the signals of a breakout of the basic trend line,
By applying a new logic, signals that are faster than the breakout point of the basic trend line and
I made it to produce a better value while catching the signal of the press.
principle)
Basic trendline features:
It reflects the concepts of HH and LL.
Trendlines are created using the basic construction method, connecting highs and highs and lows and lows.
The 3 candles prior to the breakout of the trend line are the triggers to create a ready-to-prepare base signal.
What is HH? It is an abbreviation of Higher High, which means to raise the high.
What is LL? An abbreviation of Lower Low, which means to lower the low.
Features of the new core logic:
This is a quick way to find a reversal of a trend, taking into account candle patterns, volume, and moving averages.
The candle pattern that is reversed when the trading volume increases and then disappears is processed by subdividing and digitizing the pattern.
generate a signal. At the turning point of the trend, it triggers a long and short reversal signal.
For trading volume, obv was utilized. Overlaid elements allow you to find signals that are slightly faster than the trend line.
What is obv? OBV = An abbreviation of On Balance Volume. It is a secondary indicator showing the cumulative total of trading volume.
The background is a notation of the section where the trend is reversing.
option)
The degree of freedom to set options according to scalping, single stroke, swing, and bot implementation is given.
A volatility warning notification has been included. The function of TD setup is included.
You can set the range of candles as an option. The backtesting value is printed.
The backtesting value is calculated as the average of the opening and closing prices.
Volatility warnings are displayed in yellow.
TD Setup: Numbers floating on the candle, in ascending and descending order (=sequence) from 1 to 9.
The reason for writing up to 9 is based on statistics, and the more fundamental principle is the theory of the Fibonacci sequence.
The Fibonacci sequence is the number in the golden ratio that makes up nature, 1.1.2.3.5.8.13.21.34.55.89...
The sum of the nth and n+1th numbers becomes n+2th.
A note on odds of winning. Even if the win rate is 33%, if the profit-loss stop-loss ratio is 3 to 1, the profit exceeds 2, so cumulative profits are generated.
In other words, it is decided by considering both the win rate and profit/loss ratio, not just the win rate. The logic of a short stop loss and a long profit trend is reflected.
time frame)
Applicable to any timeframe.
Scalping: 1 minute, 3 minute, 5 minute / Danta: 15 minute, 1 hour / Swing: 4 hour, daily
Recommended time frame: 3, 15 minutes
alarm)
Various alert functions are available. based on the alert signal
When trading, various signals help to set specific conditions.
- Basic long and short alerts
- Volatility warning alert
- Filtered long and short alerts
- Long and short alerts occur Next peak alerts
- Uptrend line, downtrend line breakout alert
- Alerts about bot start and end when bot is running
- Filtered uptrend line, downtrend line breakout alert
- Alerts for rising and falling 1 setup and rising and falling 9 setups respectively
trading method)
1. For the trend line breakout signal, when the signal overlaps more than 3 times, the breakout probability increases.
It reflects the concept below.
One touch of support/resistance: The first touch sees longs at support and shorts at resistance.
2 touches of support/resistance line: Confirm the position once more in the stage of building support/resistance line (compacting). We see longs at support and shorts at resistance.
3 touches of the ground/resistance line: This is a section with a high possibility of both directions.
Support/resistance line 4 (over) touch: Used as a breakout reference line. When breaking through, short at support and long at resistance.
When the support/resistance line breaks through the closing price, support becomes resistance and resistance becomes support.
2. Trade support/resistance lines using the trend line breakout and signal as an important reference bar.
example)
3-1. Entry criteria/stop loss criteria (when trading hands and bots)
- entry criteria; Follow the signal.
- Stop loss criteria;
Use fixed stop loss: Set 1% fixed stop loss section from signal generation. (% is set individually)
Use Candle Stop Loss: Set a stop loss when the low or high point of the signal generating bar collapses.
Use flow stop loss: Set the stop loss considering the flow of the wave.
3-2. Entry criteria/stop loss criteria (in case of signal-based bot trading)
- Approach with a low magnification (more than 10 times is not recommended) to prevent the risk of liquidation of the largest drop,
There is an opposite signal after entering without setting stop loss separately.
4. Note
You are solely responsible for any trading decisions you make.
5. How to use
It is set to be available only to invited users. When invited,
Tap Add Indicator to Favorites at the bottom of the indicator.
If you click the indicator at the top of the chart screen and look at the left tab, there is a Favorites tab.
Add an indicator by clicking the indicator name in the Favorites tab.
KOR) Trend Break Pro버전 : ARVIS BOT ; 아비스 봇 입니다.
추세선을 자동으로 작도해주며, 정교화된 기준으로 시그널을
발생시켜 매매에 도구로써 활용가능한 지표입니다. 스캘핑부터
스윙까지 활용가능한 올라운드 플레이어로 만들어졌습니다.
기본 추세선 돌파의 시그널들을 모두 포함하고 있으며,
새로운 로직을 적용하여 기본 추세선 돌파시점보다 빠른 신호와
눌림의 신호까지 잡아내면서, 더 나은 값을 산출하도록 만들었습니다.
원리)
기본 추세선 기능 :
HH와 LL의 개념을 반영합니다.
추세선은 고점과 고점, 저점과 저점을 잇는 기본 작도 방법으로 만들어집니다.
추세선 돌파의 3개 이전 캔들부터 신호발생으로 준비를 기본 시그널을 만듭니다.
HH란 ? Higher High의 약자로 고점을 높인다는 의미입니다.
LL란? Lower Low의 약자로 저점을 낮춘다는 의미입니다.
새로운 핵심적인 로직의 기능 :
추세의 반전을 빠르게 찾기 위한 방법으로 캔들패턴, 거래량, 이평선을 고려하여 만들어졌습니다.
거래량이 증가하다가 소멸하는 시점에서 반전되는 캔들패턴을 세분화하고 수치화하여 가공된
신호를 발생시킵니다. 추세의 전환자리에서 롱과 숏의 전환 신호를 발생시키도록 합니다.
거래량에는 obv가 활용되었습니다. 중첩된 요소들을 통해 추세선보다 조금 더 빠른 신호를 찾을 수 있습니다.
obv란 ? OBV = On Blance Volume의 약자로 거래량의 누적합계를 나타내는 보조지표 입니다.
배경은 추세가 전환되는 구간의 표기입니다.
옵션)
스캘핑과 단타, 스윙, 봇의 구현에 맞게 옵션을 설정할 수 있는 자유도를 부여하였습니다.
변동성 경고 알림이 포함되었습니다. TD셋업의 기능이 포함되었습니다.
캔들의 범위를 옵션으로 설정할 수 있습니다. 백테스팅 값이 출력됩니다.
백테스팅 값은 시가와 종가의 평균값으로 산출됩니다.
변동성경고는 yellow 컬러로 표기됩니다.
TD셋업 : 캔들위에 플로팅 되는 숫자로 1~9까지의 오름차순, 내림차순 (=시퀀스)으로 구성됩니다.
9까지 쓰는 이유는 통계기반, 좀 더 근본적인 원리는 피보나치 수열의 이론이 반영되어 있습니다.
피보나치 수열이란 자연을 이루는 황금비율의 숫자로 1.1.2.3.5.8.13.21.34.55.89...
n번째와 n+1번째 숫자의 합이 n+2번째가 됩니다.
원리 예시)
승률에 관한 참고사항. 승률이 33퍼센트의 승률이어도 3대 1의 익절 손절 비율이면 이익이 2를 넘어가니까 누적수익이 발생합니다.
즉, 승률과 손익비를 모두 고려해서 결정하는 것이지, 승률만 봐서는 안됩니다.
손절은 짧게, 수익은 추세대로 길게의 로직이 반영되어 있습니다.
타임프레임)
모든 시간프레임에 적용 가능합니다.
스캘핑 : 1분봉, 3분봉, 5분봉 / 단타 : 15분봉, 1시간봉 / 스윙 : 4시간봉, 일봉
추천타임프레임 : 3, 15분봉
5분봉)
15분봉)
4시간봉)
알람)
다양한 얼러트 기능을 사용할 수 있습니다. 얼러트 신호를 기반으로
매매시 다양한 신호는 구체적 조건 설정에 도움이 됩니다.
- 기본 롱,숏 얼러트
- 변동성 경고 얼러트
- 필터링된 롱,숏 얼러트
- 롱,숏 얼러트 발생 다음봉 얼러트
- 상승추세선, 하락추세선 돌파 얼러트
- 봇구동시 봇의 시작과 종료에 관한 얼러트
- 필터링된 상승추세선, 하락추세선 돌파 얼러트
- 상승,하락1셋업과 상승,하락9셋업 각각에 대한 얼러트
매매방법)
1. 추세선 돌파신호는 신호가 3번이상 중첩될시 돌파확률이 상승합니다.
아래 개념을 반영합니다.
지지/저항선 1터치 : 첫번째 터치에는 지지선에서 롱을, 저항선에서 숏을 봅니다.
지지/저항선 2터치 : 지지/저항선 구축(다지기)의 단계로 한번 더 자리를 확인합니다. 지지선에서 롱을, 저항선에서 숏을 봅니다.
지/저항선의 3터치 : 양방향의 가능성이 높은 구간입니다.
지지/저항선4(이상)터치 : 돌파기준선으로 사용합니다. 돌파할 때, 지지선에서 숏을, 저항선에서 롱을 칩니다.
지지/저항선이 종가로 뚫리면 지지는 저항이 되고, 저항은 지지가 됩니다.
2. 추세선돌파와 시그널이 발생한 봉을 중요한 기준봉으로 활용하여 지지/저항선 매매를 합니다.
예시)
3-1. 진입기준/손절기준(손,봇 매매시)
- 진입기준; 시그널을 따릅니다.
- 손절기준;
고정손절가 이용 : 시그널 발생으로부터 1% 고정 손절가 구간을 설정합니다.(%는 개별로 설정)
캔들손절가 이용 : 시그널 발생봉의 저점이나 고점이 무너지면 손절을 설정합니다.
흐름손절가 이용 : 파동의 흐름을 고려하여 손절을 설정합니다.
3-2. 진입기준/손절기준(신호기반 봇 매매시)
- 저배율(10배이상은 권장하지 않습니다)로 접근해 최대낙폭의 청산위험을 예방하며,
손절가를 따로 설정하지 않고 진입후 반대신호가 뜰때마다 스위칭을 합니다.
4. 참고
귀하가 내리는 모든 거래 결정은 전적으로 귀하의 책임입니다.
5. 사용방법
초대된 사용자만 사용할 수 있도록 설정이 되어있습니다. 초대를 받을 경우,
지표 하단의 즐겨찾기에 인디케이터 넣기를 누릅니다.
차트화면 상단에 지표를 눌러서 왼쪽탭에 보면 즐겨찾기 탭이 있습니다.
즐겨찾기 탭에서 지표이름을 눌러서 지표를 추가합니다.
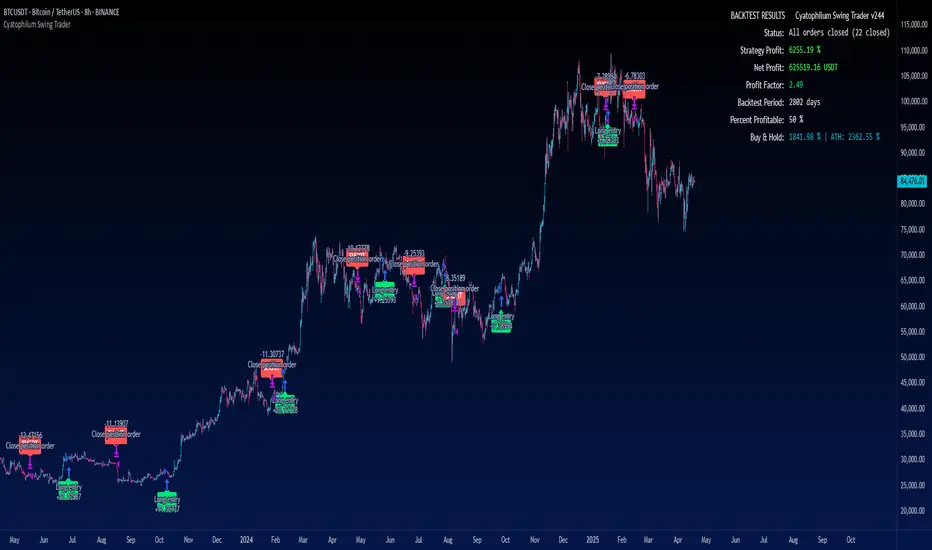
Cyatophilum Swing Trader [BACKTEST]This is an indicator for swing trading which allows you to build your own strategies, backtest and alert. This version is the backtest which allows to use the Strategy Tester. The alert version can be found in my profile scripts page.
The particularity of this indicator is that it contains several indicators, including a custom one, that you can choose in a drop down list, as well as a trailing stop loss and take profit system.
The current indicators are :
CYATO AI: a custom indicator inspired by Donchian Channels that will catch each big trend and important reversal points .
The indicator has two major "bands" or channels and two minor bands. The major bands are bigger and are always displayed.
When price reaches a major band, acting as a support/resistance, it will either bounce on it or break through it. This is how "tops" and "bottoms", and breakouts are caught.
The minor bands are used to catch smaller moves inside the major bands. A combination of volume, momentum and price action is used to calculate the signals.
Advantages of this indicator: it should catch top and bottoms better than other swing trade indicators.
Cons of this indicator: Some minor moves might be ignored. Sometimes the script will catch a fakeout due to the Bands design.
Best timeframes to use it : 2H~4H
Sample:
Other indicators available:
SARMA: A combination of Parabolic Stop and Reverse and Exponential Moving Average (20 and 40) .
SAR: Regular Parabolic Stop and Reverse .
QQE: An indicator based on Quantitative Qualitative Estimation .
SUPERTREND: A reversal indicator based on Average True Range .
CHANNELS: The classic Donchian Channels .
More indicators might be added in the future.
About the signals: each entry (long & short) is calculated at bar close to avoid repainting. Exits (SL & TP) can either be intra-bar or at bar close using the Exit alert type parameter.
STOP LOSS SYSTEM
The base indicators listed above can be used with or without TP/SL.
TP and SL can be both turned on and off and configured for both directions.
The system can be configured with 3 parameters as follows:
Stop Loss Base % Price: Starting Value for LONG/SHORT stop loss
Trailing Stop % Price to Trigger First parameter related to the trailing stop loss. Percentage of price movement in the right direction required to make the stop loss line move.
Trailing Stop % Price Movement: Second parameter related to the trailing stop loss. Percentage for the stop loss trailing movement.
Another option is the "Reverse order on Stop Loss". Use this if you want the strategy to trigger a reverse order when a stop loss is hit.
TAKE PROFIT SYSTEM
The system can be configured with 2 parameters as follows:
Take Profit %: Take profit value in percentage of price.
Trailing Profit Deviation %: Percent deviation for the trailing take profit.
Combining indicators and Take Profit/Stop Loss
One thing to note is that if a reversal signal triggers during a trade, the trade will be closed before SL or TP is reached.
Indeed, the base indicators are reversal indicators, they will trigger long/short signals to follow the trend.
It is possible to use a takeprofit without stop loss, like in this example, knowing that the signal will reverse if the trade goes badly.
The base indicators settings can be changed in the "Advanced Parameters" section.
Configuration used for this snapshot:
BACKTEST SETTINGS
· Initial Capital: 10 000 $
· Order Size: 10% equity (to avoid compounding effect)
· Commission : 0.1% per order (total commission paid: 244.41 €)
· Slippage: 5 ticks
Oldest trade: 2014-04-01
Backtest Period: From 2014-04-01 to 2020-09-04
Use the link below to obtain access to this indicator.
Two Take Profit StrategyThis script is for research purposes only. I am not a financial advisor.
Entry Condition
This strategy is based on two take profit targets and scaling out strategy. The entry rule is very simple. Whenever the EMA crossover WMA, the long trade is taken and vice versa.
Take Profit and Stop Loss
The first take profit is set at 20 pips above the long entry and the second take profit is set at 40 pips above the long entry. Meanwhile, the stop loss is set at 20 pips below the long entry.
Money Management
When the first take profit is achieved, half of the position is closed. The rest of the position is open to achieve either second take profit or stop loss.
There are three outcomes when using this strategy. Let's say you enter the trade with 200 lot size and you are risking 2% of your equity.
1. The first outcome is when the price hits stop loss, you lose the entire 2%.
2. The second outcome is when the price hits the first take profit and you close half of your position. Meaning that you have gained 1%. Then you let the trade running and eventually it hits stop loss. The total loss is 0% because the remaining lot size which is 200/2=100 times by 20pips is 1%. You have gained the earlier 1% and then loss 1%. At this point, you are at break even.
3. The third outcome is similar to the second out but instead of hiring stop loss, the trade is running to your favor and hits the second take profit.
Therefore, you gained 1% from the first take profit and you gained another 2% for the second take profit. Your total gained is 3%
Summary
The reason behind this strategy is to minimize risk. with normal strategy, you only have two outcomes which are either win or loss. With this strategy, you have three outcomes which are win, loss or break even.

TrendMaster FreeTrendMaster Free
This is the free version of TrendMaster. It includes the Cloud and the candle colouring rules but does not provide the entry, exit and stop loss management of the full version.
TrendMaster is a complete trend following system with strict entry, exit and trade management criteria. The indicator is optimised for weekly, daily and 4-hour candlesticks and can be used for all trending markets such as crypto, forex or stocks. It was developed primarily for less experienced traders that struggle to determine relevant information from irrelevant information when viewing a candlestick chart. The indicator was built to solve the problem that all new traders face.
The Cloud
The indicator includes a moving average cloud which serves as a visual guide to local support and resistance . When price exits the cloud to the upside it typically trends above and finds support at the cloud during retracements.
Candle Colours
By default, TrendMaster will colour your candles in black and white. White candles indicate an uptrend in an asset and the candles will not change colour until the trend has reversed and a counter-trend signal has been printed. Black candles indicate a downtrend, they will remain black until a counter-trend long signal candle has been printed.
Setting Up The Indicator
TrendMaster is optimised for Heikin-Ashi candles. Using candles with smoothing applied decreases the likelihood of whipsaw losses and provides a stable visual representation of the trend. Ensure you have applied Heikin-Ashi candles to your chart before continuing. You can customise to any style of your choice provided the candle borders and wicks are set to a uniform colour that contrasts the chart background.
Entries and Exits
A long signal candle is a white Heikin-Ashi candle that closes above the cloud. A short signal candle is a white Heikin-Ashi candle that closes below the cloud. Entries are taken with a pending order placed at the wick with a reasonable margin for error.
Upgrading
The full version of TrendMaster contains significantly more functionality including coloured signal candles, stop loss and trailing take profit management, alerts and much more.
Our Story
Founded in 2018 by IchimokuScholar and C00kie, TrendMaster is a team that produces technical analysis indicators with an emphasis on simplicity and noise reduction. We support a large community with educational content, automated market scanners and mentoring in our private chat rooms. We produce technical analysis indicators geared primarily towards the emerging Cryptocurrency asset class. We provide educational material to assist trader development and host a large online trend following community. All of our products are designed to help traders distinguish relevant information from background noise. Our indicators encourage disciplined trade management to maximise the opportunity captured while minimising losses.
IchimokuScholar
IchimokuScholar – In 2017 I retired from a career in higher education to focus on Trading. I like to trade long term trends, focusing primarily on continuation setups. I am dedicated to sharing my knowledge of trading and take great pleasure in simplifying technical analysis for newer traders.
C00kie
I started trading crypto in 2017 and immediately started coding a bunch of tools to improve my quality of life. Some definitely worked out better than others. Like to trade the higher timeframes and drawing horizontal lines on charts. I am also pretty much obligated to like cookies.
