4 EMA with Two Timeframes and Supertrend by Natee L.Key Features:
Customizable Timeframes:
The script has two inputs (timeframe_1 and timeframe_2) where you can select the timeframes for the two sets of EMAs. For example, you could choose:
timeframe_1 = "60" for 1-hour (60-minute) EMAs.
timeframe_2 = "240" for 4-hour (240-minute) EMAs.
Four EMAs for Each Timeframe:
It calculates 4 EMAs for both the first timeframe (timeframe_1) and the second timeframe (timeframe_2).
Plotting:
The EMAs for timeframe 1 are plotted in solid colors (blue, red, green, and purple).
The EMAs for timeframe 2 are plotted with a transparent effect (using color.new), so they are visually distinct but less dominant than the first timeframe's EMAs.
How to Use:
The timeframe_1 and timeframe_2 inputs allow you to select any timeframes you prefer (e.g., "15", "30", "60", "D", "W", etc.).
The EMAs for both selected timeframes will be plotted, allowing for easy comparison between the two timeframes on the same chart.
Explanation of the Updates:
Supertrend Calculation:
The Supertrend is calculated using the ta.supertrend function, which requires two parameters:
multiplier: The multiplier used for the Average True Range (ATR) calculation.
atr_period: The period for the ATR (usually set to 14).
The supertrend variable represents the value of the Supertrend, and direction is a boolean value indicating whether the trend is up (green) or down (red).
Supertrend Plot:
The Supertrend is plotted on the chart using the plot() function. The color is determined by the direction variable:
Green if the trend is up.
Red if the trend is down.
The Supertrend line is drawn with a linewidth of 2 for visibility.
Inputs:
atr_period: The period used for the ATR calculation, typically 14.
multiplier: The multiplier for the ATR to determine the offset for the Supertrend line.
How It Works:
The 4 EMAs are calculated for both timeframes (timeframe_1 and timeframe_2), just like before.
The Supertrend is calculated based on the ATR and the multiplier parameters, and it's plotted on the main chart.
The Supertrend changes color based on the trend direction (green for an uptrend, red for a downtrend).
Customization:
You can adjust the ATR period and multiplier as needed via the input fields.
You can also adjust the timeframes (timeframe_1 and timeframe_2) for the EMAs.
This script now combines the 4 EMAs and Supertrend indicators for two different timeframes, giving you a powerful tool for trend analysis and crossover strategies.
Search in scripts for "supertrend"

Volume Weighted SuperTrend | QuantumResearchQuantumResearch Volume Weighted Supertrend (VWST)
The Volume Adaptive Supertrend (VWST) is a dynamic trend-following tool that enhances traditional Supertrend calculations by incorporating volume-weighted market conditions.
This indicator adapts its trend signals based on volume-adjusted price action, allowing traders to refine their entries and exits with improved responsiveness. 🚀📊
1. Key Features
Volume-Weighted Adaptation: Uses various moving averages (VWMA, EMA, SMA, etc.) to adjust ATR bands based on market activity.
Customizable Trend Sensitivity: Adjusts ATR multipliers separately for bullish and bearish conditions.
Adaptive Supertrend Calculation: Dynamically recalculates trend direction based on volume-enhanced price movements.
Multi-Timeframe Compatibility: Can be applied across different assets and timeframes for versatile market analysis.
Visual Clarity & Alerts: Color-coded trend signals, shaded areas, and real-time alerts for trend shifts.
2. How It Works
A. Volume-Weighted Price Calculation
The indicator applies a user-selected moving average (EMA, VWMA, SMA, etc.) to price and volume data
This ensures that trend calculations are more reactive to strong volume surges and less influenced by low-liquidity fluctuations.
B. Adaptive ATR-Based Trend Filtering
ATR bands are dynamically adjusted based on volume-weighted price action.
Separate ATR multipliers for bullish and bearish conditions allow for refined sensitivity control.
The Supertrend line shifts dynamically to reflect these conditions.
C. Signal Generation
Bullish Trend: The price closes above the adaptive Supertrend line. ✅
Bearish Trend: The price closes below the adaptive Supertrend line. ❌
Long Entry: Triggered when trend direction switches from bearish to bullish.
Short Entry: Triggered when trend direction switches from bullish to bearish.
3. Visual Representation
A. Color-Coded Trend Signals
Green Trend Line: Indicates a bullish trend.
Red Trend Line: Indicates a bearish trend.
Gray Trend Line: Neutral phase.
B. Dynamic Background Fill
Shaded Green Areas: Confirmed uptrend zones.
Shaded Red Areas: Confirmed downtrend zones.
4. Customization & Parameters
ATR Length & Multipliers: Adjust trend sensitivity with separate multipliers for bullish and bearish phases.
Moving Average Type: Select from VWMA, EMA, SMA, HMA, WMA, DEMA, TEMA for volume-weighted calculations.
Volume Length: Modify how far back volume data is used to refine trend calculations.
Color Themes: Choose from 8 distinct color modes for clear visual representation.
5. Backtest & Market Applications
Backtest Summary :
The Volume Adaptive Supertrend (VWST) has been tested across multiple assets, including:
BTC/USD
ETH/USD
SOL/USD
📊 Key Observations:
Responsive Trend Detection: The volume-weighted adaptation helps minimize lag in trend shifts.
Versatile Across Market Conditions: Works well in both trending and consolidating phases with appropriate settings.
Customizable Risk Control: ATR multipliers can be adjusted to fine-tune signal sensitivity.
⚠️ Disclaimer: This indicator is designed to complement existing analysis techniques . Market conditions vary, and no tool can guarantee future performance. Always use proper risk management when trading.
6. Final Thoughts
The Volume Weighted Supertrend (VWST) enhances traditional Supertrend indicators by incorporating volume-adjusted trend detection.
Its dynamic ATR-based trend filtering ensures greater responsiveness to real market conditions.
Suitable for trend traders, breakout traders, and risk-conscious investors looking for volume-driven confirmations.
Use it alongside other confluences to build a robust trading system.
Important Reminder: No single indicator guarantees profitability. Always validate signals with additional market context. 📊
Multi-Timeframe Supertrend Dashboard - EnhancedOverview
The Multi-Timeframe Supertrend Dashboard is a powerful tool designed to give traders a clear view of market trends across multiple timeframes, all from a single dashboard. This indicator leverages the Supertrend method to calculate buy and sell signals based on the direction of price relative to dynamically calculated support and resistance lines. The dashboard is optimized for dark mode and provides easy-to-interpret color-coded signals for each timeframe.
How It Works
The Supertrend indicator is a trend-following indicator that uses the Average True Range (ATR) to set upper and lower bands around the price, adapting dynamically as volatility changes. When the price is above the Supertrend line, the market is considered in an uptrend, triggering a "BUY" signal. Conversely, when the price falls below the Supertrend line, the market is in a downtrend, triggering a "SELL" signal.
This Multi-Timeframe Supertrend Dashboard calculates Supertrend signals for the following timeframes:
1 minute
5 minutes
15 minutes
1 hour
Daily
Weekly
Monthly
For each timeframe, the dashboard shows either a "BUY" or "SELL" signal, allowing traders to assess whether trends align across timeframes. A "BUY" signal displays in green, and a "SELL" signal displays in red, giving a quick visual reference of the overall trend direction for each timeframe.
Customization Options
ATR Period: Defines the period for the Average True Range (ATR) calculation, which determines how responsive the Supertrend lines are to changes in market volatility.
Multiplier: Sets the sensitivity of the Supertrend bands to price movements. Higher values make the bands less sensitive, while lower values increase sensitivity, allowing quicker reactions to changes in price.
How to Interpret the Dashboard
The Multi-Timeframe Supertrend Dashboard allows traders to see at a glance if trends across multiple timeframes are aligned. Here’s how to interpret the signals:
BUY (Green): The current timeframe’s price is in an uptrend based on the Supertrend calculation.
SELL (Red): The current timeframe’s price is in a downtrend based on the Supertrend calculation.
For example:
If all timeframes display "BUY," the asset is in a strong uptrend across multiple time horizons, which may indicate a bullish market.
If all timeframes display "SELL," the asset is likely in a strong downtrend, signaling a bearish market.
Mixed signals across timeframes suggest market consolidation or differing trends across short- and long-term periods.
Use Cases
Trend Confirmation: Use the dashboard to confirm trends across multiple timeframes before entering or exiting a position.
Quick Market Analysis: Get a snapshot of market conditions across timeframes without having to change charts.
Multi-Timeframe Alignment: Identify alignment across timeframes, which is often a strong indicator of market momentum in one direction.
Dark Mode Optimization
The dashboard has been optimized for dark mode, with white text and contrasting background colors to ensure easy readability on darker TradingView themes.

Hyperbolic Tangent SuperTrend [InvestorUnknown]The Hyperbolic Tangent SuperTrend (HTST) is designed for technical analysis, particularly in markets with assets that have lower prices or price ratios. This indicator leverages the Hyperbolic Tangent Moving Average (HTMA), a custom moving average calculated using the hyperbolic tangent function, to smooth price data and reduce the impact of short-term volatility.
Hyperbolic Tangent Moving Average (HTMA):
The indicator's core uses a hyperbolic tangent function to calculate a smoothed average of the price. The HTMA provides enhanced trend-following capabilities by dampening the impact of sharp price swings and maintaining a focus on long-term market movements.
The hyperbolic tangent function (tanh) is commonly used in mathematical fields like calculus, machine learning and signal processing due to its properties of “squashing” inputs into a range between -1 and 1. The function provides a non-linear transformation that can reduce the impact of extreme values while retaining a certain level of smoothness.
tanh(x) =>
e_x = math.exp(x)
e_neg_x = math.exp(-x)
(e_x - e_neg_x) / (e_x + e_neg_x)
The HTMA is calculated by taking the difference between the price and its simple moving average (SMA), applying a multiplier to control sensitivity, and then transforming it using the hyperbolic tangent function.
htma(src, len, mul) =>
tanh_src = tanh((src - ta.sma(src, len)) * mul) * ta.stdev(src, len) + ta.sma(src, len)
htma = ta.sma(tanh_src, len)
Important Note: The Hyperbolic Tangent function becomes less accurate with very high prices. For assets priced above 100,000, the results may deteriorate, and for prices exceeding 1 million, the function may stop functioning properly. Therefore, this indicator is better suited for assets with lower prices or lower price ratios.
SuperTrend Calculation:
In addition to the HTMA, the indicator includes an Average True Range (ATR)-based SuperTrend calculation, which helps identify uptrends and downtrends in the market. The SuperTrend is adjusted dynamically using the HTMA to avoid false signals in fast-moving markets.
The ATR period and multiplier are customizable, allowing users to fine-tune the sensitivity of the trend signals.
pine_supertrend(src, calc_price, atrPeriod, factor) =>
atr = ta.atr(atrPeriod)
upperBand = src + factor * atr
lowerBand = src - factor * atr
prevLowerBand = nz(lowerBand )
prevUpperBand = nz(upperBand )
lowerBand := lowerBand > prevLowerBand or calc_price < prevLowerBand ? lowerBand : prevLowerBand
upperBand := upperBand < prevUpperBand or calc_price > prevUpperBand ? upperBand : prevUpperBand
int _direction = na
float superTrend = na
prevSuperTrend = superTrend
if na(atr )
_direction := 1
else if prevSuperTrend == prevUpperBand
_direction := calc_price > upperBand ? -1 : 1
else
_direction := calc_price < lowerBand ? 1 : -1
superTrend := _direction == -1 ? lowerBand : upperBand
Inbuilt Backtest Mode:
The HTST includes an inbuilt backtest mode that enables users to test the indicator's performance against historical data, similar to TradingView strategies.
The backtest mode allows you to compare the performance of different indicator settings with a simple buy and hold strategy to assess its effectiveness in different market conditions.
Hint Table for Display Modes:
The indicator includes a Hint Table that recommends the best pane to use for different display modes. For example, it suggests using the "Overlay" mode in the same pane as the price action, while the "Backtest Mode" is better suited for a separate pane. This ensures a more organized and clear visual experience.
The Hint Table appears as a small table at the bottom of the chart with easy-to-follow recommendations, ensuring the best setup for both visual clarity and indicator functionality.
With these features, the Hyperbolic Tangent SuperTrend Indicator offers traders a versatile and customizable tool for analyzing price trends while providing additional functionalities like backtesting and display mode hints for optimal usability.
Alxuse Supertrend 4EMA Buy and Sell for tutorialAll abilities of Supertrend, moreover :
Drawing 4 EMA band & the ability to change values, change colors, turn on/off show.
Sends Signal Sell and Buy in multi timeframe.
The ability used in the alert section and create customized alerts.
To receive valid alerts the replay section , the timeframe of the chart must be the same as the timeframe of the indicator.
Supertrend with a simple EMA Filter can improve the performance of the signals during a strong trend.
For detecting the continuation of the downward and upward trend we can use 4 EMA colors.
In the upward trend , the EMA lines are in order of green, blue, red, yellow from bottom to top.
In the downward trend, the EMA lines are in order of yellow, red, blue, green from bottom to top.
How it works:
x1 = MA1 < MA2 and MA2 < MA3 and MA3 < MA4 and ta.crossunder(MA3, MA4)
x2 = MA1 < MA2 and MA2 < MA3 and MA3 < MA4 and ta.crossunder(MA2, MA3)
x3 = MA1 < MA2 and MA2 < MA3 and MA3 < MA4 and ta.crossunder(MA1, MA2)
y1 = MA4 < MA3 and MA3 < MA2 and MA2 < MA1 and ta.crossover(MA3, MA4)
y2 = MA4 < MA3 and MA3 < MA2 and MA2 < MA1 and ta.crossover(MA2, MA3)
y3 = MA4 < MA3 and MA3 < MA2 and MA2 < MA1 and ta.crossover(MA1, MA2)
Red triangle = x1 or x2 or x3
Green triangle = y1 or y2 or y3
Long = BUY signal and followed by a Green triangle
Exit Long = SELL signal
Short = SELL signal and followed by a Red triangle
Exit Short = BUY signal
It is also possible to get help from the Stochastic RSI and MACD indicators for confirmation.
For receiving a signal with these two conditions or more conditions, i am making a video tutorial that I will release soon.
Supertrend
Definition
Supertrend is a trend-following indicator based on Average True Range (ATR). The calculation of its single line combines trend detection and volatility. It can be used to detect changes in trend direction and to position stops.
The basics
The Supertrend is a trend-following indicator. It is overlaid on the main chart and their plots indicate the current trend. A Supertrend can be used with varying periods (daily, weekly, intraday etc.) and on varying instruments.
The Supertrend has several inputs that you can adjust to match your trading strategy. Adjusting these settings allows you to make the indicator more or less sensitive to price changes.
For the Supertrend inputs, you can adjust atrLength and multiplier:
the atrLength setting is the lookback length for the ATR calculation;
multiplier is what the ATR is multiplied by to offset the bands from price.
When the price falls below the indicator curve, it turns red and indicates a downtrend. Conversely, when the price rises above the curve, the indicator turns green and indicates an uptrend. After each close above or below Supertrend, a new trend appears.
Summary
The Supertrend helps you make the right trading decisions. However, there are times when it generates false signals. Therefore, it is best to use the right combination of several indicators. Like any other indicator, Supertrend works best when used with other indicators such as MACD, Parabolic SAR, or RSI.
Exponential Moving Average
Definition
The Exponential Moving Average (EMA) is a specific type of moving average that points towards the importance of the most recent data and information from the market. The Exponential Moving Average is just like it’s name says - it’s exponential, weighting the most recent prices more than the less recent prices. The EMA can be compared and contrasted with the simple moving average.
Similar to other moving averages, the EMA is a technical indicator that produces buy and sell signals based on data that shows evidence of divergence and crossovers from general and historical averages. Additionally, the EMA tries to amplify the importance that the most recent data points play in a calculation.
It is common to use more than one EMA length at once, to provide more in-depth and focused data. For example, by choosing 10-day and 200-day moving averages, a trader is able to determine more from the results in a long-term trade, than a trader who is only analyzing one EMA length.
It’s best to use the EMA when for trending markets, as it shows uptrends and downtrends when a market is strong and weak, respectively. An experienced trader will know to look both at the line the EMA projects, as well as the rate of change that comes from each bar as it moves to the next data point. Analyzing these points and data streams correctly will help the trader determine when they should buy, sell, or switch investments from bearish to bullish or vice versa.
Short-term averages, on the other hand, is a different story when analyzing Exponential Moving Average data. It is most common for traders to quote and utilize 12- and 26-day EMAs in the short-term. This is because they are used to create specific indicators. Look into Moving Average Convergence Divergence (MACD) for more information. Similarly, the 50- and 200-day moving averages are most common for analyzing long-term trends.
Moving averages can be very useful for traders using technical analysis for profit. It is important to identify and realize, however, their shortcomings, as all moving averages tend to suffer from recurring lag. It is difficult to modify the moving average to work in your favor at times, often having the preferred time to enter or exit the market pass before the moving average even shows changes in the trend or price movement for that matter.
All of this is true, however, the EMA strives to make this easier for traders. The EMA is unique because it places more emphasis on the most recent data. Therefore, price movement and trend reversals or changes are closely monitored, allowing for the EMA to react quicker than other moving averages.
Limitations
Although using the Exponential Moving Average has a lot of advantages when analyzing market trends, it is also uncertain whether or not the use of most recent data points truly affects technical and market analysis. In addition, the EMA relies on historical data as its basis for operating and because news, events, and other information can change rapidly the indicator can misinterpret this information by weighting the current prices higher than when the event actually occurred.
Summary
The Exponential Moving Average (EMA) is a moving average and technical indicator that reflects and projects the most recent data and information from the market to a trader and relies on a base of historical data. It is one of many different types of moving averages and has an easily calculable formula.
The added features to the indicator are made for training, it is advisable to use it with caution in tradings.

Trailing Stop Loss SuperTrendThe Trailing Stop Loss SuperTrend indicator is a popular technical analysis tool used by traders to identify trends and determine optimal entry and exit points in financial markets. This indicator combines elements of the SuperTrend indicator and trailing stop loss orders to provide valuable insights into market trends and potential reversals. By incorporating Average True Range (ATR) calculations, it adapts to market volatility, making it suitable for various trading strategies. Let's explore the key use cases and benefits of the Trailing Stop Loss SuperTrend indicator:
Trend Identification:
The primary purpose of the Trailing Stop Loss SuperTrend indicator is to identify market trends. It plots two lines on the chart: an upper band (referred to as the "up" line) and a lower band (referred to as the "dn" line). The direction of these bands helps traders determine the prevailing trend. When the price is above the upper band, it suggests a bullish trend, and when it is below the lower band, it indicates a bearish trend.
Entry and Exit Signals:
The Trailing Stop Loss SuperTrend indicator generates entry and exit signals based on trend changes. When the trend changes from bearish to bullish, a buy signal is triggered, indicating a potential entry point. Conversely, when the trend changes from bullish to bearish, a sell signal is generated, suggesting a possible exit or short-selling opportunity. These signals can be used in conjunction with other trading strategies or indicators to enhance trading decisions.
Trailing Stop Loss Orders:
One of the distinguishing features of the Trailing Stop Loss SuperTrend indicator is its ability to incorporate trailing stop loss orders. Traders can use the indicator's upper and lower bands as trailing stop levels to protect profits and manage risk. For example, in a bullish trend, the stop loss level can be set at the lower band, and as the price rises, the stop loss level trails along with it, locking in profits and reducing potential losses.
Volatility Adaptation:
By incorporating the ATR (Average True Range) calculation, the Trailing Stop Loss SuperTrend indicator adjusts its sensitivity to market volatility. A higher ATR multiplier widens the distance between the price and the bands, accommodating higher volatility, while a lower multiplier tightens the bands during periods of lower volatility. This adaptability makes the indicator versatile and suitable for various market conditions.
Alerts and Notifications:
The Trailing Stop Loss SuperTrend indicator provides the ability to set alerts for specific events, such as trend changes, buy signals, and sell signals. Traders can receive real-time notifications via email, SMS, or on-platform alerts, ensuring they stay informed about potential trading opportunities and important market developments.
Conclusion:
The Trailing Stop Loss SuperTrend indicator is a valuable tool for traders seeking to identify trends, generate entry and exit signals, and effectively manage risk. Its ability to adapt to market volatility and incorporate trailing stop loss orders enhances trading strategies and decision-making. By combining the SuperTrend concept with trailing stop loss functionality, this indicator provides traders with a comprehensive approach to trend analysis and risk management. Whether used in isolation or in conjunction with other indicators, the Trailing Stop Loss SuperTrend indicator offers a powerful tool for navigating the dynamic world of financial markets.

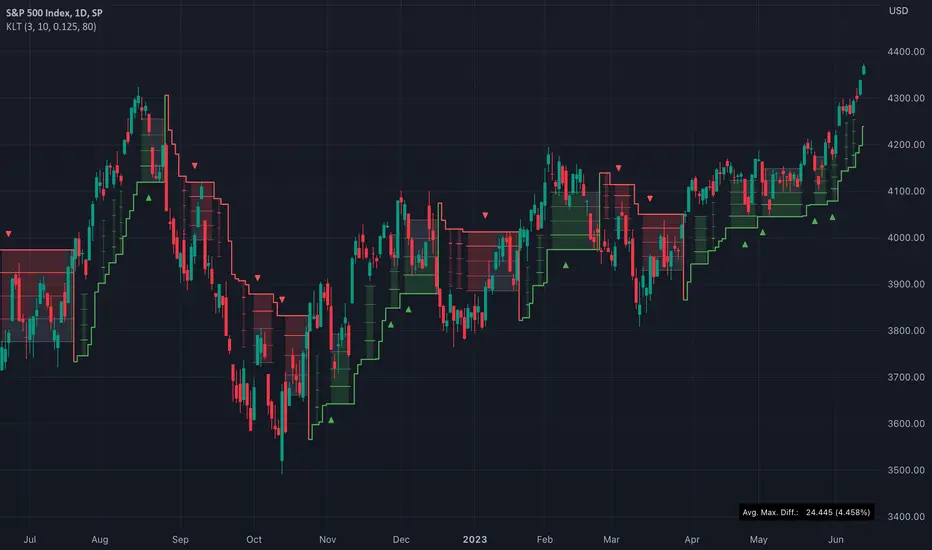
TASC 2023.07 Keeping With The Larger Trend█ OVERVIEW
TASC's July 2023 edition of Traders' Tips features an article by Barbara Star titled "Stay On Track With The Supertrend Indicator". The article explores how the supertrend indicator , whether used as a standalone tool or in conjunction with other indicators, can assist traders in aligning with the larger trend. Drawing inspiration from the article, this script enhances the supertrend indicator with additional visual and analytical features, making it easier to analyze the readings and make informed trading decisions.
█ CONCEPTS
Over the past few years, the supertrend indicator has gained significant popularity among traders. Unlike moving averages, it incorporates both price and volatility information, enabling traders to navigate upward or downward trends despite occasional price disruptions.
When using the supertrend indicator, a trader may consider entering a long position when the price surpasses the supertrend line or retraces to it after the initial crossover. Similarly, for short positions, a trader could enter when the price drops below the supertrend line or retests it. Exiting these positions can be triggered by the opposite scenario, such as a price drop below the supertrend line for long positions or a price rise above the supertrend line for short positions. To assist in monitoring the distance between the price and the indicator line, this script introduces the following display features:
Breach levels, representing fractions of the most recent maximum distance.
On-chart signals indicating crossings of the highest and lowest breach levels.
An infobox displaying the average value of the maximum distance.
█ CALCULATIONS
For calculating the supertrend line, this script uses the built-in function ta.supertrend() . Additionally, the script showcases the use of state-of-the-art PineScript® functionality, including methods and tables .
Trend Tracer [AlgoAlpha]🟠 OVERVIEW
This tool builds a two-stage trend model that reacts to structure shifts while also showing how strong or weak the move is. It uses a mid-price band (from the highest high and lowest low over a lookback) and applies two Supertrend passes on top of it. The first pass smoothens the basis. The second pass refines that direction and produces the final trail used for signals. A gradient fill between the two trails uses RSI of price-to-trail distance to show when price is stretched or cooling off. The aim is to give traders a simple way to read trend alignment, pressure, and early turns without guessing.
🟠 CONCEPTS
The script starts with a mid-range basis. This is the average of the rolling highest high and lowest low. It acts as a stable structure reference instead of raw close or typical price. From there, two Supertrend layers are applied:
• The first Supertrend uses a shorter ATR period and lower factor. It reacts faster and sets the main regime.
• The second Supertrend uses a slightly longer ATR and higher factor. It filters noise, waits for confirmed continuation, and generates the signal line.
The interaction between these trails matters. The outer Supertrend provides context by defining the broader regime. The inner Supertrend provides timing by flipping earlier and marking possible shifts. The gradient fill uses RSI of (close − supertrend value) to display when price stretches away from the trail. This shows strength, exhaustion, or compression within the trend.
🟠 FEATURES
Bullish and bearish flip markers placed at recent highs/lows
Rejection signals off the trend tracer line
Alerts for bullish and bearish trend changes
🟠 USAGE
Setup : Add the script to your chart. Timeframe is flexible; lower timeframes show more flips while higher ones give cleaner swings. Adjust Length to change how wide the basis range is. Use the two ATR settings and factors to match the volatility of the market you trade.
Read the chart : When the refined trail (stv_) sits above price the regime is bearish; when below, it is bullish. The wide trail (stv) confirms the larger move. Watch the gradient fill: darker colors appear when price is stretched from the trail and lighter colors appear when the move is weakening. Flip markers ▲ or ▼ highlight the first clean shift of the refined trail.
Settings that matter : Increasing the Main Factor slows main-trend flips and filters chop. Increasing the Signal Factor delays the timing trail but reduces noise. Shortening Length makes the basis more reactive. ATR periods change how sensitive each Supertrend pass is to volatility.

SuperBandsI've been seeing a lot of volatility band indicators pop up recently, and after watching this trend for a while, I figured it was time to throw my two chips in. The original spark for this idea came years ago from RicardoSantos's Vector Flow Channel script, which used decay channels with timed events in an interesting way. That concept stuck with me, and I kept thinking about how to build something that captured the same kind of dynamic envelope behavior but with a different mathematical foundation. What I ended up with is a hybrid that takes the core logic of supertrend trailing stops, smooths them heavily with exponential moving averages, and wraps them in Donchian-style filled bands with momentum-based color gradients.
The basic mechanism here is pretty straightforward. Standard supertrend calculates a trailing stop based on ATR offset from price, then flips direction when price crosses the trail. This implementation does the same thing but adds EMA smoothing to the trail calculation itself, which removes a lot of the choppiness you get from raw supertrend during sideways periods. The smoothing period is adjustable, so you can tune how reactive versus stable you want the bands to be. Lower smoothing values make the bands track price more aggressively, higher values create wider, slower-moving envelopes that only respond to sustained directional moves.
Where this diverges from typical supertrend implementations is in the visual presentation and the separate treatment of bullish and bearish conditions. Instead of a single flipping line, you get persistent upper and lower bands that each track their own trailing stops independently. The bullish band trails below price and stays active as long as price doesn't break below it. The bearish band trails above price and remains active until price breaks above. Both bands can be visible simultaneously, which gives you a dynamic channel that adapts to volatility on both sides of price action. When price is trending strongly, one band will dominate and the other will disappear. During consolidation, both bands tend to compress toward price.
The color gradients are calculated by measuring the rate of change in each band's position and converting that delta into an angle using arctangent scaling. Steeper angles, which correspond to the band moving quickly to catch up with accelerating price, get brighter colors. Flatter angles, where the band is moving slowly or staying relatively stable, fade toward more muted tones. This gives you a visual sense of momentum within the bands themselves, not just from price movement. A rapidly brightening band often precedes expansion or breakout conditions, while fading colors suggest the trend is losing steam or entering consolidation.
The filled regions between price and each band serve a similar function to Donchian channels or Keltner bands, creating clearly defined zones that represent normal price behavior relative to recent volatility. When price hugs one band and the fill area compresses, you're in a strong directional regime. When price bounces between both bands and the fills expand, you're in a ranging environment. The transparency gradients in the fills make it easier to see when price is near the edge of the envelope versus safely inside it.
Configuration is split between bullish and bearish settings, which lets you asymmetrically tune the indicator if you find that your market or timeframe has different characteristics in uptrends versus downtrends. You can adjust ATR period, ATR multiplier, and smoothing independently for each direction. This flexibility is useful for instruments that exhibit different volatility profiles during bull and bear phases, or for strategies that want tighter trailing on longs than shorts, or vice versa.
The ATR period controls the lookback window for volatility measurement. Shorter periods make the bands react quickly to recent volatility spikes, which can be beneficial in fast-moving markets but also leads to more frequent whipsaws. Longer periods smooth out volatility estimates and create more stable bands at the cost of slower adaptation. The multiplier scales the ATR offset, directly controlling how far the bands sit from price. Smaller multipliers keep the bands tight, triggering more frequent direction changes. Larger multipliers create wider envelopes that give price more room to move without breaking the trail.
One thing to note is that this indicator doesn't generate explicit buy or sell signals in the traditional sense. It's a regime filter and envelope tool. You can use band breaks as directional cues if you want, but the primary value comes from understanding the current volatility environment and whether price is respecting or violating its recent behavioral boundaries. Pairing this with momentum oscillators or volume analysis tends to work better than treating band breaks as standalone entries.
From an implementation perspective, the supertrend state machine tracks whether each direction's trail is active, handles resets when price breaks through, and manages the EMA smoothing on the trail points themselves rather than just post-processing the supertrend output. This means the smoothing is baked into the trailing logic, which creates a different response curve than if you just applied an EMA to a standard supertrend line. The angle calculations use RMS estimation for the delta normalization range, which adapts to changing volatility and keeps the color gradients responsive across different market conditions.
What this really demonstrates is that there are endless ways to combine basic technical concepts into something that feels fresh without reinventing mathematics. ATR offsets, trailing stops, EMA smoothing, and Donchian fills are all standard building blocks, but arranging them in a particular way produces behavior that's distinct from each component alone. Whether this particular arrangement works better than other volatility band systems depends entirely on your market, timeframe, and what you're trying to accomplish. For me, it scratched the itch I had from seeing Vector Flow years ago and wanting to build something in that same conceptual space using tools I'm more comfortable with.

Volume MAs Supertrend | Lyro RS📊 Volume MAs Supertrend | Lyro RS is an advanced trading tool that combines volume-adjusted moving averages with a dynamic Supertrend system. This indicator provides a robust framework for identifying market trends and entry/exit points.
✨ Key Features :
📈 Volume-Weighted Moving Averages (VWMA): Integrates price and volume data to provide a more accurate moving average, allowing for better trend analysis.
🔧 Multiple MA Types: Choose from SMA, EMA, WMA, VWMA, DEMA, TEMA, RMA, HMA, ALMA to suit your preferred trading strategy.
📊 Dual-Multiplier Supertrend System: Uses ATR to dynamically calculate upper and lower bands for long and short trends, with distinct multipliers for each.
🎨 Customizable Color Schemes: Choose from Classic, Mystic, Accented, and Royal color palettes or customize your own colors for bullish and bearish trends.
🔍 Visual Enhancements: Color-coded Supertrend lines, candlesticks, and bars for quick trend identification.
⏰ Alert System: Alerts for long and short signals based on trend changes.
🔧 How It Works :
The Supertrend line is calculated using ATR over a user-defined period, with separate multipliers for long and short positions.
📈 A bullish trend is signaled when the price crosses above the upper band, and a bearish trend is signaled when the price crosses below the lower band.
🎨 The Supertrend line changes color to reflect trend direction, with candlesticks and bars matching the trend's color for visual clarity.
⚙️ Customization Options :
🛠️ Moving Average Settings: Select your preferred moving average type (SMA, EMA, VWMA, etc.) and adjust the length for smoother or more responsive trend signals.
📐 Supertrend Parameters: Define the ATR period and adjust multipliers to fine-tune sensitivity for long and short signals.
🎨 Color Configuration: Choose from predefined color palettes or create your own custom scheme for trend signals.
📈 Use Cases :
✅ Confirm market trends before entering trades.
🚪 Identify potential entry/exit points as trend directions shift.
👀 Visually analyze market conditions with color-coded candlesticks and bars.
⚠️ Disclaimer :
This indicator should not be used as a standalone tool for making trading decisions. Always combine with other forms of analysis and risk management practices.

Heiken Ashi Supertrend ADXHeiken Ashi Supertrend ADX Indicator
Overview
This indicator combines the power of Heiken Ashi candles, Supertrend indicator, and ADX filter to identify strong trend movements across multiple timeframes. Designed primarily for the cryptocurrency market but adaptable to any tradable asset, this system focuses on capturing momentum in established trends while employing a sophisticated triple-layer stop loss mechanism to protect capital and secure profits.
Strategy Mechanics
Entry Signals
The strategy uses a unique blend of technical signals to identify high-probability trade entries:
Heiken Ashi Candles: Looks specifically for Heiken Ashi candles with minimal or no wicks, which signal strong momentum and trend continuation. These "full-bodied" candles represent periods where price moved decisively in one direction with minimal retracement. These are overlayed onto normal candes for more accuarte signalling and plotting
Supertrend Filter: Confirms the underlying trend direction using the Supertrend indicator (default factor: 3.0, ATR period: 10). Entries are aligned with the prevailing Supertrend direction.
ADX Filter (Optional) : Can be enabled to focus only on stronger trending conditions, filtering out choppy or ranging markets. When enabled, trades only trigger when ADX is above the specified threshold (default: 25).
Exit Signals
Positions are closed when either:
An opposing signal appears (Heiken Ashi candle with no wick in the opposite direction)
Any of the three stop loss mechanisms are triggered
Triple-Layer Stop Loss System
The strategy employs a sophisticated three-tier stop loss approach:
ATR Trailing Stop: Adapts to market volatility and locks in profits as the trend extends. This stop moves in the direction of the trade, capturing profit without exiting too early during normal price fluctuations.
Swing Point Stop: Uses natural market structure (recent highs/lows over a lookback period) to place stops at logical support/resistance levels, honoring the market's own rhythm.
Insurance Stop: A percentage-based safety net that protects against sudden adverse moves immediately after entry. This is particularly valuable when the swing point stop might be positioned too far from entry, providing immediate capital protection.
Optimization Features
Customizable Filters : All components (Supertrend, ADX) can be enabled/disabled to adapt to different market conditions
Adjustable Parameters : Fine-tune ATR periods, Supertrend factors, and ADX thresholds
Flexible Stop Loss Settings : Each of the three stop loss mechanisms can be individually enabled/disabled with customizable parameters
Best Practices for Implementation
[Recommended Timeframes : Works best on 4-hour charts and above, where trends develop more reliably
Market Conditions: Performs well across various market conditions due to the ADX filter's ability to identify meaningful trends
Performance Characteristics
When properly optimized, this has demonstrated profit factors exceeding 3 in backtesting. The approach typically produces generous winners while limiting losses through its multi-layered stop loss system. The ATR trailing stop is particularly effective at capturing extended trends, while the insurance stop provides immediate protection against adverse moves.
The visual components on the chart make it easy to follow the strategy's logic, with position status, entry prices, and current stop levels clearly displayed.
This indicator represents a complete trading system with clearly defined entry and exit rules, adaptive stop loss mechanisms, and built-in risk management through position sizing.

Bollinger Bands + Supertrend by XoediacBollinger Bands with Supertrend Indicator by Xeodiac
This script combines two powerful technical analysis tools — Bollinger Bands and the Supertrend Indicator — to provide traders with a comprehensive view of market volatility and trend direction.
Bollinger Bands: These bands consist of a middle band (the simple moving average, or SMA) and two outer bands (calculated as standard deviations away from the middle). The upper and lower bands act as dynamic support and resistance levels, expanding during high volatility and contracting during low volatility.
Supertrend Indicator: The Supertrend is a trend-following indicator that uses the Average True Range (ATR) to calculate an adaptive threshold, indicating whether the market is in an uptrend or downtrend. The indicator changes color based on the trend direction, providing clear buy and sell signals.
Features of the Script:
Volatility-based Signals : By incorporating the Bollinger Bands, the script adjusts to market volatility. Traders can identify periods of high and low volatility, helping to gauge potential price breakouts or reversals.
Trend Confirmation: The Supertrend helps confirm the trend direction, ensuring that trades are aligned with the overall market trend. Green Supertrend signals indicate an uptrend, while red signals indicate a downtrend.
Enhanced Decision-making: By using both indicators together, traders can make more informed decisions. For instance, buying opportunities are validated when the price is near the lower Bollinger Band, and the Supertrend is in a bullish phase, and vice versa for selling.
Customizable Parameters: The script allows users to customize the settings for both the Bollinger Bands and the Supertrend, enabling fine-tuning based on trading preferences or market conditions.
Ideal Use Cases:
Identifying trend reversals or continuation patterns in trending markets.
Monitoring price action during periods of low volatility for breakout opportunities.
Filtering out false signals by combining volatility with trend strength.
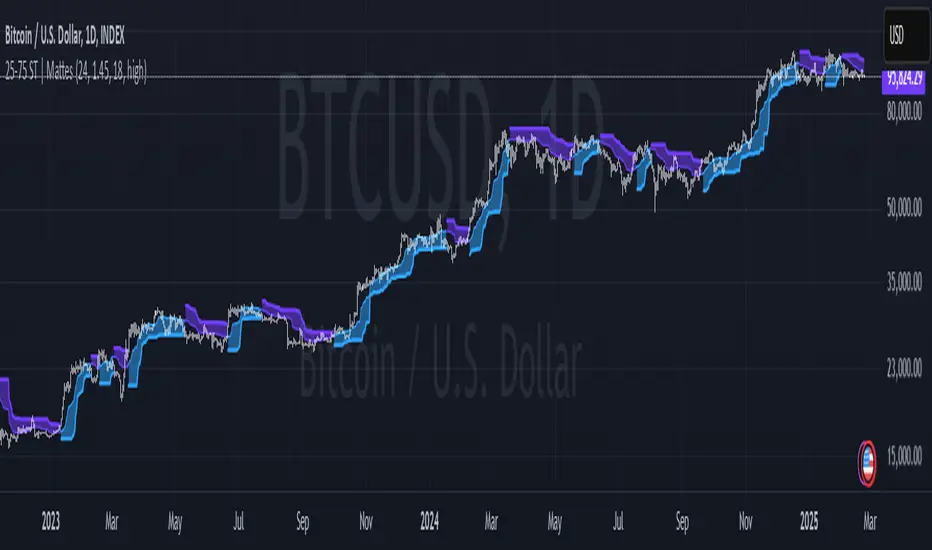
25-75 Percentile SuperTrend | Mattes25-75 Percentile SuperTrend | Mattes
Overview
The 25-75 Percentile SuperTrend is an advanced trend-following indicator that enhances the traditional SuperTrend concept by incorporating percentile-based smoothing. Instead of using a simple moving average or median price, this indicator calculates the 25th and 75th percentiles over a user-defined period. These percentiles act as dynamic trend levels, adjusting more responsively to price volatility while reducing noise.
How It’s Calculated
Percentile Smoothing:
The 25th percentile of the selected source (low-end smoothing).
The 75th percentile of the selected source (high-end smoothing).
SuperTrend Logic:
The upper band is set at the 75th percentile + ATR multiplier.
The lower band is set at the 25th percentile - ATR multiplier.
The trend flips when the price crosses above/below these dynamic bands.
Signal Generation :
A bullish trend occurs when price remains above the lower band.
A bearish trend occurs when price remains below the upper band.
Trend shifts are highlighted with colored bars and lines for easy visualization.
How It Differs From Traditional SuperTrend
Uses Percentiles Instead of a Moving Average:
Traditional SuperTrend relies on ATR-based offsets from a moving average.
This version replaces the moving average with percentile smoothing, which adapts better to price behavior.
Better Noise Filtering:
Since percentiles are less sensitive to outliers, this indicator reduces false signals in choppy markets.
More Adaptive to Market Conditions:
The percentile smoothing dynamically adjusts trend detection based on price distribution rather than fixed calculations.
Why It’s Useful
✅ Reduces Whipsaws: Helps minimize false breakouts by using percentile-based bands instead of traditional ATR-only bands.
✅ Works in Different Market Conditions: Effective in both trending and ranging environments due to its adaptive nature.
✅ Enhances Trend Confidence: Provides clearer signals by filtering noise more effectively than standard SuperTrend indicators.
Application Examples
Trend Following: Use it to identify strong upward or downward trends.
Stop-Loss Placement: The upper and lower bands can serve as dynamic stop-loss levels.
Breakout Confirmation: Trend flips can confirm breakout signals from other indicators.
Mean Reversion Strategy Filtering: The 25-75 range helps identify strong versus weak reversals.
Risks & Disclaimers
Not a Standalone Strategy: This indicator should be used with other confirmation tools like volume analysis, momentum oscillators, or support/resistance levels.
False Signals in Sideways Markets: Although it reduces noise, choppy markets can still generate occasional false trend flips.
Market Adaptation Required: The best parameters may vary depending on the asset and timeframe.
This indicator was heavily inspired and influenced by the IRS/viResearch Median SuperTrend, improving upon its concept by transforming its median based calculation into a more responsive & effective counterpart of its former self.
Shoutout to all my Masterclass Brothers and L4 Gs !
Aleem Trend Supertrend EMA Title: "Supertrend and 200 EMA Crossover Strategy"
Description:
This script is designed to provide traders with a robust and original trading strategy by combining the Supertrend indicator with a 200-period Exponential Moving Average (EMA). The core concept is to utilize the strengths of both indicators to determine optimal entry and exit points.
The Supertrend indicator is well-regarded for its precision in signaling trend reversals by considering the volatility of the market, as measured by the Average True Range (ATR). It is particularly useful for identifying ongoing trends and potential reversals.
The 200 EMA is a widely-used indicator that many traders look to as a determinant of the long-term trend. When the price is above the 200 EMA, the overall market sentiment is considered bullish, and when below, bearish.
By combining these two, the script generates a Buy signal under the following conditions:
When the Supertrend turns bullish (color changes from red to green) with the closing price above the 200 EMA, or
When the price crosses above the 200 EMA while the Supertrend is already green.
A Sell signal is generated when:
The Supertrend turns bearish (color changes from green to red) with the closing price below the 200 EMA, or
The price crosses below the 200 EMA while the Supertrend is already red.
To avoid repetitive signals and to maintain clarity, the script has been enhanced with a feature to prevent multiple consecutive Buy or Sell signals. Once a Buy or Sell signal is generated, the script will not produce another identical signal until an opposing signal or an exit condition is met.
Exit signals for both Buy and Sell positions are provided to indicate when the trend is weakening or reversing, based on the Supertrend's color change in relation to the 200 EMA.
This strategy is flexible and can be utilized across various time frames and asset classes. It aims to aid traders in making more informed decisions by highlighting potential reversals and continuations in the market trend.
Usage:
To use this script, traders should observe the Buy and Sell signals as potential entry points. Exit signals should be taken as prompts to close positions or to protect profits with stop-loss adjustments. As with all strategies, it's recommended to use this in conjunction with other analysis methods and to backtest thoroughly before live implementation.
Pro ScalperOverview
The Pro Scalper indicator is a powerful day trading tool designed specifically for the 30-minute timeframe, catering to stock and cryptocurrency markets. It provides traders with buy and sell signals, dynamic overbought/oversold zones, and reversal signal indicators. By combining a Kalman-adapted Supertrend calculation for buy and sell signals, and VWMA bands to determine overbought/oversold zones, this indicator aims to assist traders in identifying potential trading opportunities for scalping and day trading strategies using trend-following and mean-reverting methods. This combination of Kalman Filtering with an adapted Supertrend seeks to mitigate false signals, filter out market noise, and aims to provide traders with more reliable buy and sell indications.
Features
Buy and Sell Signals: Pro Scalper generates buy and sell signals based on a Kalman-adapted Supertrend calculation. These signals help traders identify potential entry and exit points in the market.
Dynamic Overbought/Oversold Zones: The indicator dynamically calculates overbought and oversold zones using VWMA bands. These zones provide valuable insights into potential price exhaustion levels, aiding traders in managing risk and identifying potential reversals.
Reversal Signals (R Labels): The indicator includes "R" labels that indicate potential reversal signals. These signals are based on the overbought/oversold zones calculated with VWMA bands. The appearance of an "R" label suggests a possible price reversal, offering traders an additional tool for decision-making.
Calculations
This indicator stands out as a unique tool due to unique Kalman filtering and altered Supertrend calculation, as well as its combination of specific features. This indicator combines the following calculations to provide its features:
Kalman Filter: The indicator employs a Kalman Filter to adapt the Supertrend calculation. This calculation was based on mathematical equations derived from Rudolf E. Kalman. This Kalman Filter helps smooth out price data, reducing noise and removing outliers from data.
Supertrend Calculation: This particular supertrend possesses alterations to price series data and ATR calculations in an aim to improve signal accuracy. Additionally, the calculation uses Kalman-filtering within the calculation to provide a powerful framework to handle uncertainties, noise, and changing conditions.
VWMA Bands: VWMA (Volume-Weighted Moving Average) bands are calculated using the highest high and lowest low values with specified multipliers. These bands are used to determine the dynamic overbought and oversold zones, giving traders insights into potential price exhaustion levels. These are included with the aim to adapt to changing market conditions and price data. This adaptability allows the zones to accurately reflect the current price volatility and trend.
Utility
This tool provides traders with valuable information for scalping and day trading strategies in the 30-minute timeframe. It helps traders by:
Generating buy and sell signals, indicating potential entry and exit points.
Calculating dynamic overbought/oversold zones, enabling traders to identify potential price exhaustion levels.
Displaying "R" labels to highlight potential reversal signals.
Offering optional alerts for reversal signals, buy/sell signals, allowing traders to stay updated even when they're not actively monitoring the charts.
Remember, past performance does not guarantee future performance. Traders should utilize this indicator as part of a comprehensive trading strategy and exercise their own judgment when making trading decisions.

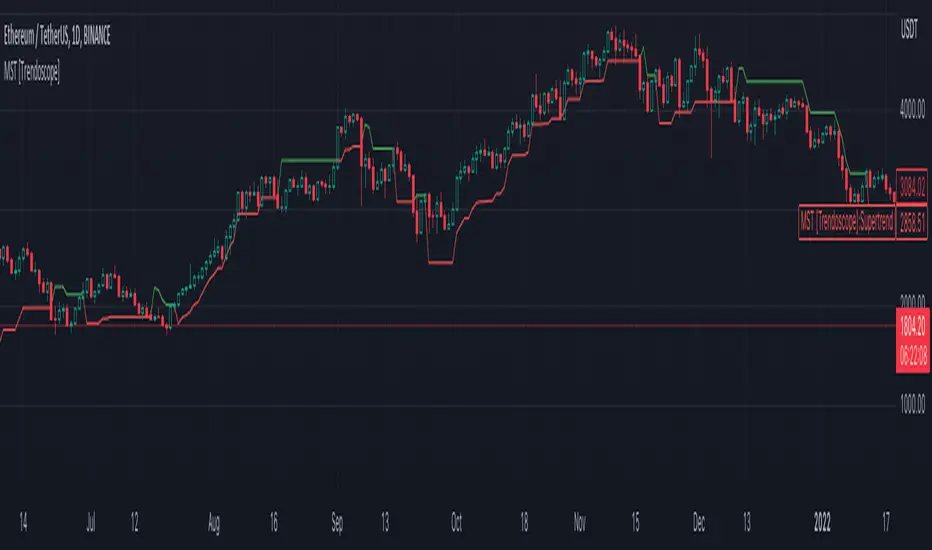
Master Supertrend [Trendoscope]Are you a fan of supertrend? Me too!! Here is a supertrend indicator which provides multiple variation options to chose from.
🎲 Introduction
Supertrend is a popular technical indicator used by traders to identify potential trend reversals and determine entry and exit points in financial markets. It is a trend-following indicator that combines price and volatility to generate its signals. Generally supertrend is calculated based on ATR and multiplier value which is used for calculation of stops. In these adaptions, we look to provide few variations to classical methods.
🎲 Variations
Following variations are provided in the form of settings.
🎯 Range Type
Instead of ATR, different types of ranges can be used for stop calculation. Here is the complete list used in the script.
Plus/Minus Range - Calculates plus range and minus range for each candle and uses them for different sides of stop calculation
Ladder ATR - Based on the existing concept of Ladder ATR defined in Supertrend-Ladder-ATR
True Range - True range derived from standard function ta.tr
Standard Deviation - Standard deviation of close prices
🎯 Applied Calculation
In standard ATR, rma of TR is used for calculations. But, the application calculation provides option to users to use different mechanisms. It can be a type of moving average or few other types of calculations.
Available values are
sma
ema
hma
rma
wma
high
median
medianHigh (Highest of the last N medians)
medianLow (Lowest of the last N medians)
🎯 Other options
Few other options provided are
Use Close Price - If selected stops are calculated based on the close price instead of high/low prices
Wait for Close If selected, change of supertrend direction is calculated based on close price instead of high/low prices
Diminishing Stop Distance - When selected, stop distance for the trend direction can only reduce and cannot increase. This option is useful for keeping the tight stops on strong trends.
🎯 Plus Minus Range
One of the range type used is Plus/Minus Range. What it means and how are these ranges calculated? Let's have a look.
Plus Range is an upward movement of a candle from its last price or open price whichever is lower.
Minus Range is a downward movement of a candle from its last price or open price whichever is higher.
This divides True Range into two separate range for positive and negative side.
Here are the simple settings in nutshell which reflects the same.
AVAX Bot-Safe SuperTrend FastConfirm v1 (No Repaint for BOT)BETA version - (still in testing)
AVAX Bot-Safe SuperTrend FastConfirm v1 is a TradingView indicator designed to generate stable, non-repainting trade signals for automated execution, while also offering optional visual “early” cues for discretionary monitoring. The script combines a SuperTrend trend engine with a FastConfirm mechanism based on lower-timeframe closes, plus optional confirmation via Hull Moving Averages (HMAs) and risk overlays (ATR-based SL/TP) for execution planning.
1) Core Trend Engine (SuperTrend)
The indicator computes a SuperTrend using ATR (Wilder ATR via ta.atr() by default, optional SMA-TR alternative).
It tracks a binary trend state:
* Trend = bullish when price is above the trailing bearish band.
* Trend = bearish when price is below the trailing bullish band.
“Early” SuperTrend flips (trend change points) can be shown as visual-only markers, intended for human observation rather than bot execution.
2) Hull Moving Averages (Context / Optional Confirmation)
* Two Hull MAs are calculated:
* Fast Hull (short length)
* Slow Hull (longer length)
* Hull alignment is used as an optional confirmation layer (recommended for AVAX) to reduce whipsaws:
* Bullish bias when Fast Hull > Slow Hull
* Bearish bias when Fast Hull < Slow Hull
* Hull lines can be plotted for trend structure and momentum context.
3) Momentum Burst (Visual Only)
* The script includes a momentum “burst / continuation” visual module:
* Measures impulse using either ATR-normalized movement (default) or percentage change.
* Flags continuation patterns (e.g., consecutive rising/falling closes after a burst).
* These markers are not used for bot execution, and are intended to assist human interpretation.
4) Optional Filters (Only Applied to BOT if Enabled)
The script contains optional execution filters that can be applied to bot signals (toggleable):
* Volume filter: compares current volume to a volume moving average.
* RSI filter: avoids entries in overstretched conditions.
* ADX filter: requires a minimum trend strength.
A dedicated switch (“BOT: apply Volume/RSI/ADX if enabled”) determines whether these filters impact automated entries.
5) Bot-Safe Signal Logic (No Repaint)
The indicator’s primary purpose is to produce bot-safe entries that do not “blink” intrabar:
A. Candidate trigger (stable bands + buffer)
* Uses previous bar SuperTrend levels and an ATR-based buffer to avoid micro-touch signals.
* Detects whether price action meaningfully penetrates the relevant band.
B. FastConfirm via lower timeframe closes
* Pulls lower-TF closes inside the current candle (e.g., 1m confirmations) and requires N consecutive closes beyond the threshold level.
* This is intended to reduce false flips while still entering earlier than pure bar-close logic.
C. Two execution modes
* FastConfirm: faster entries, confirmation from lower timeframe closes (recommended for latency-sensitive automation).
* BarClose: waits for bar close confirmation (slowest but maximally conservative).
D. Latching + cooldown
* Signals are latched per bar so they do not disappear within the same candle.
* A direction lock and cooldown prevents immediate opposite signals in rapid chop.
6) Risk Levels (ATR-Based SL/TP + JSON Payload)
* On each bot signal, the indicator calculates:
* Stop Loss = ATR-multiple away from price
* Take Profit = based on a configurable risk:reward ratio
* SL/TP lines can be plotted for a limited number of bars after the signal for clarity.
* For automation, the script can send dynamic JSON alerts via alert() including:
* action (BUY/SELL), symbol, timeframe, confirmation TF, suggested entry, SL, TP, and latency cushion.
A configurable latency cushion (%) adjusts the “entry” field to account for real execution delay/slippage (useful when routing signals to bots/exchanges with a few seconds latency).
Recommended Usage (TradingView + Bot Execution)
Best practice for bot safety
* Use Bot Signal Mode = FastConfirm for earlier entries while keeping confirmations.
* Keep FastConfirm TF = 1m and start with Confirm Bars = 2 (then tune to 3 if too many false signals).
* Maintain a modest ATR buffer (e.g., 0.10–0.20 × ATR ) to reduce noise triggers.
How to set alerts
* For bot routing that expects structured data: enable Send JSON via alert(), and create the TradingView alert using:
* “Any alert() function call”
* For simpler setups: use the built-in alertcondition() alerts (“AVAX BOT BUY/SELL”).
Filter policy (risk control)
* If you trade during choppy ranges, consider enabling ADX and/or Hull alignment.
* Enable Volume/RSI/ADX filters for the bot only if you accept fewer trades in exchange for higher selectivity.
Operational notes
* Prefer lower chart timeframes (e.g., 1m–5m) with FastConfirm to limit reaction time.
* Calibrate latency cushion (%) to match your observed end-to-end delay (TradingView → webhook → bot → exchange).
* Always validate settings in BarClose mode first to benchmark “safest behaviour,” then switch to FastConfirm and tune confirm bars/buffer.
!!!! - The algorithm was designed with ChatGPT 5.2 Pro

Combined: Gann HL + Supertrend + Supertrend v6Combined: Gann HL + Supertrend + Supertrend v6
Included Indicators
1. Gann High-Low Activator
A dynamic trend tool that flips direction when price crosses its smoothed high/low average. Gann signals often catch clean directional swings and act as an excellent early trend filter.
2. Standard Supertrend (ATR-based)
The classic trend-following indicator using average true range for volatility-adaptive stop levels. Its direction flips mark trend reversals, especially effective in trending markets.
3. Orekhov Supertrend (GPL Classic)
A robust version of Supertrend that includes wick sensitivity and doji-handling logic. It behaves smoothly on lower timeframes, avoiding false flips and maintaining direction more intelligently.

[Top] LHAMA SupertrendLHAMA Supertrend - Advanced Adaptive Trend Following System
Overview
The LHAMA Supertrend is an innovative trend-following indicator that combines adaptive moving average technology with intelligent signal confirmation. Unlike traditional supertrend indicators that rely on simple moving averages, this system uses my Low-High Adaptive Moving Average (🦙 LHAMA) algorithm that dynamically adjusts to market volatility and price action patterns. It is much more responsive to sudden price changes than traditional supertrend indicators, allowing you to jump in earlier and catch more of the move, and it manages this responsiveness without significantly increasing the number of false signals.
What Makes This Original
This indicator introduces several unique concepts not found in standard trend-following tools:
LHAMA Algorithm : The core innovation is the Low-High Adaptive Moving Average, which adapts its responsiveness based on the frequency of new highs and lows within a lookback period. This creates a more intelligent baseline that responds appropriately to different market conditions.
Delayed Confirmation System : Rather than generating immediate signals on price crossovers, the indicator implements a sophisticated confirmation mechanism using slope analysis. Signals are only triggered when both trend direction and momentum align, significantly reducing false signals.
Volume Integration : Optional volume weighting enhances the adaptive calculation, giving more weight to price movements during high-volume periods.
Daily Reset Functionality : Unique daily reset feature helps realign the indicator after overnight gaps, particularly useful for equity markets.
How It Works
LHAMA Calculation
The LHAMA baseline adapts using a coefficient derived from:
Frequency of new highs and lows in the lookback period
Optional volume weighting factor
Smoothed adaptation rate based on market activity
The calculation:
lhama = previous_lhama + momentum_adaptation * (price - previous_lhama)
Where the momentum adaptation increases when markets are making new highs or lows, allowing faster response during trending conditions while providing stability during consolidation.
Signal Generation
The indicator uses a two-stage signal process:
Trend Identification : Price position relative to LHAMA determines basic trend bias
Slope Confirmation : ATR-normalized slope analysis confirms momentum direction
Signal Timing : Buy/sell signals only trigger when trend direction and slope momentum align
Visual Components
LHAMA Line : The adaptive baseline with optional angle-based gradient coloring that visualizes momentum strength
Trend Clouds : Dynamic fill areas that adapt to the last confirmed signal direction
ATR Halo : Opposite-side ATR band providing optional additional context for stop-loss placement
Confirmation Signals : Clear BUY/SELL labels only appear after full confirmation
How to Use
Basic Setup
Apply to any timeframe and symbol
Default LHAMA length of 15 periods works well for most applications
Accuracy depends greatly on chart timeframe and symbol, so make sure to backtest before relying on any signals. For example, ES and NQ work best on the 15m timeframe while GC and CL work best on the 5m.
Enable daily reset for equity markets to handle overnight gaps
Signal Interpretation
Immediate Heads-up : Small triangles show instant trend changes for awareness. These are your warnings to get ready to buy or sell if price takes off. (If many triangles are being printed in both directions, that is a warning that the market is ranging and you should not blindly follow a BUY/SELL signal without additional confirmation.)
Confirmed Signals : BUY/SELL labels appear only after slope confirms the direction
Cloud Color : Locked to the last confirmed signal direction for clear regime identification
Advanced Features
Flat Threshold : Adjust the angle threshold to filter out sideways market noise
Gradient Mode : Toggle between classic supertrend coloring and momentum-based gradients
ATR Halo : Use the opposite-side cloud as a more generous trailing stop level
Risk Management
The indicator provides multiple levels for stop-loss placement:
Tight : Edge of the main trend cloud
Standard : The LHAMA Line itself
Generous : ATR halo boundary
Best Practices
Timeframe Selection : Not all timeframes on all symbols are created equal. Make sure to scroll to the left and verify that your current chart timeframe isn't throwing out tons of bad signals. This will be easy to spot as it show up as constant rapid flipping from buy to sell.
Market Conditions : Performs best in trending markets. The flat threshold setting helps filter out poor performance during strong sideways action, but no indicator is perfect.
Confirmation : Wait for confirmed BUY/SELL signals rather than acting on immediate trend flips for better risk-adjusted returns.
Key Parameters
LHAMA Length (15) : Controls the lookback period for adaptive calculation
Daily Reset : Helps maintain accuracy across overnight gaps
Flat Threshold (5°) : Filters out low-momentum signals
Volume Weighting : Enhances adaptation during high-volume periods
Alerts
The indicator provides two alert types:
"BUY (confirmed)": Triggers when bullish trend and upward slope align
"SELL (confirmed)": Triggers when bearish trend and downward slope align
These alerts fire only on confirmed signals, not on immediate price crossovers, providing higher-quality notifications.
Innovation Summary
This indicator advances trend-following methodology by introducing adaptive baseline calculation, intelligent signal confirmation, and comprehensive visual feedback systems. The combination of LHAMA adaptation, slope-based confirmation, and multi-layered risk management tools creates a more sophisticated approach to trend analysis than traditional supertrend indicators.
The result is a tool that maintains responsiveness during trending conditions while providing stability during consolidation, with clear visual cues for entry, exit, and risk management decisions.

3x Supertrend + EMA200 Signal Buy/Sell [nsen]The indicator uses signals from three Supertrend lines to determine whether to trade Buy or Sell, with the assistance of a moving average for bias.
Buy/Sell signals are generated when the conditions are met:
A Buy signal is triggered when all three Supertrend lines indicate a bullish trend and are above the EMA.
A Sell signal is triggered when all three Supertrend lines indicate a bearish trend and are below the EMA.
Indicator ใช้สัญญาณจาก Supertrend ทั้งหมด 3 เส้น โดยใช้ในการกำหนดว่าจะเลือกเทรด Buy หรือ Sell โดยการใช้ moveing average เข้ามาช่วยในการ bias
แสดงสัญญาณ Buy/Sell เมื่อเข้าเงื่อนไข
- Supertrend ทั้ง 3 เส้นเป็นสัญญาณ Bullish และอยู่เหนือเส้น EMA จะเปิดสัญญาณ Buy
- Supertrend ทั้ง 3 เส้นเป็นสัญญาณ Bearish และอยู่ใต้เส้น EMA จะเปิดสัญญาณ Sell

Dynamic Supertrend1. Indicator Overview:
This indicator is designed to plot dynamic support and resistance lines based on the Supertrend strategy, incorporating volatility through the Average True Range (ATR). The indicator changes direction when the price crosses certain thresholds, generating buy and sell signals. It also highlights the prevailing trend on the chart and can trigger alerts when a trend shift occurs.
2. Key Features:
ATR-Based Trend Calculation:
The script uses the Average True Range (ATR) to adjust the distance between the Supertrend line and the price. This ensures that the indicator adapts to market volatility.
The trend is determined by comparing the closing price to upper and lower boundaries, which are calculated by adding or subtracting a multiple of ATR to a source price (typically the average of the high and low prices).
Volatility Filter:
The script includes a function to check if the market is volatile by measuring the standard deviation of the closing price over the past 14 periods. This can potentially be used to conditionally enable or disable signals based on volatility.
Buy and Sell Signals:
When the price crosses above the Supertrend line, it indicates the start of an uptrend, triggering a "Buy" signal.
Conversely, when the price crosses below the Supertrend line, it signals a downtrend, triggering a "Sell" signal.
Both signals can be displayed on the chart with optional shapes (circles or arrows) and labels.
Highlighting Current Trend:
You can choose to highlight the trend with color shading. The areas above the price line are shaded green during an uptrend, while the areas below are shaded red during a downtrend. The highlighting is controlled through an input switch.
Customizable Inputs:
The script allows users to adjust the ATR period and multiplier, as well as control whether to show buy/sell signals and highlight trends.
The source price used for calculations can also be customized, providing flexibility for different market conditions.
Alerts for Trading Opportunities:
Alerts are configured to notify the user of key events:
When the Supertrend changes direction (from uptrend to downtrend, or vice versa).
When a buy or sell signal is generated.
3. Code Structure:
Input Settings: Users can customize the base ATR period, the multiplier for ATR, and control the display of signals and highlighting features.
Trend Calculation Logic: The code determines the uptrend and downtrend by comparing the current price against dynamic ATR-based thresholds. It ensures that trends persist until price action confirms a change.
Plotting and Signals: Plots the trend lines based on whether the trend is up or down. It also provides visual cues for buy and sell signals with circles and optional arrows/labels on the chart.
Alert System: Three alert conditions are defined: buy signal, sell signal, and a general trend direction change, allowing users to set up real-time notifications for trading actions.
4. Use Case:
This script is particularly useful for traders who:
Rely on trend-following strategies and want to enter trades based on price action.
Need visual confirmation of market direction changes.
Prefer to automate their trading signals with real-time alerts.
Want to adjust the sensitivity of the indicator by tweaking the ATR multiplier and period settings to suit different market conditions.
Overall, this dynamic Supertrend indicator can be a powerful tool for both manual and automated trading setups, offering flexibility and clarity in identifying trend shifts.

Targets For Overlay Indicators [LuxAlgo]The Targets For Overlay Indicators is a useful utility tool able to display targets during crossings made between the price and external indicators on the user chart. Users can display a series of two targets, one for crossover events and another one for crossunder event.
Alerts are included for the occurrence of a new target as well as for reached targets.
🔶 USAGE
In order for targets to be displayed users need to select an appropriate input source from the "Source" drop-down input setting. In the example above we apply the indicator to a volatility stop.
This can also easily be done by adding the "Targets For Overlay Indicators" script on the VStop indicator directly.
Targets can help users determine the price limit where the price might start deviating from an indication given by one or multiple indicators. In the context of trading, targets can help secure profits/reduce losses of a trade, as such this tool can be useful to evaluate/determine user take profits/stop losses.
Due to these essentially being horizontal levels, they can also serve as potential support/resistances, with breakouts potentially confirming new trends.
Users might be interested in obtaining new targets once one is reached, this can be done by enabling "New Target When Reached" in the target logic setting section, resulting in more frequent targets.
Lastly, users can restrict new target creation until current ones are reached. This can result in fewer and longer-term targets, with a higher reach rate.
🔹 Examples
The indicator can be applied to many overlay indicators that naturally produce crosses with the price, such as moving average, trailing stops, bands...etc.
Users can use trailing stops such as the SuperTrend or VStop to more easily create clean targets. Do note that certain SuperTrend scripts separate the upper and lower extremities of the SuperTrend into two different plot, which cannot be used with this tool, you may use the provided SuperTrend script below to have a compatible version with our tool:
//@version=5
indicator("SuperTrend", overlay = true)
factor = input.float(3, 'Factor', minval = 0)
atrLen = input.int(10, 'ATR Length', minval = 1)
= ta.supertrend(factor, atrLen)
plot(spt, 'SuperTrend', dir != dir ? na : dir < 0 ? #089981 : #f23645, 2)
plot(spt, 'Circles', dir > dir ? #f23645 : dir < dir ? #089981 : na, 3, plot.style_circles)
Using moving averages can produce more targets than other overlay indicators.
Users can apply the tool twice when using bands or any overlay indicator returning two outputs, using crossover targets for obtaining targets using the upper band as source and crossunder targets for targets using the lower band. We can also use the Trendlines with breaks indicator as example:
🔹 Dashboard
A dashboard is displayed on the top right of the chart, displaying the amount, reach rate of targets 1/2, and total amount.
This dashboard can be useful to evaluate the selected target distances relative to the selected conditions, with a higher reach rate suggesting the distance of the targets from the price allows them to be reached.
🔶 SETTINGS
Source: Indicator source used to create targets. Targets are created when the closing price crosses the specified source.
Show Target Labels: Display target labels on the chart.
Candle Coloring: Apply candle coloring based on the most recent active target.
🔹 Target
Crossover and Crossunder targets use the same settings below:
Show Target: Determines if the target is displayed or not.
Above Price Target: If selected, will create targets above the closing price.
Wait Until Reached: When enabled will not create a new target until an existing one is reached.
New Target When Reached: Will create a new target when an existing one is reached.
Evaluate Wicks: Will use high/low prices to determine if a target is reached. Unselecting this setting will use the closing price.
Target Distance From Price: Controls the distance of a target from the price. Can be determined in currencies/points, percentages, ATR multiples, or ticks.

Quantum Fluxtrend [CHE] Quantum Fluxtrend — A dynamic Supertrend variant with integrated breakout event tracking and VWAP-guided risk management for clearer trend decisions.
Summary
The Quantum Fluxtrend builds on traditional Supertrend logic by incorporating a midline derived from smoothed high and low values, creating adaptive bands that respond to market range expansion or contraction. This results in fewer erratic signals during volatile periods and smoother tracking in steady trends, while an overlaid event system highlights breakout confirmations, potential traps, or continuations with visual lines, labels, and percentage deltas from the close. Users benefit from real-time VWAP calculations anchored to events, providing dynamic stop-loss suggestions to help manage exits without manual adjustments. Overall, it layers signal robustness with actionable annotations, reducing noise in fast-moving charts.
Motivation: Why this design?
Standard Supertrend indicators often generate excessive flips in choppy conditions or lag behind in low-volatility drifts, leading to whipsaws that erode confidence in trend direction. This design addresses that by centering bands around a midline that reflects recent price spreads, ensuring adjustments are proportional to observed variability. The added event layer captures regime shifts explicitly, turning abstract crossovers into labeled milestones with trailing VWAP for context, which helps traders distinguish genuine momentum from fleeting noise without over-relying on raw price action.
What’s different vs. standard approaches?
- Baseline reference: Diverges from the classic Supertrend, which uses average true range for fixed offsets from a median price.
- Architecture differences:
- Bands form around a central line averaged from smoothed highs and lows, with offsets scaled by half the range between those smooths.
- Regime direction persists until a clear breach of the prior opposite band, preventing premature reversals.
- Event visualization draws persistent lines from flip points, updating labels based on price sustainment relative to the trigger level.
- VWAP resets at each event, accumulating volume-weighted prices forward for a trailing reference.
- Practical effect: Charts show fewer direction changes overall, with color-coded annotations that evolve from initial breakout to continuation or trap status, making it easier to spot sustained moves early. VWAP lines provide a volume-informed anchor that curves with price, offering visual cues for adverse drifts.
How it works (technical)
The process starts by smoothing high and low prices over a user-defined period to form upper and lower references. A midline sits midway between them, and half the spread acts as a base for band offsets, adjusted by a multiplier to widen or narrow sensitivity. On each bar, the close is checked against the previous bar's opposite band: crossing above expands the lower band downward in uptrends, or below contracts the upper band upward in downtrends, creating a ratcheting effect that locks in direction until breached.
Persistent state tracks the current regime, seeding initial bands from the smoothed values if no prior data exists. Flips trigger new horizontal lines at the breach level, styled by direction, alongside labels that monitor sustainment—price holding above for up-flips or below for down-flips keeps the regime, while reversal flags a trap.
Separately, at each flip, a dashed VWAP line initializes at the breach price and extends forward, accumulating the product of typical prices and volumes divided by total volume. This yields a curving reference that updates bar-by-bar. Warnings activate if price strays adversely from this VWAP, tinting the background for quick alerts.
No higher timeframe data is pulled, so all computations run on the chart's native resolution, avoiding lookahead biases unless repainting is enabled via input.
Parameter Guide
SMA Length — Controls smoothing of highs and lows for midline and range base; longer values dampen noise but increase lag. Default: 20. Trade-offs: Shortens responsiveness in trends (e.g., 10–14) but risks more flips; extend to 30+ for stability in ranging markets.
Multiplier — Scales band offsets from the half-range; higher amplifies to capture bigger swings. Default: 1.0. Trade-offs: Above 1.5 widens for volatile assets, reducing false signals; below 0.8 tightens for precision but may miss subtle shifts.
Show Bands — Toggles visibility of basic and adjusted band lines for reference. Default: false. Tip: Enable briefly to verify alignment with price action.
Show Background Color — Displays red tint on VWAP adverse crosses for visual warnings. Default: false. Trade-offs: Helps in live monitoring but can clutter clean charts.
Line Width — Sets thickness for event and VWAP lines. Default: 2. Tip: Thicker (3–5) for emphasis on key levels.
+Bars after next event — Extends old lines briefly before cleanup on new flips. Default: 20. Trade-offs: Longer preserves history (40+) at resource cost; shorter keeps charts tidy.
Allow Repainting — Permits live-bar updates for smoother real-time view. Default: false. Tip: Disable for backtest accuracy.
Extension 1 Settings (Show, Width, Size, Decimals, Colors, Alpha) — Manages dotted connector from event label to current close, showing percentage change. Defaults: Shown, width 2, normal size, 2 decimals, lime/red for gains/losses, gray line, 90% transparent background. Trade-offs: Fewer decimals for clean display; adjust alpha for readability.
Extension 2 Settings (Show, Method, Stop %, Ticks, Decimals, Size, Color, Inherit, Alpha) — Positions stop label at VWAP end, offset by percent or ticks. Defaults: Shown, percent method, 1.0%, 20 ticks, 4 decimals, normal size, white text, inherit tint, 0% alpha. Trade-offs: Percent for proportional risk; ticks for fixed distance in tick-based assets.
Alert Toggles — Enables notifications for breakouts, continuations, traps, or VWAP warnings. All default: true. Tip: Layer with chart alerts for multi-condition setups.
Reading & Interpretation
The main Supertrend line colors green for up-regimes (price above lower band) and red for down (below upper band), serving as a dynamic support/resistance trail. Flip shapes (up/down triangles) mark regime changes at band breaches.
Event lines extend horizontally from flips: green for bull, red for bear. Labels start blank and update to "Bull/Bear Cont." if price sustains the direction, or "Trap" if it reverses, with colors shifting lime/red/gray accordingly. A dotted vertical links the trailing label to the current close, mid-labeled with the percentage delta (positive green, negative red).
VWAP dashes yellow (bull) or orange (bear) from the event, curving to reflect volume-weighted average. At its end, a left-aligned label shows suggested stop price, annotated with offset details. Background red hints at weakening if price crosses VWAP opposite the regime.
Deltas near zero suggest consolidation; widening extremes signal momentum buildup or exhaustion.
Practical Workflows & Combinations
- Trend following: Enter long on green flip shapes confirmed by higher highs, using the event line as initial stop below. Trail stops to VWAP for bull runs, exiting on trap labels or red background warnings. Filter with volume spikes to avoid low-conviction breaks.
- Exits/Stops: Conservative: Set hard stops at suggested SL labels. Aggressive: Hold through minor traps if delta stays positive, but cut on regime flip. Pair with momentum oscillators for overbought pullbacks.
- Multi-asset/Multi-TF: Defaults suit forex/stocks on 15m–4H; for crypto, bump multiplier to 1.5 for volatility. Scale SMA length proportionally across timeframes (e.g., double for daily). Combine with structure tools like Fibonacci for confluence on event lines.
Behavior, Constraints & Performance
Live bars update lines and labels dynamically if repainting is allowed, but signals confirm on close for stability—flips only trigger post-bar. No higher timeframe calls, so no inherent lookahead, though volume weighting assumes continuous data.
Resources cap at 1000 bars back, 50 lines/labels max; events prune old ones on new flips to stay under budget, with brief extensions for visibility. Arrays or loops absent, keeping it lightweight.
Known limits include lag in extreme gaps (e.g., overnight opens) where bands may not adjust instantly, and VWAP sensitivity to sparse volume in illiquid sessions.
Sensible Defaults & Quick Tuning
Start with SMA 20, multiplier 1.0 for balanced response across majors. For choppy pairs: Lengthen SMA to 30, multiplier 0.8 to tighten bands and cut flips. For trending equities: Shorten to 14, multiplier 1.2 for quicker entries. If traps dominate, enable bands to inspect range compression; for sluggish signals, reduce extension bars to focus on recent events.
What this indicator is—and isn’t
This serves as a visualization and signal layer for trend regimes and breakouts, highlighting sustainment via annotations and risk cues through VWAP—ideal atop price action for confirmation. It is not a standalone system, predictive oracle, or risk calculator; always integrate with broader analysis, position sizing, and stops. Use responsibly as an educational tool.
Disclaimer
The content provided, including all code and materials, is strictly for educational and informational purposes only. It is not intended as, and should not be interpreted as, financial advice, a recommendation to buy or sell any financial instrument, or an offer of any financial product or service. All strategies, tools, and examples discussed are provided for illustrative purposes to demonstrate coding techniques and the functionality of Pine Script within a trading context.
Any results from strategies or tools provided are hypothetical, and past performance is not indicative of future results. Trading and investing involve high risk, including the potential loss of principal, and may not be suitable for all individuals. Before making any trading decisions, please consult with a qualified financial professional to understand the risks involved.
By using this script, you acknowledge and agree that any trading decisions are made solely at your discretion and risk.
Do not use this indicator on Heikin-Ashi, Renko, Kagi, Point-and-Figure, or Range charts, as these chart types can produce unrealistic results for signal markers and alerts.
Best regards and happy trading
Chervolino
