AI-Bank-Nifty Tech AnalysisThis code is a TradingView indicator that analyzes the Bank Nifty index of the Indian stock market. It uses various inputs to customize the indicator's appearance and analysis, such as enabling analysis based on the chart's timeframe, detecting bullish and bearish engulfing candles, and setting the table position and style.
The code imports an external script called BankNifty_CSM, which likely contains functions that calculate technical indicators such as the RSI, MACD, VWAP, and more. The code then defines several table cell colors and other styling parameters.
Next, the code defines a table to display the technical analysis of eight bank stocks in the Bank Nifty index. It then defines a function called get_BankComponent_Details that takes a stock symbol as input, requests the stock's OHLCV data, and calculates several technical indicators using the imported CSM_BankNifty functions.
The code also defines two functions called get_EngulfingBullish_Detection and get_EngulfingBearish_Detection to detect bullish and bearish engulfing candles.
Finally, the code calculates the technical analysis for each bank stock using the get_BankComponent_Details function and displays the results in the table. If the engulfing input is enabled, the code also checks for bullish and bearish engulfing candles and displays buy/sell signals accordingly.
The FRAMA stands for "Fractal Adaptive Moving Average," which is a type of moving average that adjusts its smoothing factor based on the fractal dimension of the price data. The fractal dimension reflects self-similarity at different scales. The FRAMA uses this property to adapt to the scale of price movements, capturing short-term and long-term trends while minimizing lag. The FRAMA was developed by John F. Ehlers and is commonly used by traders and analysts in technical analysis to identify trends and generate buy and sell signals. I tried to create this indicator in Pine.
In this context, "RS" stands for "Relative Strength," which is a technical indicator that compares the performance of a particular stock or market sector against a benchmark index.
The "Alligator" is a technical analysis tool that consists of three smoothed moving averages. Introduced by Bill Williams in his book "Trading Chaos," the three lines are called the Jaw, Teeth, and Lips of the Alligator. The Alligator indicator helps traders identify the trend direction and its strength, as well as potential entry and exit points. When the three lines are intertwined or close to each other, it indicates a range-bound market, while a divergence between them indicates a trending market. The position of the price in relation to the Alligator lines can also provide signals, such as a buy signal when the price crosses above the Alligator lines and a sell signal when the price crosses below them.
In addition to these, we have several other commonly used technical indicators, such as MACD, RSI, MFI (Money Flow Index), VWAP, EMA, and Supertrend. I used all the built-in functions for these indicators from TradingView. Thanks to the developer of this TradingView Indicator.
I also created a BankNifty Components Table and checked it on the dashboard.
Search in scripts for "supertrend"

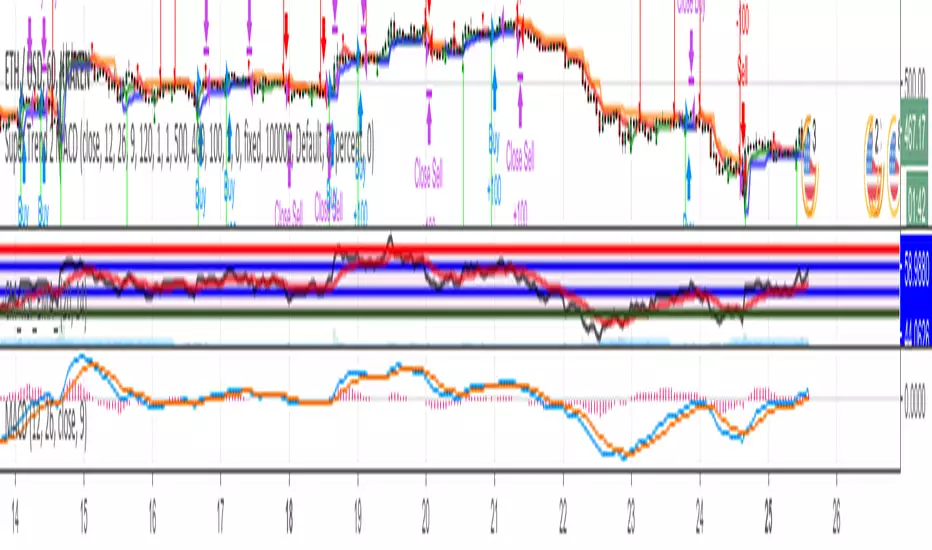
Lorentzian Classification Strategy Based in the model of Machine learning: Lorentzian Classification by @jdehorty, you will be able to get into trending moves and get interesting entries in the market with this strategy. I also put some new features for better backtesting results!
Backtesting context: 2022-07-19 to 2023-04-14 of US500 1H by PEPPERSTONE. Commissions: 0.03% for each entry, 0.03% for each exit. Risk per trade: 2.5% of the total account
For this strategy, 3 indicators are used:
Machine learning: Lorentzian Classification by @jdehorty
One Ema of 200 periods for identifying the trend
Supertrend indicator as a filter for some exits
Atr stop loss from Gatherio
Trade conditions:
For longs:
Close price is above 200 Ema
Lorentzian Classification indicates a buying signal
This gives us our long signal. Stop loss will be determined by atr stop loss (white point), break even(blue point) by a risk/reward ratio of 1:1 and take profit of 3:1 where half position will be closed. This will be showed as buy.
The other half will be closed when the model indicates a selling signal or Supertrend indicator gives a bearish signal. This will be showed as cl buy.
For shorts:
Close price is under 200 Ema
Lorentzian Classification indicates a selling signal
This gives us our short signal. Stop loss will be determined by atr stop loss (white point), break even(blue point) by a risk/reward ratio of 1:1 and take profit of 3:1 where half position will be closed. This will be showed as sell.
The other half will be closed when the model indicates a buying signal or Supertrend indicator gives a bullish signal. This will be showed as cl sell.
Risk management
To calculate the amount of the position you will use just a small percent of your initial capital for the strategy and you will use the atr stop loss or last swing for this.
Example: You have 1000 usd and you just want to risk 2,5% of your account, there is a buy signal at price of 4,000 usd. The stop loss price from atr stop loss or last swing is 3,900. You calculate the distance in percent between 4,000 and 3,900. In this case, that distance would be of 2.50%. Then, you calculate your position by this way: (initial or current capital * risk per trade of your account) / (stop loss distance).
Using these values on the formula: (1000*2,5%)/(2,5%) = 1000usd. It means, you have to use 1000 usd for risking 2.5% of your account.
We will use this risk management for applying compound interest.
> In settings, with position amount calculator, you can enter the amount in usd of your account and the amount in percentage for risking per trade of the account. You will see this value in green color in the upper left corner that shows the amount in usd to use for risking the specific percentage of your account.
> You can also choose a fixed amount, so you will have to activate fixed amount in risk management for trades and set the fixed amount for backtesting.
Script functions
Inside of settings, you will find some utilities for display atr stop loss, break evens, positions, signals, indicators, a table of some stats from backtesting, etc.
You will find the settings for risk management at the end of the script if you want to change something or trying new values for other assets for backtesting.
If you want to change the initial capital for backtest the strategy, go to properties, and also enter the commisions of your exchange and slippage for more realistic results.
In risk managment you can find an option called "Use leverage ?", activate this if you want to backtest using leverage, which means that in case of not having enough money for risking the % determined by you of your account using your initial capital, you will use leverage for using the enough amount for risking that % of your acount in a buy position. Otherwise, the amount will be limited by your initial/current capital
I also added a function for backtesting if you had added or withdrawn money frequently:
Adding money: You can choose how often you want to add money (Monthly, yearly, daily or weekly). Then a fixed amount of money and activate or deactivate this function
Withdraw money: You can choose if you want to withdraw a fixed amount or a percentage of earnings. Then you can choose a fixed amount of money, the period of time and activate or deactivate this function. Also, the percentage of earnings if you choosed this option.
Some other assets where strategy has worked
BTCUSD 4H, 1D
ETHUSD 4H, 1D
BNBUSD 4H
SPX 1D
BANKNIFTY 4H, 15 min
Some things to consider
USE UNDER YOUR OWN RISK. PAST RESULTS DO NOT REPRESENT THE FUTURE.
DEPENDING OF % ACCOUNT RISK PER TRADE, YOU COULD REQUIRE LEVERAGE FOR OPEN SOME POSITIONS, SO PLEASE, BE CAREFULL AND USE CORRECTLY THE RISK MANAGEMENT
Do not forget to change commissions and other parameters related with back testing results!. If you have problems loading the script reduce max bars back number in general settings
Strategies for trending markets use to have more looses than wins and it takes a long time to get profits, so do not forget to be patient and consistent !
Please, visit the post from @jdehorty called Machine Learning: Lorentzian Classification for a better understanding of his script!
Any support and boosts will be well received. If you have any question, do not doubt to ask!

wbburgin_utilsLibrary "wbburgin_utils"
trendUp(source)
Parameters:
source
smoothrng(source, sampling_period, range_mult)
Parameters:
source
sampling_period
range_mult
rngfilt(source, smoothrng)
Parameters:
source
smoothrng
fusion(overallLength, rsiLength, mfiLength, macdLength, cciLength, tsiLength, rviLength, atrLength, adxLength)
Parameters:
overallLength
rsiLength
mfiLength
macdLength
cciLength
tsiLength
rviLength
atrLength
adxLength
zonestrength(amplitude, wavelength)
Parameters:
amplitude
wavelength
atr_anysource(source, atr_length)
Parameters:
source
atr_length
supertrend_anysource(source, factor, atr_length)
Parameters:
source
factor
atr_length

Open Interest Delta with MAs[Binance Perpetuals]!!!!! This indicator only shows Binance Perpetuals Open Interest Delta !!!!!
!!!!! When Binance Spot pair charts is selected, It still shows the perpetual contract Open Interest, if the pair on the chart is tradeble on perpetual contracts. I assume you know what Open Interest is. !!!!!
ZLEMA , Tillson, VAR MAs codes are coming from @KivancOzbilgic => SuperTrended Moving Averages
KAMA code is coming from @HPOTTER => Kaufman Moving Average Adaptive ( KAMA )

stoch supertrd atr 200maThis strategy combines Supertrend, 200 EMA, Stochastic, and an ATR stop loss indicator. For buy conditions, the Stochastic has to be below the 20 level, price has to be above the 200 Ema and the Supertrend has to be green. For sell conditions, it has to be the opposite. the Stochastic has to be above the 80 level, price has to be below the 200 Ema and the Supertrend has to be red.

Open Interest with Bollinger Bands and some moving averages!!! This indicator only shows Binance Perpetuals Open Interest !!!
!!!!! When Binance Spot pair charts is selected, It still shows the perpetual contract Open Interest, if the pair on the chart is tradeble on perpetual contracts. I assume you know what Open Interest is. !!!!!
ZLEMA, Tillson, VAR MAs codes are coming from @KivancOzbilgic => SuperTrended Moving Averages

Golden Swing Strategy - Souradeep DeyThis strategy is developed by Mr. Souradeep Dey. Strategy is based on RSI, Stoch, BB & Supertrend.
Coding by Rajkumar

Bollinger Bands Strategy (MA type)The types of moving averages that Mr. Kıvanç Özbilgiç uses in his indicators and especially the "MACD Reloaded" and "SuperTrended Moving Averages" indicators gave me an idea.
Better results can be obtained in different time frames by increasing the range of Moving averages used in Bollinger Bands.
It is a trial and educational work only.

ATR Trading SetupThis simple script base on function of ATR Trailing Stop (aka SuperTrend) to plot Trading Setup on chart with detail as below:
1. Type of Average True Range (ATR)
+ The function calculate ATR may base on 1 of 3 type of Average: RMA, SMA, EMA
2. Trading Setup
2.1 Long setup
+ SuperTrend is upTrend
+ Entry Long at (or below) last value ATR Trailing Stop of Previous Trend (DownTrend)
+ Stop loss at first value ATR Trailing Stop of now Trend (upTrend)
+ Take profit at first value ATR Trailing Stop of Previous Trend (downTrend)
+ Move stop loss follow ATR Trailing Stop (green dot)
2.1 Short setup
+ SuperTrend is downTrend
+ Entry Short at (or above) last value ATR Trailing Stop of Previous Trend (upTrend)
+ Stop loss at first value ATR Trailing Stop of now Trend (downTrend)
+ Take profit at first value ATR Trailing Stop of Previous Trend (upTrend)
+ Move stop loss follow ATR Trailing Stop (red dot)

Indicators OverviewThis Indicator help you to see whether the price is above or below vwap, supertrend. Also you can see realtime RSI value.
You can add upto 15 stock of your choice.

Super scalpThis is scalp strategy based on the confluence of 3 indicators
ema 9 , supertrend and vwap
when supertrend buy signal is generated and the price is above ema and vwap scalp buy signal is generated
when supertrend sell signal is generated and the price is below ema and vwap scalp sell signal is generated

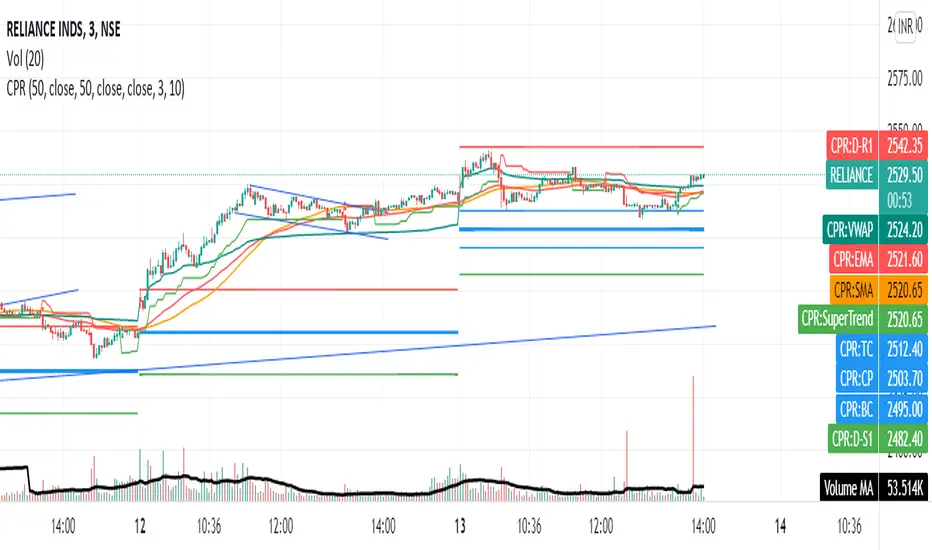
Share market aasan hai CPR with MA & VWAP This script will allow to add CPR with Standard Pivots and 4 Indicators.
Standard Pivot has 9 levels of support and 9 levels of resistance lines. It has CPR , 3 levels of Day-wise pivots , 3 levels of Weekly pivots and 3 Levels of Monthly Pivots .
In Addition to the CPR and Pivot , this script will allow user to Add 4 more Indicators - SMA , EMA , VWAP and SuperTrend as well.
All the Support and resistance levels can be enabled / disabled from settings. It will allow to select multiple combinations of support and resistance levels across 3 levels at any of the 3 time-frames individually and combined.
All 4 Indicators can be can be enabled / disabled from settings. This will allow the indicators to be plotted individually and combined along with any combination of CPR & Pivots .
These number of combinations will allow user to visualize the charts with desired indicators, pivot support & resistance levels on all or any of the 3 time frames.
For Ease of access, listed few points on how the script works..
- CPR and day-wise level 1 & 2 (S1 & R1) enabled by default and can be changed from settings
- Day-wise Level 2 & 3 (S2, R2, S3 & L3) can be enabled from settings
- Weekly 3 levels and Monthly 3 levels can be enabled from settings
- CPR & pivot levels colored in blue lines
- All support levels colored in Green
- All resistance levels Colored in Red
- Day-wise pivot , support & resistance are straight lines
- Weekly pivot , support & resistance are cross (+) lines
- Weekly pivot , support & resistance are circle (o) lines
- SMA , EMA , VWAP and SuperTrend Enabled by Default
- SMA
- EMA
- SuperTrend
HiLo IndicatorNYSE:SPCE
This is an old and simple concept of mine that I am revisiting. It looks similar to the Vortex Indicator but the formulation is different. I was sick and tired of buying late at the top of the peaks, so I wanted to relate the current price to historic highs and lows (you can change how far you want to go back Time Length = tl). The functions are incredible simple:
lo = close -lowest(close,tl)
hi = highest(close,tl) -close
This generates a weaving pattern that shows bullish (lo>hi) and bearish (lo

Big Snapper Alerts R2.0 by JustUncleLThis is a diversified Binary Option or Scalping Alert indicator originally designed for lower Time Frame Trend or Swing trading. Although you will find it a useful tool for higher time frames as well.
The Alerts are generated by the changing direction of the ColouredMA (HullMA by default), you then have the choice of selecting the Directional filtering on these signals or a Bollinger swing reversal filter.
The filters include:
Type 1 - The three MAs (EMAs 21,55,89 by default) in various combinations or by themselves. When only one directional MA selected then direction filter is given by ColouredMA above(up)/below(down) selected MA. If more than one MA selected the direction is given by MAs being in correct order for trend direction.
Type 2 - The SuperTrend direction is used to filter ColouredMA signals.
Type 3 - Bollinger Band Outside In is used to filter ColouredMA for swing reversals.
Type 4 - No directional filtering, all signals from the ColouredMA are shown.
Notes:
Each Type can be combined with another type to form more complex filtration.
Alerts can also be disabled completely if you just want one indicator with one colouredMA and/or 3xMAs and/or Bollinger Bands and/or SuperTrend painted on the chart.
Warning:
Be aware that combining Bollinger OutsideIn swing filter and a directional filter can be counter productive as they are opposites. So careful consideration is needed when combining Bollinger OutsideIn with any of the directional filters.
Hints:
For Binary Options try ColouredMA = HullMA(13) or HullMA(8) with Type 2 or 3 Filter.
When using Trend filters SuperTrend and/or 3xMA Trend, you will find if price reverses and breaks back through the Big Fat Signal line, then this can be a good reversal trade.
Some explanation about the what Hull Moving average and ideas of how the generated in Big Snapper can be used:
tradingsim.com
forextradingstrategies4u.com
Inspiration from @vdubus
Big Snapper's Bollinger OutsideIn Swing filter in Action:

Advanced Market Structure [Rogman]Rogman's Advanced Market Structure Indicator
The Ultimate All-in-One Market Structure Analysis Tool for TradingView
Take your technical analysis to the next level with a comprehensive, professional-grade tool designed for traders who demand precision and clarity in their charts.
🎯 Who Is This For?
ICT/SMC Traders seeking liquidity zones and market structure analysis
Day Traders monitoring session-based price action and kill zones
Swing Traders identifying key higher timeframe levels
Price Action Traders analyzing structure breaks and trend changes
Any Serious Trader wanting a clean, comprehensive market structure overlay
✨ Key Features
📊 Market Sessions Visualization
Track the three major trading sessions with our unique bracket-style display:
Asia, London, and New York sessions are clearly marked
Sessions display as SESSION ════════════ below price action
Smart vertical stacking prevents overlapping when sessions have similar lows
Fully customizable session times for any timezone
Perfect for identifying session highs/lows and optimal kill zone timing
📈 Higher Timeframe (HTF) Levels
Never miss a key level again:
Display Daily and Weekly Open, High, and Low levels
Instant visual reference for HTF support and resistance
Separate color controls for lines and labels
Choose from Solid, Dashed, or Dotted line styles
Essential for determining HTF bias and key decision points
🔄 Automatic Swing Detection
Let the indicator do the heavy lifting:
Auto-detection of swing highs (▼) and swing lows (▲)
Configurable lookback period for sensitivity adjustment
Optional horizontal level lines extending from swing points
Customizable colors, widths, and line styles
Identify potential reversal points and structure levels instantly
💧 Liquidity Zone Mapping
See where the money is hiding:
Automatic identification of buy-side liquidity (above swing highs)
Automatic identification of sell-side liquidity (below swing lows)
Visual zones show where stop losses are clustered
Real-time tracking when liquidity gets swept
Swept zones change color — know when liquidity has been taken
📉 Multi-Method Trend Detection
Three powerful methods to confirm trend direction:
Swing Structure — Based on higher highs/lows or lower highs/lows
EMA — Trend based on price position relative to EMA
Supertrend — Uses the popular Supertrend indicator
Features include:
Optional background coloring for at-a-glance trend identification
Real-time trend status label (UPTREND/DOWNTREND/NEUTRAL)
Customizable colors and transparency
🏷️ HH/HL/LH/LL Labels
Automatic market structure labeling:
HH (Higher High) — Bullish continuation signal
HL (Higher Low) — Bullish continuation signal
LH (Lower High) — Bearish continuation signal
LL (Lower Low) — Bearish continuation signal
Color-coded for instant visual recognition
📋 Information Dashboard
All critical data at a glance:
Current ticker symbol
Trend direction and status
Daily and Weekly bias
Last swing high and low prices
Active liquidity zone count
Positionable in any corner of your chart
🔔 Built-in Alerts
Never miss a key event:
Trend change alerts (Bullish/Bearish)
Swing high/low formation alerts
Set up notifications for critical market structure changes
🎨 Fully Customizable
Every feature can be:
Toggled on/off individually via the Feature Toggles menu
Color customized to match your chart theme
Size adjusted for optimal visibility
Fine-tuned with sensitivity parameters
Organized settings groups make configuration intuitive and fast.
🚀 Why Choose This Indicator?
Feature: Benefit: All-in-One Solution. Replace multiple indicators with one comprehensive tool. Clean Design and Thoughtful visual hierarchy keep charts readable. Smart Overlap Prevention. Session bars automatically stack to avoid visual clutter. Real-Time Updates: All elements update dynamically as the price moves. Professional Quality-Built with best practices in Pine Script v6. Extensive Documentation, clear code comments, and an organized structure
📖 How to Use
Add the indicator to your TradingView chart
Enable/disable features using the Feature Toggles menu
Customize colors and settings to match your preferences
Adjust session times for your timezone
Set up alerts for trend changes and swing formations
Pro Tips:
Use session times to identify optimal entry windows during kill zones
Watch for price sweeping liquidity zones before looking for reversals
Combine HTF bias with lower timeframe entries for higher probability trades
Use swing levels as potential support/resistance for entries and targets
Monitor the dashboard for a quick market assessment before trading
⚠️ Disclaimer
This indicator is provided for educational and informational purposes only. It does not constitute financial advice. Trading involves substantial risk and is not suitable for all investors. Past performance is not indicative of future results. Always conduct your own analysis and consider your financial situation before making trading decisions.

Kalman Hull Trend Score [BackQuant]Kalman Hull Trend Score
Overview
Kalman Hull Trend Score is a trend-strength and regime-evaluation indicator that combines two ideas, Kalman filtering and Hull-style smoothing, then measures persistence of that filtered trend using a rolling score. The goal is to produce a cleaner, more stable trend read than typical moving average tools, while still reacting fast enough to be practical in live markets.
Instead of treating a moving average as a simple line you cross, this indicator turns the filtered trend into an oscillator-like score that answers: “Is the smoothed trend consistently progressing, or is it stalling and degrading?”
Core idea
The indicator is built from two components:
A Kalman-based smoothing engine that estimates price state and reduces noise adaptively.
A Hull-style construction that uses multiple Kalman passes to create a responsive, low-lag trend filter.
Once the Kalman Hull filter is built, a persistence score is calculated by comparing the current Kalman Hull value to many past values. The result is a trend score that rises in sustained trends and compresses or flips during deterioration.
Why Kalman instead of standard smoothing
Traditional moving averages apply fixed smoothing rules regardless of market conditions. A Kalman filter behaves differently, it is designed to estimate an underlying state in noisy data, adjusting how much it “trusts” new price information versus prior estimates.
This script exposes that behavior through two key controls:
Measurement Noise: how noisy the observed price is assumed to be.
Process Noise: how much the underlying state is allowed to evolve from bar to bar.
Together, these settings let you tune the balance between smoothness and responsiveness without relying on blunt averaging alone.
Kalman filter mechanics (conceptual)
Each update cycle follows the classic structure:
Prediction: assume the state continues, and expand uncertainty by process noise.
Update: compute Kalman Gain, then blend the new price observation into the estimate.
Correction: reduce uncertainty based on how much the filter accepted the new information.
When measurement noise is higher, the filter becomes more conservative, smoothing harder. When process noise is higher, the filter adapts faster to regime changes, but can become more reactive.
Check out the original script:
Kalman Hull construction
The “Hull” component is not a standard HMA built from WMAs. Instead, it recreates the Hull idea using Kalman filtering as the smoothing primitive. The structure follows the same intent as HMA, reduce lag while keeping the line smooth, but does it with Kalman passes:
Apply Kalman smoothing over multiple effective lengths.
Combine them using the Hull-style weighting logic.
Run the combined output through another Kalman pass to finalize smoothing.
The result is a Kalman Hull filter that aims to track trend with less jitter than raw price, and less lag than slow averages.
Another Kalman Hull with Supertrend
Trend scoring logic
The trend score is computed by comparing the current Kalman Hull value to past Kalman Hull values over a fixed lookback range (1 to 45 bars in this script):
If current kalmanHMA > kalmanHMA , add +1
If current kalmanHMA < kalmanHMA , add -1
This produces a persistence score rather than a simple direction signal. Strong trends where the filter keeps advancing will accumulate positive comparisons. Weak trends, chop, or reversals will cause the score to flatten, decay, or flip negative.
Interpreting the score
Read the score as trend conviction and persistence:
High positive values: bullish persistence, the filtered trend is progressing consistently.
Low positive values: trend exists but is fragile, progress is slowing.
Near zero: indecision, range behavior, frequent challenges to structure.
Negative values: bearish persistence or sustained deterioration in the filtered trend.
The rate of change matters:
Score expansion suggests trend is gaining traction.
Score compression often signals consolidation or exhaustion.
Fast flips usually accompany regime transitions.
Signal thresholds and regime transitions
User-defined thresholds convert the score into regimes:
Long threshold: score must exceed this level to confirm bullish persistence.
Short threshold: a crossunder of the score triggers bearish regime transition.
This is intentionally conservative. Long bias is maintained while the score holds above the long threshold. Short transitions are event-triggered on breakdown via crossunder, helping avoid constant flipping during minor noise.
Signals are only plotted on regime changes (first bar of the flip), keeping them clean for alerts and backtests.
Visual presentation
The indicator provides multiple layers depending on how you want to use it:
Kalman Hull Trend Score oscillator, color-coded by active regime.
Optional Kalman Hull filter plotted on the price chart for structure context.
Optional threshold reference lines for quick regime mapping.
Optional candle coloring and background shading for instant readability.
You can run it as a pure score panel or as a combined panel + on-chart trend overlay.
How to use in practice
Trend filtering
Favor long setups when the score remains above the long threshold.
Reduce directional aggression when score compresses toward zero.
Treat a short-threshold breakdown as a regime risk event, not just a signal.
Trend quality assessment
Rising score supports continuation trades and adds confidence to breakouts.
Flat or falling score warns that trend persistence is fading.
If price trends but score fails to expand, trend may be weak or liquidity-driven.
Trade management
Use the Kalman Hull line as dynamic structure reference on chart.
Use score deterioration to scale out before a full regime flip.
Use regime flips as confirmation for bias shifts rather than prediction.
Tuning guidelines
Measurement Noise
Higher: smoother filter, fewer false shifts, slower to adapt.
Lower: more responsive, more sensitive to microstructure noise.
Process Noise
Higher: adapts quicker to sudden changes, but can become twitchy.
Lower: steadier state estimate, but slower during sharp regime transitions.
A practical approach is to first tune measurement noise until the Kalman Hull line matches the “clean trend structure” you want, then adjust process noise to control how quickly it reacts when the regime genuinely changes.
Summary
Kalman Hull Trend Score transforms a Kalman-based Hull-style trend filter into a quantified persistence oscillator. By combining adaptive Kalman smoothing with low-lag Hull logic and a rolling comparison score, it provides a cleaner read on trend quality than basic moving averages or single-condition trend tools. It is best used as a regime filter, trend strength gauge, and structure-aware trade management layer.

MINI Lead Osc v2_ CCI_ Impulse_ REG🔹 MINI Lead Osc v2 — Momentum, Impulse & Early Reversal Tool
MINI Lead Osc v2 is a leading momentum oscillator designed to detect early shifts in market strength, impulse exhaustion, and potential reversals before they become obvious on price.
This indicator is part of the ICT Suite ecosystem and is engineered to work in confluence with:
Regression SuperTrend (WAIT)
Liquidity Oscillator (Structure & Bias)
Used together, they form a complete top-down trading framework.
⚙️ Core Logic
MINI Lead Osc v2 blends multiple engines into a single clean signal:
• CCI + RSI slope momentum
• ATR volatility shift
• Pivot-based divergence detection
• Adaptive Sensitivity+ engine
• Regression channel (linreg + RMSE bands)
The output is a normalized lead line that reacts before classic lagging indicators.
🚀 What This Indicator Is Best For
✔ Early trend continuation signals
✔ Detecting impulse starts, weakness, and distribution
✔ Filtering noise during ranges
✔ Momentum confirmation for pullback entries
✔ Spotting divergence without repainting
This is not a standalone “buy/sell spam” indicator — it is a decision-quality tool.
🔁 How to Use (Recommended Setup)
For best results, use MINI Lead Osc v2 together with:
1️⃣ Regression SuperTrend (WAIT)
→ Defines dominant trend & market regime
→ Filters counter-trend signals
2️⃣ Liquidity Oscillator (Structure)
→ Confirms break → pullback → continuation logic
→ Adds HTF bias & session context
3️⃣ MINI Lead Osc v2 (this script)
→ Times entries
→ Detects early momentum shifts
→ Confirms impulse quality
📌 Trade only when all three align.
🧠 Important Notes
• Signals are non-repainting (bar-close confirmed)
• Designed for discretionary trading, not automation
• Works best on 5m – 15m – 1h timeframes
• Crypto, Futures, and FX friendly
⚠️ Disclaimer
This indicator is for educational and analytical purposes only.
It does not constitute financial advice.
Always manage risk and confirm with price action.

Trend Sniper ProTrend Sniper Pro - Advanced Trend & Breakout Strategy
## 🚀 Overview
Trend Sniper Pro is not just another indicator; it is a professional trading system designed to filter out market noise and capture only high-probability moves. By combining **Price Action**, **Volume Confirmation**, and **Multi-Timeframe Analysis**, it operates with "sniper" precision.
It avoids the trap of "overtrading"—a trader's worst enemy—by only pulling the trigger when conditions are perfect.
💡 **IMPORTANT TIP:** This strategy yields the best results on **Stocks** (e.g., US Equities, BIST) on **DAILY** charts. It is optimized for patient investors looking to catch major trends.
## 🔑 Key Features
* **Dual-Layer Trend Filter**: Utilizes a modified SuperTrend alongside a robust Moving Average Alignment system to filter out false signals.
* **Smart Volume Validation**: Rising prices without volume are often traps. Signals are only generated when accompanied by significant volume volume.
* **Dynamic Risk Management**: Automatically plots **Risk/Reward Boxes** and **Trailing Stop Lines** (Teal for Bullish, Red for Bearish) upon entry.
* **Yearly High/Low Filter**: A macro filter that prevents you from buying at historical tops or selling at historical bottoms.
* **Compounding**: Automatically optimizes position size to compound gains during strong trends.
## 🆕 Crypto Mode
A special mode has been added for the more volatile Crypto markets. When you check the **"Crypto Mode"** box in the settings, the strategy applies much stricter filters to filter out "pump & dump" wicks and noise.
## 🛠️ How It Works
1. **Trend Alignment**: If the long-term trend is not in your favor, no trade is taken.
2. **Breakout**: Detects a breakout when Volatility (ATR) and Volume thresholds are exceeded.
3. **Entry Trigger**: A position is opened only when Price, Volume, and Trend align perfectly.
4. **Exit**: Positions are closed via ATR-based Stop Loss or a profit-locking Trailing Stop.
## ⚙️ Settings Guide
* **Crypto Mode**: Check this box for Cryptocurrencies. Leave unchecked for Stocks.
* **Main Settings**: Adjust SuperTrend sensitivity.
* **Risk Management**: Personalize your Stop Loss multiplier and profit targets.
* **Visual Settings**: Toggle target lines or boxes on/off.
## ⚠️ Disclaimer
This script is for educational purposes only and does not constitute financial advice. Past performance is not indicative of future results. Always backtest strategies on your specific pairs and timeframes before live trading.
---
*Developed for professional traders looking for a systematic edge in trending markets.*

Time & Price Confirmation (TPC)This one i am in the midst of trying to make better but for now its actually making money.
Core Concept:
Uses SuperTrend on two timeframes: Higher Timeframe (HTF) for trend direction and Lower Timeframe (LTF) for entry timing
Only signals trades when BOTH timeframes align
Key Components:
HTF Time (Higher Timeframe) - Checks if the main trend is strong:
🟢 Healthy = Strong trend, good momentum
🟠 Slowing = Trend weakening but still valid
🔴 Tired = Trend exhausted, avoid trading
LTF Confirm (Lower Timeframe) - Waits for price confirmation via:
SuperTrend flip (trend reversal)
Displacement candle (large range breakout)
Strong momentum move
Action Signals:
🚀 ENTER = Both HTF healthy + LTF confirmed (best setup)
⏳ HOLD = HTF still good but waiting for LTF confirmation
⏹️ NO TRADE = HTF tired or conditions not met

Volatility Trend FollowerThe script combines several classic technical analysis techniques:
SuperTrend / Adaptive Band - The main idea comes from the SuperTrend indicator, which uses ATR (Average True Range) to create a trailing band that adapts to volatility
ATR (Average True Range) - A volatility measure developed by J. Welles Wilder Jr.
EMA (Exponential Moving Average) - Used as a global trend filter
Heikin Ashi - An option to smooth prices and reduce noise

Greater Moving AverageThe purpose for this indicator is to function as a comprehensive market-state detector, with the primary goal of avoiding a market crash.
Mendoza Lines (V-pattern detection) identify early crash conditions and warn when market structure becomes unstable.
RSI/volume-shaded candles + Supertrend confirm momentum and trend, creating a unified system to avoid major drawdowns.
Enhanced Wyckoff ranges with ATR.
Mendoza lines identify abrupt V-shaped reversals which often precede high-risk crash structures. By tracking both the formation and resolution of these patterns across multiple timeframes, the indicator provides early warning signals when the market is entering unstable territory, allowing traders to step aside before liquidity collapses or structural breakdowns begin.
Ideal configurations use Heikin Ashi to smooth out candle structure. Observe SPX on a Weekly Chart, which correctly identifies exits and entries during the 2001 and 2009 crashes. On a 6 hour chart, the Tariff low is correctly identified. The improved VWAP uses a cumulative metric rather than the built in ta.vwap calculation, and functions as a macro low beacon when crossed with the 200 EMA. Historically, these crosses have aligned closely with macro cycle lows.
To round out the system, the indicator overlays RSI-based and volume-weighted candle shading to reflect internal momentum and real buying/selling pressure directly on the chart, making shifts in strength immediately visible. A Supertrend confirmation layer acts as the final filter, smoothing noise and verifying trend direction before decisions are made.

Estrategia Trend Following: 52w/26w BreakoutThis is a classic long-term Trend Following strategy, heavily inspired by the Donchian Channel system and the legendary "Turtle Trading" rules. It is designed to capture major market moves (bull runs) while filtering out short-term market noise and volatility.
This script is ideal for investors and swing traders who prefer a "hands-off" approach, looking to catch large trends rather than day-trading small fluctuations.
How it Works:
1. Entry Condition (The Breakout):
52-Week High: The strategy enters a Long position when the price breaks above the highest high of the last 252 trading days (approx. 1 year).
SuperTrend Filter: An additional filter using the SuperTrend indicator ensures that the breakout is supported by positive momentum, helping to reduce false signals during choppy lateral markets.
2. Exit Condition (The Trailing Stop):
26-Week Low: The strategy ignores short-term corrections. It only closes the position if the price closes below the lowest low of the last 126 trading days (approx. 6 months).
This wide stop allows the trade to "breathe" and stay open during significant pullbacks, ensuring you stay in the trend for as long as possible.
Features & Settings:
Customizable Lookback Periods: You can adjust the Entry (default 252 days) and Exit (default 126 days) periods in the settings menu.
Visual Aids:
Blue Line: Represents the 1-Year High (Entry Threshold).
Red Line: Represents the 6-Month Low (Dynamic Stop Loss).
Channel Shading: Visualizes the trading range between the high and low.
Labels: Clearly marks "BUY" and "EXIT" points on the chart.
Recommended Usage:
Timeframe: Daily (1D). This logic is designed for daily candles.
Assets: Works best on assets with strong trending characteristics (e.g., Bitcoin/Crypto, Tech Stocks, Indices like SPX/NDX, and Commodities).
Patience Required: This strategy generates very few signals. It may stay quiet for months and then hold a position for over a year.
