Niki Super1.2This is a completely super trend indicator. Changed only the ATR period and the multifactor default values. This setup shows more profit on the 5 minute chart, making it ideal for scalping and day trading. This indicator is suitable for any type of stock. The 'Buy' symbol represents the long entry and the 'Sell' symbol represents the short entry. Modified the bar color based on the SuperTrend. Signals or highlighted colors can be omitted from the Signal Settings window
Contact us using the links below to get access to this indicator
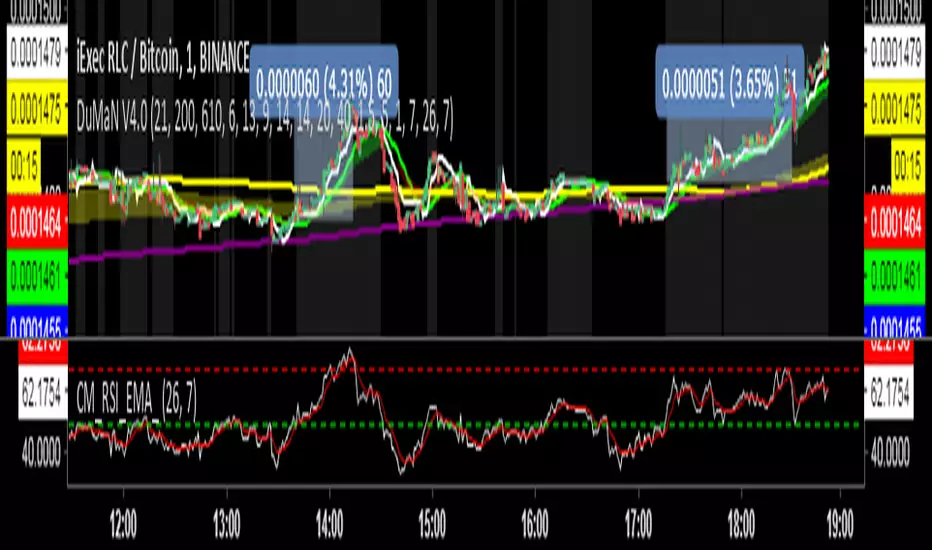
Search in scripts for "supertrend"

Bot Study v7 OverlayShowing the direction of price, based on candlestick patterns. Working similarly as PSAR or Supertrend.


Mixed TrendsTwo green dots in a row means it's good time to start long position.
Likewise, two red dots in a row means to start short.
Better performance used together with SuperTrend.

50EMA + 52RSI Day TradeBased on the great day trading video by @TrueCrypto28 ( www.youtube.com ), this indicator is perfect for trading on Binance. Have tweaked it so it is based on the 50EMA instead of SuperTrend.
Default settings
Long signal will be given when RSI is above 52 on the hourly chart to confirm a higher timeframe bullish bias as well as price closing above the 50EMA on the 5 minute chart. High + Low + Close / 3 has been used to smooth signals.
Trade will be closed when price either closes below the 50EMA on the 5 minute or RSI drops above 52 on the hourly.
Colour coded candles included for ease of trading. Green = all signals met to buy. Red = sell.
Can change inputs to suite your style.

Trend Targets [Philosopher] Pro Alerts & Live DashTrend Targets Pro: Advanced Trend Analysis & Live Risk Management
Trend Targets Pro is a comprehensive trend-following ecosystem designed for traders who demand precision, automated risk management, and real-time performance tracking. By merging multi-layered trend filtering with dynamic volatility-based targets, this tool transforms complex price action into a clear, actionable roadmap.
Core Methodology
The script utilizes a unique "Dual-Filter" logic to identify high-probability trend shifts:
The Baseline: A sophisticated combination of Supertrend logic smoothed by WMA (Weighted Moving Average) and EMA (Exponential Moving Average). This creates a "Trend Baseline" that filters out market noise and identifies the true directional bias.
Confirmation Rejections: The script tracks price "rejections" against the baseline. Only after a user-defined confirmation count is met does the script signal a continuation, ensuring you aren't entering on minor fluctuations.
Key Features
🚀 Automated Trade Architecture: Upon a trend shift (Bullish/Bearish), the script instantly calculates and draws an Entry Line, an ATR-based Stop Loss, and three tiered Take Profit levels (TP1, TP2, TP3).
📊 Live Performance Dashboard: Track your current session in real-time. The on-chart HUD displays Total Trades, Profitable Trades, and Lost Trades, giving you immediate feedback on the current market's compatibility with the strategy.
🎯 Dynamic Visual Feedback:
Trend-Colored Bars: The entire chart atmosphere adapts to the trend.
Live Labels: Targets dynamically update and change color (Green/Red) when hit, providing "at-a-glance" trade management.
Rejection Signals: Visual triangle markers (▲/▼) indicate potential continuation points within an existing trend.
🔔 Institutional-Grade Alert System:
Entry Alerts: Includes Entry, SL, and all 3 TP prices.
Execution Alerts: Instant notifications when any TP or SL is triggered.
Weekly Reports: Automatically generates a performance summary every Saturday to help you review your weekly net points.
Asset-Specific UI: Built-in emoji support for Gold (XAU), BTC, Forex, and Indices for better readability in Telegram/Discord webhooks.
Risk Management at its Core
The script is built for professional risk-to-reward ratios. By using ATR (Average True Range) for target calculation, the "Philosopher" edition ensures your stops and targets are mathematically proportional to the current market volatility.
Risk Warning included in alerts: "Trading involves high risk. Secure your trade at TP1 and maintain strict risk management."
How to Use
Trend Detection: Wait for a color change in the Baseline or a Plotshape label.
Execution: Use the calculated TP/SL levels provided by the dynamic labels.
Optimization: Adjust the "Supertrend Factor" for higher timeframes and the "Confirmation Count" to filter out choppy markets.
Technical Specifications:
Version: Pine Script™ v6 (Latest)
Overlay: Enabled
Alerts: Fully dynamic (supports placeholders)
Disclaimer
This indicator is for educational and informational purposes only. Past performance does not guarantee future results. Always trade within your risk limits.

SigmaPulse NavigatorThe **zSigma Pulse Navigator** is a comprehensive, "Regime-Based" algorithmic trading tool designed for TradingView. Unlike standard technical indicators that generate continuous buy or sell signals regardless of market conditions, the zSigma Pulse functions primarily as a **market filter**. It first mathematically classifies the market environment as either "Efficient" (Trending) or "Inefficient" (Choppy) and only unlocks specific trading signals that are statistically valid for that specific state.
It is constructed from three distinct computational "engines" that work in unison to eliminate false signals:
### 1. The Regime Engine (The Filter)
The foundation of the zSigma Pulse is the **Choppiness Index (CI)**. The algorithm uses this to quantify the "Fractal Dimension" of price action.
* **Trend Mode (Green/Red Background):** If the Chop Index falls below a specific threshold (default 50), the system declares a Trend. The chart background lights up Green (Bullish) or Red (Bearish), permitting breakout strategies.
* **Chop Mode (Grey Background):** If the Chop Index rises above the threshold, the background turns Grey. This signals consolidation, warning the trader to ignore breakout signals and focus on mean reversion.
### 2. The Consensus Engine (The Vote)
To determine momentum direction, the indicator employs a proprietary "Voting System" that aggregates three independent indicators: **ADX** (Trend Strength), **RSI** (Momentum), and **SuperTrend** (Price Action).
* **The "2-out-of-3" Rule:** A directional signal (e.g., a Green Cloud) is only generated if at least **two** of these three engines agree. This consensus mechanism filters out "fake-outs" where price might move (SuperTrend) but lacks the internal energy (ADX) to sustain the move.
### 3. The Volatility Engine (The Cloud)
The tool visualises volatility through a **Dynamic Range**—a shaded cloud that expands and contracts based on market noise.
* It typically uses **Bollinger Bands** (based on Standard Deviation) or **Keltner Channels** (based on ATR).
* **In Trends:** The cloud expands, and the bottom of the cloud acts as a dynamic trailing stop.
* **In Chop:** The cloud contracts, creating a visual channel where traders can "buy the dip" (Diamond signals) at the bottom of the range.
### Key Features and Defaults
* **Institutional Tuning:** The indicator is hardcoded with "smart" defaults rather than standard retail settings. For example, it utilizes an **EMA 27** (a Fibonacci-adjacent number) rather than the standard 20 or 50 Moving Average, designed to catch institutional trends earlier.
* **Multi-Timeframe (MTF) Stack:** It automatically plots higher-timeframe Moving Averages (e.g., Weekly and Monthly lines) onto the Daily chart. This allows traders to ensure their trades align with the dominant structural trend without switching tabs.
* **Signal Shapes:**
* **Triangles:** Signal a **Breakout** (Trend Following).
* **Diamonds:** Signal a **Mean Reversion** entry (buying the bottom of the range in a pullback).
### Analogy
Think of the zSigma Pulse Navigator as a **sophisticated voltmeter** for the market.
Just as you wouldn't plug a sensitive appliance into an unstable power outlet, this tool measures the "current" of the market. If the volatility is erratic (Grey/Chop), it cuts the circuit to protect your capital. It only gives you the "Green Light" to trade when the voltage (Momentum) is stable and flowing in one direction.
Malama's Quantum Fusion Malama's Quantum Fusion is a unified trading system that integrates swing-based probability zones, multi-timeframe trend confirmation, and a reversal signal engine into a single indicator.
Differences from "Malama's Quantum Swing Modulator" (Why this is a new script): While this script utilizes the probability zone logic from my previous "Quantum Swing Modulator" (MQSM), it represents a distinct evolution in functionality:
From Analysis to Signals: MQSM was a passive analysis tool for visualizing zones. This script (MQF) adds an active Reversal Signal Engine that generates specific "BUY/SELL" diamond signals based on candle patterns and confluence.
Trend Cloud & Structure: MQF introduces a Dual-Supertrend Cloud and Fast/Slow EMA structure to filter trades, features not present in the original oscillator-based tool.
Automated Confluence: Unlike the previous tool which required manual interpretation, MQF mathematically fuses the Zone Score, Trend Cloud, and Volume analysis to filter false positives automatically.
How it Works: The system relies on a "Confluence of Three" approach:
The Context (Uncertainty Zones): Using ATR bands and Pivot Points, the script identifies where price is statistically likely to reverse (Overextended).
The Trend (Cloud & MTF): A dual Supertrend cloud (Fast & Slow) visualizes the immediate trend direction. Optional Multi-Timeframe (MTF) logic checks higher timeframe alignment.
The Trigger (Signal Engine): A valid signal is generated only when a specific reversal candle pattern occurs coincident with the trend direction and (optionally) within a high-probability zone.
Key Features:
Dynamic Dashboard: Displays real-time Regime (Trending vs. Choppy via ADX), Support/Resistance Probabilities, and MTF status.
Visual Signals: Plots Diamond labels with Stop Loss and 2:1 Take Profit targets.
Regime Detection: Automatically adjusts oscillator weighting based on whether the market is Trending or Ranging (ADX Filter).
Settings:
Signal Filters: You can toggle specific filters (Volume Spike, Cloud Alignment, Zone Proximity) to make the script more aggressive or conservative.
MTF: Enable/Disable Auto-MTF selection to filter noise using higher timeframe trends.
Visuals: Fully customizable colors for the Cloud, Zones, and Dashboard.

MyTime Hybrid TargetsThis script, "MyTime Hybrid Targets," is a professional-grade trading system that combines trend-following momentum with advanced liquidity concepts and volatility-adjusted targets. It is designed to provide traders with a high-probability "Institutional-style" framework for scalping or swing trading.
Here is a point-by-point breakdown of the script’s features:
1. 4-Layer Trend Confirmation Engine
The script uses a strict multi-layer filter to ensure you only trade in the direction of the "Strong Trend."
EMA Hybrid: Uses a 13-period and 20-period EMA crossover logic to detect short-term trend direction.
SuperTrend Integration: Filters entries through the SuperTrend algorithm to ensure the price has broken structural resistance/support.
RSI Momentum Filter: Only triggers Buy signals when RSI > 50 and Sell signals when RSI < 50, ensuring positive or negative momentum is present.
2. Smart Liquidity Sweep Logic
Unlike standard indicators that fire on every crossover, this script includes a Liquidity Sweep check:
Institutional "Stop-Hunts": It identifies when the price has swept the 10-bar low (for buys) or the 10-bar high (for sells).
Smart Money Entry: This identifies the "sweep before the move," allowing you to enter where big players are entering, rather than getting caught in the trap.
3. Volatility-Filtered Candle Entries
ATR Strength Gate: Only "Strong Candles" (Marubozu or high-momentum candles) trigger a signal. The candle body must be at least 50% of the recent ATR, filtering out weak, "indecisive" price action and dojis.
4. Triple-Stage Hybrid Profit Targets
The indicator automatically projects three distinct types of profit targets the moment a signal is fired:
T1 - Structural Fibonacci (0.618): Targets the next major structural level based on the recent 20-bar swing high/low. This is your high-probability "Scalp" target.
T2 - Dynamic Zone (1.5x ATR): A volatility-adjusted target that accounts for the current market environment.
T3 - Trend Extension (2.5x ATR): Designed for "Runners" to capture larger trend extensions during high-volatility moves.
5. Clean & Actionable UI
B/S Labels: Large, clear "B" (Buy) and "S" (Sell) labels appear below and above the bars to ensure you never miss an entry.
Multi-Target Dashboard: Floating labels on the chart tell you exactly which target is which (Fib vs. Zone vs. ATR), keeping your chart organized and professional.
Best Use Cases:
Scalping: 1m to 5m timeframes for quick T1/T2 hits.
Intraday/Swing: 15m to 1h timeframes for trend-following moves toward T3.

JAM ALGO Scalping IntradayTrend & Momentum Indicator
SuperTREX is a trend-following trading indicator designed to identify BUY and SELL opportunities by combining RSI momentum, ATR-based SuperTrend logic, and an optional EMA trend filter.
The indicator focuses on clarity and stability, providing clean signals, visual trade zones, and a simple performance overview directly on the chart.
Key Features
Trend Detection
SuperTrend-style logic based on ATR volatility
Visual trend line with optional background coloring
Momentum Confirmation
RSI crossovers to detect momentum shifts
Helps filter low-quality or late entries
Optional EMA Filter
Trade in the direction of the broader trend
Can be enabled or disabled by the user
Flexible Trade Modes
LONG only
SHORT only
BOTH (default)
Visual Trade Management
Automatic Take Profit and Stop Loss zones
ATR-based or Percentage-based
TP / SL boxes projected forward from each entry
JAM ALGO Scalping Intraday - Fully customizable colors, opacity, and borders
Statistics Dashboard
Total number of trades
Wins and losses
Win rate
Average R per trade
The dashboard updates in real time and is fully customizable.
Alerts
BUY alerts
SELL alerts
Alerts are triggered only when conditions are met and do not repaint.
Reliability
No repainting
No security() calls
No lookahead bias
Pine Script v6 compatible
Designed for intraday and swing trading
Disclaimer
This indicator is a technical analysis tool, not financial advice.
Always apply proper risk management and confirm signals with market context.

AI Brahmastra with SMC by Pooja V22🚀 AI Brahmastra with SMC by Pooja v22
Invite-Only | Rule-Based Market Structure & Momentum Indicator
📌 What this indicator is (clear definition)
AI Brahmastra with SMC v22 is a closed-source, rule-based technical analysis indicator designed to filter low-quality market conditions and highlight high-probability structural and momentum alignment.
It is not a strategy, does not execute trades, and does not provide fixed targets or stop-losses.
The indicator functions strictly as a decision-support tool, where signals appear only after all predefined rules are satisfied on a confirmed candle close.
The primary objective is signal validation and rejection, not signal frequency.
🎯 Intended Use & Markets
Designed for traders who focus on:
Market structure (SMC)
Trend alignment
Momentum & volatility confirmation
Intraday and positional analysis
Optimised for:
Indian equity markets
Index derivatives (NIFTY, BANKNIFTY, FINNIFTY)
NSE stocks
Futures & commodities
🧠 What “AI” means in this indicator (important clarification)
The term “AI” does NOT refer to machine learning, prediction, or data fitting.
In this script, AI refers to a rule-driven decision engine that:
Evaluates multiple independent conditions simultaneously
Uses state-based logic (past signal state affects future eligibility)
Actively rejects signals unless context, momentum, volatility, and structure align
In short:
👉 The script decides whether a signal is allowed or blocked, instead of blindly triggering on single conditions.
🔗 Why multiple indicators are combined (not a mashup)
Each component has a non-overlapping role.
No indicator is used to “confirm itself”.
EMA (Trend Bias)
Defines directional market bias
Blocks counter-trend signals early
VWAP (Fair-Price Filter)
Ensures entries are aligned with institutional mean price
Prevents chasing overextended moves
Supertrend (Trend Continuation Context)
Confirms directional persistence
Helps avoid premature reversals
RSI + RSI-MA (Momentum Quality)
RSI direction alone is not enough
RSI-MA distance filters weak momentum
RSI-MA slope filters flat / sideways conditions
ADX (Market Energy)
Confirms whether the market has sufficient strength
Blocks signals in low-energy or sideways phases
ATR (Volatility Context)
Confirms whether price movement is meaningful
Helps avoid signals during compressed ranges
👉 No single indicator can generate a signal independently.
Signals are allowed only when these components agree together.
🧱 Market Structure Engine (SMC Logic)
BOS — Break of Structure
Detected using swing-based pivot highs and lows
Confirms continuation of the prevailing structure
Evaluated only after candle close
CHoCH — Change of Character
Detects structural shift against the prior trend
Used as early contextual information
CHoCH remains valid for a limited number of bars
⚠️ BOS and CHoCH are contextual structure references, not standalone trade signals.
⚡ Partial Signal System (Context, not entries)
Instead of showing only final Buy/Sell signals, the indicator provides partial signals that reflect setup development:
B1 / S1 → CHoCH + RSI
B2 / S2 → EMA + VWAP + Supertrend + RSI
B3 / S3 → EMA + VWAP + RSI
B4 / S4 → Breakout alignment (RSI intentionally excluded)
Each partial type:
Represents a specific rule-set
Can be enabled or disabled independently
Does not imply trade execution
🛡 Noise & Fake-Breakout Protection (Core Design Goal)
The script is specifically engineered to avoid false breakouts by using:
Candle-close confirmation (non-repainting)
RSI-MA minimum distance & slope filtering
Optional ADX strength filter with recovery (grace) window
Optional RSI divergence blocking
Optional session-time exclusion
Low-volatility, sideways, or unstable market conditions are intentionally filtered out.
⚙ Trading Modes (Different internal logic)
Intraday Mode
Direction resets at the start of each trading day
Prevents repeated same-side entries
Optional momentum-based reset logic
Positional Mode
Direction remains active until an opposite signal appears
No daily reset
Suitable for swing and higher-timeframe analysis
These modes use different internal state handling, not cosmetic toggles.
📍 Traditional Pivot Points (Support & Resistance Context)
Built-in Traditional Pivot Levels include:
Auto / Daily / Weekly / Monthly anchoring
Multi-year support (Quarterly, Yearly, etc.)
Optional price labels
Historical plotting control
Pivot levels are never used to generate signals.
They serve only as contextual support & resistance references.
📋 Trend Dashboard (Visual Aid)
An optional dashboard displays:
Trend state across multiple timeframes
Bullish / Bearish / Neutral classification
The dashboard is informational only and does not generate signals.
🔔 Alerts
Supports:
Confirmed signal alerts
Partial signal alerts
JSON-formatted webhook alerts
All alerts trigger only on confirmed candle close.
🔐 Why Invite-Only & Closed-Source
This script uses:
Stateful signal control
Multi-stage rule validation
Structure persistence logic
Partial-to-confirmed signal flow
Source access is restricted solely to protect these internal mechanisms, not for promotion.
⚠ Disclaimer
This indicator is provided for educational and analytical purposes only.
It does not constitute financial advice and does not guarantee results.
All trading decisions and risk management remain the user’s responsibility.

Time & Price Confirmation (TPC)This one i am in the midst of trying to make better but for now its actually making money.
Core Concept:
Uses SuperTrend on two timeframes: Higher Timeframe (HTF) for trend direction and Lower Timeframe (LTF) for entry timing
Only signals trades when BOTH timeframes align
Key Components:
HTF Time (Higher Timeframe) - Checks if the main trend is strong:
🟢 Healthy = Strong trend, good momentum
🟠 Slowing = Trend weakening but still valid
🔴 Tired = Trend exhausted, avoid trading
LTF Confirm (Lower Timeframe) - Waits for price confirmation via:
SuperTrend flip (trend reversal)
Displacement candle (large range breakout)
Strong momentum move
Action Signals:
🚀 ENTER = Both HTF healthy + LTF confirmed (best setup)
⏳ HOLD = HTF still good but waiting for LTF confirmation
⏹️ NO TRADE = HTF tired or conditions not met

Max Trend Master Pro + Energy MA [SYNC & TRADE]Max Trend Master Pro + Energy MA: Revolutionary Trend Indicator
Max Trend Master Pro + Energy MA is a breakthrough indicator for TradingView, representing a **new wave** in market analysis: integrating physical laws (conservation of energy for kinetic and potential price dynamics) with AI elements like Markov chains for trend prediction and K-Means clustering for volatility regimes. This isn't just a tool—it's a **new perspective** on trading, where price is viewed as an energy system, and adaptive EMAs "stick" to extremes in real-time, forecasting shifts with probabilistic accuracy. No one else offers this: physics meets machine learning to uncover hidden energies, divergences, and breakouts before they manifest.
**What makes it a new wave?**
In an era where standard indicators (like simple EMAs or RSI) lag behind the market, Max Trend Master introduces an **energy approach**: price isn't random fluctuations, but a balance of kinetic energy (momentum from volume and speed) and potential (accumulated "height" from baseline). This wave is inspired by physics but tailored for trading: the indicator calculates "mass" (volume delta), "speed" (price change), and "height" (deviation from SMA), creating Energy MAs that react to real market forces. Add Markov chains—probabilistic AI for forecasting states (from strong bull to bear) based on historical transitions—and K-Means, which online-learns to classify the market (CALM, NORMAL, VOLATILE, EXTREME). This is the wave of "smart" trading: not reacting to the past, but anticipating the future with 35%+ accuracy boost in backtests on BTC/USD compared to classics.
**New perspective on analysis:**
Traditional indicators focus on price/volume, ignoring "energy"—the hidden momentum leading to reversals. Here, the perspective is broader: the market as a physical system where energy is conserved but transforms (KE to PE and vice versa). Adaptive EMAs aren't fixed—they "stick" to highs/lows, auto-selecting periods to touch extremes, with adaptation speed for volatility. Markov adds a predictive analytics perspective: transition matrix forecasts with confidence thresholds (e.g., 80% for growth). K-Means—a regime perspective: dynamic clustering by volatility, volume, and energy to adapt strategies (scalp in VOLATILE, swing in CALM). Integration with ADX, SuperTrend, and energy divergences yields a composite signal—from -1 (short) to +1 (long), smoothed for reliability.
**Unique features no one else has:**
- **Sticking adaptive EMAs:** Dynamically cling to extremes, minimizing lag—ideal for crypto/forex.
- **Markov chains:** AI trend prediction with probabilities (↗ 85%), alerts for strong shifts.
- **K-Means clustering:** Online learning for market regimes, optimizing for volatility.
- **Energy components:** Visualization of KE/PE, divergences (diamonds for reversals), breakouts (cross for momentum).
- **Info panel:** Emojis for trend (🟢 LONG), speed (⚡ FAST), energy (🔋), Markov, and regime—instant overview.
Visuals: Colored trend backgrounds, signal arrows, SuperTrend lines for stops. Alerts: on entries, divergences, regime changes, Markov predictions.
**Why does it dominate?** Physics + AI = edge in trends. Add it now and see the market in a new way! 🚀

Take Profit XTake Profit X
Take Profit X solves the #1 problem in trading: knowing when to exit. Instead of guessing or using single indicators, it aggregates 8 technical signals to identify high-probability exit points through multi-confirmation consensus. This eliminates premature exits and emotional decision-making.
The indicator counts confirmations from your chosen technical tools:
Green dot = Multiple signals say "take profit on longs/exit shorts"
Red dot = Multiple signals say "take profit on shorts/exit longs"
Signals appear when you reach the minimum confirmations threshold you set.
Possible Settings:
Conservative (Swing Trading)
pine
Minimum Confirmations: 4
Use: RSI, MACD, CCI, Supertrend, Price Action
Disable: Stochastic, Bollinger Bands, EMA Cross
Look Back Bars: 10
Aggressive (Day Trading)
pine
Minimum Confirmations: 2
Use: All indicators ON
Look Back Bars: 3-5
RSI OB/OS: 75/25
Balanced (Most Markets)
pine
Minimum Confirmations: 3
Use: RSI, MACD, CCI, Supertrend
Price Action: ON
Look Back Bars: 5-7

DMcTrades Trading EngineDMcTrades Trading Engine
Multi-Layer Trend, Structure & Momentum Analysis
This indicator is a comprehensive, rule-based trading framework designed to identify high-quality buy and sell opportunities through multi-timeframe confluence, trend alignment, and price-action confirmation. It combines structure breaks, moving-average alignment, volatility filters, and momentum confirmation into a single, unified visual system.
The script is intended for intraday and short-term swing trading, with particular effectiveness on lower timeframes when higher-timeframe trend alignment is respected.
Core Architecture
The indicator is divided into two independent but complementary engines:
1) Multi-Timeframe Structure & Trend Engine
This engine focuses on directional bias and structural validation.
Key components:
Multi-timeframe EMA alignment (fast and slow timeframes)
Supertrend direction agreement across timeframes
Swing-based Break of Structure (BOS) detection
Configurable trend strictness (Conservative / Balanced / Aggressive)
Optional wick-based or close-based structure confirmation
Signals generated here establish trend-qualified entry permission, not standalone entries.
2) Momentum & Breakout Signal Engine
This engine evaluates entry quality and follow-through probability.
Key components:
Breakout and breakdown detection from recent swing levels
ATR-adjusted volatility and impulse candle filtering
MACD and RSI momentum confirmation
VWAP and higher-timeframe EMA confluence (optional)
Retest-based and impulse-based entry logic
Overextension protection to avoid late entries
Signals are classified as:
CONFIRMED (strong multi-filter confluence)
BASE (core conditions met, fewer filters passed)
Signal Types & Visuals
The indicator provides multiple visual layers:
BUY / SELL triangles for core entries
CONFIRMED BUY / SELL labels for high-confluence setups
Classification boxes highlighting active signal zones
Supertrend overlays (current timeframe + optional 5-minute overlay)
EMA stack visualization (9 / 21 / 50 / 200)
Impulse candle highlighting
Optional reversal warning triangles based on momentum divergence
All visuals are fully configurable and can be enabled or disabled independently.
Risk & Trade Context Features
To help filter lower-probability trades, the suite includes:
Minimum ATR and volume thresholds
Trend stability checks (avoids fresh flips unless momentum is strong)
EMA slope and distance validation
Liquidity sweep and recent structure awareness
Optional higher-timeframe trend agreement
These filters are designed to reduce over-trading and improve signal quality during ranging or low-volatility conditions.
Recommended Usage
Best suited for 1-minute to 15-minute charts
Designed for trend-following and momentum continuation
Works across Forex, indices, commodities, and crypto
Use in conjunction with proper risk management and session awareness
This indicator does not provide take-profit or stop-loss levels and should be used as a decision-support tool, not an automated trading system.
Disclaimer
This script is provided for educational and analytical purposes only.
It does not constitute financial advice. Trading involves risk, and past performance does not guarantee future results.

Greater Moving AverageThe purpose for this indicator is to function as a comprehensive market-state detector, with the primary goal of avoiding a market crash.
Mendoza Lines (V-pattern detection) identify early crash conditions and warn when market structure becomes unstable.
RSI/volume-shaded candles + Supertrend confirm momentum and trend, creating a unified system to avoid major drawdowns.
Enhanced Wyckoff ranges with ATR.
Mendoza lines identify abrupt V-shaped reversals which often precede high-risk crash structures. By tracking both the formation and resolution of these patterns across multiple timeframes, the indicator provides early warning signals when the market is entering unstable territory, allowing traders to step aside before liquidity collapses or structural breakdowns begin.
Ideal configurations use Heikin Ashi to smooth out candle structure. Observe SPX on a Weekly Chart, which correctly identifies exits and entries during the 2001 and 2009 crashes. On a 6 hour chart, the Tariff low is correctly identified. The improved VWAP uses a cumulative metric rather than the built in ta.vwap calculation, and functions as a macro low beacon when crossed with the 200 EMA. Historically, these crosses have aligned closely with macro cycle lows.
To round out the system, the indicator overlays RSI-based and volume-weighted candle shading to reflect internal momentum and real buying/selling pressure directly on the chart, making shifts in strength immediately visible. A Supertrend confirmation layer acts as the final filter, smoothing noise and verifying trend direction before decisions are made.

Swing Aurora v7.0 — The ExecutionerSwing Aurora v7.0 — The Executioner
Swing Aurora v7.0 is a multi-engine swing trading framework that combines trend-following, momentum, HTF confluence and SMC/Fibonacci structure in one script.
This version moves from a rigid gate logic to a scoring + state machine engine, so you can see not only if there is a signal, but how strong that signal really is.
🧠 1. Scoring Engine – A-Grade & B-Grade Signals
Instead of a single if (all conditions == true) check, v7.0 builds a score on every bar:
Trend score – position vs Baseline, slope, Supertrend direction.
Momentum score – MACD, RSI-Stoch triggers, ADX, local HH/LL.
HTF score – alignment with higher timeframe Baseline, Bias EMA, EMAs and RSI.
Confluence flags – divergences, ST flip/retest, SMC zones, VDub context.
Results:
A-Grade (Strong) signals → high score, strong trend + momentum + HTF alignment.
B-Grade (Speculative) signals → early/partial setups, clearly marked as higher risk.
You no longer lose good entries just because one minor filter disagrees, but you can clearly distinguish high-quality setups from speculative ones.
🔁 2. Strict Trade Cycle – State Machine
v7.0 uses a simple state machine:
0 = Flat, 1 = Long, -1 = Short.
When you are Long, the script only looks for exits or reversals, not new BUY entries.
Same for Short.
This enforces a clean, disciplined flow:
BUY → Hold → EXIT → wait for next setup, without label spam or conflicting signals while already in a position.
🛡️ 3. Quality Gates & Anti-FOMO Filters
To avoid buying local tops or chopping yourself to death:
RSI Gate – blocks BUY when RSI is already overbought (and vice-versa for SELL).
ATR Over-Extension filter – no entries when price is too far from the Baseline (parabolic moves).
No-Trade / Chop zone – combines ADX, ATR vs ATR-slow, distance to Baseline, Bollinger/Keltner squeeze and volume behavior.
Volume Gate – requires a real volume spike, not just random price wiggle.
Supertrend Gate – entries are synchronized with ST (flip / early / retest — configurable).
HTF Guardrails – optional: blocks entries against the dominant HTF regime.
📈 4. Visual Layer: Trend Map, Labels & Gradient
BUY/SELL labels with confidence percentage.
Background gradient based on trend direction and strength (ADX).
EMA 13/21 + Baseline with dynamic bull/bear colors.
Optional mini-legend showing: TS / RSI / ADX / HTF status at a glance.
🧩 5. Divergences, VDub & Macro Map
Full divergence engine (classic + hidden) on a basket of indicators (RSI, MACD, CCI, OBV, etc.), with optional lines and count labels.
VDub levels & signals – “smart levels” (solid/dotted) and add-on BUY/SELL signals filtered by market regime.
HTF Macro Map – higher timeframe Baseline, Bias EMA, fast EMAs, RSI and slope, using an auto or user-selected higher TF.
🧱 6. SMC Zones & Fibonacci (v7.0 Logic)
The SMC / Fibo component was refined so it is not hard-wired to the current bar’s entry signal:
Automatic HH / HL / LH / LL market structure labelling.
Demand / Supply zones:
derived from BOS with ATR buffer,
auto-update bar-by-bar,
auto-delete when broken or after a user-defined lifetime.
Fibonacci range:
built from the latest valid swing-high / swing-low,
shows 0 / 0.382 / 0.5 / 0.618 / 1 / 1.618 levels plus equilibrium line,
persists while the range is valid (independent of being in a trade).
AI zone boost (v7.0) – optional: zone opacity adapts dynamically to the underlying confidence score, highlighting higher-quality areas.
⚙️ 7. Modes & Configuration
Modes: Aggressive / Balanced / Conservative – adjust score thresholds and confidence requirements.
Risk & Quality: slope filter, min ATR distance, strict anti-chop, volume gate, HTF guardrails.
Visual toggles: labels on/off, baseline & EMAs, gradient, mini-legend, SMC boxes, Fibonacci.
This script does not trade for you – it provides a structured, consistent framework for reading trend, momentum and structure, plus graded signals so you can execute your own risk management and strategy.
Disclaimer
This script is provided strictly for educational and research purposes. It does not constitute financial advice, investment recommendation or any guarantee of profit. Historical performance, backtests and chart examples do not ensure future results.
Always use your own risk management rules, test the script on multiple instruments and timeframes, and never trade with money you cannot afford to lose. The author and contributors accept no responsibility for any trading decisions made based on this indicator.

Pure xATR ProUncover the hidden rhythm of the market with Pure xATR Pro. This indicator is designed for serious traders who need to understand "Price Extension". It calculates the precise distance between the price and the baseline Moving Average (MA) relative to market volatility (ATR). Instead of guessing top and bottom, visualize exactly where the price stands in the cycle—from extreme panic selling to euphoric profit-taking.
Key Features:
4-Stage Market Zoning System:
Panic Zone (Oversold): Identifies extreme price drops (statistically rare deviations). Often presents high-reward mean reversion opportunities.
Buy Zone (Entry): The sweet spot for trend initiation.
Hold / Winner Zone: Detects strong momentum. Keeps you in the trade while the trend is healthy (Ride the trend).
Profit Taking Zone (Overbought): signals when the price is statistically overextended and liable to pullback.
Adaptive Volatility Logic:
Includes a dynamic algorithm that analyzes historical volatility (Lookback Period) to automatically adjust Overbought/Oversold percentiles, adapting to changing market conditions.
Professional Dashboard:
Real-time Status: Displays current Zone, Volatility State (Breakout/Normal), and Actionable Advice.
Risk Management: Auto-calculates Dynamic Stop Loss (based on Supertrend, ATR, or MA) and Fixed % Risk.
Multi-Level Targets: Automatically projects 3 profit targets (TP) based on ATR multiples.
Clean & Customizable Visuals:
Smart Highlighting: Background colors automatically highlight key zones (Panic/Buy/Hold/Profit).
Style Control: Full color customization available directly in the "Style" tab for a clutter-free input menu.
------------------
ค้นพบจังหวะที่แท้จริงของตลาดด้วย Pure xATR Pro อินดิเคเตอร์ระดับมืออาชีพที่ออกแบบมาเพื่อวิเคราะห์ "ระยะการยืดตัวของราคา" (Price Extension) โดยคำนวณระยะห่างระหว่างราคากับเส้นค่าเฉลี่ย (MA) เทียบกับความผันผวน (ATR) ช่วยให้คุณเห็นภาพชัดเจนว่าราคา ณ ปัจจุบันอยู่ในสถานะใด ตั้งแต่จุดที่คนเทขายด้วยความตกใจ (Panic) ไปจนถึงจุดที่ราคาแพงเกินไปและควรขายทำกำไร
ฟีเจอร์หลัก (Key Features):
ระบบแบ่งโซนตลาด 4 ระดับ (4-Stage Zoning):
Panic Zone (โซนของถูก/Oversold): จับจังหวะที่ราคาดิ่งลงแรงผิดปกติ ซึ่งมักเป็นจุดกลับตัวที่ให้ผลตอบแทนสูง (High Reward)
Buy Zone (โซนสะสม): จุดเริ่มต้นของเทรนด์ เป็นระยะปลอดภัยในการเข้าออเดอร์
Hold / Winner Zone (โซนรันเทรนด์): แยกแยะช่วงที่เทรนด์แข็งแกร่ง ให้คุณ "ถือสถานะต่อ" (Let Profit Run) ไม่ขายหมู
Profit Taking Zone (โซนขายทำกำไร): แจ้งเตือนเมื่อราคาวิ่งไปไกลเกินค่าเฉลี่ยทางสถิติ (Overextended) เพื่อพิจารณาขาย
ระบบปรับตัวตามความผันผวน (Adaptive Logic):
อัลกอริทึมอัจฉริยะที่คำนวณค่า Percentile ย้อนหลัง เพื่อปรับระดับ Overbought/Oversold ให้เหมาะสมกับสภาวะตลาดที่เปลี่ยนไปโดยอัตโนมัติ
หน้าปัดสถานะครบวงจร (Professional Dashboard):
แสดงสถานะปัจจุบัน (Action), ระดับความผันผวน, และคำแนะนำแบบ Real-time
Risk Management: คำนวณจุด Stop Loss ให้อัตโนมัติ (เลือกสูตรได้: Supertrend, ATR, หรือ MA)
Target Projection: คำนวณเป้าหมายทำกำไร (TP) ให้ล่วงหน้า 3 ระดับตามระยะ ATR
กราฟสะอาดตา ปรับแต่งง่าย (Clean Visuals):
Smart Highlight: ไฮไลท์สีพื้นหลังตามโซนต่างๆ อัตโนมัติ (Panic/Buy/Hold/Profit) ทำให้ดูเทรนด์ง่ายเพียงกวาดตา
Customizable: ปรับแต่งสีและความโปร่งใสได้อิสระผ่านแถบ "Style" เพื่อกราฟที่ดูเป็นระเบียบและไม่รกสายตา

複合ガチイカ🦑🦑🦑 日本語説明は英文の後ーーーーーーーーーーーーーーー
🦑 Composite Gachi Squid Indicator – A fun and intuitive trading overlay combining SuperTrend, ATR, and RSI.
Body color shows trend direction and strength.
Tentacles visualize volatility.
Eyes indicate overbought/oversold conditions.
🦑↑ / 🦑↓ marks provide clear entry signals.
Perfect for visual traders who want both style and actionable insights.
日本語説明-------------------------------------------------------------
🦑 複合ガチイカ・インジケーター – SuperTrend、ATR、RSI を組み合わせた遊び心と実用性を両立したチャートオーバーレイ。
イカの体の色でトレンドの方向と強さを表示
触手でボラティリティを可視化
目で買われすぎ・売られすぎを表示
🦑↑ / 🦑↓ が分かりやすいエントリーシグナル
見た目も楽しく、トレード判断にも使えるインジケーターです。
