MesattoTrend v1 - MesattoCapitalWelcome to MesattoTrend v1
How to use it:
1- VWAP(pink line)
BUY Scenario, VWAP will act as your base, it has to be below price to be a valid buy.
SELL Scenario, VWAP will be higher and act as resistance.
2- Support/Resistance lines will give you an idea on where prices
might pullback or increase in volume for a breakout.
3- Supertrend(green/red cross)
Supertrend will act as your Stop point. Use it as reference together with
support/resist lines to set your stoploss/gain
Reminder: Use it at your own risk, an indicator serves to assist you on taking a trade, always look for confimation before trading.
Link to my bottom indicator
comment below if you would like more adjustments.
Search in scripts for "supertrend"

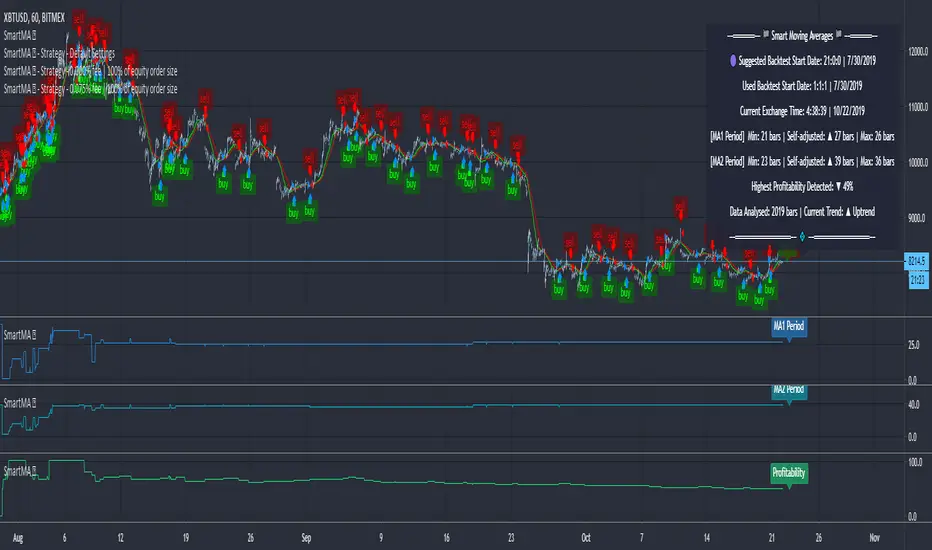
Moving Averages (Self-Adjusting Param for Highest Profitability)Moving Averages (Self-Adjusting Parameters for Highest Profitability)
It is a dual moving average crossover system - Smart Moving Averages .
Moving averages are used to identify current price developments and the potential for a change in an established trend.
The crossover in a dual moving average system can be used as a trigger to buy or to sell an asset, or as a trend reversal indication.
The crossover occurrence depends on the periods for which the moving averages are calculated. Using constant period values may not bring the best results.
The Smart Moving Averages change their periods automatically to get the highest profitability .
The concept is similar to the Smart SuperTrend .
Features:
• Self-Adjusting Period parameters
• The graphs for Profitability, Moving Average 1 Period, Moving Average 2 Period and the Moving Averages themselves are available to choose for display from the indicator settings
• A chart layout can be made just for the Smart Moving Averages, having all the graphs nicely displayed
• Alerts for changes in Trend, Moving Average 1 Period, Moving Average 2 Period, Profitability
• Different types of Moving Averages are available to choose from in the indicator settings (SMA, EMA, RMA, WMA, VWMA, DEMA, TEMA, HullMA, TMA).
The range for Moving Average 1 Period, Moving Average 2 Period and Time can be changed in the indicator settings (suggested optimal values are displayed on the chart).
This affects the loading speed (smaller range, faster to load), as well as the accuracy of the signals.
The indicator switches to the most profitable Moving Average 1 Period and Moving Average 2 Period parameters automatically, in real-time.
It scans across the entire historical data made available by TradingView.
The Smart Moving Average system works on all timeframes and symbols available on TradingView.
Exception for when the Volume Weighted Moving Average is used - it doesn't work for symbols without volume data.
It does not repaint!
But several aspects must be considered:
- 1. TradingView periodically removes access to old data while giving access to new data in real-time.
____ The frequency depends on the timeframe, amount of data. It can happen daily for second charts, weekly for minute charts.
____ Since the Indicator wouldn't have access to that old data anymore, the Profitability may change its value, causing a certain degree of repainting.
- 2. The starting time for Backtest must be inserted in the settings panel.
____ As long as the starting time has available price data, the Smart Moving Averages will NOT get repainted.
____ A suggested starting date for the analysis is shown on the chart. Insert the date in the indicator settings.
This indicator is compatible with the Wrapper Module of the Risk Management System indicator, which means they can work together as a trading bot.
Easy Sys 1I just updated Easy indicator to make it little more advance
add (SAR,Zigzag,Supertrend etc)
very important that when you set the info panel make sure its in correct position , so here in btc 4 hour chart I put 10500
for other tf or assets this you need to fix by your own. so lets say you load xrp then put a number like 0.3 and try to see if it fit.
the buy and sell based on score of the indicators total
the colors are based on supertrend
so main purpose here to get much info fast on one chart before to make a move to buy or sell based on multiple indicators

Algorithm Builder - Single Trend+ (MTF)Hello traders
I. SCRIPTS ACCESS AND TRIALS
1. For the trial request access, they have to be done through my website .
2. My website URL is in this script signature at the very bottom (you'll have to scroll down a bit and going past the long description) and in my profile status available here : Daveatt
Due to the new scripts publishing house rules, I won't mention the URL here directly. As I value my partnership with TradingView very much, I prefer showing you the way for finding them :)
3. You may also contact me directly for more information
II. Algorithm Builder - Single Trend+ (MTF)
2.1 Concept
MTF means Multi Timeframes - we all agree that saying MTF is nicer and easier than multi-timeframe.
That script is an upgrade of the Single Trend:
The Algorithm Builder - Single Trend+ (Multiple Timeframes/MTF) is made to detect the convergence of many unrelated indicators, and give a BUY or SELL signal whenever all the selected sub-indicators - each may be using a different timeframe - are converging in the same direction.
Now sit tight because what's going to be announced will be awesome. Are you ready for it?... :)
The MTF version allows to detect the convergence for indicators in different timeframes. Each indicator has its own timeframe - expanding, even more, your trading analysis capabilities.
In other words, you could, for instance, detects the convergence of an H1 MACD with an H2 Supertrend, and why not also adding an m30 Moving Averages cross in the mix.
The Single Trend+ MTF gives one single entry per identified trend - unlike the Multiple Trends editions (also available on my scripts page) which may give more than 1 entry per trend.
The traders select the sub-indicators they want, and see in real-time the BUY and SELL triangles being updated.
2.2 Why the Algorithm Builder Single Trend may help you
I worked with many traders during my career, and their feedback about trading is often pretty similar.
They all tried a lot of complicated indicators, losing their capital, and finally getting back to the basics (even to the basic indicators if I might say)
The art is finding a good combination of indicators and setting strict money/risk management rules.
Easy in concept, but more than 90+% of traders lose money on the markets... which teach us that trading is not only about drawing trendlines, or using cool indicators but finding ways to ease our psychology while trading.
2.3 The Algorithm Builder trading framework
The sub-indicators (full list on our website) weren't chosen randomly. They're based on a trading method we've developed over the last 6 years - while working with traders and other trading quants.
The Algo Builders are made to detect a convergence - and as such, will give a signal once a trend has been identified.
They're not made to detect reversal but have been designed to give a signal when all sub-indicators are either ALL bullish (green) or ALL bearish (red).
We provide a framework based on indicators we selected because they:
1. make sense to be used altogether
2. work on asset classes like INDEX, CRYPTO, STOCK OPTIONS, FOREX, COMMODITIES
3. it may expand your knowledge about what detecting a convergence with pre-selected indicator really means
2.3.1 Supports and Resistances
The indicator displays the main algorithmic supports and resistances according to our trading method.
I think they're relevant for all asset classes, but you're absolutely free to use any different supports/resistances logic if you want to.
I'm not against it because I know that pivots, Fibonacci levels, etc. may work very well also.
2.3.2 Choose your favorite risk management algorithm
1/ Pre-defined Algo S/R method using:
- a supertrend of the stop-loss
- the nearest algorithmic resistances for the take profit levels.
2/ Define your own Stop-loss and Take-profits level in real-time
Stop-Loss Management
For what's following, let's assume that 2 is the stop-loss value you inserted in the indicator, and the Algorithm Builder gives a BUY signal.
This is NOT a recommendation at all, only an example to explain how this feature works.
- %Trailing: The Stop-Loss starts 2% away from the entry price - and will move up (because we're on a BUY trade as per our example) every time your trade will gain 2% profit
- Percentage: The Stop-Loss stays static 2% away from the entry price. There is no trailing here
- TP Trailing: This is a very awesome feature. The stop-loss is set 2% away when the trades start.
When the TP1 is hit, the stop-loss will be moved to the Entry price (also called breakeven).
When the TP2 is hit, the SL is moved to the previous TP1 position
- Fixed: Set the Stop-Loss at a fixed position (value should be in currency/units)
Take Profits Management
You can manage up to 2 take profit levels defined as a percentage or price value.
The expected input is in percentage value (for instance, setting the % target of TP1 to 2% will set the TP1 level 2% away from the entry price
2.3.3 Built-in Trade Manager
This is very likely the most loved utility script that we shared on TradingView.
It's included in your Algorithm Builder - Single Trend+, and will certainly help you immensely to analyze your charts and your trades.
We made sure that all the graphical elements on the chart will be updated in real-time whenever our user change anything on the indicator configuration.
You'll also be able to change the Trade Manager labels positions as you wish :)
2.3.4 Built-in Risk-to-Reward Panel
The good stuff doesn't stop here.
You'll notice that this sometimes green (when in a LONG), sometimes red (when in a SHORT) panel at the right of your chart.
It displays for the selected trading algorithmic (see 2.3.2 above), a ton of useful real-time analytics.
- Entry Price: the price when the Algorithm Builder will give a signal.
- The Trade PnL in percentage.
- Entry Stop Loss: Distance (in currency/units) between the selected stop-loss algorithm (percent, trailing, TP trailing, etc.) and the entry price.
- Entry TP1: Distance (in currency/units) between the entry price and the first take profit
- Entry TP2: Distance (in currency/units) between the entry price and the second take profit
- Risk/Reward TP1: Using the Stop-loss distance at entry, and Take Profit 1 at entry to compute the risk-to-reward ratio.
- Risk/Reward TP2: Using the Stop-loss distance at entry, and Take Profit 2 at entry to compute the risk-to-reward ratio.
For more details, please check the guides section of my website. Links are in my signature and profile status.
2.3.5 Hard Exits
Our trading method is known for the hard exits, also called invalidation.
The Single Trend+ includes a hard exit based on a MACD - settings are flexible and you may update them.
Having a stop-loss protecting your trade is a best practice - Protecting your stop-loss also from getting hit is incredible.
We prefer invalidate a few positions, even if sometimes we don't want to. Rather than the market hard exiting on us, and leaving with our hard-working money.
2.3.6 Alerts
Alerts are enabled for:
- BUY/SELL triangles signals
- Trade Manager (SL, TP1, TP2)
- Hard Exits
III. Pain points that we're trying to solve with our Algorithm Builders
Issue #1 There are many informations / indicators / strategies / backtests / noise. Finding the right ones is not a simple task.
Solution #1 A reliable system that removes the external noise is much needed in trading to stay "in the game".
Issue #2 Trading could be quite stressful - The majority doesn't lose in trading because technical analysis is hard, but because managing our psychology is one of the hardest things a human can do.
Solution #2 Some ways to reduce the "trading stress" could be: getting better quality signals and trading like a "machine". Forgetting about Twitter and trusting the system you designed.
Issue #3 Trading without strict rules and only based on what we feel, or what we think the market should do is the fastest way to kiss our money goodbye.
Only 1 indicator generally is not enough. Traders generally use a combination of several indicators but they're monitoring them individually.
It's normal then to feel exhausted at the end of the day ^^ (to say the least)... and exhaustion leads to mistakes which leads to..... (I'm sure you got it) ... capital loss.
Solution #3 As a trader, I needed a trading framework and a method. I offer our trading method but they're plenty others out there. We cannot claim obviously it's the best ever ....but let's say we're using those exact same
scripts ourselves for our trading. And this what we've been recommending our clients to trade with for the past years. Also, having a tool detecting the convergence of several indicators and giving 1 unique signal
for BUY/SELL position will save you a lot of time/energy, and perhaps might help you out getting better trading performance.
III. Resolving a complex puzzle and having fun in the process
Trading has to stay a passion and not (only be) a source of intense stress.
The most successful traders I know are "trading geeks" - literally always looking for optimizing, searching for the best possible entries, setups, indicators, tools, etc.
For them, it's not even about the money anymore, but only about beating their previous performance.
Why are they doing this? Because it's fun
Might appears as a bold statement, but I guarantee that looking for setups is fun.
One of our users even told us, that it's like playing with "Legos" and we couldn't possibly agree more.
IV. Designing a system that "makes sense"
Another bold statement now. Brace yourselves ladies and gentlemen
The Algorithm Builders allow to design trading systems quickly. What could takes days/weeks/months to find out... might be now within your reach in less than a few hours.
With a bit of practice, less than an hour might be enough per asset/timeframe to find a system that makes sense to you and adapted to your trading capital and psychology.
Assuming our users read our guides and are fully committed to learning a new way of trading - then we do guarantee you'll be able to design kick-ass trading systems that make sense.
"Making sense" doesn't mean at all it's guaranteed to win, it means you're the one defining the convergence of indicators, using your Algorithm Builder, and observe that most of the time - whenever there is a BUY signal, the candlesticks are going upwards - whenever there is a SELL signal, it's going downwards.
This is a necessary step to make real progress from a trading analyst perspective - and hopefully could lead to profits.
V. Algorithm Builder versus the main trader enemy(=psychology)
This indicator has the goal to help solving one of the MAIN issues encountered by traders.
Most of traders realize, they can't perform with only 1 indicator (or 1 price pattern or 1 price action) and need a combination of multiple indicators before getting in a trade.
Far from being a magic pill, if it could at least reduce the stress you have while trading, then we'll consider we made a great job - it's a technical "useless noise remover", and needs to be followed strictly.
Such trust in a trading system can only be built by testing your Algorithm Builder configuration on either:
1. a demo account
2. or a live account with small bids. And then, increasing progressively the bids if your capital increases progressively.
Though, you should still use your common sense. (for instance: if we get a BUY signal right on a big timeframe resistance we're hitting for the first time).
I'm aware this is a new way of trading but for many, and while we cannot foresee the future, neither predict performance, we believe it might save you a lot of time to find good signals.
My maximum level of happiness will be reached the day when our users will contact me and showing me setups being mine.
I'm sure that even I can learn from my users and, we can all learn from each other Algorithm Builder configuration
VI. What is a wrong or bad configuration?
Simply put. If you see that most of your signals react such as described below:
1. a buy triangle predicts, most of the time an upwards move
2. a sell triangle predicts, most of the time a downwards move
3. you estimated yourself the stop-loss needed to give enough room for your trades.
4. take profits based on algorithmic support and resistances or your own take profit method.
So what's a good Algorithm Builder configuration? A configuration you're happy with and makes sense.
A better Algorithm Builder setup is one used in demo or a live account w/ small bids for a few weeks, and you're consistent in your trading performance.
If you have any doubt or question, please hit me up directly or ask in the comments section of this script.
I'll never claim I have the best trading methodology or the best indicators. You only will be the judge, and I'll appreciate all the questions and feedback you're sending my way.
They help me a ton to develop indicators based on all the requests I received.
Kind regards,
Dave

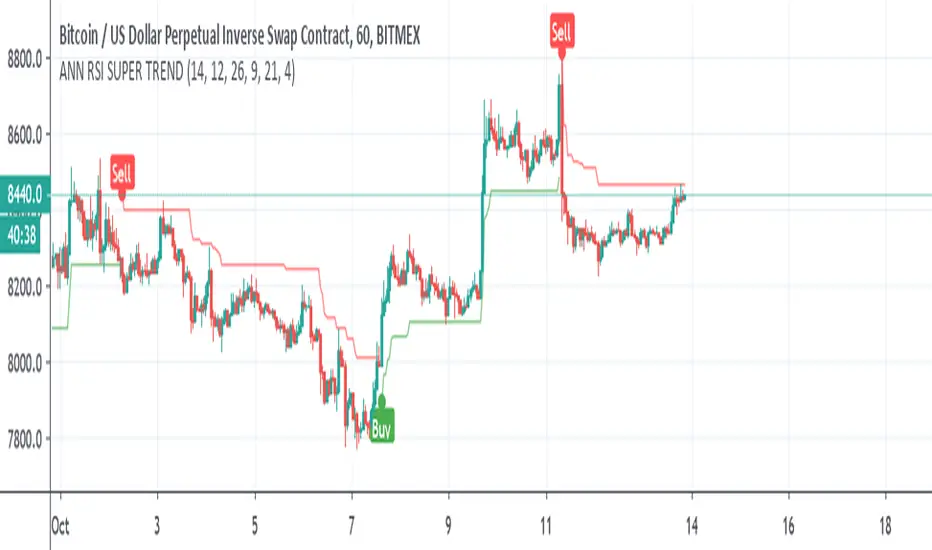
ANN RSI SUPER TRENDSo I was bored and I made this Hybrid
ANN taken from
and alex super trend ,
instead of normal ATR for the supertrend I use RSI and the ANN combination
alerts included
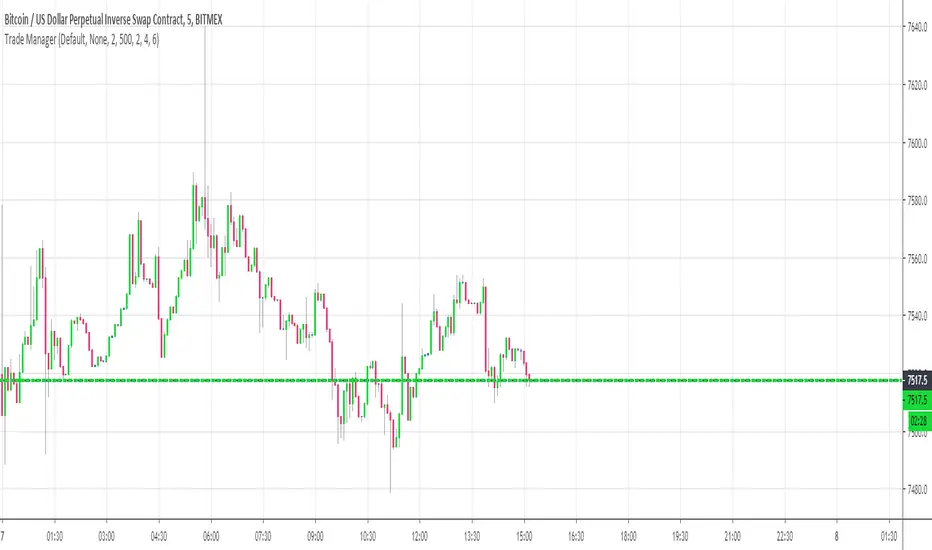
Trade ManagerHello everyone
Hoped you had a great weekend and are ready for what's coming this week
I'll never fail to satisfy my audience on TradingView and I'll start by sharing some heavy stuff.... Imagine the most amazing thing you had in your life. You got it ? now multiply this good feeling by 100 !!! OK... now I have a tool that is beyond that litteraly. Don't believe me, here's the Trade Manager ladies and gentlemen, I could barely contain my excitement this weekend to share it with the community
I wasn't sure of sharing it but you guys did a great job with my other indicators giving me constructive feedback to improve them. Also, those helping me with such feedback usually get the indicator for a lifetime access for free.
Please read this educational post I published for you before proceeding further : How-to-set-an-indicator-to-work-with-the-Trade-manager/
From here you normally connected the data source of your own indicator to the Trade Manager. If not, here's a reminder of the article mentionned above
Step 1 - Update your indicator
Somewhere in the code you'll have a LONG and a SHORT condition. If not, please go back to study trading for noobs (I'm kidding !!!)
So it should look to something similar
macrossover = crossover(MA1, MA2)
macrossunder = crossunder(MA1, MA2)
What you will need to add at the very end of your script is a Signal plot that will be captured by the Trade Manager. This will give us :
// Signal plot to be used as external
// if crossover, sends 1, otherwise sends -1
Signal = macrossover ? 1 : macrossunder ? -1 : na
plot(Signal, title="Signal")
The Trade Manager engines expects to receive 1 for a bullishg signal and -1 for bearish .
Step 2 - Add the Trade Manager to your chart and select the right Data Source
I feel the questions coming so I prefer to anticipate :) When you add the Trade Manager to your chart, nothing will be displayed. THIS IS NORMAL because you'll have to select the Data Source to be "Signal"
Remember our Signal variable from the Two MM Cross from before, now we'll capture it and.....drumb rolll...... that's from that moment that your life became even more AWESOME
The Engine will capture the last signal from the MM cross or any indicator actually and will update the Stop Loss, Take Profit levels based on the parameters you set on the Trade Manager
Now I'll cover the different parameters of the tool
It should be straightforward but better to explain everything here
+Label lines : if unchecked, no SL/TPs/... will be displayed
+Show indicators : This does nothing. Tradingview doesn't give the possibility to set Labels on an UI so we have to use this hack with a useless checkbox
+Show PnL Panel : Will show a Panel at the right of your chart with the PnL updated for the last position only. In a future version, I'll make it work to list maybe the previous N positions defined by the user
+Show Stop Loss Signal : Will display the stop loss label. You have the choice between three options :
++Percentage : Will set the SL at a percent distance from the price
++Fixed : SL fixed at a static price
++SuperTrend : Trailing stop loss based on Supertrend
'll add many more options this week for sure
+Take Profit 1,2,3 : Visually define the three Take Profit levels
Please note that once a Take profit level is reached, it will magically disappear. This is to be expected
This indicator is a first draft of what I believe is such a great tool because can be connected to any indicator. I confess that I tried it only with a few... if you find any that's not working with the Trade manager, please let me know and I'll have a look (for free)
I'm so excited to share it with all of you and that's the best possible way I could ever dreamt of to start the week with my TradingView community
Wishing you all the best and a pleasant experience with my work
David
Strategy Builder Crypto (Single Trend/Plots)Hi everyone
Big program for the daily indicator
This one will be free on trial only for a week because it has an immense value and required quite a lot of work. For more info to use it long-term, please DM me
That out of the way, let's dive right in...
This is a huge upgrade from that script Ultimate-Algorithm-Builder-Single-Trend
The Tradingview non-pro users will appreciate it because it allows to add the selected subsequent indicators as well. The Pro users too will likely like this feature equally, what the H*** I'm saying :)
This indicator will transform you into what I was in the past... into a quant trader. You'll build your own trading algorithm in a few clicks only
Which timeframe and which assets ?
Short answer : ALL and ALL
You'll have to define the configuration of the tool based on your capital, psychology. For custom configuration of the tool, please DM me directly so that we can discuss further
But a few words of advices anyway :
the bigger the timeframe, the lower the inputs (and vice-versa)
Think about how much $$ you want to make per trade and define your entries from there
Think about how much $$ you can afford to lose per trade and define the supertrend from there
...
Your golden configuration might not work for all assets.
You might have to create some tweaks - for instance you found a great config for BTCUSD but it's not working for ETHUSD, then you can create a copy of your BTCUSD chart and set a new config for ETHUSD
What are the indicators inside :
This fantastic tool that I personally use for my trading detects convergence between the following indicators :
Overlay - meaning if the price close above/below a moving average
Trend Signal - to detect if the the DOW law is broken and predict a possible reversal - en.wikipedia.org/wiki/Dow_theory
In other words, it detects if the higher highs or lower lows sequence is broken
MACD or MACD Zero Lag
MA Cross - Cross of moving averages
Ichimoku - if the price closes below/above the cloud
Supertrend - used to detect polarity zones
TSI Shadow -
Pullback
You'll also have the possibility to define a pullback on a given MA. That means basically that you'll get a convergence and it will only display a signal when it will pullback first
This will reduce your losses in case of invalidation and maximize your gains as it will enter the trade in a better position.
You can define your pullback either based an absolute value or based on a percent distance from the MA
+Example:
Pullback value = 100 means I want a 100 pip/USD distance between the MA pullback and the candle
Pullback percent = 2 means I want a 2% distance between the MA pullback and the candle
The percent option is more generic in my opinion but I let the other available for those who might like it
That's it ?
Almost....You can also setup alerts on the indicator signals so that you won't have to stay days in front of the chart to wait for a signal.
You receive the alert, you check real quick if we're not in front of a support/resistance, if no then take the trade. if yes, I advice waiting for a big pullback - better to be safe than sorry in trading
What If you want a custom version ?
Here are a few custom ideas I could add just for you :
re-enter everytime there is a convergence. So far the indicator is only taking the first convergence. This would give more entries
add the resistances/supports (fibo, pivot)
add the take profit targets and trailing stop loss
..
Please hit me up directly so we can discuss further. Any custom dev will require quite some time so it won't be free
Enjoy that one as I really think it will improve your analyst skills and trading and hopefully make you a few gains (which will make me very happy as I want to help most of you to at least not losing your capital)
Dave

Noro's SILA v1.2Noro's SILA v1.2 - these are 5 trend indicators in 1, for the sake of better accuracy.
Added:
1) Settings
2) Arrows
Noro's SILA v1.2 uses 5 trend indicators:
1) SuperTrend
2) DI Plus-Minus
3) WOW trend indicator (my idea)
4) BarColor indicator (my idea)
5) BestMA (or "BMA") indicator (my idea)
The user can switch-off any indicator from 5 to achieve big accuracy.
How does it work?
Each indicator from 5 defines a trend in own way. If two indicators report that there will be a uptrend, and three others the indicator report that there will be a downtrend - it is downtrend (a red background).
For an example
Now SuperTrend = uptrend = +1
Now DI Plus-Minus = downtrend = -1
Now WOW trend indicator = downtrend = -1
Now BarColor indicator = downtrend = -1
Now BestMA (or "BMA") indicator = uptrend = +1
Sum = + 1 - 1 - 1 - 1 + 1 = -1 = downtrend
If sum > 0 = uptrend
Sensivity
The user himself chooses what there will be a sensitivity (in settings).
If sensivity = 3:
sum > or = 3 - uptrend
sum < or = -3 - downtrend
sum > -3 and < 3 - NA-color of background
Trendlines
3 lower trendlines (blue plots) is "sum+3"
5 upper trendlines is "sum-5"
etc
Settings:
1) sensivity - you see above
2) distance - distance between the price and lines (for convenience)

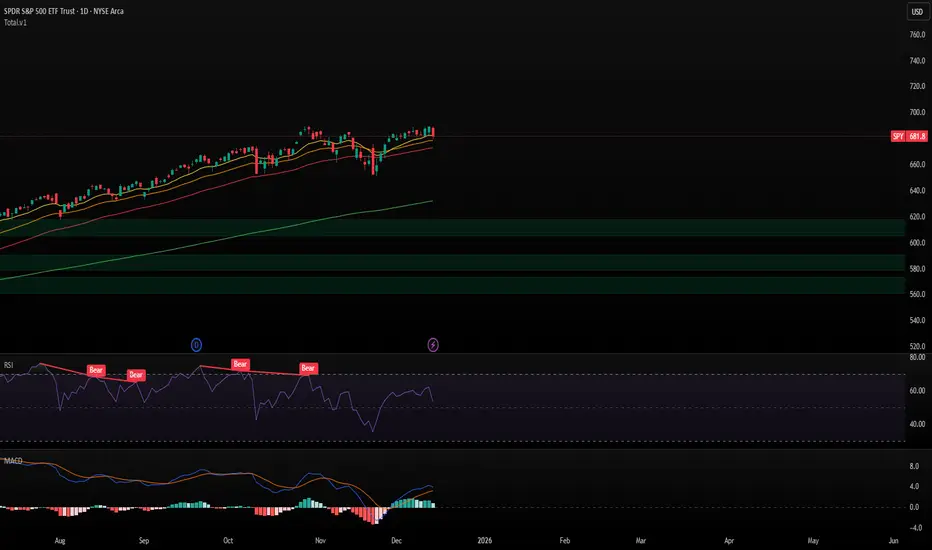
S&R + EMA ToolkitThis script is a market-structure toolkit that combines several indicators into a single view to help understand where price is, where it may react, and what the current trend context is.
EMAs (12, 26, 50, 200)
Help define short-, medium-, and long-term trend context and momentum alignment.
Support & Resistance Channels
Help identify key price zones where the market has historically reacted (areas of acceptance, rejection, and consolidation).
Supertrend
Helps confirm directional bias and trend persistence.
Oversold / Overbought RSI Zones (external source)
Help identify market conditions rather than timing entries.
SB-VDEMA + PivotsBest use - Intraday Scalping ( 1 Mt, 3 Mts, 5 Mts )
Uses Volatility weighted DEMA for smoother and reliable signals.
One can use dynamic colour coding of VWDEMA for entering call or puts. VWAP and Henkin ashi Supertrend is also there but, i think VWDEMA is quite enogh for decision making.

GIX-Treid-2Timeframes: M15 – H1 (and higher)
An advanced SuperTrend, more stable and more intelligent, based on statistical calculations, not market noise.
It calculates a statistical moving average, significantly smoother than EMA or SMA.
It builds an adaptive channel around this average, using fixed pip/tick steps (not a classic ATR).
The trend changes only when price breaks the channel, not on minor fluctuations.
The main line moves in discrete steps, not continuously → no repaint and no whipsawing.
Line color indicates direction:
Green = bullish trend
Red = bearish trend

MTF Dashboard Pro v4 Institutional EditionMTF Dashboard Pro v4 – 2026
Institutional Multi-Timeframe Bias Engine
A high-performance, professional-grade multi-timeframe dashboard designed for scalpers, intraday traders, and institutional smart-money practitioners.
Version 4 introduces a cleaner architecture, faster execution, and improved signal alignment across all major trend, momentum, and confirmation tools.
Core Features
Multi-Timeframe EMA Trend (9/21) – Fast intraday trend detection
200-MA System with Threshold Logic – Dynamic positional bias
Daily VWAP Engine (Optional Reset)
SuperTrend Engine with Corrected Direction Model
RSI, MACD, ADX, Alligator, Stochastic – Momentum + Confirmation suite
PH/PL Bias (Previous Day High/Low) – Institutional liquidity context
11-Signal Institutional Bias Score
Bias Classification: Strong Bull → Strong Bear
Multi-TF Alerts for Strong Bull / Strong Bear
Optimized HUD Table – Lightweight, fast, and resource-efficient
Who Is This For?
Scalpers, intraday traders, swing traders, and SMC/ICT-based traders who need:
Clear multi-timeframe alignment
Instant trend + momentum confirmation
Market structure bias
Liquidity context (PH/PL)
A single, clean, real-time dashboard
The indicator is designed to support high-speed decision making in volatile conditions and institutional trading environments.
Developed by - Sachin Yashwant Thakare
Author: Sachin Yashwant Thakare
Edition: 2026 Premium Release
Rights: © 2026 All Rights Reserved

Variance Ratio & Efficiency Ratio (Quant Lab)1️⃣ Variance Ratio (VR)
Formula:
VR ≈ Var(q-step returns) / (q × Var(1-step returns))
Interpretation:
• VR ≈ 1 → The market is like a random walk; neither trend nor mean-reversion is dominant.
• VR > 1 → Trend behavior is dominant.
• Trend-following systems (EMA, Supertrend, breakout) work better.
• VR < 1 → Mean-reversion is dominant.
• Range/reversal strategies (Z-score, Bollinger fade, RSI reversal) work better.
In short:
• VR > 1 → Trending market
• VR < 1 → Mean-reverting market
This tells you:
“Should I build a trend system or a mean-reversion system for this instrument?”
⸻
2️⃣ Efficiency Ratio (ER)
Formula logic:
ER = |Close_now – Close_n-bars-ago| / Σ|Close_i – Close_{i+1}|
In other words:
• Numerator → Net movement over N bars
• Denominator → Total noise over N bars
Interpretation:
• ER ≈ 1 → The price has moved in almost a straight line in one direction.
→ The trend is very efficient, noise is low.
• ER ≈ 0 → The price has fluctuated a lot but hasn't gone anywhere definitively.
→ A complete noise/range market.
This tells you:
“How clear is the trend in this last N bars, and how much noise is there?”
⸻
🔥 The intelligence provided by both together:
• VR > 1 and ER is high (0.6–1.0) →
➜ Strong, high-quality trend. Golden age for trend-following.
• VR > 1 but ER is low (0.2–0.4) →
➜ Trend exists but there is a lot of noise, many fake movements. • VR < 1 and ER is low →
➜ Net range / sideways market. Ideal for mean-reversion.


👑KINGㅤKULDEEPKING KULDEEP PRO – The Ultimate All-in-One Trend Dashboard 👑
One indicator that rules them ALL.
This is not just a script — this is your complete trading command center.
Live on-chart dashboard combines 14+ powerful indicators and instantly tells you:
- Exact trend direction of every major signal
- When each indicator flipped (with 12-hour time stamp)
- Current market strength percentage (0-100%)
- India VIX fear level in real-time
What’s Inside:
• EMA 13, 21, 34, 200 (with auto color + touch detection)
• VWAP (daily reset, trend tracking)
• SuperTrend (ATR-based)
• Williams Alligator (full jaw/teeth/lips logic)
• MACD (classic crossover)
• Bollinger Bands (breakout detection)
• RSI (14) with overbought/oversold + neutral zone (45-55 bar coloring)
• Momentum, ADX + DI, ATR Volatility
• India VIX live reading (color-coded fear gauge)
Unique Features:
- Trend Strength Meter (0-100%) – combines ALL signals into one final verdict:
→ Strong Bullish | Bullish | Neutral | Bearish | Strong Bearish
- Every trend change timestamped (12-hour AM/PM format)
- Clean, beautiful on-chart table (4 positions, 5 text sizes)
- EMA 13 & 200 plotted directly on price chart (toggle on/off)
- RSI neutral zone (45-55) turns bars gray instantly
- Optional smoothing MA on RSI
Perfect for:
- Intraday & swing traders
- Nifty/BankNifty warriors
- Anyone who wants to see the entire market picture in ONE glance
No more switching tabs. No more confusion.
Just pure, clean, professional edge.
Coded with precision | Runs buttery smooth | Made for winners
Long live the King 👑
~ KULDEEP157

MTF Dashboard Pro v2.3 © 2025 - Sachin ThakareMTF Dashboard Pro v2.3 — A premium multi-timeframe market dashboard created for professional traders.
Features include:
• MTF EMA Trend (9/21)
• MTF 200 MA System with Threshold Logic
• Session-based VWAP (Daily Reset)
• SuperTrend (Corrected Direction Engine)
• RSI / MACD / ADX / Alligator
• Stochastic (Correct Pine Signature)
• Daily PDH / PDL Bias
• 11-Signal Institutional Bias Score
• Trend Strength Classification (Strong Bull → Strong Bear)
• Multi-TF Alerts for Strong Bull / Strong Bear
• Optimized Table Engine & Enhanced Performance
Designed for Scalping, intraday, swing, and high-precision market bias evaluation across 3m → 1M timeframes.
Built & optimized by Sachin Thakare (2025 Edition).

RSI Candles Pro [MTF]**RSI Candles Pro**
## **Overview**
The RSI Candles Pro indicator provides an advanced framework for visualizing RSI momentum through candlestick representation, structural analysis, and multi-dimensional confirmation signals. Unlike conventional RSI oscillators that display only a line plot, this system transforms RSI into a complete OHLC candlestick chart with integrated strength metrics, structural break detection, divergence analysis, and dynamic support/resistance mapping.
Each element adapts continuously to RSI behavior, offering traders a living map of momentum shifts, structural changes, and reversal potential. The indicator doesn't simply show overbought/oversold conditions—it quantifies momentum strength, tracks structural breaks, detects price-RSI divergences, and projects key inflection levels with precision.
The result is a comprehensive, momentum-aware representation of market structure:
- **RSI OHLC Candles** visualize momentum direction, strength, and conviction through candlestick patterns with dynamic color intensity.
- **Strength Scoring System** quantifies momentum conviction using distance from neutral, momentum acceleration, and candle body characteristics.
- **RSI Structure Lines & Zones** connect swing highs and lows, creating visual support/resistance zones within RSI space.
- **Break of Structure (BOS) Detection** identifies decisive momentum shifts when RSI breaks previous structural levels, complete with projected support/resistance lines.
- **Auto Pivot Horizontal Lines** dynamically map key RSI levels where price repeatedly reacts, serving as momentum inflection zones.
- **Divergence Detection** captures classic bullish and bearish divergences between price action and RSI behavior, flagging potential reversal conditions.
Unlike static RSI line plots or simple zone highlighting, RSI Candles Pro fuses candlestick visualization with structural awareness, strength quantification, and divergence analysis to provide a clear, multi-dimensional picture of momentum dynamics and potential turning points.
---
## **Theoretical Foundation**
The RSI Candles Pro indicator builds on principles of **momentum oscillation theory**, **structural market analysis**, and **divergence recognition**—concepts widely used by technical analysts to identify trend strength, exhaustion, and reversal conditions.
Standard RSI indicators display momentum as a single line crossing threshold levels, but this approach ignores critical dimensions: **momentum strength**, **structural context**, and **rate of change acceleration**. This indicator recognizes that RSI behavior can be decomposed into candlestick patterns that reveal conviction, hesitation, and reversal signals just as price candles do.
At its core are six interacting components:
### **1. RSI OHLC Candlestick Construction**
The indicator calculates RSI independently for open, high, low, and close prices within each bar, creating true RSI candlesticks rather than a single-line plot. This reveals:
- **Momentum direction** (bullish vs. bearish candles)
- **Momentum volatility** (wick length shows RSI range)
- **Momentum conviction** (body size indicates decisiveness)
- **Indecision patterns** (doji candles signal momentum exhaustion)
### **2. Strength Scoring Algorithm**
A composite strength score quantifies momentum conviction by analyzing three factors:
- **Distance from neutral (50 level)**: Greater distance indicates stronger directional bias
- **Momentum acceleration**: Rate of RSI change over recent bars reveals building or fading momentum
- **Body-to-range ratio**: Larger bodies relative to total candle range show decisive momentum vs. indecision
This produces a 0-100 strength score that dynamically adjusts candle transparency—strong moves appear vibrant, weak moves appear faded—providing instant visual feedback on momentum quality.
### **3. RSI EMA with Slope-Sensitive Coloring**
A smoothed exponential moving average of RSI serves as a trend filter, but with a critical enhancement: **dynamic color coding based on slope direction**. When the RSI EMA slopes upward, it displays in bullish color; when sloping downward, bearish color. This provides instant trend context and filters noise from raw RSI fluctuations.
### **4. RSI Structural Framework**
The indicator identifies swing highs and lows within RSI space using pivot detection, then:
- **Connects consecutive swings with lines** to visualize RSI trend channels
- **Creates shaded zones between swings** to highlight support/resistance regions in momentum space
- **Implements cooloff periods** to prevent redundant signals and maintain chart clarity
These structural elements reveal whether RSI is forming higher highs/higher lows (bullish structure) or lower highs/lower lows (bearish structure).
### **5. Break of Structure (BOS) Logic**
The system detects **decisive momentum shifts** when RSI breaks previous structural levels in alignment with RSI EMA trend direction:
- **Bullish BOS**: RSI breaks above previous swing high while RSI EMA is rising
- **Bearish BOS**: RSI breaks below previous swing low while RSI EMA is falling
When BOS occurs, the indicator automatically:
- Places a BOS label at the breakout point
- Projects a support/resistance line forward (20+ bars)
- Creates a shaded zone around the S/R level
- Provides tooltip information with exact S/R values
This gives traders actionable levels where momentum shifts may be defended or rejected.
### **6. Price-RSI Divergence Detection**
Classic divergence analysis identifies conditions where price and momentum disagree:
- **Bullish Divergence**: Price makes lower low, RSI makes higher low (momentum refusing to confirm weakness)
- **Bearish Divergence**: Price makes higher high, RSI makes lower high (momentum weakening despite price strength)
Divergences often precede significant reversals, providing early warning signals before price structure breaks.
### **7. Auto Pivot Horizontal Lines**
The indicator dynamically tracks historical RSI pivot points and plots horizontal lines at these levels, extended forward in time. These act as **momentum support/resistance zones**—levels where RSI has repeatedly turned in the past and may respect again in the future. The system:
- Detects unique pivot levels (filtering duplicates within 2 RSI points)
- Maintains a configurable maximum number of lines per side
- Optionally extends lines infinitely right for persistent reference
- Labels each line with its exact RSI value
By integrating these elements, the indicator provides both micro-level momentum analysis (individual candle strength) and macro-level structural context (swing patterns, BOS events, divergences, key levels), maintaining clarity while revealing momentum dynamics in real time.
---
## **How It Works**
The RSI Candles Pro indicator operates through layered processing stages:
### **Stage 1: RSI OHLC Calculation**
- Four independent RSI calculations are performed for each bar: RSI(open), RSI(high), RSI(low), RSI(close)
- These are combined to form RSI candlesticks:
- **RSI Open/Close**: Determines candle body direction and size
- **RSI High**: Highest value among all four RSI calculations becomes upper wick
- **RSI Low**: Lowest value among all four RSI calculations becomes lower wick
- This creates a complete candlestick representation in RSI space that mirrors price action behavior
### **Stage 2: Strength Score Computation**
For each RSI candle, a composite strength score is calculated:
This score drives **dynamic transparency**: strong moves (score > 70) display with high opacity, weak moves (score < 40) display faded, providing instant visual feedback on momentum quality.
### **Stage 3: RSI EMA Trend Filter**
- An exponential moving average smooths RSI values over a configurable period (default 9)
- The slope is calculated: `rsiEmaSlope = rsiEMA - rsiEMA `
- Dynamic coloring:
- **Positive slope** → Green/Bullish color
- **Negative slope** → Red/Bearish color
- **Flat slope** → Gray/Neutral color
- This provides trend context and filters out noise from raw RSI oscillations
### **Stage 4: Structural Swing Detection**
- Swing highs and lows are identified using pivot detection with configurable lookback (default 5 bars left/right)
- **Cooloff mechanism** prevents redundant signals by requiring minimum bars between swings (default 8)
- When new swings are detected:
- Previous swing values are stored for BOS comparison
- Lines connect consecutive swings to visualize momentum structure
- Shaded boxes (zones) highlight the range between swings as support/resistance regions
### **Stage 5: Break of Structure (BOS) Analysis**
The system monitors RSI behavior relative to previous structural levels:
**Bullish BOS triggers when:**
1. RSI EMA slope is positive (uptrend filter)
2. Current RSI close exceeds previous swing high
3. Previous bar's RSI was below that swing high (confirms break)
4. Cooloff period has elapsed since last bullish BOS (default 10 bars)
**Bearish BOS triggers when:**
1. RSI EMA slope is negative (downtrend filter)
2. Current RSI close breaks below previous swing low
3. Previous bar's RSI was above that swing low (confirms break)
4. Cooloff period has elapsed since last bearish BOS
Upon BOS detection, the indicator automatically:
- Places a labeled marker at the breakout point
- Calculates S/R level with buffer (e.g., RSI low - 0.5 points for bullish BOS)
- Draws a dashed S/R line extending forward (configurable, default 20 bars)
- Creates a shaded S/R zone (±0.5 points from line)
- Adds an "S/R" label at the line's end
### **Stage 6: Auto Pivot Line Management**
- Pivot highs and lows are detected using a separate lookback period (default 5)
- When a new pivot forms:
- System checks if a similar level already exists (within 2 RSI points)
- If unique, adds a horizontal line at that RSI value
- Lines are stored in arrays with configurable maximum capacity (default 4 per side)
- Oldest lines are automatically removed when capacity is exceeded
- Optional labels display exact RSI values at pivot levels
### **Stage 7: Divergence Detection**
The system compares price pivot points with RSI pivot points:
**Bearish Divergence:**
- Price makes higher high compared to previous pivot high
- RSI makes lower high compared to previous RSI pivot high
- RSI must be above 50 (mid-level) to confirm overbought context
- Triangle-down marker placed above candle with "DIV" text
**Bullish Divergence:**
- Price makes lower low compared to previous pivot low
- RSI makes higher low compared to previous RSI pivot low
- RSI must be below 50 to confirm oversold context
- Triangle-up marker placed below candle with "DIV" text
### **Stage 8: Strength Dot Visualization**
Colored dots appear according to Delta Volume strength:
### **Stage 9: Real-Time Info Table**
Through these processes, the indicator creates a living, adaptive representation of RSI behavior that reveals both momentum strength and structural context in real time.
---
## **Interpretation**
The RSI Candles Pro indicator reframes momentum reading from simple overbought/oversold levels to structured awareness of momentum behavior:
### **Candle Patterns**
- **Large-bodied bullish candles (vibrant green)**: Strong, decisive bullish momentum—continuation likely
- **Large-bodied bearish candles (vibrant red)**: Strong, decisive bearish momentum—continuation likely
- **Small-bodied or doji candles (faded/gray)**: Indecision or momentum exhaustion—reversal possible
- **Long upper wicks**: Failed bullish momentum—rejection at resistance
- **Long lower wicks**: Failed bearish momentum—support holding
### **RSI EMA Trend Context**
- **RSI EMA rising (green)**: Momentum uptrend—favor bullish setups
- **RSI EMA falling (red)**: Momentum downtrend—favor bearish setups
- **RSI EMA flat (gray)**: Momentum consolidation—wait for directional clarity
### **Structural Analysis**
- **RSI making higher swing lows with rising EMA**: Bullish structure intact—look for dip-buying opportunities
- **RSI making lower swing highs with falling EMA**: Bearish structure intact—look for rally-selling opportunities
- **Shaded structure zones**: Key support/resistance in momentum space—expect reactions at these levels
### **Break of Structure Signals**
- **Bullish BOS + S/R line**: Momentum confirming upward shift—S/R line becomes support if price dips
- **Bearish BOS + S/R line**: Momentum confirming downward shift—S/R line becomes resistance if price rallies
- **S/R line break**: Momentum structure failing—potential reversal or deeper retracement
### **Pivot Lines**
- **Price approaching RSI pivot high**: Momentum resistance—watch for rejection or breakout
- **Price approaching RSI pivot low**: Momentum support—watch for bounce or breakdown
- **Multiple pivot lines clustered**: Strong momentum support/resistance zone—high-probability reaction area
### **Divergences**
- **Bullish divergence in oversold zone**: Momentum refusing to make new lows despite price weakness—reversal setup
- **Bearish divergence in overbought zone**: Momentum weakening despite price strength—reversal setup
- **Divergence + structure break**: High-conviction reversal signal—combined technical and momentum confirmation
### **Strength Dots**
- **Large dots**: High-conviction moves—reliable trend continuation signals
- **Small dots**: Low-conviction moves—increased reversal risk, avoid chasing
- **Diamond warnings in extremes**: Overextended conditions—prepare for mean reversion
### **Zone Background**
- **Red background (RSI > 70)**: Overbought—watch for bearish divergence or momentum exhaustion
- **Green background (RSI < 30)**: Oversold—watch for bullish divergence or momentum recovery
- **No background (30-70)**: Neutral zone—rely on structure and BOS for directional bias
---
## **Strategy Integration**
RSI Candles Pro integrates seamlessly into momentum-based and reversal trading systems:
### **Trend Continuation Strategies**
- **Entry trigger**: Bullish BOS in rising RSI EMA context with strong candle (large dot)
- **Confirmation**: Price respecting S/R line as support on pullback
- **Exit**: Bearish divergence or RSI candle indecision (doji) at pivot resistance
### **Reversal Strategies**
- **Setup**: Divergence forming in extreme zone (RSI > 70 or < 30)
- **Trigger**: RSI structure break opposite to prevailing trend (bearish BOS in uptrend)
- **Confirmation**: RSI EMA slope change + decisive candle in reversal direction
- **Entry**: On pullback to S/R line or pivot level
### **Momentum Fade Strategies**
- **Signal**: Small strength dots appearing in extreme zones
- **Setup**: RSI touching pivot resistance/support with indecision candle
- **Entry**: Opposite-direction candle with medium/large dot
- **Stop**: Beyond recent RSI structure level
### **Structure-Based Entries**
- **Align higher-timeframe RSI trend** (EMA slope direction)
- **Wait for lower-timeframe BOS** in alignment with higher trend
- **Enter on retest** of S/R line with strength confirmation (large dot)
- **Scale out** at next pivot level or divergence signal
### **Multi-Indicator Confluence**
Combine RSI Candles Pro with:
- **Price structure indicators** (Smart Money Concepts, market structure) for trade direction
- **Volume indicators** to confirm momentum with participation
- **Volatility indicators** (ATR, Bollinger Bands) for position sizing context
- **Institutional Zone Detector** for volume profile alignment—RSI BOS + price at VAL/VAH = high-conviction entry
### **Multi-Timeframe Coordination**
- **Higher timeframe** (4H-Daily): Identify RSI EMA trend direction and major structure
- **Lower timeframe** (15min-1H): Execute entries on BOS signals aligned with higher timeframe
- **Micro timeframe** (1-5min): Fine-tune entries using strength dots and pivot reactions
---
## **Technical Implementation Details**
### **Core Engine**
- **RSI OHLC calculation**: Four independent RSI computations per bar create candlestick representation
- **Strength scoring**: Multi-factor composite algorithm quantifies momentum conviction
- **Dynamic transparency**: Real-time opacity adjustment based on strength score
### **Structural Framework**
- **Pivot-based swing detection**: Configurable left/right bar lookback with cooloff mechanism
- **Line and zone visualization**: Connects consecutive swings with shaded support/resistance regions
- **Array-based storage**: Previous swing values preserved for BOS comparison logic
### **BOS Detection Engine**
- **Dual-condition logic**: Structure break + trend alignment (RSI EMA slope) required
- **Automatic S/R projection**: Lines, zones, and labels generated upon BOS events
- **Cooloff management**: Prevents signal spam during extended directional moves
### **Divergence System**
- **Price-RSI pivot comparison**: Detects higher-high/lower-high and lower-low/higher-low patterns
- **Zone filtering**: Divergences only trigger in appropriate zones (above/below 50)
- **Visual markers**: Triangle shapes with "DIV" text for instant recognition
### **Auto Pivot Management**
- **Dynamic level tracking**: Arrays store lines, values, and labels
- **Duplicate filtering**: Prevents redundant lines within 2 RSI points
- **Capacity control**: Automatic removal of oldest lines when maximum reached
- **Optional extension**: Lines can extend infinitely right for persistent reference
### **Performance Profile**
- **Lightweight computation**: Efficient pivot detection and array management
- **Real-time responsiveness**: Immediate updates on bar close
- **Scalable across timeframes**: Maintains clarity from 1-minute to daily charts
- **Configurable visual elements**: All features can be toggled for custom layouts
---
## **Optimal Application Parameters**
### **Timeframe Guidance**
**1-5 Minute Charts (Scalping):**
- RSI Length: 9-11 (faster response)
- RSI EMA Length: 5-7
- Structure Lookback: 3-4
- Pivot Lookback: 3-4
- Use Case: Micro momentum shifts, quick BOS entries
**15-60 Minute Charts (Intraday Swing):**
- RSI Length: 14 (standard)
- RSI EMA Length: 9
- Structure Lookback: 5
- Pivot Lookback: 5
- Use Case: Intraday structure breaks, divergence reversals
**4 Hour - Daily Charts (Position Trading):**
- RSI Length: 14-21
- RSI EMA Length: 13-21
- Structure Lookback: 7-10
- Pivot Lookback: 7-10
- Use Case: Major momentum shifts, high-timeframe divergences
### **Suggested Configuration (Default)**
- **RSI Length**: 14 (industry standard)
- **RSI EMA Length**: 9 (smooth but responsive)
- **Overbought Level**: 70
- **Oversold Level**: 30
- **Structure Lookback**: 5 bars
- **Structure Cooloff**: 8 bars
- **BOS Cooloff**: 10 bars
- **S/R Extension**: 20 bars
- **S/R Buffer**: 0.5 RSI points
- **Pivot Lookback**: 5 bars
- **Max Pivot Lines**: 4 per side
- **Divergence Lookback**: 5 bars
- Use strength dots as primary filter—require large dots for entries
- Rely heavily on divergences and structure zones
**Trending Markets:**
- Focus on BOS signals aligned with RSI EMA slope
- Use pivot lines as profit targets
- Ignore counter-trend divergences until RSI EMA changes slope
**Ranging Markets:**
- Emphasize divergences at extreme levels
- Trade bounces from pivot lines
- Reduce reliance on BOS signals (more false breaks)
---
## **Performance Characteristics**
### **High Effectiveness:**
- **Trending markets with clear momentum cycles**: RSI structure aligns with price structure for reliable BOS signals
- **Markets with defined swing patterns**: Pivot lines and structure zones provide accurate support/resistance
- **Divergence-prone assets**: Assets that respect momentum/price divergences (equities, major FX pairs)
- **Timeframes with sufficient volatility**: RSI candles show meaningful patterns when price moves decisively
### **Reduced Effectiveness:**
- **Choppy, sideways markets**: RSI oscillates around 50 with no structural pattern, generating false BOS signals
- **Low-liquidity assets**: Erratic price action creates unreliable RSI swings
- **News-driven volatility spikes**: Sudden moves invalidate structure and create whipsaws
- **Extremely low timeframes (< 1 minute)**: Noise overwhelms signal, structure breaks lack follow-through
### **Optimal Market Conditions:**
- **Clear momentum phases** with defined RSI EMA trend
- **Respect for previous swing levels** in RSI space
- **Volume participation** during BOS events (combine with volume indicator)
- **Alignment between RSI structure and price structure**
---
## **Integration Guidelines**
### **Confluence Framework**
Combine RSI Candles Pro with:
1. **Volume analysis** (Institutional Zone Detector, volume profile) to confirm RSI BOS with volume participation
2. **Price structure** (Smart Money Concepts, order blocks) to align RSI momentum with price levels
3. **Trend indicators** (moving averages, Supertrend) for higher-timeframe directional bias
4. **Volatility indicators** (ATR, Bollinger Bands) for stop-loss and profit target placement
### **Directional Control**
- **Never trade against RSI EMA slope** unless high-conviction divergence present
- **Require BOS alignment** with RSI EMA direction for continuation trades
- **Wait for RSI EMA slope change** before taking counter-trend reversals
### **Risk Calibration**
- **Stop-loss placement**: Beyond recent RSI structure swing (converted to price)
- **Position sizing**: Larger positions for strong candles (large dots) at BOS events
- **Profit targets**: Next pivot line level or opposite-zone boundary (70/30)
- **Trail stops**: Use S/R lines as trailing stop levels after BOS
### **Multi-Timeframe Synergy**
1. **Check higher timeframe** (3x-5x current): RSI EMA slope and major structure
2. **Identify current timeframe**: BOS events and divergences
3. **Execute on lower timeframe** (1/3x-1/5x current): Strength-confirmed entries at pivot levels
4. **Align all timeframes**: Only trade when RSI structure agrees across timeframes
### **Alert Strategy**
Enable alerts for:
- **RSI BOS events**: Immediate notification of momentum structure breaks
- **Divergences**: Early warning of potential reversals
- **Extreme zone entries**: RSI crossing 70/30 levels
- **RSI EMA trend changes**: Shifts in momentum trend direction
---
## **Disclaimer**
The RSI Candles Pro indicator is a professional-grade momentum visualization and structural analysis tool. It is not predictive or guaranteed profitable; performance depends on parameter tuning, market regime, and disciplined execution.
**Key Considerations:**
- RSI is a **derivative indicator** (calculated from price), not a leading indicator—it confirms momentum but does not predict future price
- **Divergences can persist** for extended periods; early entries may require multiple attempts
- **BOS signals may fail** in choppy markets; always use stop-losses and risk management
- **Optimal parameters vary** by asset, timeframe, and volatility regime—backtesting recommended
- **No indicator works in isolation**; combine with price action, volume, and market context
**Best Practices:**
- Paper trade new configurations before risking capital
- Maintain a trading journal to identify which signals work best for your style
- Adjust cooloff periods and lookback lengths based on asset characteristics
- Use in conjunction with fundamental analysis and broader market context
- Never risk more than 1-2% of capital per trade, regardless of indicator signals
This indicator is designed to enhance decision-making, not replace it. Traders should integrate RSI Candles Pro into a comprehensive analytical framework that includes price structure, volume analysis, and risk management protocols. Success requires consistent application of tested strategies, emotional discipline, and continuous adaptation to changing market conditions.

SYLVEREDGEPROTRENDThis indicator is the full Sylver Edge Pro™ execution engine for trading MES/MNQ on the 1-minute chart.
It combines a 20 SMA High/Low breakout system with Smoothed Heikin-Ashi (SHA) trend coloring, automatic R-multiple mapping (1R/2R/3R), structural signal-candle stops, and ONH/ONL reference levels. Entries only trigger when a confirmation candle closes beyond the signal candle high/low, so every trade is based on a clean, confirmed break.
On top of that, it adds multi-timeframe trend filters (optional 5-minute and 3-minute 20 SMA H/L trend) plus a Supertrend filter, blocking all counter-trend signals. A bottom-right Trend Panel shows “Trend: UP / DOWN / CHOP” with customizable colors, a filters status line (5m / 3m / ST ON–OFF), and sound-capable alerts that only fire when the market shifts from CHOP → UP or CHOP → DOWN, telling you when it’s safe to look for long or short setups again. The top-right R Panel tracks current R, max R reached, and drawdown from peak R, turning each trade into a controlled risk unit instead of random P&L.

BTC Macro Trend Framework by ZecheColor Indicator Meaning
🟩 Green Pi Cycle 355 SMA ×2 Long-term macro line (cyclical tops)
🔴 Red Pi Cycle 114 SMA Fast line (Pi Cycle signals)
🟧 Orange EMA 50W Mid-term trend
🔵 Blue EMA 200W Long-term macro bottom / key trend
🟪 Purple SuperTrend Short-term trend / momentum

KING 2 Super Trend Hull (Multi MA)KING supertrend MA nın multi time frame eklenmiş hali alexsander ma gibi ortalamalar da var içinde

MTF Dashboard Pro - Sachin ThakareMTF Dashboard Pro — Sachin Thakare
Version: 1.0
Overview:
A compact multi-timeframe dashboard built for intraday and swing traders. Shows per-TF values + signals:
- Change, %Chg, VWAP, EMA9/21, 200MA distance (with user threshold), SuperTrend, RSI, MACD, ADX, Alligator, Stochastic, ATR, PH/PL and Bias.
- Optional TrendShift flag (MSS + EMA9/21 confirmation) appears alongside Bias.
Notes:
- Pine Script v5. Adjust inputs to match your asset/timeframe. Default EMAs: 9 (red) and 21 (green).
- ma200Thresh parameter filters noise around 200MA (unit = percent). Recommended: 0.3–0.7 for intraday scalping.
- Use on desktop charts — table is not optimized for small mobile screens.
Disclaimer:
This indicator is educational and provided “as is”. Not financial advice. Test before trading.
Changelog:
1.0 — Public release
Author:
Sachin Yashwant Thakare

CharisTrend Indicatorthis trading indicator uses the following parameters EMA LOW (25 34 89 110 355 and 480) SMA(14 and 28) and Supertrend(14 3) for trading analysis and BUY/SELL Signals when the trade aligns.
