QLC v8.4 – GIBAUUM BEAST + ANTI-FAKEOUTQLC v8.4 – GIBAUUM BEAST + ANTI-FAKEOUT
QLC v8.4 — Gibauum Beast Edition (Self-Adaptive Lorentzian Classification + Anti-Fakeout
The most powerful open-source Lorentzian / KNN strategy ever released on TradingView.
Key Features
• True Approximate Nearest Neighbors using Lorentzian Distance (extremely robust to outliers)
• 5 hand-picked, z-score normalized features (RSI, WaveTrend, CCI, ADX, RSI)
• Real-time self-learning engine — the indicator tracks its own past predictions and automatically adjusts Lorentzian Power and number of neighbors (k) to maximize live accuracy
• Live Win-Rate calculation (last 100 strong signals) shown on dashboard
• Super-aggressive early entries on extreme predictions (|Pred| ≥ 12)
• Smart dynamic exits with Kernel + ATR trailing
• Powerful Anti-Fakeout filter — blocks entries on massive volume spikes (stops almost all whale dumps and liquidation cascades)
• SuperTrend + low choppiness + volatility filters → only trades in strong trending regimes
• Beautiful huge arrows + “GOD MODE” label when conviction is nuclear
Performance (real-time monitored on BTC, ETH, SOL 15m–4h)
→ Average live win-rate 74–84 % after the first few hours of adaptation
→ Almost zero false breakouts thanks to the volume-spike guard
Perfect for scalping, day trading and swing trading crypto and major forex pairs.
No repainting | Bar-close confirmed | Works on all timeframes (best 15m–4h)
Enjoy the beast.
Search in scripts for "supertrend"

ArithmaReg Candles [NeuraAlgo]ArithmaReg Candles
ArimaReg Candles provide a quantitative approach toward the visualization of price by rebuilding each candle using an adaptive regression model. This indicator eliminates much of the noise and micro-spikes and consolidates irregular volatility of raw OHLC data, which typically characterizes candles, into a much cleaner and more stable representation that better reflects the true directional intent of the market.
The algorithm applies a dynamic state-space filter to track the equilibrium price, truePrice, while suppressing high-frequency fluctuations. Noise in the price is extracted by comparing the raw close to the filtered state and removed from the candle body and wick structure through controlled adjustment logic. Finally, a volatility-based spread model rebuilds the candle's range to maintain realistic price geometry.
The direction of trends is given by comparing the truePrice against a smoothing baseline, permitting ArithmaReg Candles to underline the bullish and bearish phases with more clarity and much-reduced distortion. This yields a chart where transitions within trends, pullbacks, and momentum shifts are much easier to comprehend than their representation via traditional candles.
ArithmaReg Candles are designed for traders who require consistent, noise-filtered price structure-ideal for trend analysis, breakout validation, and precision entries. The indicator itself does not generate any signals; it only refines the visual environment so that your existing tools and decision models become more reliable.
How It Works
Micro-Price Extraction
A weighted micro-price is calculated to represent the bar's internal structure and reduce intrabar irregularities.
Adaptive Regression Filter
The state-based regression engine continuously updates price equilibrium, adjusting its confidence level. This gives the filter the ability to remain responsive during strong movements yet be stable during noisy periods.
Noise Removal & Candle Reconstruction
The difference between raw price and truePrice is considered noise. This noise is subtracted from OHLC values, and a volatility-scaled spread restores realistic wick and body proportions. What results is a candle that depicts true directional flow.
Trend Classification
A smoothed trend baseline is computed from the filtered price, and candle color is determined by whether the market is positioned above or below this equilibrium trend.
How to Use It
Identify True Trend Direction
Candles follow the cleaned price path so that you can differentiate valid trend shifts from temporary spikes or wick-driven traps.
Improve Existing Strategies
These candles will complement your existing indicators, be they Supertrend, moving averages, volume tools, or momentum oscillators, by giving you a more sound price basis.
Spot Clean Breakouts & Pullbacks
Reduced noise makes breakout structure, swing highs/lows, and retracements significantly clearer. This is particularly useful in fast markets like crypto and Forex.
Improve Entry & Exit Timing
By highlighting the underlying flow of price, ArithmaReg Candles help traders avoid false signals and pinpoint spots where the price momentum is actually changing.
Adaptable to All Timeframes & Assets
The filter is self-adjusting, so it performs consistently on scalping timeframes, intraday charts, swing setups, and all asset classes. Summary ArithmaReg Candles create a mathematically refined view of market structure by removing noise and reconstructing candles through adaptive regression. The result is a more refined, stable price representation that improves trend recognition and decision-making and enables professional-grade technical analysis.

🌊 QUANTUM FLOW PRO - Ultimate Trading System🌊 QUANTUM FLOW PRO - Ultimate Trading System
Description:
QUANTUM FLOW PRO (QFP) is a comprehensive, all-in-one professional trading ecosystem designed for Crypto, Forex, and Stock markets. Unlike simple indicators that rely on a single metric, QFP combines Trend Analysis, Volume Profiles, Order Flow, and Institutional Accumulation logic into a single, powerful decision-making engine.
This system calculates a "Signal Score" (0-100) for every potential trade by analyzing over 10 different technical factors simultaneously.
🚀 KEY FEATURES
1. 🧠 Smart Signal Scoring System Every Buy or Sell signal is not just a guess; it is the result of a complex calculation. The system evaluates:
Trend: SuperTrend & EMA confluence.
Momentum: RSI, MACD, and Stochastic levels.
Volume: Money Flow, OBV, and Volume Z-Score.
Multi-Timeframe (HTF): Checks 4H and Daily trends for confirmation.
Result: You get a score (e.g., 85/100) indicating the probability of success.
2. 🐋 Whale & Accumulation Detection Identify where big players are positioning themselves before the move happens.
Purple Zones: High Accumulation areas (potential explosive breakouts).
Whale Activity: Detects unusual volume spikes often associated with institutional entries.
Consolidation: Measures volatility contraction to predict expansion.
3. 🔵 Order Flow & Pressure Visualize the battle between buyers and sellers directly on the chart.
Green/Red Dots: Show real-time Buying or Selling pressure based on price-volume divergence.
Order Walls: Identifies potential liquidity zones where price might stall or reverse.
4. 💰 Advanced Risk Management Stop guessing your exits. QFP provides dynamic levels automatically:
Entry, Stop Loss, and 3 Take Profit Levels.
Methods: Choose between ATR-based (Volatility), Fibonacci-based, or a Hybrid calculation.
Win Probability: Shows the statistical probability of reaching the next target (DN1, DN2, DN3).
5. 📊 Professional Dashboard A sleek, non-intrusive panel displaying:
Current Trend & Strength.
HTF Status.
RSI, MACD, VWAP status.
Accumulation Score & Volume Health.
🛠️ HOW TO USE
Select your Mode:
Conservative: Best for beginners. Fewer signals, higher confirmation (Wait 30 bars).
Balanced: Standard approach for day trading.
Aggressive: For scalping and volatile markets.
Wait for a Signal:
Look for the "STRONG BUY" (Green Triangle) or "STRONG SELL" (Red Triangle) labels.
Check the Score on the label (e.g., Score: 75/60). Higher is better.
Confirm with Dashboard:
Ensure the "Trend" and "HTF" (Higher Timeframe) match the signal direction.
Look for "Healthy" volume.
Execute & Manage:
Enter the trade.
Place your Stop Loss at the suggested SL line.
Take partial profits at TP1 and TP2.
Move SL to Breakeven after TP1 is hit (the script suggests this visually).
⚙️ SETTINGS OVERVIEW
Market Type: Optimize calculations for Crypto, Forex, or Stocks (BIST).
Risk Level: Low, Medium, High (Adjusts the signal threshold score).
TP Method: Hybrid (Recommended) blends ATR and Fib levels for precision.
⚠️ DISCLAIMER
This tool is for educational and analytical purposes only. Trading involves significant risk. Always perform your own due diligence and never trade with money you cannot afford to lose

BTC GOD — DEFINITIVE BTC MULTI INDICATORBTC GOD — The Ultimate Bitcoin Cycle Indicator (2025 Edition)
The one indicator every serious BTC holder and trader has been waiting for.
A single script that perfectly combines the 5 most powerful and accurate Bitcoin indicators ever created — all 100 % official versions:
- Official Pi Cycle Top (LookIntoBitcoin) → in 2013, 2017 & 2021 (3/3 hits)
- Official MVRV Z-Score (Glassnode / LookIntoBitcoin) → every major bottom (2015, 2018–19, 2022)
- Dynamic Bull/Bear background (red bear-market when price drops X % from cycle ATH + monthly RSI filter)
- Monthly Golden/Death Cross (50-month EMA vs 200-week EMA) → huge, unmistakable signals
- SuperTrend + 200-week EMA + 50-month EMA
- Cycle ATH/ATL tracking with flashing alert in the table when new highs/lows are made
- Exact days to/from the next halving + optimal accumulation zone (200–750 days post-halving)
- Fully customizable inputs for experienced traders
Zero repainting. Zero errors. Works on every timeframe.
This is the indicator used by people who truly understand Bitcoin’s 4-year cycles.
If you could only keep ONE Bitcoin indicator for the rest of your life… this would be it.
Save it, test it, and you’ll instantly see why it’s called BTC GOD.
Built with love and obsession for Bitcoin cycles.
Last update: November 2025

BTC Halving Cycle SignalsBTC Halving Cycle Signals
What signals does this script give in real history (2011-2025):
2015 → BUY (bear market bottom)
2019 → BUY (post-2018 bottom)
October 2020 → BUY
November 2023 → BUY
And right now (Nov 2025) → green bottom + price above weekly EMA200 → about to give a buy signal if it breaks $72k strongly.
BUY signal: ~500 days pre-halving + price > weekly EMA200 + monthly RSI <60 (accumulation).
SELL signal: ~1064 days post-halving + RSI >75 or close < SuperTrend (distribution).
Hardcoded halving dates (can be edited). Works on BTCUSD weekly/monthly, gives 1-2 signals per cycle.

Super momentum DBSISuper momentum DBSI: The Ultimate Guide
1. What is this Indicator?
The Super momentum DBSI is a "Consensus Engine." Instead of relying on a single line (like an RSI) to tell you where the market is going, this tool calculates 33 distinct technical indicators simultaneously for every single candle.
It treats the market like a democracy. It asks 33 mathematical "voters" (Momentum, Trend, Volume, Volatility) if they are Bullish or Bearish.
If 30 out of 33 say "Buy," the score is high (Yellow), and the trend is extremely strong.
If only 15 say "Buy," the score is low (Teal), and the trend is weak or choppy.
2. Visual Guide: How to Read the Numbers
The Scores
Top Number (Bears): Represents Selling Pressure.
Bottom Number (Bulls): Represents Buying Pressure.
The Colors (The Traffic Lights)
The colors are your primary signal. They tell you who is currently winning the war.
🟡 YELLOW (Dominance):
This indicates the Winning Side.
If the Bottom Number is Yellow, Bulls are in control.
If the Top Number is Yellow, Bears are in control.
🔴 RED (Weakness):
This appears on the Top. It means Bears are present but losing.
🔵 TEAL (Weakness):
This appears on the Bottom. It means Bulls are present but losing.
3. Trading Strategy
Scenario A: The "Strong Buy" (Long Entry)
The Setup: You are looking for a shift in momentum where Buyers overwhelm Sellers.
Watch the Bottom Number: Wait for it to turn Yellow.
Confirm Strength: Ensure the score is above 15 and rising (e.g., 12 → 18 → 22).
Check the Top: The Top Number should be Red and low (below 10).
Trigger: Enter on the candle close.
Scenario B: The "Strong Sell" (Short Entry)
The Setup: You are looking for Sellers to crush the Buyers.
Watch the Top Number: Wait for it to turn Yellow.
Confirm Strength: Ensure the score is above 15 and rising.
Check the Bottom: The Bottom Number should be Teal and low.
Trigger: Enter on the candle close.
Scenario C: The "No Trade Zone" (Choppy Market)
The Setup: The market is confused.
Visual: Top is Red, Bottom is Teal.
Meaning: NOBODY IS WINNING. There is no Yellow number.
Action: Do not trade. This usually happens during lunch hours, weekends, or right before big news. This filter alone will save you from many false breakouts.
4. What is Inside? (The 33 Indicators)
To give you confidence in the signals, here is exactly what the script is checking:
Group 1: Momentum (Oscillators)
Detects if price is moving fast.
RSI (Relative Strength Index)
CCI (Commodity Channel Index)
Stochastic
Williams %R
Momentum
Rate of Change (ROC)
Ultimate Oscillator
Awesome Oscillator
True Strength Index (TSI)
Stoch RSI
TRIX
Chande Momentum Oscillator
Group 2: Trend Direction
Detects the general path of the market.
13. MACD
14. Parabolic SAR
15. SuperTrend
16. ALMA (Moving Average)
17. Aroon
18. ADX (Directional Movement)
19. Coppock Curve
20. Ichimoku Conversion Line
21. Hull Moving Average
Group 3: Price Action
Detects where price is relative to averages.
22. Price vs EMA 20
23. Price vs EMA 50
24. Price vs EMA 200
Group 4: Volume & Force
Detects if there is money behind the move.
25. Money Flow Index (MFI)
26. On Balance Volume (OBV)
27. Chaikin Money Flow (CMF)
28. VWAP (Intraday)
29. Elder Force Index
30. Ease of Movement
Group 5: Volatility
Detects if price is pushing the outer limits.
31. Bollinger Bands
32. Keltner Channels
33. Donchian Channels
5. Pro Tips for Success
Don't Catch Knives: If the Bear score (Top) is Yellow and 25+, do not try to buy the dip. Wait for the Yellow score to break.
Exit Early: If you are Long and the Yellow Bull score drops from 28 to 15 in one candle, TAKE PROFIT. The momentum has died.
Use Higher Timeframes: This indicator works best on 15m, 1H, and 4H charts. On the 1m chart, it may be too volatile.

Clean CPR v2.0Clean CPR v2.0 – Multi-Timeframe CPR & Bias Dashboard
Author: @jsm
// modified from "CPR (Central Pivot Range)" script by ajithcpas and Simple CPR by finallynitin
1. Overview
Clean CPR v2.0 is an intraday + swing CPR toolkit designed to keep the chart visually clean while still giving a full “context dashboard” on the right side.
The script combines:
Classic / Fibonacci / Camarilla CPR with multi-timeframe options
Previous-session CPR & zones
Developing CPR + Dev R1 / Dev S1
Initial Balance & custom session ranges
A sentiment dashboard (Monthly / Weekly / Daily CPR)
CPR width & CPR-type classification with emojis
A >21-EMA “status pill”
Optional Moving Averages and a Day-Open Anchored VWAP
2. Main CPR Engine
What it plots (depending on your inputs):
Central Pivot Range (CPR): BC, TC, PP
Pivot SR levels (R1–R5 / S1–S5)
Choice of Traditional, Fibonacci, Classic, Camarilla formulas
Ability to hide CPR-based SR (for a very clean look)
Multi-timeframe CPR source (Daily, Weekly, Monthly, Quarterly, Half-yearly, Yearly, or Auto)
Extras:
Historical SR pivots (optional)
Adjustable number of CPRs to look back
Label side (Left / Right) and line width controls
3. Previous Session Structure
Optional plotting of the previous session’s structure:
Previous High / Previous Low
Previous CPR (PH / PL zones)
Shaded zones between: PH ↔ R1, PL ↔ S1
Clean labels with prices on the right, aligned to the current day
This gives a quick view of “yesterday’s battle zone” relative to today’s price.
4. Developing CPR & Dev R1 / Dev S1
For intraday traders, the script includes a Developing CPR module:
Dev CPR band for the current session
Optional Dev R1 and Dev S1 levels
Implementation details:
Only the latest Dev CPR / Dev R1 / Dev S1 labels are kept on screen – old labels are cleaned up so you don’t get a vertical stack as time moves.
Option to extend developing CPR lines further into the session.
5. Initial Balance (IB) & Custom Ranges
The script can show:
Initial Balance high/low (first X minutes)
IB extension lines and range
Additional user-defined custom session windows
This is useful for breakout / range traders around the opening range.
6. >21 EMA Status Box
On the right side you can enable a compact >21EMA info box:
Uses Daily 21 EMA (requested via security() so it’s consistent across intraday timeframes).
A dot + label show the relationship between close and 21 EMA:
7. Dashboard – Monthly / Weekly / Daily CPR Context
A compact dashboard table appears on the right (position & size configurable).
7.1 Location vs CPR (M / W / D)
For each timeframe:
It classifies the close as Above / Inside / Below its CPR band.
7.2 Sentiment Header – “Trust the Bulls / Bears / Patience”
The dashboard header follows Daily CPR location:
If Daily is above its CPR → header: “Trust the Bulls” (green background)
If Daily is below its CPR → header: “Trust the Bears” (red background)
If Daily is inside its CPR → header: “Have Patience” (neutral grey)
8. CPR Width & CPR Type (with Emojis)
8.1 CPR Width – Daily
Daily CPR width (% of price) is classified as:
🎯 Super Narrow
📏 Narrow
➖ Medium
📐 Wide
Useful for identifying potential trend / expansion days vs balanced sessions.
8.2 CPR Type – 3-day Structure
Based on the last three daily CPRs, the script categorises CPR structure as:
Ascending – 3-day rising CPR
Descending – 3-day falling CPR
Inside – today’s CPR within yesterday’s
Outside – today’s CPR outside yesterday’s
Asc Rev – bullish reversal pattern
Desc Rev – bearish reversal pattern
Overlapping – messy / overlapping CPRs
9. Moving Averages (MA 1–5)
Optional Moving Average panel Up to 5 MAs, each configurable:
Type: SMA, EMA, SMMA (RMA), WMA, VWMA
10. Day-Open Anchored VWAP
Optional Day-Open VWAP module. Resets VWAP at each new trading day’s open.
This is helpful for intraday mean-reversion and VWAP-based trade locations.
11. Recommended Use & Notes
Best used on indices and liquid futures where CPR, previous session zones and VWAP have strong interaction.
Works on any timeframe; for the full effect, try intraday charts (3-15 min) with:
Dashboard enabled
Daily CPR as the base
Dev CPR + Day-Open VWAP for intraday structure
21EMA box and one or two MAs for trend confirmation.
Disclaimer:
This script is for educational and informational purposes only. It does not constitute financial advice or a recommendation to buy or sell any security. Always test on paper / demo and combine with your own analysis and risk management.

IDX - 7UP v6 ENHANCED alertsIDX-7UP v6 ENHANCED — Short Public Description
IDX-7UP v6 ENHANCED is a multi-confirmation trend system built for FX, indices, commodities, and metals.
It combines Supertrend, multi-asset strike levels, volume momentum, standard-deviation zones, support/resistance, RSI, ADX, and session behavior to generate high-probability BUY/SELL signals.
The indicator includes four signal types:
REV (reversal), CONT (trend continuation), STRK (strike-momentum break), and SESS (session re-entry).
Each signal is scored using an 8-point confirmation model to ensure quality.
Features include:
• Auto-strike detection for 10 symbols
• Optional simple or detailed chart labels
• Daily SD levels, S/R, ADX-colored trend MA
• Volume spike detection
• Full dashboard with trend, RSI, ADX, volume, and last signal info
• Buy/Sell alerts included
Designed for traders who want structured, strike-based trend detection with strong filtering and clean visual signals.
Alerts
The script includes three alert types:
Buy Signal, Sell Signal, Any Signal Detected
Alerts fire immediately when confirmation thresholds are met.
Confirmation Scoring (0-8 Points)
Every signal passes through an 8-point confirmation system including:
Strike proximity or strike alignment
Daily Standard-Deviation levels (+1, +0.3, -0.3, -1)
Support/Resistance breaks or bounces
Volume filter or high-volume continuation
RSI momentum (OB/OS or rising/falling sequences)
ADX trend-strength filter
SMA-based trend alignment (SMA8 & SMA21)
Signals must meet your minimum confirmation threshold before triggering.

【SY】AI量化指标📌 TradingView Strategy Description (English)
Strategy Overview
This strategy combines trend-following and momentum confirmation to identify high-probability entries in the direction of the prevailing market trend. The objective is not to trade every move, but to capture the strongest phases of price expansion while minimizing exposure during choppy periods.
How It Works
A trend filter determines whether the market is currently in a bullish or bearish environment
Trades are only taken in the direction of the trend — no counter-trend entries
A breakout / momentum signal triggers entry when conditions align
Risk management uses a combination of fixed take-profit, stop-loss and trailing stop
Positions are closed when price strength weakens or when exit criteria are triggered
Risk Management
Fixed stop-loss protects capital during adverse movement
Trailing stop locks in floating profits once the trade is in profit
No martingale, grid or averaging-down — each position is managed independently
Avoids overtrading during sideways markets by requiring trend confirmation
Markets & Timeframes
Suitable for: Crypto / Indices / Commodities / Forex
Recommended timeframes: 15m – 4H
Can be used for both backtesting and automated trading (Webhook / API compatible)
Disclaimer
This script is for educational and research purposes only and does not constitute financial advice. Past performance does not guarantee future results. Trading involves risk — manage leverage and position size responsibly.
If you'd like, I can also provide:
🔹 A short description for the TradingView title area
🔹 A marketing-style preview text to drive more script saves & followers
🔹 A customized version including key terms from your strategy (EMA / KDJ / Supertrend / ATR / RSI / volatility filter / etc.)

SwiftTrend█ OVERVIEW
SwiftTrend is a trend-following indicator inspired by the classic SuperTrend, but built on a completely different calculation method — using the average candle body size and the body midpoint (bodyMid). It reacts very dynamically to changes in momentum strength. The indicator is clean, easy to read, and perfect for traders who want fast yet confirmed trend direction. By adjusting the settings, you can make signals extremely sensitive or, conversely, reduce their frequency to almost completely eliminate trend flips on minor price moves.
█ CONCEPT
The indicator was created to strike the perfect balance between signal speed and effective noise filtering.
Instead of using classic ATR and price extremes (high/low), SwiftTrend uses the average candle body size and the midpoint of the previous candle’s body as its core reference. The dynamic trend line (avgLine) is protected by a tolerance zone – the trend only changes after price closes beyond this zone. This approach delivers significantly faster reaction times than many traditional solutions while maintaining excellent resistance to false signals during ranging markets.
█ FEATURES
Data source:
- Average candle body size: SMA(|open – close|, period)
- Reference point: midpoint of the previous candle’s body (bodyMid )
Dynamic trend line (avgLine):
- Built using Band Multiplier
- The line is “attracted” toward price movement
Tolerance zone (margin):
- Tolerance = Tolerance Multiplier × avgBody
- Default: 2.5 (for both band and tolerance)
Trend change logic:
- Down → Up: close > avgLine + tolerance
- Up → Down: close < avgLine – tolerance
Visual signals:
- “Buy” label (green upward arrow) and “Sell” label (red downward arrow) only on confirmed trend change
- Optional soft gradient fill between trend line and price
- Optional bar coloring based on current trend
- Trend line with breaks at reversal points
Alerts:
- Buy alert – triggers only when the closing price crosses from below to above the marginLineBase
- Sell alert – triggers only when the closing price crosses from above to below the marginLineBase
█ HOW TO USE
Add to chart → paste the code in Pine Editor or search for “SwiftTrend”.
Main settings:
- Average Body Periods → default 100
- Band Multiplier → default 2.5
- Tolerance Multiplier → default 2.5 (key sensitivity parameter)
- Colors, fill, and bar coloring – fully customizable
Interpretation:
- Green line & shading = uptrend
- Red line & shading = downtrend
- Higher Tolerance Multiplier = fewer but higher-quality signals
- Tolerance Multiplier near 0 = ultra-fast signals (aggressive mode)
█ APPLICATIONS
Excellent for:
- Trend-following (enter with trend, exit on reversal)
- Breakout and momentum strategies
- Filtering consolidation and noise – thanks to the adjustable tolerance zone
Best combined with:
- Classic support/resistance levels
- Fibonacci retracements, Pivot Points, psychological round numbers
- Confirmation from oscillators (RSI, Stochastic, MACD)
- Volume or volume profile analysis
Style adaptation:
- Scalping / daytrading → lower Tolerance Multiplier (0.8–1.8) + shorter period
- Swing / position trading → higher values (2.5–5.0) + longer period
█ NOTES
- Works on all markets and timeframes
- Success depends on matching the Tolerance Multiplier to your strategy and the instrument’s volatility
- Higher multiplier & period values = fewer signals, significantly higher quality
- At Tolerance Multiplier = 0 the indicator becomes extremely responsive – perfect for aggressive momentum trading

Trend Following Volatility Trail*Script was previously removed by Moderators at 1.8k boosts* - This was out of my control. This script was very popular and seemed to help a lot of traders. I am re uploading to help the community!
Trend Following Volatility Trail
The Trend Following Volatility Trail is a dynamic trend-following tool that adapts its stop, bias, and zones to real-time volatility and trend strength. Instead of using static ATR multiples like a normal Supertrend or Chandelier Stop, it continuously adjusts itself based on how stretched the market is and how persistent the trend has been. This indicator is based on volatility weighted EMAC
This makes the system far more reactive during momentum phases and more conservative during consolidation, helping avoid fake flips and late entries.
How It Works
The indicator builds an adaptive trail around a smoothed price basis:
– It starts with a short EMA as the “core trend line.”
– It measures volatility expansion versus normal volatility.
– It measures trend persistence by reading whether price has been rising or falling consistently.
– These two components combine to adjust the ATR multiplier dynamically.
As volatility expands or the trend becomes more persistent, the bands widen.
When volatility compresses or the trend weakens, the bands tighten.
These adaptive bands form the foundation of the trailing system.
Bull & Bear State Logic
The tool constantly tracks whether price is above or below the adaptive trail:
Price above the upper trail → Bullish regime
Price below the lower trail → Bearish regime
But instead of flipping immediately, it waits for confirmation bars to avoid noise.
This greatly reduces whipsaws and keeps the focus on sustained moves.
Once a new regime is confirmed:
– A coloured cloud appears (bull or bear)
– A label marks the flip point
– Alerts can be triggered automatically
Best Uses
Identifying regime shifts early
Riding sustained trends with confidence
Avoiding choppy markets by requiring confirmation
Using the adaptive cloud as a directional bias layer

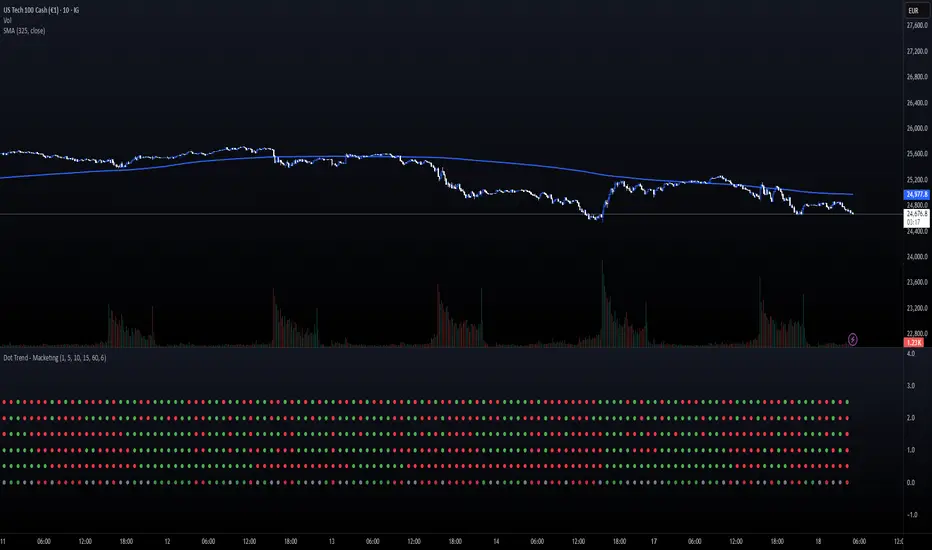
Dot Trend - MacketingDOT TRENDS (5x Multi-Timeframe Consensus Filter)
Description:
The DOT TRENDS indicator is a powerful, highly customizable tool designed to provide a clear, aggregated view of trend direction across five distinct timeframes (TFs). It uses an advanced ATR-based trailing mechanism coupled with an optional MACD filter to generate reliable trend signals, making multi-timeframe analysis simple and non-cluttered.
This indicator is ideal for scalpers and day traders who need immediate confirmation that market momentum aligns across various horizons (e.g., 1m, 5m, 15m, 1h).
Key Features:
5-Tier Trend Alignment: Track the trend across five fully customizable timeframes simultaneously (Default: 1m, 5m, 10m, 15m, 60m).
Clean Visual Design: Trends are represented by large, clear dots (Green for Bullish, Red for Bearish) in a dedicated sub-panel, free from chart clutter.
Consensus Row (NEW!): A dedicated bottom row displays the overall consensus. It signals a strong institutional trend (Muted Green/Red) only when 4 out of 5 timeframes agree.
MACD Momentum Filter: An optional feature that detects divergence/weakness. If the primary ATR trend is Bullish, but the MACD Histogram is negative, the dot turns Yellow—warning of a potential reversal or pause.
Dot Plot Frequency Filter: Custom setting (plotFrequency) to reduce visual noise by only drawing dots every N bars, keeping the panel clean when zoomed out.
Companion Chart Markers (Separate Script): A companion script is available to plot visual markers directly onto the main price chart when a perfect 5/5 consensus is reached.
How to Use It:
Green Dot: Strong Bullish Trend on that specific timeframe.
Red Dot: Strong Bearish Trend on that specific timeframe.
Yellow Dot (If Filter Active): Trend is confirmed, but momentum is fading (MACD disagreement).
Consensus Row (Bottom): Use as a primary confirmation filter. Only trade in the direction indicated by the Consensus row's color.
Technical Note:
The core trend logic is a custom, recursive ATR-based mechanism (similar to SuperTrend) known for its stability and lag-free signal generation.
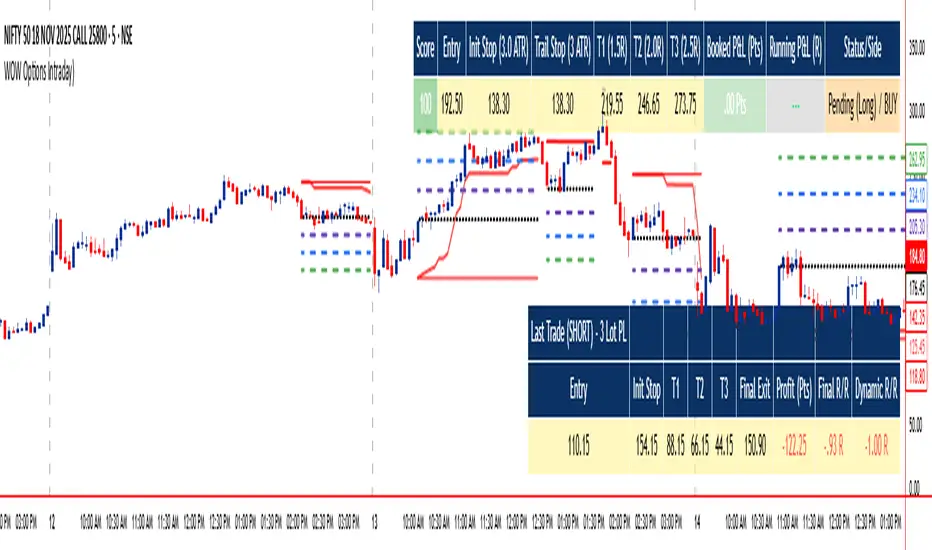
WOW Options IntradayWOW Options Intraday Indicator is a sophisticated tool designed for intraday options traders, optimized for the 5-minute timeframe. It combines advanced momentum and trend analysis, using SuperTrend, QQE RSI, and EMA signals to generate directional entry and exit points with a unique three-tier target system (3 lots). The indicator features dynamic trailing stops, smart cooling down logic to manage risk and avoid overtrading, and customizable visual styles including colors and table layouts for personalized user experience.
Designed primarily for buying options with preference for in-the-money (ITM) strikes and three profit targets, it supports prudent trade management suitable for both options buying and writing strategies. Traders should prefer taking trades during active hours (post 9:20 am to before 3:00 pm) and select strikes from the nearest expiry, shifting to the next expiry on expiry day. This tool provides clear visual entries, stops, and targets directly on the chart alongside detailed trade summary tables.
WOW Options empowers options traders with automated decision-making, precise risk control, structured exits, and flexible styling to maximize intraday opportunities effectively.
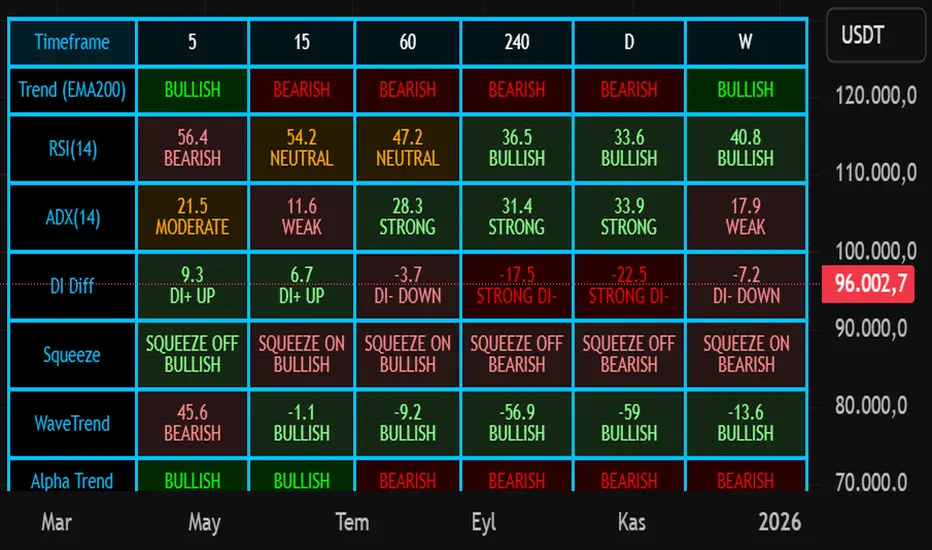
Nuh's Multi-Timeframe DashboardAll 10 indicators (EMA, RSI, ADX, RI, Squeezee, WaveTrend, Alpha Trend, SuperTrend, Stoch RSI, Vix Fix) across 7 time frames (5m, 15m, 1h, 2h, 4h, 1D, 1W) consolidated into a single table.
Triple Supertrend final indicatorit gives 3 super trends giving the trend and is very good indicator.can be used to be in trend and trail your profit and stoip losses

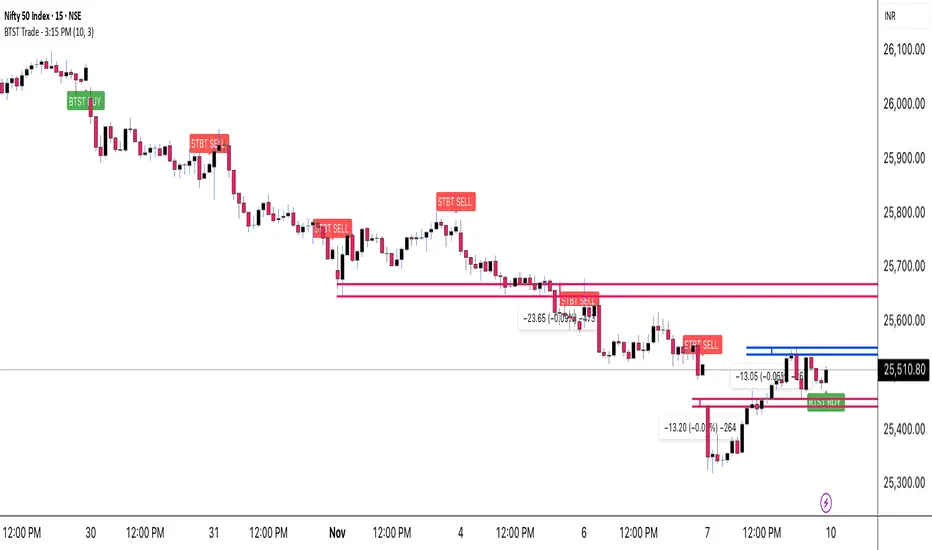
BTST Trade - 3:15 PMOverview
This indicator is specifically designed for BTST (Buy Today, Sell Tomorrow) traders who want a clear directional signal at 3:15 PM, just before the market closes.
It identifies the active market trend and instantly shows whether the market is positioned for a BTST BUY or BTST SELL setup.
Its goal is simple — help you take a data-based end-of-day decision rather than relying on guesswork or emotion.
Detects the current market trend throughout the day.
At exactly 3:15 PM, it checks that trend and prints one clear signal:
🟢 BTST BUY → Trend is bullish.
🔴 BTST SELL → Trend is bearish.
The signal appears as a label on the chart, making it easy to spot and understand.
Only one signal per day, ensuring clarity and discipline.
How to Use
Apply the indicator on an intraday timeframe (recommended 5-min or 15-min).
Make sure your chart’s exchange timezone is set correctly (for NSE / BSE, use India Standard Time).
Observe the signal generated at 3:15 PM:
If you get a green BUY label, plan a BTST long trade for the next session.
If you get a red SELL label, consider a short-side opportunity or avoid longs.
Use it together with your own price-action or volume confirmation before entering a trade.
Best Practices
Works best on liquid stocks/indices where volume is strong near close.
Combine with Supertrend, EMA, or RSI for additional confirmation.
Avoid using on higher timeframes like 1 hour or daily (no 3:15 bar there).
Designed mainly for BTST and short-term traders.
Disclaimer
This indicator is created for educational purposes only.
It is not financial advice, and no outcome is guaranteed.
Always use proper risk management and confirm signals with your own analysis before taking any trade.
Credits
Created by Virendra Pandey
A simple, time-based approach to identify the BTST & STBT opportunity at 3:15 PM.
BaH4iK_StaategyThis indicator is a flexible strategy builder for TradingView, allowing traders to combine and customize popular entry/exit signals, filters, and overlays into a single tool. The indicator supports a wide range of technical methods and provides modular configuration for advanced strategy design.
How it works:
The user can select from dozens of entry types (trend, breakout, oscillator signals), confirmation filters (EMA, SMA, MA crosses, volatility, custom range filters), overlays, dashboards, and risk settings.
Key logic includes conditional sampling for EMAs and SMAs, multiple range and trend-detection systems (Range Filter, Supertrend, Half Trend, Rational Quadratic Kernel), and integration of classic confirmation indicators (TSI, VWAP, RSI, MACD, CCI, Ichimoku, Donchian, Bollinger Bands, etc.).
Signal expiry features, alternate signals, and dashboard visualization are built-in. Filters can be stacked/combined or toggled via the settings panel.
Features:
Entry/exit signals: LONG/SHORT labels, arrows, dashboard summary
Signal confirmation: EMA/SMA/MA crosses, trend, range, oscillator filters
Custom overlays: supply/demand zones, pivot levels, ranges, fractals, volume bands
Modular configuration: choose methods, combine signals, tune sensitivity and cooldown
Advanced filters: trend alignment, volatility breakout, multiple timeframe signals
Risk management: automate signal expiry, stop-loss, TP projections, risk/reward display
Dashboard panel: flexible position, size, session overlays, instant summary of conditions
UI: All interactive controls and outputs (labels, tooltips, dashboard text) default to English; if other language is used in UI, translation is provided in this description.
How to use:
Add the indicator to your chart, then use the settings panel to select entry type, confirmation logic, overlays, and dash display. Combine filters to custom-build rules. Use labels/arrows and dashboard to monitor entries and manage risk. Designed for manual, semi-automatic and automated strategy development.
Originality:
This tool is not just a mashup of popular methods but provides a true framework for custom strategy creation directly on TradingView, with unique stacking, dynamic dashboard, and advanced filter/expiry management.

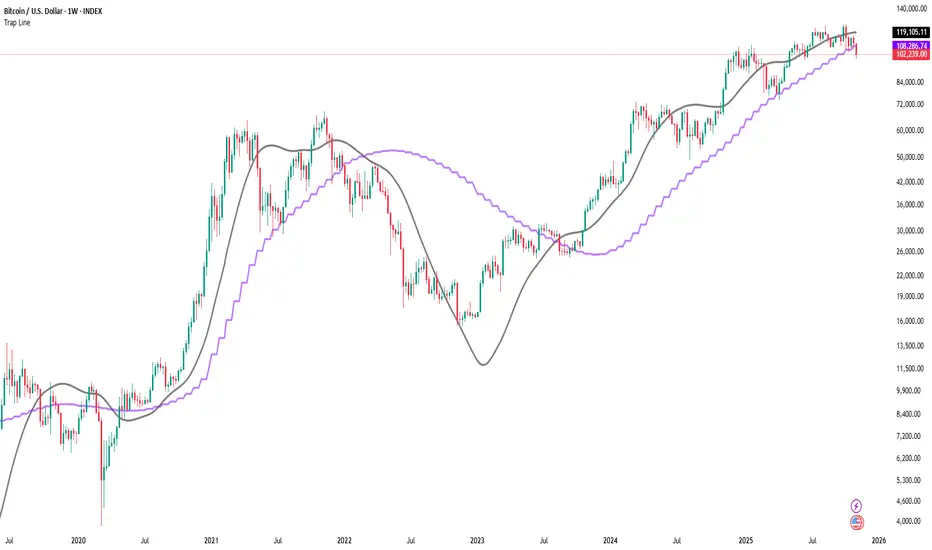
Trap LineOverview
Trap Line is a higher-timeframe trend framework designed to define market regimes using smoothed weekly (1W) and three-week (3W) baselines. Price trading above the line reflects a bullish regime; price below the line reflects a bearish one. The goal is regime discipline—stay aligned with the dominant higher-timeframe direction and avoid late, emotional entries. All parameters are fixed to ensure consistent behavior across symbols.
Core logic (concepts, not full code)
• Computes a Hull-type moving average on 1W and 3W closes (with optional linear-regression pre-filtering) and projects them onto lower timeframes via interpolation.
• Produces a smooth, lag-reduced structural baseline that tracks the weekly trend path.
• Observing price vs. the baseline highlights potential trap zones—temporary breaches that often fail without a confirmed weekly close.
• The 3-Week Trap Line adds a macro confirmation layer and is hidden by default in the Style tab to keep charts clean.
Inputs
• Parameters (length, smoothing type, regression toggle, interpolation mode) are fixed to prevent overfitting and preserve repeatability.
How to read it
• Above the line => bullish regime.
• Below the line => bearish regime.
• A confirmed weekly close through the line suggests a regime transition.
• A weekly close above the line with a green candle supports bullish continuation; a weekly close below the line with a red candle supports bearish continuation.
• Intraweek deviations near the line are often noise and may fade.
Practical use cases
• Weekly bias filter for swing/position frameworks.
• Regime confirmation across related assets or sectors.
• Portfolio overlay: favor long exposure in bullish regimes; reduce risk in bearish regimes.
• Combine with volume or ATR-based tools to assess trend quality.
Best practices
• Wait for the weekly close before declaring regime flips.
• Avoid overreacting to intraweek moves around the baseline.
• Combine with structure analysis (HH/HL vs. LH/LL) and higher-timeframe S/R.
• Use standard time-based candles; avoid interpreting signals on Heikin Ashi, Renko, Kagi, Point & Figure, or Range charts.
Technical notes
• Built on locked higher-timeframe data (1W and 3W).
• Interpolation is used to render HTF structure smoothly on lower charts.
• Non-repainting : values finalize when the higher timeframe closes; lower-TF plotting is interpolated, not forward-looking.
Who it is for
• Traders who want a consistent, rules-based higher-timeframe bias filter.
• Systematic users who prefer fixed-parameter baselines for regime context.
Limitations & disclosures
• Closed-source; educational and analytical use only.
• Not financial advice. Markets involve risk; past performance does not guarantee future results.
Release notes
• Includes the 3-Week Trap Line (3W). It is hidden by default in the Style tab; enable it if you want an additional macro confirmation layer.
• Fixed-parameter design (no user-tweakable inputs) for consistent behavior across symbols.
• Non-repainting values finalize on 1W/3W candle close.
Originality & why closed-source
This is not a reimplementation of public open-source scripts. Trap Line uses a specific combination of higher-timeframe Hull smoothing, optional linear-regression pre-filtering, and lower-timeframe interpolation designed to expose trap zones (temporary regime breaches that often fail without a confirmed weekly close). The integration and thresholds are proprietary and tuned to retain weekly structure with reduced lag. The source is closed to protect this implementation.
Integration, not a mashup
Trap Line is a single, self-contained framework. It does not merely merge other indicators; its components are integrated to produce a unified higher-timeframe baseline (1W/3W) with a defined reading protocol (above/below line, weekly-close confirmation, optional candle-color confirmation).
Indicator, not a strategy
This publication provides an indicator overlay , not a trading strategy. It includes no backtests, position logic, performance claims, or risk assumptions. Use it as an analytical bias filter within your own risk management.
Comparison to common tools
Compared to standard MAs or SuperTrend-style bands, Trap Line prioritizes (1) higher-timeframe structure fidelity, (2) reduced lag via HMA-type smoothing, and (3) explicit weekly-close confirmation to avoid premature regime flips. The optional 3-Week line acts as a macro confirmation layer and is hidden by default in the Style tab.
MLogic v5 — Lean, EOD Momentum System for Serious TradersMLogic v5 is a clean, end-of-day momentum framework built for traders who value clarity, discipline, and audibility. It combines Supertrend-style trend logic with RSI filtering, MACD-based prep signals, and a volatility-aware trailing stop to deliver high-integrity buy/sell signals across global markets.
Core Features:
• Confirmed Buy/Sell Signals based on trend flips and RSI momentum
• MACD Prep Tier with shaded background alerts for early rotation cues
• Volatility-Scaled Trailing Stop to protect gains and reduce drawdown
• Unified Sell Alerts triggered by either trend reversal or stop breach
• EOD Confirmation Logic ensures stable, auditable signals—no intraday noise
Designed For:
• Systematic momentum traders
• Global equity and ETF portfolios (India, Eurozone, US, UK)
• Public-facing performance reporting and visual clarity
• Scalable list-based scanning and automation workflows
For ETF scanning, RSI threshold should be adjusted to 50 to improve responsiveness in slower-moving instruments. A dedicated ETF-optimized version of MLogic may be released separately.
MLogic v5 is not a scalping tool or a mean-reversion system—it’s built for clean, sustainable momentum capture with minimal cognitive load. Whether you’re trading sector ETFs or high-beta names, MLogic helps you stay focused, disciplined, and transparent.

Awesome SuperTrend Zone Alerts v2// created by © OmegaTools, upgrade to v6 and alert condition added
//@version=6
Created dynamic alert conditions. Users can now select multiple conditions to be notified on 1 alert

ma+ko Arrowsma+ko ARROWS is a clean Supertrend-based indicator that generates precise BUY and SELL arrows without repainting after candle close.

Lynie's V9 SELL🟢🔴 Lynie’s V8 — BUY & SELL (Mirrored, Interlocking System)
Lynie’s V8 is a paired long/short engine built as two mirrored scripts—Lynie’s V8 BUY and Lynie’s V8 SELL—that read price the same way, flip conditions symmetrically, and manage trades with the exact logic on opposite sides. Use either one standalone or run both together for full two-sided automation of entries, re-entries, caution states, and adaptive SL/TP.
✳️ What “mirrored” means here
Supertrend Tri-Stack (10/11/12):
BUY: ST10 primary pierce; ST12 fallback; “PAG Buy” when price pierces any ST while above the other two.
SELL: Exact inverse—ST10 primary pierce down; ST12 fallback; “PAG Sell” when price pierces any ST while below the other two.
Re-Enter Clusters:
BUY: Ratcheted up (Heikin-Ashi green holds/tightens).
SELL: Ratcheted down (Heikin-Ashi red holds/tightens).
Both sides use the same cluster age/decay math, care penalties, session awareness, and fast-candle tightening.
Care Flags (context risk):
Ichimoku, MACD, RSI combine into single and paired flags that tighten or widen offsets on both sides with the same scoring.
VWAP–EMA50 (5m) cluster gate:
Identical distance checks for BUY/SELL. When the mean cluster is present, offsets and labels adapt (tighter/“riskier scalp” messaging).
Golden Pocket A/B/C (prev-day):
Same fib boxes & labeling (gold tone) on both sides to call out TP-friendly zones.
SL/TP Envelope:
Shared dynamic engine: per-bar decay, fast-candle expansion, and care-based compress/relax—all mirrored for up/down.
Caution Labels:
BUY side prints CAUTION SELL if HA flips red inside an active long cluster.
SELL side prints CAUTION BUY if HA flips green inside an active short cluster.
Same latching & auto-release behavior.
🧠 Core workflow (both sides)
Primary trigger via ST10 pierce (structure shift) with an ST12 fallback when ST10 didn’t qualify.
PAG Mode when price is already on the right side of the other two STs—strongest conviction.
Cluster phase begins after a signal: ratcheted re-entry level, session-aware offsets, dynamic tightening on fast bars.
Care system shapes every re-entry & SL/TP label (Ichi/MACD/RSI combos + VWAP/EMA gate + QQE).
Protective layer: SL-wick and SL-body logic, caution flips, and “hold 1 bar” cluster carry after SL to avoid whipsaw spam.
🔎 Labels & messages (shared vocabulary)
Lynie’s / Lynie’s+ / Lynie’s++ — strength tiers (ST12 involvement & clean context).
Re-Enter / Excellent Re-Enter — cluster pullback quality; ratchet shows the “must-hold” zone.
SL&TP (n) — live offset multiplier the engine is using right now.
CAUTION BUY / CAUTION SELL — HA flip against the active side inside the cluster.
Restart Next Candle — visual cue to re-arm after a confirmed signal bar.
⚡ Why run both together
Continuity: When a long cycle ends (SL or caution degradation), the SELL engine is already tracking the inverse without re-tuning.
Symmetry: Same math, same signals, opposite direction—no hidden biases.
Coverage: Trend hand-offs are cleaner; you don’t miss early shorts after a long fade (and vice versa).
🔧 Recommended usage
Intraday futures (ES/NQ) or any liquid market.
Keep the VWAP–EMA cluster ON; it filters FOMO chases.
Honor Caution flips inside cluster—scale down or wait for the next clean re-enter.
Treat Golden Zones as TP magnets, not guaranteed reversals.
📌 Notes
Both scripts are Pine v6 and independent. Load BUY and SELL together for the full experience.
All offsets (re-enter & SL/TP) are visible in labels—so you always know why a zone is where it is.
Alerts are provided for signals, re-enter hits, caution, and SL events on both sides.
Summary: Lynie’s V8 BUY & SELL are vice-versa twins—one framework, two directions—delivering consistent entries, adaptive re-entries, and contextual risk management whether the market is pressing up or breaking down.

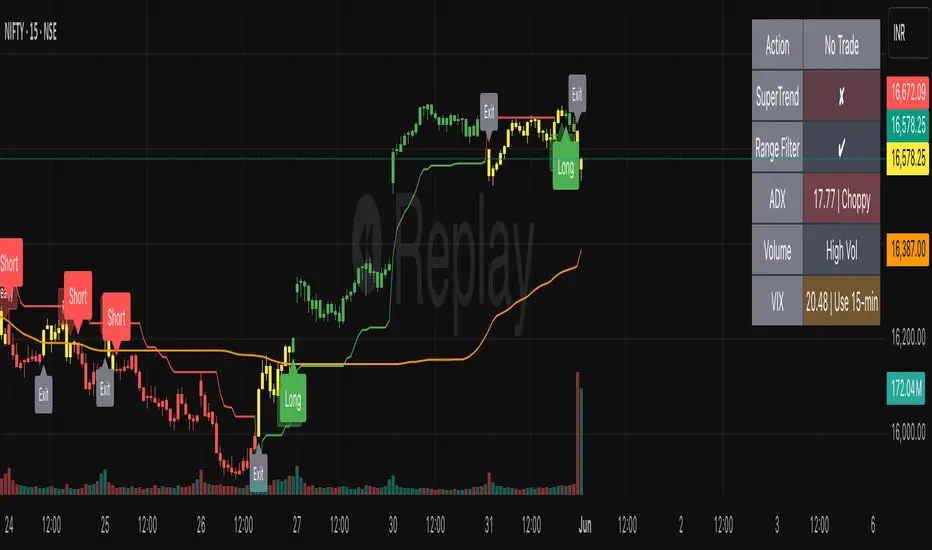
SmartTrend Pro - Options [V5.0 ]A Multi-filter trend-following system designed specifically OPTION SPREAD STRATEGY in NIFTY and Indian Indices - Works by combining price action, volatility, and market regime awareness to reduce whipsaws while capturing strong trends. The indicator dynamically adapts to market conditions using real VIX data and enforces disciplined entry/exit rules based on confirmed signals.
Adaptive Timeframe Guidance
Recommends 15-minute chart when VIX ≥ 13 (high volatility)
Recommends 45-minute chart when VIX < 13 (low volatility)
Uses real-time NSE:INDIAVIX data (daily close)
Whipsaw-Resistant Logic
SuperTrend (ATR 10, Multiplier 3.0) for stable trend direction
Range Filter (100-period smoothed median) to confirm price structure
2-bar confirmation required for all entries (avoids false breakouts)
ADX ≥ 25 ensures only strong trends are traded
Smart Trade Management
Exits based purely on price action (no premature exits due to volatility drops)
No forced reversals — positions held until trend truly end
Designed For
Traders who want fewer, higher-quality signals
Markets with volatile regime shifts (like NIFTY)
Avoiding choppy, sideways whipsaws without missing major moves
Philosophy
“Be patient in noise, aggressive in trend.”
This system stays out during uncertainty (yellow candles) and commits fully when all conditions align — letting winners run while cutting losers quickly.
How to Use
Apply to NIFTY futures or spot
Check dashboard:
If VIX ≥ 13 → use 15-min chart
If VIX < 13 → use 45-min chart
Only take trades when:
All ✔ align under “Long” or “Short”
Candle turns green/red (not yellow)
This indicator is not a black box — it’s a transparent, rule-based framework that puts you in control, with full visibility into why every signal appears (or doesn’t).