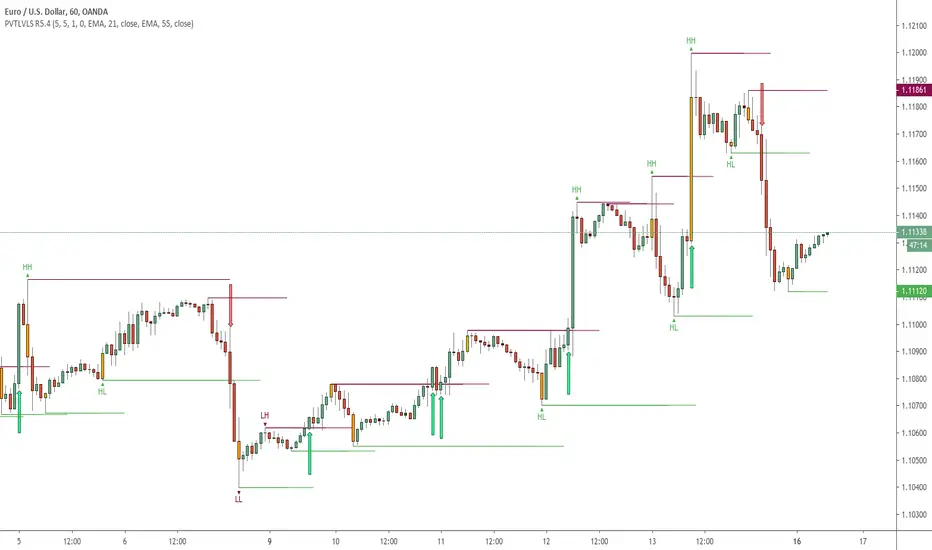
Pivot Support & Resistance multi timeframe [LM]Hello guys,
I would like to introduce you pivot support and resistance horizontals. It draws line horizontals on high and low high pivot candles . You can select lines on this timeframe and/or another one.
The colors are dynamic depending whether price is below or above the line:
for the current timeframe green is used for support and blue for resistance
for the other timeframe by default 4h orange is used for support and violet for resistance
There are various sections in setting:
current timeframe pivot setting
show and hide section of the current timeframe
other timeframe pivot setting
show and hide other timeframe horizontals
I'm mainly looking smaller timeframe and trading higher timeframe from level to level
Any suggestions are welcome
Search in scripts for "support"

True Strong Classical Support/Resistance LevelsThis script is based on the approach of filtering signals by checking higher timeframes.
So basically setting higher numbers in "Strength Of Levels" option, will make the indicator check for support and/or resistance levels in timeframes higher than the current.
Unfortunately, I was forced to still use inefficient built-in functions pivothigh() and pivotlow(). I hope they fix them up soon!
I'm looking for any opinion about the idea and if you like any of my scripts, anything you send means a lot to me.
This script is published for the third time because of some moderators absurd behavior.
But thank heavens, the code is now more clean and of course the option "Strength Of Levels" accepts float numbers.

[LunaOwl] Support Resistance Strategy V4作品: 支撐壓力策略
A simple Support Resistance Breakthrough Strategy, the only difference is that it is PineScript @version=4. interested parties can use it as a reference.
Its logic is simple, wish your all the best.
一個簡單的支撐阻力突破策略,唯一的差異,在於它是PineScript第四版。有興趣的可以拿來當作參考,簡易的指標。祝你們順心。
Support level refers to the support price that the exchange rate may encounter when it falls, so as to stop falling and stabilize the price.
The corresponding concept is the resistance level, that is, the pressure that the exchange rate may encounter when it rises, thus reversing to a falling price.
支撐位是指匯價在下跌時可能遇到的支撐價格,從而止跌回穩的價格,對應的概念是阻力位,也即匯價上漲時可能遇到的壓力,從而反轉為下跌的價格。
NSDT Auto Support / Resistance LevelsSimple script that automatically plots support and resistance lines based on the pivot points of the number of candles you choose to look back upon.
All options are editable.

Phicube EMASAR ( EMA Support and Resistance )Indicator based on the Concept created by Bo Williams. But unlike the original that uses MIMAs, EMAs are used here.
Exponential moving averages will be shown according to fractal alignment, in order to show the important support and resistance levels ( SAR ).
When the fractals are aligned to become support,
we will have the EMA in the graph with a bright color.
When the fractals are aligned to become resistance, we will have EMA in the graph with a matte color.
Available exponential moving averages: 17,34,72,144,305,610,1292 and 2584
____________________________________________________//_____________________________________________________________________
Indicador baseado no Conceito criado pelo Bo Williams. Mas diferente do original que utiliza MIMAs, aqui é utilizado EMAs.
As médias móveis exponenciais serão mostradas de acordo com o alinhamento dos fractais, com objetivo de mostrar os níveis importantes
de suporte e resistência( SAR ).
Quando estiver com os fractais alinhados virando suporte, teremos no gráfico a EMA com uma cor em tom brilhante.
Quando estiver com os fractais alinhados virando resistência, teremos no gráfico a EMA com uma cor em tom fosco.
Médias móveis exponenciais disponíveis: 17,34,72,144,305,610,1292 e 2584


Alto Basso Swing Pivots + Barry Support Resistance Levels2 indicators, 1 script: swing pivots and Barry support resistance levels
Alto
high swing pivot
Basso
low swing pivot
Dal Segno
lookback period length for swing pivots
Barry Length
length for support resistance calculation
--------------------------------------------------------------------------------------------------------------------------------------------------------------------------------------------
Use swing pivots for confirmation of new structure levels on short term
Barry support resistance levels in proximity to standard pivots or Fibonacci levels may indicate greater strength
credit to BacktestRookies and likebike
stay ♯
Example: Dal Segno 13, Barry Length 21

Automatic Support and Resistance %BThis script create support and resistance lines based on %B indicator
The script is multi timeframe.
Enjoy

Pivot Hilo Support n Resistance Levels R3-3 by JustUncleLThis is an update to the "Pivot HiLo Support n Resistance Levels" indicator, important updates are no re-painting; and different lengths available for each side of Pivot.
Description:
The Pivot Points are marked with "star" and with Optional Support and Resistance extension Levels shown.
Options:
Show Pivot Points (default true)
Pivot Length Left Side (default 7), the number of bars left hand side of the Pivot candle.
Pivot Length Right Side (default 3), the number of bars right hand side of the Pivot candle.
Show S/R Extension Levels (default true)
Maximum S/R Extension Length (default 0, no limit)
Show Pivot Labels (instead of "star") " " and " "
Revisions this release:
Added code to force Pivot to be always complete before drawing.
Added option for different length test for each side of Pivot.
Cueing Off Support And Resistance Levels, by Thom Hartle v 2.0Cueing Off Support And Resistance Levels, by Thom Hartle
The related article is copyrighted material from Stocks & Commodities.
You can change Time Frame in the settings: Monthly, Weekly, Daily

Cueing Off Support And Resistance Levels Backtest Cueing Off Support And Resistance Levels, by Thom Hartle
modified by HPotter for trade signals.
The related article is copyrighted material from Stocks & Commodities.
You can change long to short in the Input Settings
Please, use it only for learning or paper trading. Do not for real trading.
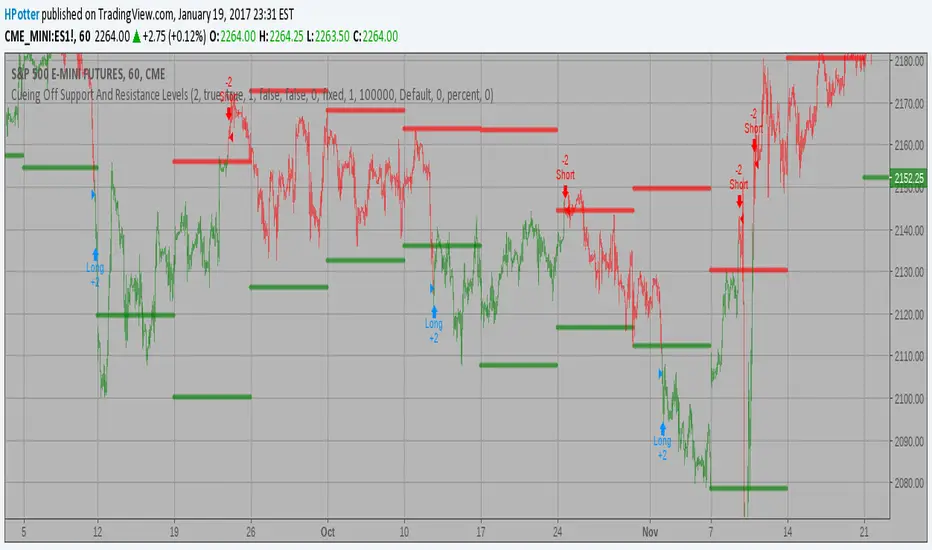
Cueing Off Support And Resistance Levels Cueing Off Support And Resistance Levels, by Thom Hartle
modified by HPotter for trade signals.
The related article is copyrighted material from Stocks & Commodities.

Cueing Off Support And Resistance Levels Cueing Off Support And Resistance Levels, by Thom Hartle
The related article is copyrighted material from Stocks & Commodities.

Support and Resistance Levels with Breaks (MTF + Alerts FIXED) Support and Resistance Levels with Breaks
Added MTF and FIXED Alarm for Support and Resistance line

Support Resistance-Session Box Breakout Support Resistance-Session Box Breakout สามารถใช้แนวรับแนวต้านจากSupport Resistance-Session Box หาจุกลับตัวหรือหาจุดเข้าเทรดได้

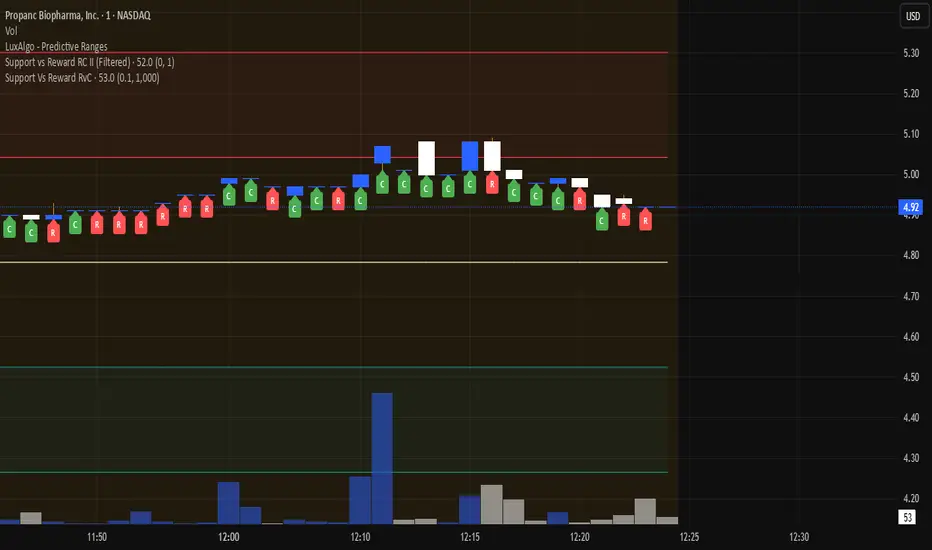
Support Vs Reward RvCSupport Vs Reward RvC
The Support Vs Reward RvC indicator is a simple yet effective tool that analyzes candle strength relative to both price movement and trading volume. Highlights candles where both body size and volume expand or contract, helping traders spot momentum shifts and weakening moves.
📌 How it works:
- “C” expect a Continuation of Trend in the next one or two candles;
- “R” expect a Reverse of Trend in the next one or two candles.
Works well on bigger time candles like 10-15 minutes but also gives important info in day-trading or scalping.
Marks candles where both body size and volume increase or decrease, making momentum shifts easy to spot. This smart candle analyzer reveals momentum surges and fading moves through body size and volume dynamics.
It compares each candle’s body size (open-to-close range) and its volume against the previous candle.
If both the body and volume are greater than the previous candle, a green “C” from Continuation of Trend is displayed under the bar.
If both the body and volume are smaller than the previous candle, a red “R” from Reverse of Trend is displayed under the bar.
Custom filters allow users to ignore insignificant moves by setting a minimum body size (as % of price) and a minimum volume threshold.
📌 Use cases:
Spot momentum shifts when price and volume expand together.
Identify weakening moves when both price action and volume contract.
Can be combined with other strategies for confirmation of entries or exits.
⚙️ Inputs:
Minimum Body Size % (of price): Filters out small candles.
Minimum Volume: Ensures only significant moves are marked.
This indicator is best used as a confirmation tool within a larger trading strategy, rather than as a standalone buy/sell signal.
Support and resistance channelsSupport and resistance channels on the wick which represents support and resistance

Custom Support LineIt is made with the following conditions in mind.
1. At the center of the candle at the moment,
Out of the last 10 candles, the low price (L) is within 3% of each other, drawing one line at the low prices of the candles.
2. Out of the last 10 candles, the market price (O) is within 3% of each other, drawing one line at the low end of each candle.
3.Out of the last 10 candles, the closing price (C) is within 3% of each other, and one line is drawn at the lower prices of the candles.
4. Draw one line when the three lines match the above three conditions.
We wanted to create a clear support line according to the above conditions.

Support Bands indicatorSupport Band to follow Trends.
We can see clear where price is Trading. Observe how moving averages are developing or aligning to change trend or continuation.
Green up trend vs Red Down Trend
Band 1
8EMA Green Line vs 10SMA Light blue Line
Band 2
21EMA Orange Line vs 30 SMA Brown Line
Also includes
1 SMA Gray line for closing when you're looking at weakly charts.
40 SMA darker Gray
50 SMA Blue
100 SMA White
150 SMA Pink
200 SMA Yellow
300 SMA Dark Red
I hope it helps you to see when price is trending up and a set correctly your stop.

Pivot Support/ResistanceThis indicator displays immediate Pivot Highs/Lows compared to the current price as lines on the chart. It can be useful to identify support/resistance.

[AB] Support/Resistance Drawing ToolThis script is designed to help you identify viable support and resistance levels by automatically creating lines that become less transparent when said levels hold. It is based on Donchian Channels created by rounded closes, not by highs and lows. You can use it as an aid to draw your levels manually, or stick exclusively to automatic charting.
Available settings are as follows:
Source - highly recommended to use Close, but other options are available if you'd like to do some experimentation.
Source Rounding - the accuracy of price sampling; higher rounding will make your lines more visible at the expense of precision. It is highly recommended to use decimals.
Length (Array) - the overall lookback of the script (length of the array). This value shouldn't be higher than 500 if skip = 2, or 250 if skip = 1. If you'd like to reach further back into the past, I'd recommend switching timeframes instead of increasing this beyond 500.
Sampling Skip - how frequently the data is sampled. I wouldn't recommend going beyond 2, especially with the default settings.
Transparency Skip - you can think of it as "pencil hardness". The higher the skip, the bigger the imprint of a single level detection will be. Wouldn't recommend going beyond 10.
Color R, G, and B - you can use these settings to adjust the color of the lines.

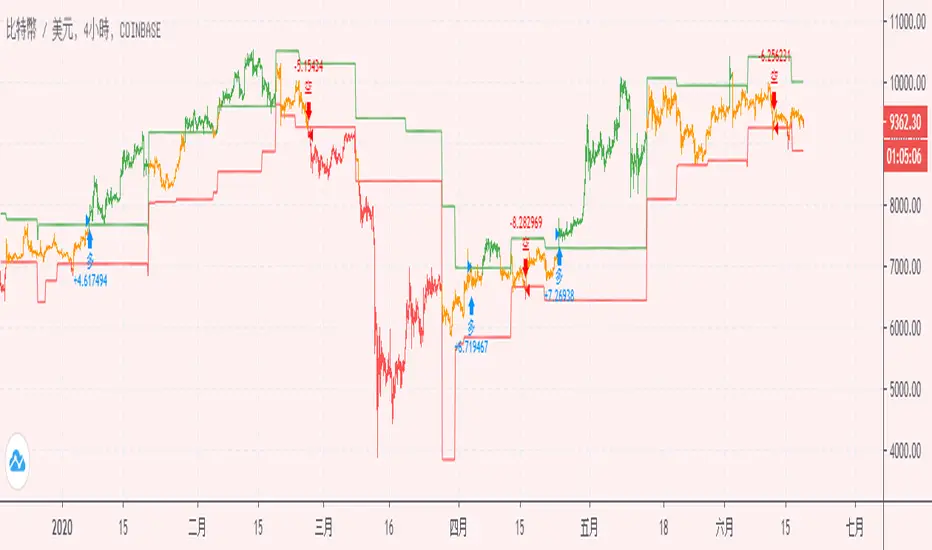
Bitcoin Daily Support/ResistanceA new indicator for tradingview.
Indicator Overview
The 2-Year MA Multiplier is intended to be used as a long term investment tool.
It highlights periods where buying or selling Bitcoin during those times would have produced outsized returns.
To do this, it uses a moving average (MA) line, the 2yr MA, and also a multiplication of that moving average line, 2yr MA x5.
Note: the x5 multiplication is of the price values of the 2yr moving average, not of its time period.
Buying Bitcoin when price drops below the 2yr MA (green line) has historically generated outsized returns. Selling Bitcoin when price goes above the 2yr MA x 5 (red line) has been historically effective for taking profit.
Why This Happens
As Bitcoin is adopted, it moves through market cycles. These are created by periods where market participants are over-excited causing the price to over-extend, and periods where they are overly pessimistic where the price over-contracts. Identifying and understanding these periods can be beneficial to the long term investor.
This tool is a simple and effective way to highlight those periods
MA 50/100/150 was historically good support and resistance. When we cross them we have a new trend that is established.
