Order Blocks & Breaker BlocksOrder Blocks & Breaker Blocks
Enhance your trading with this advanced indicator that highlights Bullish and Bearish Order Blocks (OBs) and Breaker Blocks on any chart. It is designed to help traders quickly identify key supply and demand zones and potential reversal points with clear visual cues.
Key Features
Automatically highlights Bullish and Bearish OBs.
Detects Breaker Blocks when OB levels are violated, signaling potential trend shifts.
Fully customizable visuals:
Box and Breaker Box transparency
Line transparency, width, and style (Solid, Dashed, Dotted)
Option to calculate OBs using candle body or high/low.
Adjustable number of recent OBs displayed.
Recommended Settings by Timeframe
Timeframe Swing Lookback Show OBs Notes
5 min 10 3 For fast intraday trading and scalping.
15 min 12 3 For intraday trend analysis
1H 15 3 Ideal for intraday support/resistance and breakout detection.
4H 22 3 Captures stronger OBs for swing trades.
Daily 22 3 Highlights major supply and demand zones for trend trading.
Weekly 30 2 Focuses on long-term OBs for strategic analysis.
These values provide a good balance of accuracy and chart clarity across all timeframes.
Why Use This Indicator
Quickly visualize key supply and demand zones.
Identify potential reversals and breakout points.
Improve trade timing and risk management with enhanced visual clarity.
Works across all major timeframes, making it suitable for intraday, swing, and long-term traders.
Search in scripts for "support"

DAILY AND WEEKLY MID LINESDAILY AND WEEKLY MID LINES INDICATOR
Description:
This indicator calculates and visualizes the dynamic midpoint (mid) of the current day and week in real-time. It provides traders with key reference levels based on developing price action.
Features:
Daily Mid Line:
Color: Orange
Thickness: 3 pixels
Style: Solid line
Updates: Automatically recalculates with each new candle
Calculation: Average of the day's highest high and lowest low from market open
Weekly Mid Line:
Color: Blue
Thickness: 3 pixels
Style: Dashed line
Updates: Continuously recalculates throughout the week
Calculation: Average of the week's highest high and lowest low from week start
How It Works:
At the start of each new trading day (00:00), the daily mid line resets and begins calculating from the first candle
At the start of each new trading week (typically Monday), the weekly mid line resets and begins fresh calculations
Both lines extend automatically to the right as new candles form
The lines are dynamic - they adjust as new highs/lows are made during the day/week
Trading Applications:
Support/Resistance Levels:
The mid lines act as natural equilibrium points where price may find temporary support or resistance
Daily mid can serve as intraday pivot, weekly mid as broader market balance point
Trend Analysis:
Price consistently above mid lines suggests bullish momentum
Price consistently below mid lines suggests bearish momentum
Relationship between daily and weekly mid lines shows multi-timeframe alignment
Entry/Exit Signals:
Price crossing above daily mid may indicate short-term bullish momentum
Price crossing below daily mid may indicate short-term bearish momentum
Weekly mid breaks can signal more significant trend changes
Market Context:
Distance between price and mid lines indicates market extremity
Steeper mid line slopes suggest stronger directional momentum
Flat mid lines suggest range-bound or consolidating markets
Confluence Trading:
Combine with other indicators (RSI, MACD, moving averages) for confirmation
Use as dynamic levels for stop-loss placement or take-profit targets
Best Practices:
More effective on higher timeframes (1H, 4H, Daily) for clearer signals
Works well in trending markets where mid lines act as moving support/resistance
Monitor for price rejection or acceptance at mid levels for trading decisions
Use in conjunction with volume analysis for confirmation
Psychological Significance:
Mid points often represent fair value areas where buyers and sellers find temporary equilibrium, making them natural decision points for market participants.
This indicator is particularly useful for day traders, swing traders, and position traders looking for dynamic, real-time reference points that adapt to current market conditions rather than relying on static historical levels.

Custom Session Static Breakout Levels
This indicator defines a trading session based on user-specified time and a custom GMT timezone. Its primary function is to provide traders with fixed historical data rather than dynamic information.
Core Logic:
Dynamic Box Update: While the price remains within the session, the "Box" (dynamic high/low) tracks the current session's extreme prices.
Static Level Anchoring: The moment price breaks above the session's high or below its low, the Box updates, and a static horizontal price line is immediately drawn at the previous, unbroken extreme (the historical support/resistance of the Box).
Breakout Identification: The candle responsible for the breakout is clearly marked, providing traders with an anchor point for fixed, structural analysis.

@DARKPOOL Magnet - MEMEDescription:
The @DARKPOOL Magnet indicator identifies and displays significant price levels where institutional buying and selling activity has created persistent support and resistance zones. The indicator focuses on three primary types of institutional footprints:
Pin Zone Detection: Identifies price levels where multiple pin bars (high volume, narrow range candles) have clustered within a specified tolerance, indicating repeated institutional defense of those levels.
Whale Footprint Detection: Detects absorption events where significant volume occurs with minimal net price movement, suggesting large institutional orders being filled without allowing substantial directional movement.
Dark Pool Detection: Identifies potential dark pool prints characterized by unexplained price gaps that occur without visible tape activity, indicating off-exchange institutional transactions.
The indicator draws horizontal lines at these identified institutional price levels and highlights areas where multiple detection methods converge, creating confluence zones that represent higher probability support and resistance levels.
Confluence lines are displayed when multiple independently identified institutional levels occur within a user-specified proximity, providing visual emphasis on price levels with the strongest institutional interest.

Daily AVWAPsDaily AVWAPs is designed for intraday and swing traders who track institutional volume benchmarks. Instead of a single "rolling" line that resets continuously, this indicator identifies the starting timestamp of the last 5 trading sessions and draws five distinct Anchored VWAPs from those exact moments.
This allows traders to see exactly where the average volume-weighted price stands for the current day (1D), yesterday (2D), and the three days prior (3D, 4D, 5D) simultaneously.
Key Features
Polyline Visualization: Unlike standard indicators that plot historical values for every bar (creating a messy "sawtooth" effect), this script uses Pine Script Polylines. It draws clean, static lines starting from the specific anchor point to the present price, mimicking the manual "Anchored VWAP" drawing tool.
Dynamic Session Detection: The script contains zero hardcoded dates. It automatically detects when a new trading day begins based on the chart data. It works seamlessly across all asset classes (Stocks, Crypto, Futures) and automatically adjusts for weekends, holidays, and irregular trading weeks without manual updates.
Unified Color Control: Input colors are synchronized. Changing a color in the settings menu updates both the chart line and the price scale label instantly.
Toggle Controls: Individual checkboxes allow you to toggle any specific VWAP (1D through 5D) on or off to keep your chart clean.
How to Use
Trend Strength: When the 1D, 2D, and 3D VWAPs are "fanning out" in alignment, the trend is strong.
Mean Reversion: In a sideways market, price often gravitates back to the 5-Day VWAP as a "value area."
Support & Resistance: Watch for price to respect the VWAP of a previous high-volume day (e.g., bouncing off the 3D VWAP during a pullback).
Settings
Source: Select the price data source (default is OHLC4) .
Colors & Toggles: Use the checkboxes to enable/disable specific lines. Customize the color for each specific day's AVWAP directly in the Inputs tab.
This indicator was adapted and repurposed from the original work by The_Last_Gentleman .
Technical Note: This indicator is optimized for intraday timeframes (1m, 5m, 15m, 1H). Because it uses polyline and array logic to scan specific session timestamps, it calculates exclusively on the most recent bar to maintain high performance.

Automated Intraday Key LevelsThis indicator is designed for day traders who focus on price action and key support/resistance levels. It automates the morning routine of marking up charts by instantly plotting critical levels from the Previous Day, the Premarket Session, and the Current Live Session.
Instead of manually drawing lines every morning, this script dynamically calculates and anchors these levels to the market open, extending them across the trading day for a clean, professional workspace.
Key Features
1. Previous Day Context (Static - White Lines) Before the market opens, it is crucial to know where price closed and traded yesterday.
Prev High & Low: Major support/resistance boundaries.
Prev Close: A magnetic level often used for "Gap Fill" strategies.
Prev Open: Provides context on yesterday's directional sentiment.
2. Premarket Session (Static - Orange Lines) The script fetches data from the Extended Trading Hours session (04:00 – 09:30 EST) to identify the overnight range.
PM High & Low: A breakout above the PM High or breakdown below the PM Low often signals the start of a trend day.
PM Midpoint (Dashed): Represents the overnight equilibrium. Staying above this level indicates early bullish strength.
3. Current Day Stats (Dynamic - Blue Lines) Once the Regular Trading Hours (RTH) begin, the script tracks live price action.
Day High (HOD) & Low (LOD): These lines update in real-time as price pushes new extremes. They are thicker to denote their importance as immediate liquidity zones.
Day Midpoint (Dashed): Calculated as (High + Low) / 2. This is a dynamic trend filter; price holding above the daily midpoint suggests buyers are in control, while trading below suggests seller dominance.
Visual Guide
To keep the chart clean and readable, the levels are color-coded:
🟦 Solid Blue (Width 2): Current Day High / Low (The most active levels).
🟦 Dashed Blue: Current Day Midpoint (50% Retracement level).
🟧 Solid Orange: Premarket High / Low.
🟧 Dashed Orange: Premarket Midpoint.
⬜ Solid White: Previous Day Open, High, Low, Close.
All lines are anchored to the 09:30 EST start time to keep the pre-market area of your chart uncluttered.

RBD Market ProfileA Market Profile visually shows how much time (or how many bars) price spent at each price level within a session — helping identify areas of “fair value” (where price spent most time) and extremes (where price barely traded).
It divides each trading session (for example, a day, week, or month depending on input) into price segments, counts how many bars closed within each segment, and then identifies:
POC (Point of Control): price level with the highest frequency (most traded or visited).
VAH (Value Area High): upper boundary of the zone that contains 70% (or user-defined percentage) of all activity around the POC.
VAL (Value Area Low): lower boundary of that same 70% activity zone.
Finally, it plots lines for:
VAH (green line)
VAL (red line)
POC Upper & Lower (white lines)
Session Open (blue dashed line)
How to use this Market Profile:
Determine Key Areas of Support/Resistance by the VAH and VAL
VAH: Responsive Sellers and Initiative Buyers
VAL: Responsive Buyers and Initiative Sellers
POC: Can be used as Fair Value

Opening Range Breakout with Multi-Timeframe Liquidity]═══════════════════════════════════════
OPENING RANGE BREAKOUT WITH MULTI-TIMEFRAME LIQUIDITY
═══════════════════════════════════════
A professional Opening Range Breakout (ORB) indicator enhanced with multi-timeframe liquidity detection, trading session visualization, volume analysis, and trend confirmation tools. Designed for intraday trading with comprehensive alert system.
───────────────────────────────────────
WHAT THIS INDICATOR DOES
───────────────────────────────────────
This indicator combines multiple trading concepts:
- Opening Range Breakout (ORB) - Customizable time period detection with automatic high/low identification
- Multi-Timeframe Liquidity - HTF (Higher Timeframe) and LTF (Lower Timeframe) key level detection
- Trading Sessions - Tokyo, London, New York, and Sydney session visualization
- Volume Analysis - Volume spike detection and strength measurement
- Multi-Timeframe Confirmation - Trend bias from higher timeframes
- EMA Integration - Trend filter and dynamic support/resistance
- Smart Alerts - Quality-filtered breakout notifications
───────────────────────────────────────
HOW IT WORKS
───────────────────────────────────────
OPENING RANGE BREAKOUT (ORB):
Concept:
The Opening Range is a period at the start of a trading session where price establishes an initial high and low. Breakouts beyond this range often indicate the direction of the day's trend.
Detection Method:
- Default: 15-minute opening range (configurable)
- Custom Range: Set specific session times with timezone support
- Automatically identifies ORH (Opening Range High) and ORL (Opening Range Low)
- Tracks ORB mid-point for reference
Range Establishment:
1. Session starts (or custom time begins)
2. Tracks highest high and lowest low during the period
3. Range confirmed at end of opening period
4. Levels extend throughout the session
Breakout Detection:
- Bullish Breakout: Close above ORH
- Bearish Breakout: Close below ORL
- Mid-point acts as bias indicator
Visual Display:
- Shaded box during range formation
- Horizontal lines for ORH, ORL, and mid-point
- Labels showing level values
- Color-coded fills based on selected method
Fill Color Methods:
1. Session Comparison:
- Green: Current OR mid > Previous OR mid
- Red: Current OR mid < Previous OR mid
- Gray: Equal or first session
- Shows day-over-day momentum
2. Breakout Direction (Recommended):
- Green: Price currently above ORH (bullish breakout)
- Red: Price currently below ORL (bearish breakout)
- Gray: Price inside range (no breakout)
- Real-time breakout status
MULTI-TIMEFRAME LIQUIDITY:
Two-Tier System for comprehensive level identification:
HTF (Higher Timeframe) Key Liquidity:
- Default: 4H timeframe (configurable to Daily, Weekly)
- Identifies major institutional levels
- Uses pivot detection with adjustable parameters
- Suitable for swing highs/lows where large orders rest
LTF (Lower Timeframe) Key Liquidity:
- Default: 1H timeframe (configurable)
- Provides precision entry/exit levels
- Finer granularity for intraday trading
- Captures minor swing points
Calculation Method:
- Pivot high/low detection algorithm
- Configurable left bars (lookback) and right bars (confirmation)
- Timeframe multiplier for accurate multi-timeframe detection
- Automatic level extension
Mitigation System:
- Tracks when levels are swept (broken)
- Configurable mitigation type: Wick or Close-based
- Option to remove or show mitigated levels
- Display limit prevents chart clutter
Asset-Specific Optimization:
The indicator includes quick reference settings for different assets:
- Major Forex (EUR/USD, GBP/USD): Default settings optimal
- Crypto (BTC/ETH): Left=12, Right=4, Display=7
- Gold: HTF=1D, Left=20
TRADING SESSIONS:
Four Major Sessions with Full Customization:
Tokyo Session:
- Default: 04:00-13:00 UTC+4
- Asian trading hours
- Often sets daily range
London Session:
- Default: 11:00-20:00 UTC+4
- Highest liquidity period
- Major institutional activity
New York Session:
- Default: 16:00-01:00 UTC+4
- US market hours
- High-impact news events
Sydney Session:
- Default: 01:00-10:00 UTC+4
- Earliest Asian activity
- Lower volatility
Session Features:
- Shaded background boxes
- Session name labels
- Optional open/close lines
- Session high/low tracking with colored lines
- Each session has independent color settings
- Fully customizable times and timezones
VOLUME ANALYSIS:
Volume-Based Trade Confirmation:
Volume MA:
- Configurable period (default: 20)
- Establishes average volume baseline
- Used for spike detection
Volume Spike Detection:
- Identifies when volume exceeds MA * multiplier
- Default: 1.5x average volume
- Confirms breakout strength
Volume Strength Measurement:
- Calculates current volume as percentage of average
- Shows relative volume intensity
- Used in alert quality filtering
High Volume Bars:
- Identifies bars above 50th percentile
- Additional confirmation layer
- Indicates institutional participation
MULTI-TIMEFRAME CONFIRMATION:
Trend Bias from Higher Timeframes:
HTF 1 (Trend):
- Default: 1H timeframe
- Uses EMA to determine intermediate trend
- Compares current timeframe EMA to HTF EMA
HTF 2 (Bias):
- Default: 4H timeframe
- Uses 50 EMA for longer-term bias
- Confirms overall market direction
Bias Classifications:
- Bullish Bias: HTF close > HTF 50 EMA AND Current EMA > HTF1 EMA
- Bearish Bias: HTF close < HTF 50 EMA AND Current EMA < HTF1 EMA
- Neutral Bias: Mixed signals between timeframes
EMA Stack Analysis:
- Compares EMA alignment across timeframes
- +1: Bullish stack (lower TF EMA > higher TF EMA)
- -1: Bearish stack (lower TF EMA < higher TF EMA)
- 0: Neutral/crossed
Usage:
- Filters false breakouts
- Confirms trend direction
- Improves trade quality
EMA INTEGRATION:
Dynamic EMA for Trend Reference:
Features:
- Configurable period (default: 20)
- Customizable color and width
- Acts as dynamic support/resistance
- Trend filter for ORB trades
Application:
- Above EMA: Favor long breakouts
- Below EMA: Favor short breakouts
- EMA cross: Potential trend change
- Distance from EMA: Momentum gauge
SMART ALERT SYSTEM:
Quality-Filtered Breakout Notifications:
Alert Types:
1. Standard ORB Breakout
2. High Quality ORB Breakout
Quality Criteria:
- Volume Confirmation: Volume > 1.2x average
- MTF Confirmation: Bias aligned with breakout direction
Standard Alert:
- Basic breakout detection
- Price crosses ORH or ORL
- Icon: 🚀 (bullish) or 🔻 (bearish)
High Quality Alert:
- Both volume AND MTF confirmed
- Stronger probability setup
- Icon: 🚀⭐ (bullish) or 🔻⭐ (bearish)
Alert Information Includes:
- Alert quality rating
- Breakout level and current price
- Volume strength percentage (if enabled)
- MTF bias status (if enabled)
- Recommended action
One Alert Per Bar:
- Prevents alert spam
- Uses flag system to track sent alerts
- Resets on new ORB session
───────────────────────────────────────
HOW TO USE
───────────────────────────────────────
OPENING RANGE SETUP:
Basic Configuration:
1. Select time period for opening range (default: 15 minutes)
2. Choose fill color method (Breakout Direction recommended)
3. Enable historical data display if needed
Custom Range (Advanced):
1. Enable Custom Range toggle
2. Set specific session time (e.g., 0930-0945)
3. Select appropriate timezone
4. Useful for specific market opens (NYSE, LSE, etc.)
LIQUIDITY LEVELS SETUP:
Quick Configuration by Asset:
- Forex: Use default settings (Left=15, Right=5)
- Crypto: Set Left=12, Right=4, Display=7
- Gold: Set HTF=1D, Left=20
HTF Liquidity:
- Purpose: Major support/resistance levels
- Recommended: 4H for day trading, 1D for swing trading
- Use as profit targets or reversal zones
LTF Liquidity:
- Purpose: Entry/exit refinement
- Recommended: 1H for day trading, 4H for swing trading
- Use for position management
Mitigation Settings:
- Wick-based: More sensitive (default)
- Close-based: More conservative
- Remove or Show mitigated levels based on preference
TRADING SESSIONS SETUP:
Enable/Disable Sessions:
- Master toggle for all sessions
- Individual session controls
- Show/hide session names
Session High/Low Lines:
- Enable to see session extremes
- Each session has custom colors
- Useful for range trading
Customization:
- Adjust session times for your broker
- Set timezone to match your location
- Customize colors for visibility
VOLUME ANALYSIS SETUP:
Enable Volume Analysis:
1. Toggle on Volume Analysis
2. Set MA length (20 recommended)
3. Adjust spike multiplier (1.5 typical)
Usage:
- Confirm breakouts with volume
- Identify climactic moves
- Filter false signals
MULTI-TIMEFRAME SETUP:
HTF Selection:
- HTF 1 (Trend): 1H for day trading, 4H for swing
- HTF 2 (Bias): 4H for day trading, 1D for swing
Interpretation:
- Trade only with bias alignment
- Neutral bias: Be cautious
- Bias changes: Potential reversals
EMA SETUP:
Configuration:
- Period: 20 for responsive, 50 for smoother
- Color: Choose contrasting color
- Width: 1-2 for visibility
Usage:
- Filter trades: Long above, Short below
- Dynamic support/resistance reference
- Trend confirmation
ALERT SETUP:
TradingView Alert Creation:
1. Enable alerts in indicator settings
2. Enable ORB Breakout Alerts
3. Right-click chart → Add Alert
4. Select this indicator
5. Choose "Any alert() function call"
6. Configure delivery method (mobile, email, webhook)
Alert Filtering:
- All alerts include quality rating
- High Quality alerts = Volume + MTF confirmed
- Standard alerts = Basic breakout only
───────────────────────────────────────
TRADING STRATEGIES
───────────────────────────────────────
CLASSIC ORB STRATEGY:
Setup:
1. Wait for opening range to complete
2. Price breaks and closes above ORH or below ORL
3. Volume > average (if enabled)
4. MTF bias aligned (if enabled)
Entry:
- Bullish: Buy on break above ORH
- Bearish: Sell on break below ORL
- Consider retest entries for better risk/reward
Stop Loss:
- Bullish: Below ORL or range mid-point
- Bearish: Above ORH or range mid-point
- Adjust based on volatility
Targets:
- Initial: Range width extension (ORH + range width)
- Secondary: HTF liquidity levels
- Final: Session high/low or major support/resistance
ORB + LIQUIDITY CONFLUENCE:
Enhanced Setup:
1. Opening range established
2. HTF liquidity level near or beyond ORH/ORL
3. Breakout occurs with volume
4. Price targets the liquidity level
Entry:
- Enter on ORB breakout
- Target the HTF liquidity level
- Use LTF liquidity for position management
Management:
- Partial profits at ORB + range width
- Move stop to breakeven at LTF liquidity
- Final exit at HTF liquidity sweep
ORB REJECTION STRATEGY (Counter-Trend):
Setup:
1. Price breaks above ORH or below ORL
2. Weak volume (below average)
3. MTF bias opposite to breakout
4. Price closes back inside range
Entry:
- Failed bullish break: Short below ORH
- Failed bearish break: Long above ORL
Stop Loss:
- Beyond the failed breakout level
- Or beyond session extreme
Target:
- Opposite end of opening range
- Range mid-point for partial profit
SESSION-BASED ORB TRADING:
Tokyo Session:
- Typically narrower ranges
- Good for range trading
- Wait for London open breakout
London Session:
- Highest volume and volatility
- Strong ORB setups
- Major liquidity sweeps common
New York Session:
- Strong trending moves
- News-driven volatility
- Good for momentum trades
Sydney Session:
- Quieter conditions
- Suitable for range strategies
- Sets up Tokyo session
EMA-FILTERED ORB:
Rules:
- Only take bullish breaks if price > EMA
- Only take bearish breaks if price < EMA
- Ignore counter-trend breaks
Benefits:
- Reduces false signals
- Aligns with larger trend
- Improves win rate
───────────────────────────────────────
CONFIGURATION GUIDE
───────────────────────────────────────
OPENING RANGE SETTINGS:
Time Period:
- 15 min: Standard for most markets
- 30 min: Wider range, fewer breakouts
- 60 min: For slower markets or swing trades
Custom Range:
- Use for specific market opens
- NYSE: 0930-1000 EST
- LSE: 0800-0830 GMT
- Set timezone to match exchange
Historical Display:
- Enable: See all previous session data
- Disable: Cleaner chart, current session only
LIQUIDITY SETTINGS:
Left Bars (5-30):
- Lower: More frequent, sensitive levels
- Higher: Fewer, more significant levels
- Recommended: 15 for most markets
Right Bars (1-25):
- Confirmation period
- Higher: More reliable, less frequent
- Recommended: 5 for balance
Display Limit (1-20):
- Number of active levels shown
- Higher: More context, busier chart
- Recommended: 7 for clarity
Extension Options:
- Short: Levels visible near formation
- Current: Extended to current bar (recommended)
- Max: Extended indefinitely
VOLUME SETTINGS:
MA Length (5-50):
- Shorter: More responsive to spikes
- Longer: Smoother baseline
- Recommended: 20 for balance
Spike Multiplier (1.0-3.0):
- Lower: More sensitive spike detection
- Higher: Only extreme spikes
- Recommended: 1.5 for day trading
MULTI-TIMEFRAME SETTINGS:
HTF 1 (Trend):
- 5m chart: Use 15m or 1H
- 15m chart: Use 1H or 4H
- 1H chart: Use 4H or 1D
HTF 2 (Bias):
- One level higher than HTF 1
- Provides longer-term context
- Don't use same as HTF 1
EMA SETTINGS:
Length:
- 20: Responsive, more signals
- 50: Smoother, stronger filter
- 200: Long-term trend only
Style:
- Choose contrasting color
- Width 1-2 for visibility
- Match your trading style
───────────────────────────────────────
BEST PRACTICES
───────────────────────────────────────
Chart Timeframe Selection:
- ORB Trading: Use 5m or 15m charts
- Session Review: Use 1H or 4H charts
- Swing Trading: Use 1H or 4H charts
Quality Over Quantity:
- Wait for high-quality alerts (volume + MTF)
- Avoid trading every breakout
- Focus on confluence setups
Risk Management:
- Position size based on range width
- Wider ranges = smaller positions
- Use stop losses always
- Take partial profits at targets
Market Conditions:
- Best results in trending markets
- Reduce position size in choppy conditions
- Consider session overlaps for volatility
- Avoid trading near major news if inexperienced
Continuous Improvement:
- Track win rate by session
- Note which confluence factors work best
- Adjust settings based on market volatility
- Review performance weekly
───────────────────────────────────────
PERFORMANCE OPTIMIZATION
───────────────────────────────────────
This indicator is optimized with:
- max_bars_back declarations for efficient processing
- Conditional calculations based on enabled features
- Proper memory management for drawing objects
- Minimal recalculation on each bar
Best Practices:
- Disable unused features (sessions, MTF, volume)
- Limit historical display to reduce rendering
- Use appropriate timeframe for your strategy
- Clear old drawing objects periodically
───────────────────────────────────────
EDUCATIONAL DISCLAIMER
───────────────────────────────────────
This indicator combines established trading concepts:
- Opening Range Breakout theory (price action)
- Liquidity level detection (pivot analysis)
- Session-based trading (time-of-day patterns)
- Volume analysis (confirmation technique)
- Multi-timeframe analysis (trend alignment)
All calculations use standard technical analysis methods:
- Pivot high/low detection algorithms
- Moving averages for trend and volume
- Session time filtering
- Timeframe security functions
The indicator identifies potential trading setups but does not predict future price movements. Success requires proper application within a complete trading strategy including risk management, position sizing, and market context.
───────────────────────────────────────
USAGE DISCLAIMER
───────────────────────────────────────
This tool is for educational and analytical purposes. Opening Range Breakout trading involves substantial risk. The alert system and quality filters are designed to identify potential setups but do not guarantee profitability. Always conduct independent analysis, use proper risk management, and never risk capital you cannot afford to lose. Past performance does not indicate future results. Trading intraday breakouts requires experience and discipline.
───────────────────────────────────────
CREDITS & ATTRIBUTION
───────────────────────────────────────
ORIGINAL SOURCE:
This indicator builds upon concepts from LuxAlgo's-ORB

Previous Day OHLCDescription :
This script automatically draws the previous day’s Open, High, Low, and Close levels on each trading day. Traders widely use these reference levels to identify key support and resistance zones, potential breakout areas, and intraday bias.
The levels update daily and remain visible throughout the trading session to quickly identify price interactions with yesterday’s important zones.
Features :
Plots the previous day’s Open, High, Low, and Close.
Levels extend across the full trading day for easy reference.
Useful for intraday and swing traders tracking price reactions at historical levels.

Today's 5min HH/LL LinesOverview
This indicator identifies the highest high (HH) and lowest low (LL) formed by the first 5 one-minute candles of the current trading day. Once calculated, it plots continuous horizontal lines at those price levels for the remainder of the day.
How it works
The script internally requests 1-minute data for the current symbol, regardless of your chart’s timeframe.
At the start of each new trading day, it resets counters.
It captures the highest high and lowest low across the first five completed 1-minute candles.
After the 5th one-minute bar closes, it draws:
A green horizontal line at the highest high.
A red horizontal line at the lowest low.
These lines extend to the right, covering the entire trading session, and automatically scale with zoom/pan.
At the next session, the old lines are deleted and recalculated for the new day.
Use cases
Helps spot early intraday support and resistance zones.
Useful for breakout or reversal strategies that monitor when price breaches the first 5-minute range (derived from 5x1m bars).
Can be combined with volume, momentum, or candlestick signals for high-probability entries.
Key features
Works on any timeframe — always uses 1-minute data for precision.
Shows lines only for the current day (no clutter from prior sessions).
Lines are dynamic and adaptive — they remain fixed at the calculated price but extend continuously across the chart.

Static OHLC Market HoursStatic OHLC this can be used during market hours to have open high low close of yesterday and the day before yesterday!
This can give strong support & resistance regions!

Static OHLC Static OHLC,
This can be applied out of market hours to have static lines on OHLC,
This can act as strong support and resistance regions
Malama's KAYCAP Pre-Market Box# Pre-Market Single Candle Range Box
## What Makes This Script Original
While many scripts plot entire pre-market session ranges, this indicator focuses specifically on **a single user-defined candle** within the pre-market period rather than the entire session. This targeted approach allows traders to isolate the most relevant price action from a specific time (default: 4:00 AM EST) that often establishes key levels for the trading day.
## Core Methodology & Technical Implementation
**Single Candle Isolation:**
- Captures OHLC data from one specific minute within pre-market hours (user configurable)
- Differentiates between the candle's body (open/close range) and wicks (high/low extremes)
- Creates four distinct reference levels instead of traditional session high/low boxes
**Dual Box Structure:**
- **Inner Box (Body):** Plots the range between open and close prices of the target candle
- **Outer Boundaries:** Separately plots the high and low of that same candle
- **Visual Differentiation:** Uses different colors and line weights to distinguish body vs. wick levels
**Time-Specific Logic:**
The script uses precise time matching (`hour == boxHour and minute == boxMinute`) to capture data from exactly one candle, rather than aggregating an entire session. This creates four specific price levels:
- Box Top: Higher of open/close (body boundary)
- Box Bottom: Lower of open/close (body boundary)
- Box High: Candle high (wick extreme)
- Box Low: Candle low (wick extreme)
## Why This Approach Differs from Standard Session Boxes
**vs. Full Session Ranges:** Focuses on a single critical minute rather than entire pre-market period
**vs. Traditional S/R:** Creates both body and wick levels from one specific candle
**vs. Opening Range:** Uses pre-market data rather than regular session opening minutes
## Practical Application
The 4:00 AM EST default targets a time when institutional pre-market activity often establishes initial sentiment and key levels. By isolating this specific candle's range:
- **Body levels** often act as initial support/resistance during regular hours
- **Wick extremes** provide broader range boundaries for breakout analysis
- **Precise timing** allows focus on the most statistically relevant pre-market moment
## Technical Considerations
- Requires intraday timeframes (1-minute recommended) to capture specific candle data
- Time settings should match your broker's timezone for accurate candle selection
- Works best on liquid instruments where pre-market activity is meaningful
- The selected candle must exist in your data feed for the levels to plot
## Customization Options
All timing parameters are adjustable:
- Target candle hour and minute
- Pre-market session definition (for context)
- Visual styling for all four level types
This focused approach provides more granular analysis than broad session ranges while maintaining simplicity in execution.

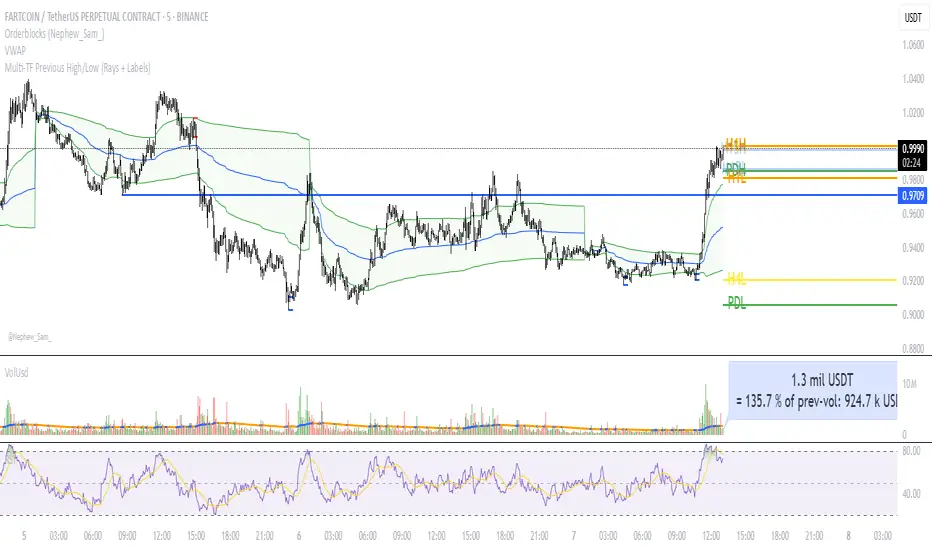
Multi‑TF Previous High/Low (Rays + Labels)Use this indicator if you want to automate Support and Resistance levels.
Previous Day High and Low - Green Lines
Previous 4 Hour High and Low - Yellow Lines
Previous 1 Hour High and Low - Orange Lines
Previous 15 Minute High and Low - Light Blue Lines
Follow me on X-
ADHDTRDR
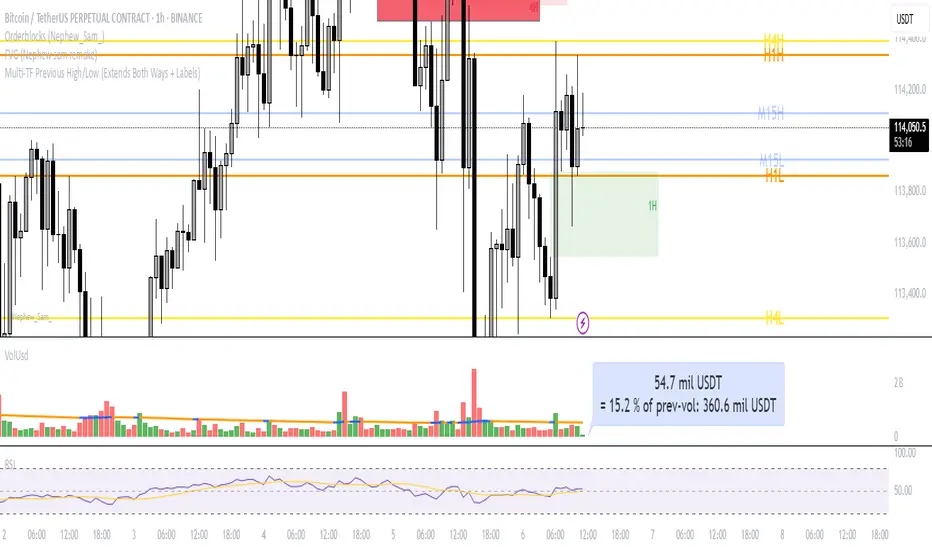
Multi‑TF Previous High/Low (Extends Both Ways + Labels)Use this indicator if you want to automate Support and Resistance levels.
Previous Day High and Low - Green Lines
Previous 4 Hour High and Low - Yellow Lines
Previous 1 Hour High and Low - Orange Lines
Previous 15 Minute High and Low - Light Blue Lines
Follow me on X-
@ADHDTRDR
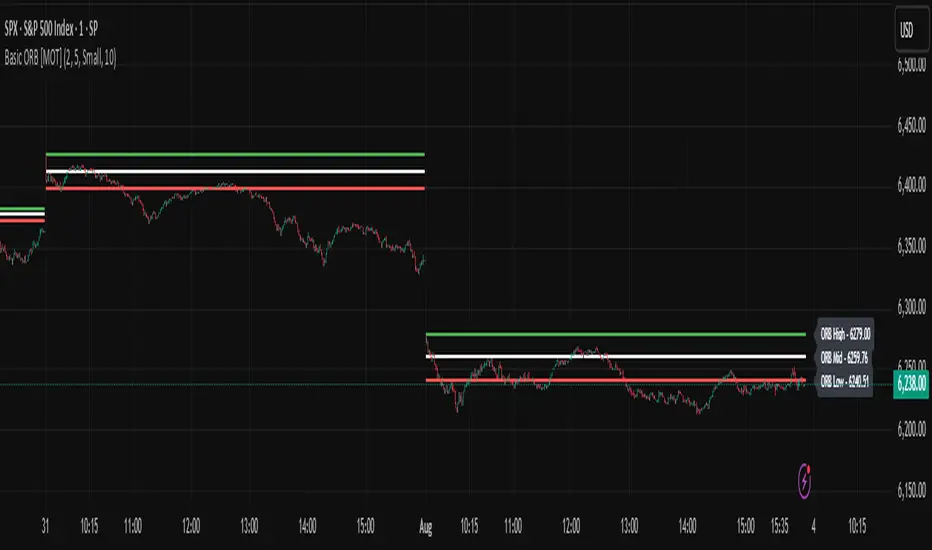
Basic ORB [MOT]Basic ORB – Opening Range Breakout Tool
The Basic ORB is a visual tool designed to assist intraday traders by identifying the opening range from 9:30–9:45 AM ET. It automatically plots the high, low, and midpoint of this range to help traders analyze potential areas of interest.
This script provides a simple and customizable way to frame market structure during the early trading session. It is intended to support various intraday strategies across multiple asset classes including futures, stocks, ETFs, indexes, and crypto.
🔹 Key Features
1. Opening Range Levels
- Automatically plots the High, Low, and Midline of the 9:30–9:45 AM ET session.
- Midline helps visualize the midpoint of the range.
- Customizable colors and line thickness.
2. Previous ORB Ranges
- Option to display previous days’ ORB levels for visual pattern recognition.
- Useful for spotting recurring reactions to prior day levels.
3. Dynamic Price Labels
- Adds price labels to each ORB line for quick reference.
- Fully customizable: adjust text size, background color, label position, and offset.
4. Clean Settings Panel
- Customize all visual elements to match your charting style.
- Control how many previous ORBs to display.
- Toggle features on or off for a simplified interface.
🧠 How to Use
- Best viewed on 1m, 5m, or 15m charts.
- Combine with your existing entry/exit criteria to monitor how price interacts with the opening range.
- Common use cases include breakout confirmation, rejection trades, and support/resistance analysis based on prior ORBs.
⚠️ Disclaimer
This script is for educational and informational purposes only. It does not constitute financial advice. Trading carries risk, and users should test any tools in a demo environment before live use. Always implement proper risk management.
Strategic LevelsIntroduction
The Strategic Levels indicator plots key high and low price levels for monthly, weekly, daily, and Monday (current week) timeframes. It draws horizontal lines with consolidated labels to highlight significant support and resistance zones.
How to use it ?
Identify critical price levels for trade entries, exits, and risk management.
These prices levels (monthly, weekly, daily open/close) are significant inflection points during short term price movements.
Perfect for swing traders, day traders, or anyone using support/resistance strategies.
Best used for trades lasting no more than a few days.

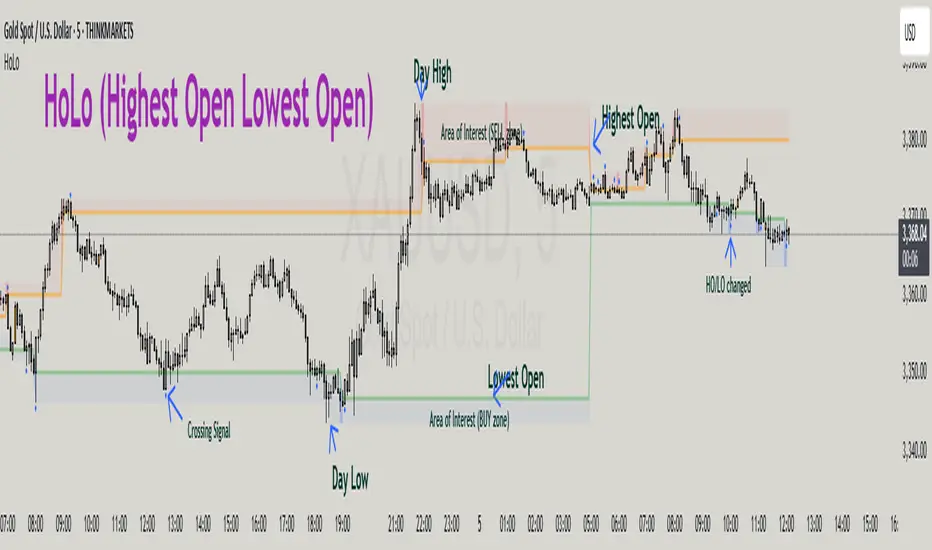
HoLo (Highest Open Lowest Open)HoLo (Highest Open Lowest Open) Method
Overview
HoLo stands for "Highest Open Lowest Open" – a forex trading strategy.
Core Concept
Definition of HoLo:
Highest Open (HO): The highest opening price among all H1 candles of the current trading day
Lowest Open (LO): The lowest opening price among all H1 candles of the current trading day
Trading Day: Starts at Asia Open Session
Strategy Setup
Step 1: Mark Key Levels
Current day's High/Low
Highest Open and Lowest Open (from H1 candles)
Step 2: Define the Area of Interest
Sell Zone: Between the Highest Open and the current day's High
Buy Zone: Between the Lowest Open and the current day's Low
Trade Entry Rules
Sell Trade:
Price goes above the Highest Open
Trigger candle (M5, M15, or M30) closes above the Highest Open
Enter a sell when price revisits the Highest Open level (Sell Stop Order)
Buy Trade:
Price drops below the Lowest Open
Trigger candle closes below the Lowest Open
Enter a buy when price revisits the Lowest Open level (Buy Stop Order)
Trigger Timeframe:
Choose M1, M5, or M15 based on:
Your screen time availability
Personal trading style
Risk and Profit Management
Stop Loss:
For sell: Set SL at the day’s High + spread
For buy: Set SL at the day’s Low + spread
Take Profit (TP) Basic Rule:
You should open 2 positions:
When profit reaches 1R: Take partial profit + move SL to BE (Break Even)
Let the remaining position run using partial TP or trailing stop
Money Management:
Never risk more than 1% per trade
Recommended: 0.5% risk due to multiple opportunities daily
Prioritize major pairs.
The Indicator
How to read data
For Day Traders
Monitor the sell zone (red area) for potential short entries near resistance
Watch the buy zone (blue area) for potential long entries near support
Use cross signals for entry/exit points
Pay attention to timing markers for key market hours
Alert
HO (Highest Open) level changes
LO (Lowest Close) level changes
Price crossing key levels
Timing notifications
IPDA with Order Blocks [Enhanced]Summary of the Code
This script plots IPDA Standard Deviations on a price chart, helping traders visualize potential support and resistance levels based on a series of user-defined deviations. It uses swing high/low points and time-based fractal lookbacks (monthly, weekly, daily, or intraday) to define price anchors and compute deviation lines.
Key features include:
Deviations: It calculates and plots deviation levels based on the distance between swing highs and lows, which traders can use as price targets or zones of interest.
Timeframes:
Monthly (higher timeframe analysis)
Weekly (medium-term analysis)
Daily and Intraday (shorter-term precision)
Customization:
Choose which deviation levels (e.g., 0, 1, -1, -2) to display.
Hide labels or adjust their sizes for cleaner charts.
Option to remove invalidated deviation levels dynamically.
Visual Cleanliness: Automatically removes clutter by hiding or deleting invalid deviation levels and focusing on active price zones.
How to Utilize It for Intraday Trading to Make $1,000
Here’s how to effectively use the indicator to optimize intraday trading:
1. Set the Right Timeframe:
Use the 15-minute or 1-hour chart for intraday setups.
Ensure the "Intraday" lookback option is enabled to focus on shorter-term swings.
2. Interpret the Levels:
Bearish Order Blocks: Look for red lines (bearish deviation) as potential resistance zones where the price may reverse downward.
Bullish Order Blocks: Look for green lines (bullish deviation) as potential support zones where the price may bounce upward.
3. Plan Entries and Exits:
Entry: Buy near a green order block or short near a red order block, confirming the trade with additional signals (e.g., candlestick patterns, momentum indicators).
Stop Loss: Place your stop below the green line (for buys) or above the red line (for shorts).
Profit Targets: Use deviation levels as targets (e.g., from the 0 level to +1 or -1).
4. Combine with Market Context:
Use the script alongside volume profile, trend indicators, or news events for confirmation.
Avoid trading during major news events unless aligned with deviations.
5. Position Sizing for $1,000 Goal:
Trade liquid instruments like Nasdaq futures (NQ) or major forex pairs.
Risk 1-2% of your capital on each trade and scale into positions if confirmed.
Target a profit of 10-20 points per trade on Nasdaq futures, with 1-2 trades daily.
6. Monitor Key Timeframes:
Pre-market (before 9:30 AM EST): Mark deviation levels to predict market open behavior.
Midday & Power Hour (3-4 PM EST): Watch for breakouts or retests around key deviation levels.
By combining this tool with disciplined risk management and a clear trading plan, you can systematically work toward your profit target while minimizing unnecessary risks

RSI Horizontal resistance levelsRSI Horizontal Resistance Levels
Purpose
This study automatically draws horizontal price rays every time the Relative Strength Index (RSI) trades inside a user‑defined band (default = 50 ± 1). The idea is to spotlight price levels that historically coincided with a specific RSI state—levels that often evolve into short‑term support or resistance as sentiment repeats.
How it works
Raw RSI – The script computes an un‑smoothed RSI of the closing price (rsiLength, default = 3).
Trigger zone – Whenever RSI falls within level ± tolerance (e.g., 49 – 51) the close price of that bar becomes a reference.
Horizontal ray – A ray (extend.right) is drawn from that close and continues indefinitely to the right, creating a live price level.
History management – Only the most recent N rays are kept (maxRays, default = 5); the oldest line is deleted automatically to avoid chart clutter.
Inputs
Name Default Description
RSI Length 3 Look‑back of the RSI calculation.
RSI Level 50 Center of the trigger zone. Common alternatives: 30, 70, custom mid‑lines.
Tolerance 1 Width of the RSI band on each side of RSI Level (set 0 for an exact hit).
Max Rays 5 Maximum number of active horizontal levels kept on screen.
Ray Color Yellow Visual color of the rays.
Ray Width 2 Thickness of the rays.
How to use it
Spot recurring reaction zones – Markets often hesitate near prices where momentum has flipped before. The rays reveal those spots automatically.
Combine with candlestick or volume cues – A level marked by this script plus a rejection wick, volume spike, or divergence can strengthen conviction.
Adapt the band –
50 ± tolerance → momentum balance line (trend pullbacks)
70 ± tolerance → overbought fade levels
30 ± tolerance → oversold bounce levels
Works on any asset or timeframe; shorter RSI periods highlight intraday rotations, longer periods capture swing pivots.
Tips & cautions
A drawn line is not a guarantee of future reversal—always validate with price action and risk management.
For high‑frequency strategies, consider lowering tolerance or increasing rsiLength to reduce noise.
You can add custom alerts on RSI crossing the band to receive push or email notifications.
Happy trading!

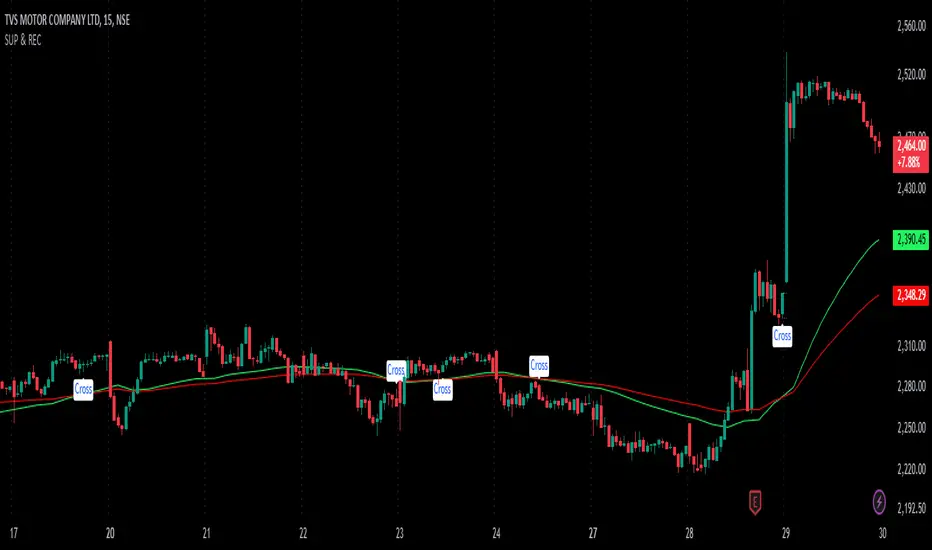
SUP & RECIdentifying Support and Resistance: An indicator (likely visual) highlights areas on a price chart where the asset's price has historically struggled to break through. These are crucial levels to watch for potential price reversals.
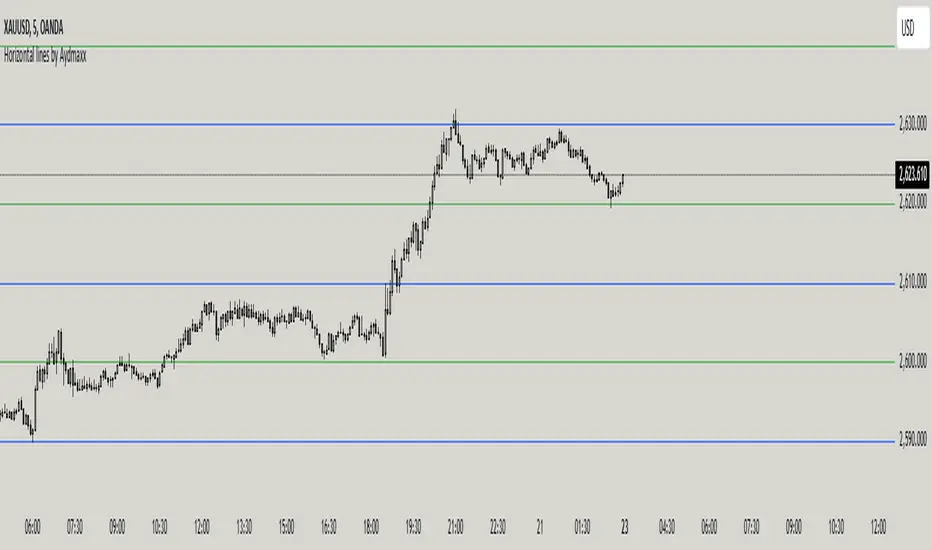
Horizontal lines by AydmaxxIndicator Description: Horizontal Lines by Aydmaxx
This indicator plots customizable horizontal lines on the chart to assist with technical analysis. It allows traders to define a starting price and a step size (gap) between the lines, making it versatile for a variety of strategies, such as identifying support, resistance, or key price levels.
How to Use:
Starting Price (Bottom): Enter the price level where the first (lowest) line should begin. This is your base level.
Example: If you're analyzing a market with prices around 2550, you can set this value to 2550 to align the indicator with your focus.
Gap (Step Size): Specify the interval or step size between consecutive lines.
Example: If you want lines every 10 points, set this value to 10.
Number of Lines: Adjust the total number of lines to display on the chart.
Line Style and Width: Customize the appearance of the lines (solid, dashed, dotted) and their thickness.
Line Colors and Transparency: Choose primary and secondary colors for alternating lines, and adjust the transparency to match your visual preferences.
This indicator is ideal for visualizing price zones and can be tailored to suit any trading style. Adjust the parameters based on your market analysis to highlight key price levels effectively.
Previous Day Close (PVC)Indicator Description: Previous Day Close
This indicator visually represents the previous day's closing price, providing traders with a clear reference point on the chart. By marking this key level, it enhances your ability to analyze stock price movements and make informed trading decisions.
Key Features:
Visual Clarity: The previous day's close is prominently displayed, making it easy to spot significant price levels at a glance.
Enhanced Analysis: Use this indicator to identify potential support and resistance levels based on historical closing prices.
User-Friendly: Designed for simplicity, this indicator integrates seamlessly into your trading workflow.
Leverage the power of the previous day’s close to improve your trading strategy and gain a competitive edge in the market!