ProScalper📊 ProScalper - Professional 1-Minute Scalping System
🎯 Overview
ProScalper is a sophisticated, multi-confluence scalping indicator designed specifically for 1-minute chart trading. Combining advanced technical analysis with intelligent signal filtering, it provides high-probability trade setups with clear entry, stop loss, and take profit levels.
✨ Key Features
🔺 Smart Signal Detection
Range Filter Technology: Fast-responding trend detection (25-period) optimized for 1-minute timeframe
Medium-sized triangles appear above/below candles for clear buy/sell signals
Only most recent signal shown - no chart clutter
Automatically deletes old signals when new ones appear
📋 Real-Time Signal Table
Top-center display shows complete trade breakdown
Grade system: A+, A, B+, B, C+ ratings for every setup
All confluence reasons listed with checkmarks
Score and R:R displayed for instant trade quality assessment
Color-coded: Green for LONG, Red for SHORT
📐 Multi-Confluence Analysis
ProScalper combines 10+ technical factors:
✅ EMA Trend: 4 EMAs (200, 48, 13, 8) for multi-timeframe alignment
✅ VWAP: Dynamic support/resistance
✅ Fibonacci Retracement: Golden ratio (61.8%), 50%, 38.2%, 78.6%
✅ Range Filter: Adaptive trend confirmation
✅ Pivot Points: Smart reversal detection
✅ Volume Analysis: Spike detection and volume profile
✅ Higher Timeframe: 5-minute trend confirmation
✅ HTF Support/Resistance: Key levels from higher timeframes
✅ Liquidity Sweeps: Smart money detection
✅ Opening Range Breakout: First 15-minute range
💰 Complete Trade Management
Entry Lines: Dashed green (LONG) or red (SHORT) showing exact entry
Stop Loss: Red dashed line with price label
Take Profit: Blue dashed line with price label and R:R
Partial Exits: 1R level marked with orange dashed line
All lines extend 10 bars for clean alignment with Fibonacci levels
📊 Dynamic Risk/Reward
Adaptive R:R calculation based on market volatility
Targets adjusted for pivot distances
Minimum 1.2:1 to maximum 3.5:1 for scalping
Position sizing based on account risk percentage
🎨 Professional Visualization
Clean chart layout - no clutter, only essential information
Custom EMA colors: Red (200), Aqua (48), Green (13), White (8)
Gold VWAP line for key support/resistance
Color-coded Fibonacci: Bright yellow (61.8%), white (50%), orange (38.2%), fuchsia (78.6%)
No shaded zones - pure price action focus
📈 Performance Tracking
Real-time statistics table (optional)
Win rate, total trades, P&L tracking
Average R:R and win/loss ratios
Setup-specific performance metrics
⚙️ Settings & Customization
Risk Management
Adjustable account risk per trade (default: 0.5%)
ATR-based stop loss multiplier (default: 0.8 for tight scalping)
Dynamic position sizing
Signal Sensitivity
Confluence Score Threshold: 40-100 (default: 55 for balanced signals)
Range Filter Period: 25 bars (fast signals for 1-min)
Range Filter Multiplier: 2.2 (tighter bands for more signals)
Visual Controls
Toggle signal table on/off
Show/hide Fibonacci levels
Control EMA visibility
Adjust table text size
Partial Exits
1R: 50% (default)
2R: 30% (default)
3R: 20% (default)
Fully customizable percentages
Trailing Stops
ATR-Based (best for scalping)
Pivot-Based
EMA-Based
Breakeven trigger at 0.8R
🎯 Best Use Cases
Ideal For:
✅ 1-minute scalping on liquid instruments
✅ Day traders looking for quick 2-8 minute trades
✅ High-frequency trading with 8-15 signals per session
✅ Trending markets where Range Filter excels
✅ Crypto, Forex, Futures - works on all liquid assets
Trading Style:
Timeframe: 1-minute (can work on 3-5 min with adjusted settings)
Hold Time: 3-8 minutes average
Target: 1.2-3R per trade
Frequency: 8-15 signals per day
Win Rate: 45-55% (with proper risk management)
📋 How to Use
Step 1: Wait for Signal
Watch for green triangle (BUY) or red triangle (SELL)
Signal table appears at top center automatically
Step 2: Review Confluence
Check grade (prefer A+, A, B+ for best quality)
Review all reasons listed in table
Confirm score is above your threshold (55+ recommended)
Note the R:R ratio
Step 3: Enter Trade
Enter at current market price
Set stop loss at red dashed line
Set take profit at blue dashed line
Mark 1R level (orange line) for partial exit
Step 4: Manage Trade
Exit 50% at 1R (orange line)
Move to breakeven after 0.8R
Trail remaining position using your chosen method
Exit fully at TP or opposite signal
🎨 Chart Setup Recommendations
Optimal Display:
Timeframe: 1-minute
Chart Type: Candles or Heikin Ashi
Background: Dark theme for best color visibility
Volume: Enable volume bars below chart
Complementary Indicators (optional):
Order flow/Delta for institutional confirmation
Market profile for key levels
Economic calendar for news avoidance
⚠️ Important Notes
Risk Disclaimer:
Not financial advice - for educational purposes only
Always use proper risk management (0.5-1% per trade max)
Past performance doesn't guarantee future results
Test on demo account before live trading
Best Practices:
✅ Trade during high liquidity hours (9:30-11 AM, 2-4 PM EST)
✅ Avoid news events and market open/close (first/last 2 minutes)
✅ Use tight stops (0.8-1.0 ATR) for 1-minute scalping
✅ Take partial profits quickly (1R = 50% off)
✅ Respect max daily loss limits (3% recommended)
✅ Focus on A and B grade setups for consistency
What Makes This Different:
🎯 Complete system - not just signals, but full trade management
📊 Multi-confluence - 10+ factors analyzed per trade
🎨 Professional visualization - clean, focused chart design
⚡ Optimized for 1-min - settings specifically tuned for fast scalping
📋 Transparent reasoning - see exactly why each trade was taken
🏆 Grade system - instantly know trade quality
🔧 Technical Details
Pine Script Version: 5
Overlay: Yes (plots on price chart)
Max Lines: 500
Max Labels: 100
Non-repainting: All signals confirmed on bar close
Alerts: Compatible with TradingView alerts
📞 Support & Updates
This indicator is actively maintained and optimized for 1-minute scalping. Settings can be adjusted for different timeframes and trading styles, but default configuration is specifically tuned for high-frequency 1-minute scalping.
🚀 Get Started
Add ProScalper to your 1-minute chart
Adjust settings to your risk tolerance
Wait for signals (green/red triangles)
Follow the signal table guidance
Manage trades using provided levels
Track performance with stats table
Happy Scalping! 📊⚡💰
Search in scripts for "sweep"

US30 Quarter Levels (125-point grid) by FxMogul🟦 US30 Quarter Levels — Trade the Index Like the Banks
Discover the Dow’s hidden rhythm.
This indicator reveals the institutional quarter levels that govern US30 — spaced every 125 points, e.g. 45125, 45250, 45375, 45500, 45625, 45750, 45875, 46000, and so on.
These are the liquidity magnets and reaction zones where smart money executes — now visualized directly on your chart.
💼 Why You Need It
See institutional precision: The Dow respects 125-point cycles — this tool exposes them.
Catch reversals before retail sees them: Every impulse and retracement begins at one of these zones.
Build confluence instantly: Perfectly aligns with your FVGs, OBs, and session highs/lows.
Trade like a professional: Turn chaos into structure, and randomness into rhythm.
⚙️ Key Features
Automatically plots US30 quarter levels (…125 / …250 / …375 / …500 / …625 / …750 / …875 / …000).
Color-coded hierarchy:
🟨 xx000 / xx500 → major institutional levels
⚪ xx250 / xx750 → medium-impact levels
⚫ xx125 / xx375 / xx625 / xx875 → intraday liquidity pockets
Customizable window size, label spacing, and line extensions.
Works across all timeframes — from 1-minute scalps to 4-hour macro swings.
Optimized for clean visualization with no clutter.
🎯 How to Use It
Identify liquidity sweeps: Smart money hunts stops at these quarter zones.
Align structure: Combine with session opens, order blocks, or FVGs.
Set precision entries & exits: Trade reaction-to-reaction with tight risk.
Plan daily bias: Watch how New York respects these 125-point increments.
🧭 Designed For
Scalpers, day traders, and swing traders who understand that US30 doesn’t move randomly — it moves rhythmically.
Perfect for traders using ICT, SMC, or liquidity-based frameworks.
⚡ Creator’s Note
“Every 125 points, the Dow breathes. Every 1000, it shifts direction.
Once you see the rhythm, you’ll never unsee it.”
— FxMogul

Liquidity Zones Alerts"Liquidity Zones Alerts" is a powerful smart-money-based indicator designed to detect key liquidity grabs and provide high-probability reversal signals using a combination of market structure, volume, volatility, and candlestick confirmation.
🧠 How It Works
The core logic of this indicator is built around the Smart Money Concepts:
🔺 Liquidity Sweeps: Detects when price takes out previous daily or weekly highs/lows, suggesting stop hunts or engineered liquidity moves by institutional players.
📈 Volume Filter: Ensures signals only appear during above-average volume, filtering out noise and low-interest moves.
⚡ Volatility Filter: Flags high-range candles relative to the average, catching flash crashes/spikes that often precede strong reversals.
🔄 Engulfing Candle Confirmation: Confirms entry with a bullish or bearish engulfing pattern after liquidity is taken — increasing signal reliability.
🧭 Premium/Discount Zone Logic: Trades are filtered to ensure longs are only taken in discount zones, and shorts in premium zones, using a 20-period market range for context.
📌 Features
✅ Daily & Weekly liquidity zones toggle
✅ Visual signals with clean 🔻(short) & 🔺(long) arrows
✅ Auto-detection of flash crashes
✅ Alerts on both long and short setups
✅ Optional previous high/low level plotting for context
✅ Background highlighting of valid signal candles
✅ Multi-timeframe friendly and compatible with any asset
🛠️ Use Case
Whether you're a scalper or a swing trader, this tool helps you spot institutional entry zones before the move happens. It works especially well when combined with your existing bias or supply/demand zones.
💬 “Price doesn't move randomly — it hunts liquidity. This indicator shows you where and when it happens.”

Midnight Range Standard DeviationsCredit to Lex Fx for the basic framework of this script
This indicator is designed to assist traders in identifying potential trading opportunities based on the Intraday Concurrency Technique (ICT) concepts, specifically the midnight range deviations and their relationship to Fibonacci levels. It builds upon the work of Lex-FX, whom we gratefully acknowledge for the original concept and inspiration for this indicator.
Core Concept: ICT Midnight Range
The core of this indicator revolves around the concept of the midnight range. According to ICT, the high and low formed in a specific time window (typically the first 30 minutes after midnight, New York Time) can serve as a key reference point for intraday price action. The indicator identifies this range and projects potential support and resistance levels based on deviations from this range, combined with Fibonacci ratios.
How ICT Uses Midnight Range Deviations
ICT methodology often involves looking for price to move away from the initial midnight range, then return to it, or deviate beyond it, as key areas for potential entries.
Range Identification: The indicator automatically identifies the high and low of the midnight range (00:00 - 00:30 NY Time).
Deviation Levels: The indicator calculates and displays deviation levels based on multiples of the initial midnight range. These levels are often used to identify potential areas of support and resistance, as well as potential targets for price movement. These levels can be set in the additional fib levels section, which can be configured in increments of .5 deviations all the way up to 12 deviations.
Fibonacci Confluence: ICT often emphasizes the confluence of multiple factors. This indicator adds Fibonacci levels to the midnight range deviations. This allows traders to identify areas where Fibonacci retracements or extensions align with the deviation levels, potentially creating stronger areas of support or resistance.
Looking for Sweeps: ICT often uses these levels to look for times that the high and low are swept as potential areas of liquidity, indicating the start of potential continuations.
Time-Based Analysis: The time at which price interacts with these levels can also be significant in ICT. The indicator provides options to extend the range lines to specific times (e.g., 3 hours, 6 hours, 10 hours, 12 hours, or a custom defined time) after midnight, allowing traders to focus on specific periods of the trading day.
Indicator Settings Explained:
Time Zone (TZ): Defines the time zone used for calculating the midnight range. The default is "America/New_York".
Range High Color, Range Low Color, Range Mid Color: Customize the colors of the high, low, and mid-range lines.
Range Fill Color: Sets the fill color for the area between the range high and low.
Line Style: Choose the style of the range lines (solid, dashed, dotted).
Range Line Thickness: Adjust the thickness of the range lines for better visibility.
Show Fibonacci Levels: Enable or disable the display of Fibonacci deviation levels.
Fib Up Color, Fib Down Color: Customize the colors of the Fibonacci levels above (up) and below (down) the midnight range.
Show Trendline: Enables a trendline that plots the close price, colored according to whether the price is above the high, below the low, or within the midnight range.
Show Range Lines, Show Range Labels: Toggles the visibility of the range lines and their associated labels.
Label Size: Adjust the size of the labels for better readability.
Hide Prices: Option to display only the deviation values on labels, hiding price values.
Place Fibonacci Labels on Left Side: Option to switch label position from right side to left side.
Extend Range To (Hours from Midnight): This section gives you a wide variety of options on how far you want to extend the range to, you can do 3,6,10,12, and 23 hours. Alternatively, you can select the "Use Custom Length" and set a specific time in hours.
Additional Fib Levels: This section allows the trader to set additional deviation points in increments of .5 deviations from .5 all the way up to 12 deviations
TradingView Community Guidelines Compliance:
This indicator description adheres to the TradingView community guidelines by:
Being educational: It explains the ICT methodology and how the indicator can be used in trading.
Being transparent: It clearly describes all the indicator's settings and their purpose.
Providing credit: It acknowledges Lex-FX as the original author of the concept.
Avoiding misleading claims: It does not guarantee profits or imply that the indicator is a "holy grail."
Disclaimer: Usage of this indicator and the information provided is at your own risk. The author is not responsible for any losses incurred as a result of using this indicator.
Important Considerations:
This indicator is intended for educational purposes and to assist in applying the ICT methodology.
It should not be used as a standalone trading system.
Always combine this indicator with other forms of technical analysis and risk management techniques.
Backtest thoroughly on your chosen market and timeframe before using in live trading.
Trading involves risk. Only trade with capital you can afford to lose.

Liquidity Sniper V3 (ANTI-FAKEOUT)An advanced institutional trading indicator combining liquidity pool targeting, smart money concepts, and momentum-based entries with comprehensive risk management.
🎯 CORE FEATURES:
- Liquidity Sniper Module: Identifies and targets major liquidity pools (PDH/PDL, PWH/PWL, Equal Highs/Lows, HVN/LVN edges)
- Anti-Fakeout Stack: 10-layer confirmation system including VWAP reclaim, micro BOS, displacement, relative volume, and mitigation entries
- Momentum Engulf Add-On: Catches high-velocity impulsive moves with engulfing candles, volume spikes, and volatility breakouts
- GARCH Volatility Filter: Dynamic volatility analysis to avoid choppy conditions
- Multi-Timeframe Confirmation: Ensures alignment across timeframes before entries
📊 SIGNAL CLASSIFICATION:
- BEST (Green): Highest probability setups with all confirmations aligned - 6.0+ score
- BETTER (Medium Green): Strong setups with most confirmations - 4.5-6.0 score
- GOOD (Light Green): Valid setups with basic confirmations - 3.0-4.5 score
🔍 TRADE SCENARIOS:
S1: Liquidity Reversal - Sweeps + reversals at key levels with displacement
S2: Continuation - Trend following with VWAP mean reversion
S3: Mean Reversion - Extreme deviations (2σ+) with Fibonacci exhaustion
S4: Deep Sweep - 3σ sweeps at major liquidity with high confluence
⚡ MOMENTUM TRIGGERS:
- MET (Momentum Engulf): Bullish/bearish engulfing with 1.5x+ volume spike and ATR impulse
- VBT (Volatility Breakout): Range breakouts with sigma bursts and participation
🛡️ RISK MANAGEMENT:
- Dynamic TP/SL based on ATR, VWAP bands, and liquidity pools
- 3-tier targets (T1: VWAP, T2: Nearest pool, T3: 5R extension)
- Early invalidation tracking (0.5R movement monitoring)
- Minimum 2:1 RR requirement with cooldown periods
- RTH session filters and anti-spam protection
📈 TECHNICAL EDGE:
- SMT Divergence detection vs ES correlation
- CVD (Cumulative Volume Delta) divergence confirmation
- FVG (Fair Value Gap) and Order Block mitigation entries
- Equal highs/lows clustering analysis
- Volume profile HVN/LVN identification
⚙️ FULLY CUSTOMIZABLE:
All parameters adjustable including cooldowns, proximity thresholds, ATR multipliers, RR floors, and scenario weights.
Perfect for: ES/NQ futures, forex majors, and liquid stocks. Works on 1-15 min timeframes. Best results during NY session (9:35-11:00 AM & 1:30-3:30 PM ET).
Created for serious traders seeking institutional-grade edge with quantifiable risk/reward and high-probability setups

Wick Pressure Zones [BigBeluga]
The Wick Pressure Zones indicator highlights areas where extreme wick activity occurred, signaling strong buy or sell pressure. By measuring unusually long upper or lower wicks and mapping them into gradient volume zones , the tool helps traders identify levels where liquidity was absorbed, leaving behind footprints of supply and demand imbalances. These zones often act as support, resistance, or liquidity sweep magnets .
🔵 CONCEPTS
Extreme Wicks : Large upper or lower shadows indicate aggressive rejection — upper wicks suggest selling pressure, lower wicks suggest buying pressure.
Volumatic Gradient Zones : From each detected wick, the indicator projects a layered gradient zone, proportional to the wick’s size, showing where most pressure occurred.
Liquidity Footprints : These zones mark levels where significant buy/sell volume was executed, often becoming reaction points on future retests.
Automatic Expiration : Zones persist until price decisively trades through them, after which they are cleared to keep the chart clean.
🔵 FEATURES
Automatic Wick Detection : Identifies extreme upper and lower wick events using percentile filtering and Realative Strength Index.
Gradient Zone Visualization : Builds a 10-layer zone from the wick top/bottom, shading intensity according to pressure strength.
Volume Labels : Each zone is annotated with the bar’s volume at the origin point for added context.
Dynamic Zone Extension : Zones extend to the right as long as they remain relevant; once price closes through them, they are removed.
Support & Resistance Mapping : Upper wick zones (red) behave like supply/resistance, lower wick zones (green) like demand/support.
Clutter Control : Limits the number of active zones (default 10) to keep charts responsive.
Background Highlighting : Optional background shading when new wick zones appear (red for sell, green for buy).
🔵 HOW TO USE
Look for Upper Wick Zones (red) : Indicate strong selling pressure; watch for resistance, reversals, or liquidity sweeps above.
Look for Lower Wick Zones (green) : Indicate strong buying pressure; watch for support or liquidity sweeps below.
Trade Retests : When price returns to a zone, expect a reaction (bounce or rejection) due to leftover liquidity.
Combine with Context : Align wick pressure zones with HTF support/resistance, order blocks, or volume profile for stronger signals.
Use Volume Labels : High-volume wicks indicate more significant liquidity events, making the zone more likely to act as a strong reaction point.
🔵 CONCLUSION
The Wick Pressure Zones is a powerful way to visualize hidden liquidity and aggressive rejections. By mapping extreme wick events into dynamic, volume-annotated zones, it shows traders where the market absorbed heavy buy/sell pressure. These levels frequently act as magnets or turning points, making them valuable for timing entries, stop placement, or fade strategies.

Session Based Liquidity# Session Based Liquidity Indicator - Educational Open Source
## 📊 Overview
The Session Based Liquidity indicator is a comprehensive educational tool designed to help traders understand and visualize liquidity concepts across major trading sessions. This indicator identifies Buy-Side Liquidity (BSL) and Sell-Side Liquidity (SSL) levels created during Asia, London, and New York trading sessions, providing insights into institutional order flow and potential market reversal zones.
## 🎯 Key Features
### 📈 Multi-Session Tracking
- **Asia Session**: Tokyo/Sydney overlap (20:00-02:00 EST)
- **London Session**: European markets (03:00-07:30 EST)
- **New York Session**: US markets (09:30-16:00 EST)
- Individual session toggle controls for focused analysis
### 💧 Liquidity Level Detection
- **Buy-Side Liquidity (BSL)**: Identifies stop losses above swing highs where short positions get stopped out
- **Sell-Side Liquidity (SSL)**: Identifies stop losses below swing lows where long positions get stopped out
- Advanced filtering algorithm to identify only significant liquidity zones
- Configurable pivot strength for sensitivity adjustment
### 🎨 Visual Management System
- **Unclaimed Levels**: Active liquidity zones that haven't been hit (default: black lines)
- **Claimed Levels**: Swept liquidity zones showing historical interaction (default: red lines)
- Customizable line styles, colors, and widths for both states
- Dynamic label system showing session origin and level significance
- Real-time line extension and label positioning
### ⚙️ Advanced Configuration
- **Pivot Strength**: Adjust sensitivity (1-20) for liquidity detection
- **Max Levels Per Side**: Control number of tracked levels (1-10) per session
- **Label Offset**: Customize label positioning
- **Style Customization**: Full control over visual appearance
## 📚 Educational Value
### Core Concepts Explained
- **Liquidity Pools**: Areas where stop losses and pending orders cluster
- **Liquidity Sweeps**: When price moves through levels to trigger stops, then reverses
- **Session-Based Analysis**: How different market sessions create distinct liquidity characteristics
- **Institutional Order Flow**: Understanding how large players interact with retail liquidity
### Trading Applications
- Identify high-probability reversal zones after liquidity sweeps
- Understand where stop losses are likely clustered
- Avoid trading into obvious liquidity traps
- Use session context for timing entries and exits
- Recognize institutional accumulation and distribution patterns
### Code Learning Opportunities
- **Pine Script v6 Best Practices**: Modern syntax and efficient coding patterns
- **Object-Oriented Design**: Custom types and methods for clean code organization
- **Array Management**: Dynamic data structure handling for performance
- **Visual Programming**: Line, label, and styling management
- **Session Detection**: Time-based filtering and timezone handling
## 🔧 Technical Implementation
### Performance Optimized
- Efficient memory management with automatic cleanup
- Limited historical level tracking to maintain responsiveness
- Optimized array operations for smooth real-time updates
- Smart filtering to reduce noise and focus on significant levels
### Code Architecture
- **Modular Design**: Clean separation of concerns with dedicated methods
- **Type Safety**: Custom SessionLiquidity type for organized data management
- **Extensible Structure**: Easy to modify and enhance for specific needs
- **Educational Comments**: Comprehensive documentation throughout
## 💡 Usage Guide
### Basic Setup
1. Add indicator to chart
2. Configure session times for your timezone
3. Adjust pivot strength based on timeframe (higher for lower timeframes)
4. Enable/disable sessions based on your trading focus
### Interpretation
- **Unclaimed levels**: Watch for price interaction and potential reversals
- **Claimed levels**: Use as potential support/resistance after sweep
- **External levels**: Beyond session range, higher significance
- **Internal levels**: Within session range, may indicate ranging conditions
### Best Practices
- Use higher timeframes (15m+) for cleaner signals
- Combine with price action analysis for confirmation
- Consider session overlap periods for increased significance
- Monitor multiple sessions for comprehensive market view
## 🎓 Educational Goals
This open-source project aims to:
- Demystify liquidity concepts for retail traders
- Provide practical coding examples in Pine Script v6
- Encourage understanding of institutional trading behavior
- Foster community learning and collaboration
- Bridge the gap between theory and practical application
## 📄 License & Usage
Released under Mozilla Public License 2.0 - free for educational and commercial use with proper attribution.
## 🤝 Contributing
As an open-source educational tool, contributions are welcome! Whether it's bug fixes, feature enhancements, or educational improvements, your input helps the trading community learn and grow.
## ⚠️ Disclaimer
This indicator is for educational purposes only. All trading involves risk, and past performance does not guarantee future results. Always practice proper risk management and never risk more than you can afford to lose.
---
*By studying and using this indicator, traders can develop a deeper understanding of market microstructure and improve their ability to read institutional order flow patterns.*

Whale Fractal Levels (V1.0)What it does
This indicator plots Fractal Levels (Bill Williams pivots) as horizontal lines and prints clean signals for:
BO+ / BO− → Breakouts through the latest fractal high/low
SW↑ / SW↓ → Liquidity sweeps (wick pierces, close rejects)
RE+ / RE− → Retests of the broken level after a confirmed breakout
Cyan = support (fractal lows).
Lilac = resistance (fractal highs).
How it works
Detects fractals with Left/Right = lr. A pivot is confirmed after lr bars on the right → the level itself doesn’t repaint.
Each confirmed fractal spawns a horizontal line extended to the right. You can limit how many lines stay on chart and auto-expire old ones.
Signals reference the most recent fractal high/low only and are edge-triggered (crossover/crossunder) with a cooldown so you don’t get a marker on every bar near the level.
A small state machine remembers the last breakout to validate the next retest.
Inputs (Settings)
Fractals
Left/Right (BW fractal) — Sensitivity of pivots (lower = more reactive, higher = cleaner).
MAX number of levels to display — Keep only the most recent N lines.
Level lifetime (bars) — Auto-delete lines after N bars to declutter.
Signals
Cooldown between signals (bars) — Minimum spacing between markers (anti-spam).
Show Breakouts (BO±) — Toggle breakout markers.
Show Sweeps (SW↑/SW↓) — Toggle sweep markers.
Show Retests (RE±) — Toggle retest markers.
Display
Show fractal lines / Line width / Line transparency (0..100)
Alerts (ready to use)
BO+ (Fractal), BO- (Fractal)
SW↑ (Fractal), SW↓ (Fractal)
RE+ (Fractal), RE- (Fractal)

MJBFX VWAP WITH SIGNALSThe MJBFX VWAP Channel is a custom-built volume-weighted average price indicator designed around the MJBFX trading methodology.
This tool tracks multiple rolling VWAPs anchored to a user-defined timeframe (default: 1H), then calculates percentile levels (Max, Upper, Median, Lower, Min) to create a dynamic channel. These levels act as key support and resistance zones that adapt to market conditions.
🔶 Features:
Adjustable anchor period and VWAP count (up to 500 VWAPs)
Percentile-based VWAP levels (Max, Upper, Median, Lower, Min)
Customisable colours, widths, and line styles
Optional gradient channel fills
Anchor period highlights for session awareness
MJBFX Branded Signals:
🟠 Buy – Triggered when price crosses above the lower VWAP (MJBFX Orange)
⚪ Sell – Triggered when price crosses below the upper VWAP (MJBFX Grey)
Built-in alert conditions for automated trade notifications
🔶 How to Use:
The VWAP channel provides a dynamic structure for intraday trading.
Buy opportunities often occur when price sweeps below the lower band and reclaims it.
Sell opportunities often occur when price sweeps above the upper band and rejects.
Use in confluence with market structure, session timing, and your trading plan (e.g., MJB-FX Asian Sweep strategy).

Smart Money Trap SignalSmart Money Trap Signal – Indicator Description
The Smart Money Trap Signal is a precision-based trading tool designed to identify areas where institutional traders (smart money) are likely to trap retail traders through false breakouts and liquidity grabs. These traps often occur near key highs and lows, where retail traders are lured into trades just before price reverses sharply.
🔍 Key Features:
Liquidity Sweep Detection
Identifies false breakouts of recent swing highs or lows, signaling potential liquidity grabs by large players.
Reversal Confirmation
Confirms the trap using a classic price action reversal pattern (bullish or bearish engulfing), helping filter out weak signals.
Optional Volume Spike Filter
Allows additional confirmation based on a significant spike in volume, indicating potential institutional involvement.
Buy and Sell Trap Signals
🔴 Smart Money Short (SMT↓) – Triggered when price sweeps a high and reverses down.
🟢 Smart Money Long (SMT↑) – Triggered when price sweeps a low and reverses up.
Alerts & Labels
Real-time alert conditions and on-chart labels to help you catch setups without missing opportunities.
📈 How to Use:
Apply on Higher Timeframes (1H, 4H, Daily) for cleaner signals.
Look for SMT signals at key supply/demand zones or market structure points.
Combine with your existing trading strategy, such as order blocks or break of structure (BoS), for higher accuracy.
Use volume filter only if you're analyzing markets where volume data is reliable.
⚠️ Disclaimer:
This tool is meant to assist with trade identification, not trade execution. Always use proper risk management and validate setups with your trading plan.
ICT MACRO MAX RETRI ( ALERT )🖤 ICT Reversal Detector – Minimalist Edition
This indicator is designed for traders who follow Inner Circle Trader (ICT) concepts, particularly focused on liquidity sweeps and displacement reversals.
It detects:
• Swing Highs & Lows that occur during the most reactive windows of each hour
→ Specifically the last 20 minutes and first 15 minutes
(ICT teaches these moments often reveal macro-level reversals. I’ve expanded the window slightly to give the indicator more room to catch valid setups.)
• Liquidity Sweeps of previous highs/lows
• Displacement (State Change): defined as a manipulation wick followed by 1–3 strong candles closing in the opposite direction
Visually:
• Clean black lines pointing right from the liquidity sweep wick
• White triangle markers inside black label boxes only when valid displacement occurs
• No clutter, no unnecessary shapes — just focused signal
Built for:
• 5-minute charts, especially NASDAQ (NAS100) and S&P 500 (SPX500)
• Confirm setups manually on the 15-minute chart for extra precision
This is a partial automation tool for ICT-style reversal traders who prefer clarity, minimalism, and sharp intuition over noise.
Let it alert you to setups — then decide like a sniper.

eBacktesting - Learning: Liquidity GrabseBacktesting - Learning: Liquidity Grabs highlights moments when price pushes just beyond a recent swing high or swing low (where many stops tend to sit) and then quickly returns back inside the level. This behavior is often called a stop run, sweep, or liquidity grab.
Traders study these events because they can reveal:
- Where liquidity is “resting” (obvious highs/lows)
- A quick sweep and rejection (often a wick)
- When a breakout attempt is actually a trap
- A full candle close through the level, followed by an immediate reversal back inside (classic breakout trap)
- Potential areas where price may reverse or accelerate after stops are taken
Use it as a training tool to build pattern recognition and improve your patience around key levels, especially during active sessions where sweeps happen frequently.
These indicators are built to pair perfectly with the eBacktesting extension, where traders can practice these concepts step-by-step. Backtesting concepts visually like this is one of the fastest ways to learn, build confidence, and improve trading performance.
Educational use only. Not financial advice.

The Cantillon Liquidity Trap [SFP] - PRORetail traders chase breakouts. Institutions engineer traps."
The Problem: How often do you see price break a key High/Low, trigger your stop loss, and then immediately reverse in the other direction? This is not bad luck. This is a Liquidity Grab (Swing Failure Pattern). Institutions need your stop orders to fill their large positions. Once they are filled, the market reverses.
How This Tool Helps: The Cantillon Liquidity Trap automatically detects these manipulation points in real-time. It does not just look for "wicks"—it uses a strict institutional algorithm to identify:
Major Pivot Points: (Where the stops are hiding).
The Sweep: (The stop run).
The Failure: (Price closing back inside the range).
Volume Confirmation: (Smart money absorption).
The Signals:
🟥 TRAP (Bearish): A Swing High was swept, but buyers failed to hold. Look for Shorts.
🟩 GRAB (Bullish): A Swing Low was swept, but sellers were absorbed. Look for Longs.
🚀 How to Trade This (The Strategy): This tool provides the "WHEN" (The Trigger). To get the highest win rate, you must combine it with the "WHERE" (The Level).
Optimum Setup: Wait for a "TRAP" signal that aligns perfectly with a Volume Shelf or AVWAP. When "Time" (SFP) meets "Location" (Cantillon Level), you have an A+ Institutional Setup.
This is optimized for 4H, but feel free to play with it.
👇 Works best together with my "the cantillon overlay" signature below.

False Breakdown Long Confirm (dropthoughcashin)// =============================================================================
// EN — Script Introduction
// Name: False Breakdown Long Confirm (dropthoughcashin)
// Timeframe: Designed for 5-minute charts (works on other TFs but tuned for 5m)
//
// What this script does:
// This indicator detects a “false breakdown” (liquidity sweep) below a support
// level, followed by a reclaim and a retest-hold confirmation. When confirmed,
// it prints a label and triggers the alert condition: dropthoughcashin.
//
// Core logic (3 steps):
// 1) Define the support level (Key Level):
// - Pivot mode: uses the latest confirmed pivot low as support.
// - Manual mode: uses your manually entered support level.
// 2) False breakdown + reclaim:
// - Price sweeps below support (low < support),
// - The sweep must be shallow (limited by ATR multiple or fixed points),
// - Then price reclaims: close back above the support.
// 3) Retest-hold confirmation (within N bars after reclaim):
// - Price retests near the support (low <= support + tolerance),
// - And closes at/above the support (hold),
// - If confirmed within the window, signal triggers once.
//
// Key parameters:
// - Max Penetration: filters out “deep breakdowns” you do NOT want.
// - Retest tolerance: how close price must retest the support.
// - Confirm within N bars: time limit to confirm after reclaim.
//
// Notes / Limitations:
// - Pivot support is lagging by design (pivot is confirmed after pLen bars).
// - This is a signal/alert tool, not a full trading strategy.
// =============================================================================
//
// 中文 — 脚本介绍
// 名称:False Breakdown Long Confirm(dropthoughcashin)
// 周期:主要为 5分钟K 设计(其他周期也能用,但默认参数以 5m 优化)
//
// 脚本作用:
// 本指标用于识别“假跌破(扫流动性/扫止损)”形态:价格先刺破支撑位,随后快速收回
// 并在短时间内回踩踩住,形成做多确认。确认后会在图上打标签,并触发提醒条件:
// dropthoughcashin。
//
// 核心逻辑(3步):
// 1) 定义支撑位(Key Level):
// - Pivot 模式:用最近确认的 pivot low(局部低点)作为支撑。
// - Manual 模式:用你手动输入的固定支撑价位。
// 2) 假跌破 + 收回(reclaim):
// - 价格最低点刺破支撑(low < 支撑),
// - 但下穿幅度必须“浅”(用 ATR 倍数或固定点数限制),
// - 随后收盘重新站回支撑上方(close > 支撑)。
// 3) 回踩踩住确认(retest-hold):
// - 在收回之后的 N 根K内,价格回踩到支撑附近(low <= 支撑 + 容忍),
// - 且收盘守住支撑(close >= 支撑),
// - 满足则触发一次信号与提醒。
//
// 关键参数说明:
// - Max Penetration(最大下穿深度):过滤掉“下穿太深”的破位,避免误触发。
// - Retest tolerance(回踩容忍范围):定义回踩要贴近支撑到什么程度。
// - Confirm within N bars(确认窗口):收回后限定多少根K内必须完成回踩确认。
//
// 注意事项:
// - Pivot 支撑位天然滞后(需要 pLen 根K确认后才成立),属于“稳但晚”的设计。
// - 该脚本是信号/提醒工具,不是完整的交易策略(不包含止损止盈与仓位管理)。

LiqVision Institutional Suite v6.2 – Hybrid ModeLiqVision Institutional Suite v6.2 — Hybrid Mode (Lightning Edition)
Een ultra-geoptimaliseerde Smart Money-indicator gebaseerd op institutionele principes: Liquidity, Market Structure, Order Blocks, FVG’s en Model 1/2 setups.
Dit script combineert meerdere professionele SMC-concepten in één engine:
🔷 Functionaliteiten
1. Liquidity Engine
Automatische detectie van EQH, EQL en Liquidity Sweeps
Dynamische lijnprojectie met smart cleanup
Slimme sweep-detectie voor high-probability entries
2. Market Structure Engine
BOS & CHOCH detectie
Trend continuatie- en reversalsignalen
Swing-based pivot logic
3. Order Block Engine
Automatische OB-detectie met displacement filtering
Bullish & Bearish macro Order Blocks
HTF glow overlay (nieuw in v6.2)
4. FVG Engine
Major Fair Value Gap detection
Up/Down imbalance visual engine
HTF-based color restoration (v6.2 fix)
5. Model 1 & Model 2 Signal Engine
Trend continuation entries (Model 1)
Reversal setups gebaseerd op HTF liquidity & displacement (Model 2)
Auto-tapping logic geïntegreerd met OB/FVG
6. Hybrid Mode Rendering
Slimme shading afhankelijk van timeframe:
LTF → Hide OB/FVG
MTF → White overlays
HTF → Premium glow visuals
🔷 Alerts
Volledige alert-ondersteuning voor:
Model 1 Buy/Sell
Model 2 Buy/Sell
Liquidity Sweep
BOS Up/Down
CHOCH Up/Down
OB Tap
FVG Tap
Any alert() function call
Geschikt voor Telegram, Discord, bots en externe signal pipelines.
🔷 Gebruik
Voeg de indicator toe
Kies timeframe (1m–4h aanbevolen)
Activeer alerts via “Any alert() function call”
Volg Model 1/2 entries voor optimaal resultaat
⚡ DISCLAIMER
Dit script is uitsluitend bedoeld voor educatieve doeleinden. Geen financieel advies. Resultaten uit het verleden geven geen garantie voor de toekomst.

HTF Manipulation Swing Points [Pogiest]General
HTF Manipulation Swing Points plots out relevant swings on the higher timeframes selected and draws a horizontal line anchored from the extremes of the swing point. These are important levels traders can look to base entries off of. This indicator is designed to track higher timeframe swing points on a lower timeframe. It will detect a sweep (Manipulation) or a breakout/breakdown (Failure to Manipulate) based on the higher timeframe candle close.
Usage
Depending on how the higher timeframe candles engage the relevant swing points, it can assist traders on bias and direction given the higher timeframe order-flow, lower timeframe order-flow, zones, levels, etc. Manipulation of swing points can potentially signal the start of a reversal or retracement. Failure to Manipulate swing points can potentially signal continuation of the higher timeframe current trend. It is up to the trader to gauge the price action at these levels.
How the Indicator works
1. Lines (Not engaged) - Plots out line from higher timeframe swing points and extends to the right.
2. Manipulation (M) - M label will be plotted on the swing point line that has been engaged. For example, if 1 hour timeframe was selected in settings and the 1 hour swing point line is plotted on the chart, the indicator will track the first one hour candle to engage the line and wait for the 1 hour engaging candle to close before marking it out as a Manipulation label. It is deemed to be manipulation if the 1 hour candle sweeps the level and closes back into the range.
3. Failure to Manipulate (FTM) - FTM label functions the same as Manipulation in which it waits for the swing point line to be engaged in order for a label to be printed. However, if the price does not sweep the swing point, breaks through, and closes beyond the level then it would be deemed a "Failure to Manipulate".
Note: The timeframe selected in settings will match the engaging candle. For instance, if a 4 hour timeframe is selected, the next 4 hour candle that engages the swing point level will need to close before it displays a label. In addition, this indicator is designed to view on lower timeframes with higher timeframe swing points selected in Settings.
Settings
Timeframes:
1. Choose up to two timeframes for swing point levels.
2. Adjust Pivot lookback.
3. Option to change high and low line color, line style, and line width.
Timeframe Manipulation Labels:
4. Show/hide labels.
5. Option to adjust offset of labels horizontally/vertically for each high or low line.
6. Option to change label colors, label size, and text color.
Line Tags:
7. Show/hide line end tags.
8. Option to change tag size and tag color.
9. Adjust offset of tags.
Overlap Detection:
10. Adjust overlap threshold percentage.
11. Adjust label shift amount (for when labels are overlapping each other).
Alerts:
12. Option to enable/disable all alerts. Select different alerts for each timeframe (i.e. manipulate alert or failure to manipulate alert).
Risk Disclaimer
This indicator is for educational and informational purposes only and does not constitute financial advice. All trading and investment decisions remain solely the responsibility of the user.
Trading involves a high degree of risk, and past performance is not indicative of future results.
Always conduct your own research and consult with a qualified financial professional before making any trading decisions.
By using this indicator, users acknowledge they understand these risks and accept full responsibility for their trading decisions and outcomes.

BifaneiroSinaleiro V3 ULTIMATEBifaneiroSinaleiro V3 ULTIMATE - Complete ICT Analysis System & Signal Generator
This isn't just an indicator - it's your 24/7 ICT analyst that does the manual work for you.
━━━━━━━━━━━━━━━━━━━━━━━━━━━━━━━━━━━━━━
🔥 WHAT IT DOES FOR YOU:
━━━━━━━━━━━━━━━━━━━━━━━━━━━━━━━━━━━━━━
✅ Marks ALL ICT Concepts Automatically:
- Fair Value Gaps (LTF + HTF with priority)
- Market Structure (BOS/CHoCH in real-time)
- Breaker Blocks (validated with volume + killzone)
- Liquidity Sweeps (Asian High/Low runs)
- Premium/Discount Arrays + OTE Zones
- Institutional Sessions (London, NY Silver Bullets)
✅ Advanced Pattern Recognition:
- Turtle Soup (sweep + reversal)
- Unicorn Model (sweep → BOS → FVG)
- SMT Divergences (monitors correlated pairs)
- PO3/AMD Phases (Accumulation → Manipulation → Distribution)
✅ Intelligent Scoring System:
- 12+ confluence factors analyzed
- Minimum score 12 for signals (configurable)
- Score 20+ = EXTREME (enables 2nd trade in session)
- Visual score display on every signal
✅ Professional Trade Management:
- 1 trade per session (London, NY AM, NY PM) = max 3/day
- EXTREME mode: 2 trades per session = max 6/day
- Automatic stop loss (session range-based)
- Dynamic take profit (score-adjusted multiplier)
- Auto breakeven after 2.5x move
- EOD close (23:59) with P&L label
- Weekend close (Fri 23:55) with P&L label
✅ 100% ICT Pure Methodology:
- NO EMAs, NO ATR, NO lagging indicators
- Pure price action: High/Low/Range only
- HTF confirmation via Premium/Discount (not EMAs!)
- Stop loss via Asian Range (not ATR!)
━━━━━━━━━━━━━━━━━━━━━━━━━━━━━━━━━━━━━━
⚡ WHY IT'S DIFFERENT:
━━━━━━━━━━━━━━━━━━━━━━━━━━━━━━━━━━━━━━
Traditional indicators show 1-2 concepts. This shows 10+ simultaneously.
Manual ICT takes 2-3 hours per session. This does it in milliseconds.
Other systems guess. This scores with objective confluence.
You save hours daily. You trade better. You profit more consistently.
━━━━━━━━━━━━━━━━━━━━━━━━━━━━━━━━━━━━━━
📊 WHAT YOU GET:
━━━━━━━━━━━━━━━━━━━━━━━━━━━━━━━━━━━━━━
- Real-time dashboard (scores, confluences, structure)
- Precision signals (only in killzones, only with confluences)
- Trade tracking (win rate, RR, P&L by session)
- Multi-timeframe analysis (automatic)
- News block filter (configurable)
- Full customization (colors, thresholds, sessions)
- Comprehensive alerts (8+ types)
Works on: Forex, Indices, Commodities, Crypto
Best on: 1m-5m for execution, 15m+ for swing
Timezone: Configured for CET (UTC+1), easily adjustable
⚠️ This is a professional tool requiring ICT/SMC understanding.
Not magic - it's methodology, automated.
🚀 Stop drawing. Start trading. Add to chart now.

CVD Divergences (cdikici71 x tncylyv)CVD Divergence
Summary
This indicator brings the powerful and creative divergence detection logic from @cdikici71's popular "cd_RSI_Divergence_Cx" script to the world of volume analysis.
While RSI is a fantastic momentum tool, I personally choose to rely on volume as a primary source of truth. This script was born from the desire to see how true buying and selling pressure—measured by Cumulative Volume Delta (CVD)—diverges from price action. It takes the brilliant engine built by @cdikici71 and applies it to CVD, offering a unique look into market conviction.
What is Cumulative Volume Delta (CVD)?
CVD is a running total of volume that transacted at the ask price (buying) minus volume that transacted at the bid price (selling). In simple terms, it shows whether buyers or sellers have been more aggressive over a period. A rising CVD suggests net buying pressure, while a falling CVD suggests net selling pressure.
Core Features
• Divergence Engine by @cdikici71: The script uses the exact same two powerful methods for finding divergences as the original RSI version:
o Alignment with HTF Sweep: The default, cleaner method for finding high-probability divergences.
o All: A more sensitive method that finds all possible divergences.
• Anchored CVD Periods: You can choose to reset the CVD calculation on a Daily, Weekly, or Monthly basis to analyze buying and selling pressure within specific periods. Or, you can leave it on Continuous to see the all-time flow.
• Automatic Higher Timeframe (HTF) Alignment: To remove the guesswork, the "Auto-Align HTF" option will automatically select a logical higher timeframe for divergence analysis based on your current chart (e.g., 15m chart uses 4H for divergence, 1H chart uses 1D, etc.). You can also turn this off for full manual control.
• Fully Customizable Information Table: An on-screen table keeps you updated on the divergence status. You can easily adjust its Position and Size in the settings to fit your chart layout.
• Built-in Alerts: Alerts are configured for both Bullish and Bearish divergences to notify you as soon as they occur.
How to Use This Indicator
The principle is the same as any divergence strategy, but with the conviction of volume behind it.
• 🔴 Bearish Divergence: Price makes a Higher High, but the CVD makes a Lower High or an equal high. This suggests that the buying pressure is weakening and may not be strong enough to support the new price high.
• 🟢 Bullish Divergence: Price makes a Lower Low, but the CVD makes a Higher Low or an equal low. This suggests that selling pressure is exhausting and the market may be ready for a reversal.
Always use divergence signals as a confluence with your own analysis, support/resistance levels, and market structure.
Huge Thanks and Credit
This script would not exist without the brilliant and creative work of @cdikici71. The entire divergence detection engine, the visualization style, and the core logic are based on his original masterpiece, "cd_RSI_Divergence_Cx". I have simply adapted his framework to a different data source.
If you find this indicator useful, please go and show your support for his original work!
________________________________________
Disclaimer: This is a tool for analysis, not a financial advice signal service. Please use it responsibly as part of a complete trading strategy.

VWAP + Range Breakout (Pre-Signal for Manual Entry)WHAT IT DOES
This tool highlights potential breakout opportunities when price sweeps the previous day’s high or low and aligns with VWAP and short-term range levels. It provides both pre-signals (early warnings) and confirmed signals (breakout closed) so traders can prepare before momentum accelerates.
Works on all timeframes and across markets (indices, forex, crypto). Especially useful during active London and New York sessions.
---
KEY FEATURES
Daily sweep logic: previous day high/low as liquidity reference
VWAP with cumulative calculation
Adjustable range breakout levels
Optional SMA trend filter
Session filter (London / NY trading hours)
Pre-Signal markers (early alert before breakout)
Confirmed LONG/SHORT signals after breakout close
Alerts for Pre-Long, Pre-Short, and Confirmed entries
---
HOW TO USE
1. Wait for price to sweep the previous day high/low.
2. Look for alignment with VWAP and the defined range breakout levels.
3. Use trend/session filters for higher accuracy.
4. Combine with your own risk management rules.
---
SETTINGS TIPS
Adjust range lookback for different timeframes (shorter for fast intraday, longer for higher timeframes).
Enable/disable session filters depending on your market.
Use SMA trend filter to stay aligned with higher-timeframe bias.
---
WHO IT’S FOR
Scalpers, intraday, and swing traders who want early signals when liquidity is taken and price is preparing for a breakout.
---
NOTES
For educational purposes only. No financial advice.
This script is open-source; redistribution follows TradingView rules.

ICT SIlver Bullet Trading Windows UK times🎯 Purpose of the Indicator
It’s designed to highlight key ICT “macro” and “micro” windows of opportunity, i.e., time ranges where liquidity grabs and algorithmic setups are most likely to occur. The ICT Silver Bullet concept is built on the idea that institutions execute in recurring intraday windows, and these often produce high-probability setups.
🕰️ Windows
London Macro Window
10:00 – 11:00 UK time
This aligns with a major liquidity window after the London equities open settles and London + EU traders reposition.
You’re looking for setups like liquidity sweeps, MSS (market structure shift), and FVG entries here.
New York Macro Window
15:00 – 16:00 UK time (10:00 – 11:00 NY time)
This is right after the NY equities open, a key ICT window for volatility and liquidity grabs.
Power Hour
Usually 20:00 – 21:00 UK time (3pm–4pm NY time), the last trading hour of NY equities.
ICT often refers to this as another manipulation window where setups can form before the daily close.
🔍 What the Indicator Does
Draws session boxes or shading: so you can visually see the London/NY/Power Hour windows directly on your chart.
Macro vs. Micro time frames:
Macro windows → The ones you set (London & NY) are the major daily algo execution windows.
Micro windows → Within those boxes, ICT expects smaller intraday setups (like a Silver Bullet entry from a sweep + FVG).
Guides your trade selection: it tells you when not to hunt trades everywhere, but instead to wait for price action confirmation inside those boxes.
🧩 How This Fits ICT Silver Bullet Trading
The ICT Silver Bullet strategy says:
Wait for one of the macro windows (London or NY).
Look for liquidity sweep → market structure shift → FVG.
Enter with defined risk inside that hour.
This indicator essentially does step 1 for you: it makes those high-probability windows visually obvious, so you don’t waste time trading random hours where algos aren’t active.

Ayman Entry Signal – Ultimate PRO (Scalping Gold Settings)1. Overview
This indicator is a professional gold scalping tool built for TradingView using Pine Script v6.
It combines multiple price action and technical filters to generate high-probability Buy/Sell signals with built-in trade management features (TP1, TP2, SL, Break Even, Partial Close, Stats tracking).
It is optimized for XAUUSD but can be applied to other assets with proper setting adjustments.
2. Key Features
Multi-Condition Trade Signals – EMA trend, Break of Structure, Order Blocks, FVG, Liquidity Sweeps, Pin Bars, Higher Timeframe confirmation, Trend Cloud, SMA Cross, and ADX.
Full Trade Management – Auto-calculates lot size, SL, TP1, TP2, Break Even, Partial Close.
Dynamic Chart Drawing – Entry lines, SL/TP lines, trade boxes, and real-time PnL.
Statistics Panel – Tracks wins, losses, breakeven trades, and total PnL over selected dates.
Customizable Filters – All filters can be turned ON/OFF to match your strategy.
3. Main Inputs & Settings
Account Settings
Capital ($) – Total trading capital.
Risk Percentage (%) – Risk per trade.
TP to SL Ratio – Risk-to-reward ratio.
Value Per Point ($) – Value per pip/point for lot size calculation.
SL Buffer – Extra points added to SL to avoid stop hunts.
Take Profit Settings
TP1 % of Full Target – Fraction of TP1 compared to TP2.
Move SL to Entry after TP1? – Activates Break Even after TP1.
Break Even Buffer – Extra points when moving SL to BE.
Take Partial Close at TP1 – Option to close half at TP1.
Signal Filters
ATR Period – For SL/TP calculation buffer.
EMA Trend – Uses EMA 9/21 crossover for trend.
Break of Structure (BoS) – Requires structure break confirmation.
Order Block (OB) – Validates trades within OB zones.
Fair Value Gap (FVG) – Confirms trades inside FVGs.
Liquidity Sweep – Checks if liquidity zones are swept.
Pin Bar Confirmation – Uses candlestick patterns for extra confirmation.
Pin Bar Body Ratio – Controls strictness of Pin Bar filter.
Higher Timeframe Filters (HTF)
HTF EMA Confirmation – Confirms lower timeframe trades with higher timeframe trend.
HTF BoS – Confirms with higher timeframe structure break.
HTF Timeframe – Selects higher timeframe.
Advanced Filters
SuperTrend Filter – Confirms trades based on SuperTrend.
ADX Filter – Filters out low volatility periods.
SMA Cross Filter – Uses SMA 8/9 cross as filter.
Trend Cloud Filter – Uses EMA 50/200 as a cloud trend filter.
4. How It Works
Buy Signal Conditions
EMA 9 > EMA 21 (trend bullish)
Optional filters (BoS, OB, FVG, Liquidity Sweep, Pin Bar, HTF confirmations, ADX, SMA Cross, Trend Cloud) must pass if enabled.
When all active filters pass → Buy signal triggers.
Sell Signal Conditions
EMA 9 < EMA 21 (trend bearish)
Same filtering process but for bearish conditions.
When all active filters pass → Sell signal triggers.
5. Trade Execution & Management
When a signal triggers:
Lot size is auto-calculated based on risk % and SL distance.
SL is placed beyond recent swing high/low + ATR buffer.
TP1 and TP2 are calculated from the SL using the reward-to-risk ratio.
Break Even: If enabled, SL moves to entry price after TP1 is hit.
Partial Close: If enabled, half of the position closes at TP1.
Trade Exit: Full exit at TP2, SL hit, or partial close at TP1.
6. Chart Display
Entry Line – Shows entry price.
SL Line – Red dashed line at stop loss level.
TP1 Line – Lime dashed line for TP1.
TP2 Line – Green dashed line for TP2.
PnL Labels – Displays real-time profit/loss in $.
Trade Box – Visual area showing trade range.
Pin Bar Shapes – Optional, marks Pin Bars.
7. Statistics Panel
Stats Header – Shows “Stats”.
Total Trades
Wins
Losses
Breakeven Trades
Total PnL
Can be reset or filtered by date.
8. How to Use
Load the Indicator in TradingView.
Select Gold (XAUUSD) on your preferred scalping timeframe (1m, 5m, 15m).
Adjust settings:
Use default gold scalping settings for quick start.
Enable/disable filters according to your style.
Wait for a Buy/Sell alert.
Confirm visually that all desired conditions align.
Place trade with calculated lot size, SL, and TP levels shown on chart.
Let trade run – the indicator manages Break Even & Partial Close if enabled.
9. Recommended Timeframes
Scalping: 1m, 5m, 15m
Day Trading: 15m, 30m, 1H
Swing: 4H, Daily (adjust settings accordingly)

Rally/Drop Market Structure (Multi-Timeframe)Rally/Drop Market Structure
Supply and Demand Zones from Bullish/Bearish Breaks
Overview:
The Rally/Drop Market Structure indicator is a powerful price action tool that identifies key structural turning points in the market by detecting bullish and bearish breaks . After each confirmed break, it plots either a demand zone (following a bullish break or rally) or a supply zone (following a bearish break or drop). These zones represent institutional footprints — areas where price is likely to react due to imbalance or unfilled orders.
The indicator is based on synthetic higher timeframe (HTF) candles to provide a more stable and smoothed structural map, improving clarity and signal quality over raw candles.
How It Works:
- A bullish break is defined when price makes a higher high and a higher low (or closes above the previous high depending on your selected mode).
- A bearish break is defined when price makes a lower high and a lower low (or closes below the previous low).
- After a bullish break, the indicator plots a demand zone based on the low and high of the most recent bearish candle — representing where demand stepped in.
- After a bearish break, the indicator plots a supply zone from the most recent bullish candle — indicating where supply took control.
- Optional mitigation logic marks zones as mitigated (or deletes them) once price trades into the opposing side.
- Internal shift detection highlights swing highs and lows , labels structural points (HH, HL, LH, LL), and identifies potential liquidity sweeps .
Features:
- Dynamic plotting of rally-based demand zones and drop-based supply zones
- Toggle to use Highs/Lows or Close-based breaks for structure
- Support for LTF, MTF, and HTF analysis (with selectable timeframe)
- Zone mitigation logic with optional automatic cleanup
- Labeling of key swing points: HH , HL , LH , LL , and LS (Liquidity Sweep)
- Zigzag visualization for structure flow
- Alert-ready for internal shifts, BoS, and zone creation
- Separate styling options for BoS lines, internal shift shapes, and zone colors
How to Use:
- Set your desired HTF candle source (e.g., 1H or 4H) depending on your trading style.
- Use Highs/Lows mode for pure price action structure or Close mode for more conservative signals.
- Observe when a bullish break occurs — a demand zone will form where price previously dropped before rallying. Look for long opportunities if price revisits this zone.
- After a bearish break , a supply zone forms where the rally failed — use this to scout short entries on retests.
- Use BoS lines to confirm structure shifts and validate entry triggers or trend direction.
- Monitor mitigated zones for reduced reliability or avoid them completely by enabling automatic deletion.
- Use alerts to stay notified about key changes without watching the chart constantly.
Recommended Strategies:
- Smart money or ICT-style trading : identify institutional footprints and mitigation setups
- Reversal trading : catch price rejecting off unmitigated zones after structure break
- Trend continuation : enter in the direction of internal structure after pullbacks into zones
- Liquidity sweep confirmation : filter out false breaks using HH/LL with LS detection
Tips:
- Combine this indicator with a higher timeframe bias tool (e.g., moving average, higher timeframe market structure).
- For scalping, use tighter HTFs and reduce the zone duration.
- For swing trading, use larger HTFs (1H, 4H, Daily) and increase zone persistence.
Summary:
The Rally/Drop Market Structure indicator gives you an actionable framework for understanding price structure, market intent, and supply/demand imbalances. Whether you're looking for precision entries, trend confirmation, or smart money concepts, this tool helps simplify complex price behavior into clean, usable structure and zones.

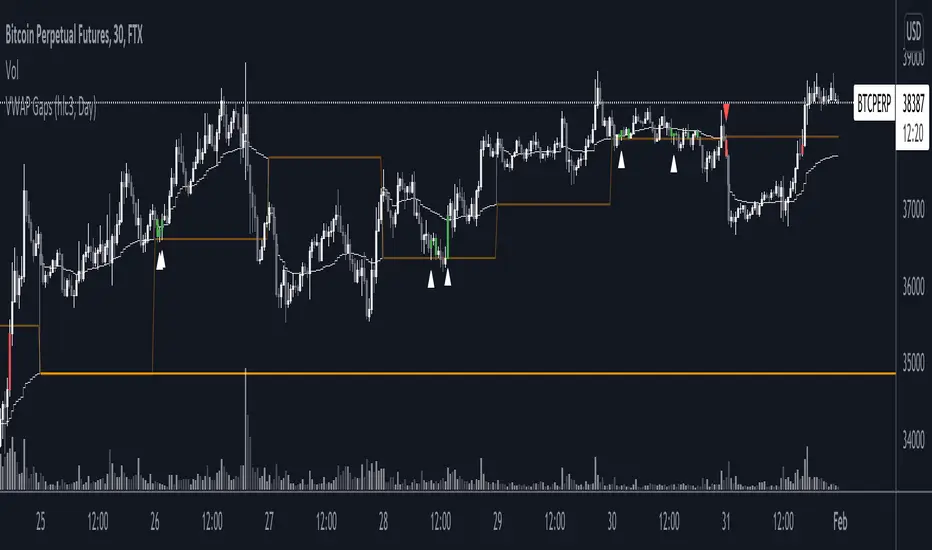
VWAP GapsTheory of untested previous VWAPs acting in similar way to nPOC, where agreed previous 'value' based on volume acts as a liquidity area to be retested.
Indicator shows
- User selected VWAP
- Untested previous VWAPs. The line will disappear once price crosses it's value
- Sweeps of previous VWAPs. Show by both bar colours and plotted arrows under different conditions.
Sweep Filters
1. Bull or Bear Bar (required for an arrow plot)
2. Sweep Conditions i.e. open below line, high above line, and close below line
3. If current VWAP is below/above the previous VWAP value.