NDOG & NWOG - Liquidity + Sunday Box rroielDescription:
This script combines NDOG & NWOG liquidity levels with a Sunday Box framework to provide traders with structured levels for weekly bias, liquidity mapping, and potential entry/exit zones.
Features:
• Automatic plotting of NDOG & NWOG liquidity zones.
• Sunday Box (weekly open range) drawn to define structure and bias.
• Highlights liquidity sweeps and retests for trade confirmation.
• Configurable settings for box time, liquidity range, and display options.
• Built to support ROI/EL strategies by aligning liquidity with weekly key levels.
Use Case:
Helps traders identify where price is likely to react by combining liquidity-based zones with the Sunday box framework. Designed for clarity, confluence, and efficiency in execution.
Search in scripts for "sweep"

Futures Key LevelsKey Levels — Sessions, Previous Ranges & Opens (Chicago-aligned sessions)
What it does
This indicator plots commonly used reference levels across multiple timeframes to help you frame the day and find confluence:
Sessions (Chicago TZ): London, New York, and Asia session high/low ranges.
Previous Period Ranges: Previous Day / Week / Month / Quarter / Year High/Low and optional Mid.
Opens: Current Daily / Weekly / Monthly / Quarterly / Yearly opens.
Intraday (4H): Previous 4-Hour High/Low + optional Mid.
Monday Range: Captures Monday’s High/Low (and optional Mid) to use as a weekly reference.
Price-scale markers: Optional markers that track key levels on the price scale without adding extra lines.
How it works (concepts & calculations)
Higher-timeframe values are retrieved using request.security() and update when a new period begins (e.g., previous day’s H/L become fixed at the start of the new day).
Session ranges are built from bar data within session windows using time(session, "America/Chicago"):
London: 02:00–05:00 CT
New York: 08:30–15:00 CT
Asia: 20:00–00:00 CT
“Mid” levels are simple midpoints between each period’s High and Low.
Merge Levels: when different levels land at the same price, their labels are merged to reduce clutter (e.g., “PDH / PWH”).
Why this version is useful / original bits
All-white baseline for clean charts; session colors stand out by design: London = Yellow, New York = Aquatic Blue, Asia = Red.
Right-anchored mode lets you park levels to the right side of the chart with a configurable anchor distance.
Label merging keeps the display minimal when multiple levels coincide.
Price-scale-only markers available when you prefer fewer lines on the chart.
Inputs & customization
Display Style: Standard or Right Anchored (+ distance controls).
Levels toggles: enable/disable each period (Daily/Weekly/Monthly/Quarterly/Yearly), Monday range, 4H range, and session ranges.
Text: optional shorthand labels (e.g., PDH/PDL, PWH/PWL).
Colors: global white theme, with session highlights; you can override in the Inputs.
Price-scale markers: on/off toggle.
How to use it
Use previous High/Low as liquidity pools and areas to watch for sweeps, breaks, or retests.
The Monday range often frames the rest of the week; breaks or rejections around Monday H/L can be informative.
The 4H previous range gives intraday context—great for mean-reversion vs. continuation reads.
Session ranges help you see where the active session expanded price and where liquidity may remain.
Notes & limitations
Sessions are computed in America/Chicago; higher-TF levels use the symbol’s exchange timezone.
This is an indicator, not a strategy; it does not place trades or claim performance.
Always combine levels with your own execution rules (structure, momentum, risk).
Credit: inspired by spacemanBTC; this version adds the all-white styling, Chicago-aligned sessions, right-anchoring, label merging, and price-scale markers.
Also my mentor to tell me about the levels
Disclaimer
This tool is for educational purposes only and is not financial advice. Markets involve risk; do your own research and manage risk appropriately.

STOCK SCHOOL | FVGThe Stock School FVG Indicator is designed to help traders identify and trade Fair Value Gaps (FVGs) and Inverse FVGs (IFVGs) with precision.
Built for both intraday and swing traders, this tool highlights high-probability trading zones where institutions leave imbalances in the market.
✨ Key Features:
Auto-detects FVGs & IFVGs in real-time
Works on all timeframes and instruments (Nifty, BankNifty, Stocks, Forex, Crypto)
Non-repainting logic for reliable signals
Clean and easy-to-use interface with Stock School styling
Perfect for Smart Money Concept (SMC) traders
🚀 With this indicator, you can:
Spot institutional footprints quickly
Combine with BOS, CHoCH, Order Blocks for high accuracy
Trade liquidity sweeps + FVG collisions with confidence
💡 Disclaimer:
This indicator is for educational purposes only. Trading involves risk. Always use proper risk management.

AMD [TakingProphets]Overview
The AMD indicator is a real-time, high-resolution tool designed for traders following ICT methodology who want a clear visualization of higher timeframe (HTF) candles directly on their lower timeframe charts.
It overlays current HTF structure, including open, high, low, and close projections, allowing traders to align intraday decisions with institutional price delivery — all without switching timeframes.
Concept & Background
In ICT concepts, market behavior often follows a pattern of accumulation, manipulation, and distribution. Understanding these phases is essential for anticipating when price is likely to expand or reverse.
AMD automates this process by:
-Overlaying HTF candles directly on your lower timeframe chart.
-Projecting live levels like the current open, high, low, and close to map out evolving bias.
-Helping traders see whether price is accumulating orders, engineering liquidity sweeps, or distributing aggressively.
Key Features
Live HTF Candle Overlay
-Displays the full HTF candle — body, wicks, and directional bias — on your active chart in real time.
-Perfect for traders aligning intraday setups with broader HTF context.
Dynamic HTF Price Projections
-Plots the evolving open, high, low, and close for the current HTF candle.
-Each projection can be customized by color, style, labels, and visibility to fit your workflow.
Full Customization Control
-Adjust candle body widths, wick styles, and transparency.
-Configure projection lines and time labels in both 12h and 24h formats.
-Includes an optional Info Box showing instrument, timeframe, and session context.
Session Timing & Labeling
-Smart timestamping marks the start and close of each HTF candle.
-Helps traders anticipate potential expansions or reversals during killzones or liquidity events.
How to Use It
Select Your HTF Context
-Choose any timeframe overlay (e.g., 1H, 4H, 1D) to match your trading model.
-Monitor Live HTF Levels
-Watch how price interacts with current HTF highs, lows, and equilibrium levels in real time.
-Integrate With ICT Concepts
-Use alongside tools like SMT divergence, Order Blocks, or Liquidity Levels for confirmation and context.
-Refine Intraday Entries
-Check whether price is expanding in your favor before entering positions.
Best Practices
Combine AMD with ICT killzone sessions to monitor HTF behavior during high-liquidity periods.
Use it alongside correlated SMT divergence tools for stronger directional bias confirmation.
Who It’s For
Scalpers anchoring quick entries to HTF sentiment.
Intraday traders syncing 5m/15m setups with 1H/4H context.
Swing traders monitoring HTF ranges without switching charts.
Educators & analysts needing clean visual overlays for teaching and content creation.
Why It’s Useful
AMD doesn’t provide trading signals or predictive guarantees. Instead, it offers a clean, structured view of HTF price delivery — enabling traders to understand institutional intent as it unfolds and manage their execution with greater confidence.

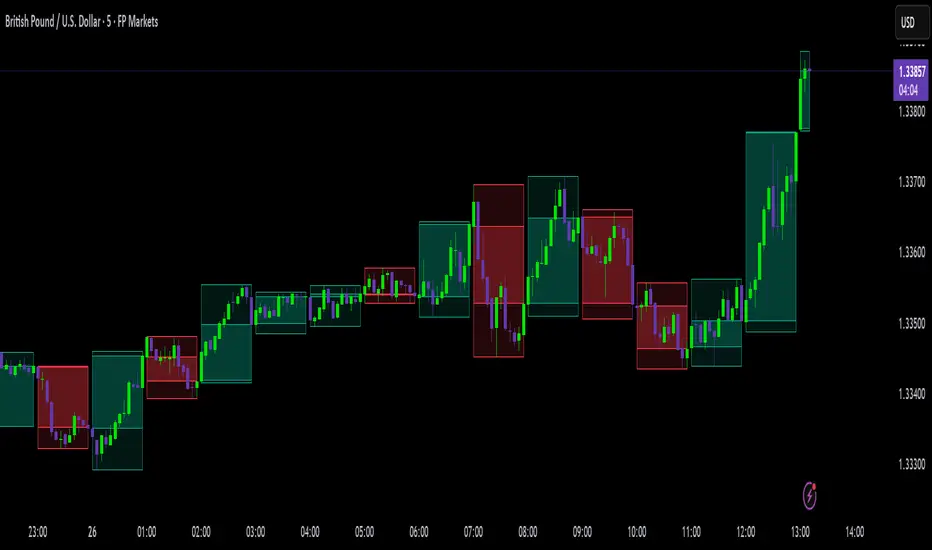
B A N K $ - HTF Candle Boxes (Power of 3)This indicator allows you to visualise the HTF candles on the LTF's, this is useful for using the Power of 3 / Accumulation, Manipulation & Distribution concepts.
By default, the HTF interval is set to 1h, this means that an outline will be created around the LTF candles that are within that 1h window. (i.e from 13:00-14:00 etc).
Features
HTF Interval Selector - this allows the user to customise which HTF interval to use
Candle Boxes - this outlines the full outer perimeter of the relevant candles
Include Body - this highlights the distance between the candle Open & Close
Show MidLine
Additional Settings
Hide Side Lines - this will only draw the Top & Bottom lines
Extend Lines to Current Candle - most recent Top & Bottom lines will extend to current price
Draw Lines from Exact Candle - this makes the most recent candle lines cleaner
I personally use this indicator to outline the most recent 3 1h candles to make it easier to identify sweeps & reversals however there is additional functionality to allow the user to customise the indicator to their preference.
Balanced Big Wicks (50/50) HighlighterThis open-source indicator highlights candles with balanced long wicks (50/50 style)—that is, candles where both upper and lower shadows are each at least 30–60% of the full range and within ~8% of each other, while retaining a substantial body. This specific structure often reflects indecision or liquidity sweeps and can precede strong breakout moves.
How It Works (Inputs and Logic)
Min wick % (each side): 30–60% of candle range
Max body %: up to 60% of range (preserves strong body presence)
Equality tolerance: wicks within 8% of each other
ATR filter (multiples of ATR14): ensures only significant-range candles are flagged
When a “50/50” candle forms, it’s visually colored and labeled; audibly alertable.
How to Use It
Long setup: price closes above the wick-high → potential long entry (SL below wick-low, TP = 1:1).
Short setup: price closes below wick-low → potential short entry (SL above wick-high, TP = 1:1).
Especially effective on 5–15 minute scalping charts when aligned with high-volume sessions or HTF trend context.
Why This Indicator Is Unique
Unlike standard wick or doji voters, this script specifically filters for candles with a strong body and symmetrical wicks, paired with a range filter, reducing noise significantly.
Important Notes
No unrealistic claims: backtested setups indicate high occurrence of clean breakouts, though performance depends on market structure.
Script built responsibly: uses real-time calculations only, no future-data lookahead.
Visuals on the published chart reflect default input values exactly.

VWAP Confluência 3x VWAP Confluence 3x — Daily · Weekly · Anchored
Purpose
A pragmatic VWAP suite for execution and risk management. It plots three institutional reference lines: Daily VWAP, Weekly VWAP, and an Anchored VWAP (AVWAP) starting from a user-defined event (news, earnings, session open, swing high/low).
Why it matters
VWAP is the market’s “fair price” weighted by where volume actually traded. Confluence across timeframes and events turns noisy charts into actionable bias and clean levels.
What it does
Daily VWAP — resets each trading day; intraday “fair value.”
Weekly VWAP — resets each week; swing context and larger player defense.
Anchored VWAP — starts at a precise timestamp you set (e.g., news release).
Price source toggle — Typical Price
(
𝐻
+
𝐿
+
𝐶
)
/
3
(H+L+C)/3 or Close.
Visibility switches — enable/disable each line independently.
Anchor marker — labels the first bar of the AVWAP.
Inputs
Show Daily VWAP (on/off)
Show Weekly VWAP (on/off)
Show Anchored VWAP (on/off)
Price Source: Typical (H+L+C)/3 or Close
Anchor Time: timestamp of your event (uses the chart/exchange timezone)
How to anchor to a news event
Find the exact release time as shown in your chart’s timezone.
Open the indicator settings → set Anchor Time to that minute.
The AVWAP begins at that bar and accumulates forward.
Playbook (examples, not signals)
Strong long bias: price above Daily and Weekly VWAP; AVWAP reclaimed after news.
Strong short bias: price below Daily and Weekly; AVWAP reject after news.
Mean-revert zones: price stretches far from the active VWAPs and snaps back; size around VWAP with tight risk.
Targets: opposite VWAP, prior day/week highs/lows, or liquidity pools near AVWAP.
Best used with
Session highs/lows, liquidity sweeps, volume profile, and time-of-day filters.
Notes & limitations
Works best on markets with reliable volume (equities, futures, liquid crypto). FX spot uses synthetic volume—interpret accordingly.
Anchor Time respects the chart’s timezone. Convert news times before setting.
This is an indicator, not a backtestable strategy. No trade advice.
Disclaimer
For educational purposes only. Trading involves risk. Do your own research and manage risk responsibly.

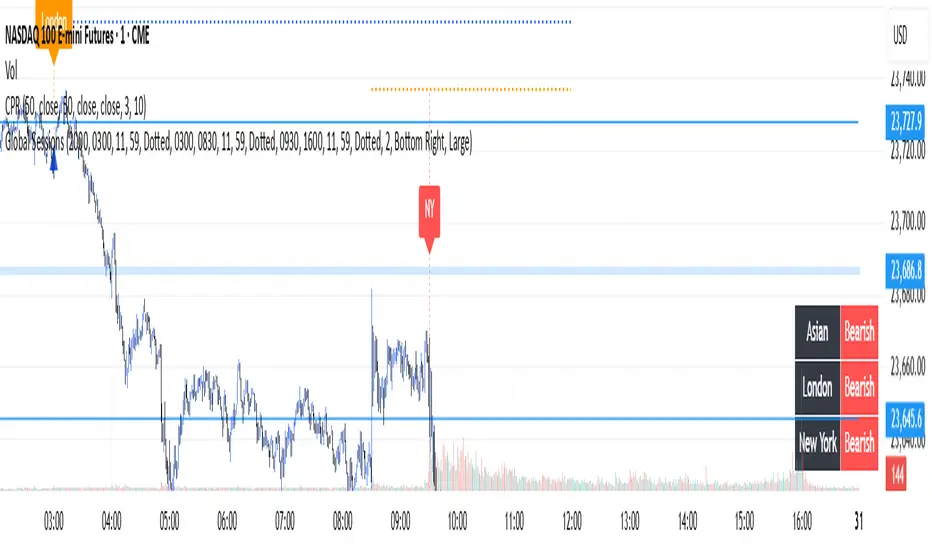
Global Sessions with Trend & Liquidity Features:
-Session ranges with customizable lines & colors
-Opening range markers and optional background shading
-Automatic trend detection per session (Bullish / Bearish / Neutral)
-Indicators when highs/lows are broken
-Clean visual design with toggles for minimal or detailed display
This Pine Script code is designed to help traders visualize and analyze different market sessions. It's a tool that displays the trading hours for the Asian, London, and New York sessions right on the chart.
The main purpose is to show when these key markets are open and to highlight their price ranges. It also includes features to track the trend within each session and to identify "liquidity sweeps" or moments when the price breaks the high or low of a previous session.
In simple terms, it helps a trader see what the market is doing and where the price is likely to go, all based on the major global trading times. It's especially useful for day traders who want to align their strategies with the activity of specific markets.
P.S. Apologies to users not in the EST timezone! This version is hardcoded to Eastern Standard Time, and I'm not currently sure how to automatically adjust it for different timezones. But you can adjust manually and click the dropdown menu to Save As Default.
Same-Direction Candles (Two Symbols)Same-Direction Candles (Two Symbols)
What it does
Highlights bars on your chart when two symbols print the same candle direction on the chosen timeframe:
Both Bullish → one color
Both Bearish → another color
Great for spotting synchronous moves (e.g., NQ & ES, QQQ & SPY), or confirming risk-on/risk-off with an inverse asset (e.g., NQ vs DXY with inversion).
How it works
For each bar, the script checks whether close > open (bullish), close < open (bearish), or equal (doji) for:
The chart’s symbol
A second symbol pulled via request.security() (optionally on a different timeframe)
If both symbols are bullish, it paints Bull color; if both are bearish, it paints Bear color. Dojis can be ignored.
Inputs
Second symbol: Ticker to compare (e.g., CME_MINI:ES1!, NASDAQ:QQQ, TVC:DXY).
Second symbol timeframe: Leave blank to use the chart’s TF, or set a specific one (e.g., 5, 15, D).
Invert second symbol direction?: Flips the second symbol’s candle direction (useful for inversely related assets like DXY vs indices).
Ignore doji candles: Skip highlights when either candle is neutral (open == close).
Coloring options: Toggle bar coloring and/or background shading; pick colors; set background transparency.
Alerts
Three alert conditions:
Both Bullish
Both Bearish
Both Same Direction (bullish or bearish)
Create alerts from the Add Alert dialog after adding the script.
Use cases
Index confluence: NQ & ES moving in lockstep
ETF confirmation: QQQ & SPY agreement
FX/Index risk signals: Invert DXY against NQ/ES to see when equity strength aligns with dollar weakness
Tips
For mixed timeframes (e.g., chart on 1m, ES on 5m), set Second symbol timeframe to the higher TF to reduce noise.
Keep Ignore dojis on for cleaner signals.
Combine with your own entry rules (structure, FVGs, liquidity sweeps).
Notes
Works on any symbol/timeframe supported by TradingView.
Overlay script; no strategy/entries/exits are executed.
Past performance ≠ future results; for education only.
Version: 1.0 – initial release (bar/background highlights, doji filter, inversion, multi-TF support, alerts).

Lumiere’s Indicator BundleThe Lumiere’s Indicator Bundle combines three of Lumiere’s most used tools into one script:
🔹 BOS Mark-out – Marks Breaks of Structure with clear bullish/bearish levels and optional alerts.
🔹 Liquidity Mark-ou t – Draws significant swing highs/lows and automatically removes them once swept.
🔹 Trading Session High/Low – Tracks Asia, London, and New York session ranges with customizable timezone.
Why this bundle?
I made this bundle so everyone can run all my indicators at once without having to pick and choose between them or worry about chart space limits.
Instead of loading 3 separate indicators, this package gives you everything in one place. You can toggle each module (BOS, Liquidity, Sessions) on or off from the settings. All inputs are kept clean and organized in their own sections for easy adjustments.
What to expect
BOS lines always plotted on top for maximum clarity.
Liquidity highs/lows update in real time and get removed when taken out.
Session ranges show the active session’s high/low and can mark sweeps after the session closes.
Default timezone is New York (UTC-4), but you can switch to any TradingView-supported timezone.
BOS alerts are included, so you’ll never miss a structural break.

Previous Candle High/Low (Global Rays)Previous Candle High/Low (Global Rays, Corrected)
This indicator tracks the high and low of the most recently closed candle and projects them forward as global horizontal rays.
Features:
✅ Automatically updates the levels once a candle fully closes.
✅ Draws persistent lines at the previous candle’s high (green) and low (red), extending them into the future.
✅ Highlights real-time breakouts:
✅ Includes built-in alert conditions for both breakout events.
How to Use:
Use the levels as reference points for breakout trades, liquidity sweeps, or stop hunts.
Alerts can help you catch moves without needing to constantly watch the chart.
Works on any timeframe and symbol.
High Timeframe Candle Overlay (Configurable)HTF Candle Overlay — Read Higher Timeframe on Lower Timeframe Charts
What it does
This indicator draws each selected Higher-Timeframe (HTF) candle directly on your lower-timeframe (LTF) chart. It shows a translucent range box (HTF high–low) and an inner body box (HTF open–close), so you can track how the bigger candle is forming while you analyze lower-timeframe structure, liquidity sweeps, and intrabar reactions.
Why it’s helpful
• See where the current HTF candle opened, where price sits inside its body, and how far wicks extend—without leaving your LTF chart.
• Combine HTF context (e.g., 1H/4H) with LTF execution (e.g., 1m–15m) to spot confluence, S/R flips, and failed breaks faster.
• The overlay is locked to the price scale and anchored by bar index, so it pans/zooms exactly with your chart (no drifting while dragging).
⸻
How it works (under the hood)
• Fetches HTF OHLC via request.security.
• When a new HTF bar starts, the previous HTF boxes are frozen at the true close.
• The current HTF bar updates intrabar (so you see live formation) and is clamped to the correct span.
• Horizontal anchoring uses bar index, and a hidden price plot binds the script to the main price scale for stable zoom/pan behavior.
⸻
Inputs
• High Timeframe (HTF): Default 1H (set any TF you like).
• Show High–Low Box: On/off.
• Show Body Box (Open–Close): On/off.
• Opacity for range/body boxes.
• Bull/Bear Colors and Outline + Width.
• Max HTF Candles to Keep: Auto-deletes older boxes to maintain performance.
⸻
Usage tips
• Popular combos: view 1H or 4H candles while trading 1–15m charts.
• Turn off the range box if you only want a clean HTF body overlay.
• Pair with your session/structure tools; this indicator is visual context only (no signals or alerts).
⸻
Notes & limitations
• Non-repainting for closed HTF bars: once an HTF candle closes, its boxes are fixed. The current/in-progress HTF bar updates until it closes (expected live behavior).
• Data alignment depends on your symbol’s feed and session settings. Heikin Ashi/renko/etc. may not match classic OHLC.
• Heavy history + many boxes can affect performance; reduce “Max HTF Candles to Keep” if needed.
⸻
Disclaimer
This script is for education and charting visualization only. It does not provide financial advice, trade signals, or performance guarantees. Always do your own research and manage risk.
ORB & Sessions [Capitalize Labs]ORB & Sessions Indicator
The ORB & Sessions Indicator provides a structured way to analyze intraday price action by combining two well-established concepts: global trading sessions and Opening Range Breakouts (ORB). It is designed to help traders identify where liquidity forms, when volatility expands, and how price behaves around key session and range levels.
Market Sessions Framework
Displays New York, London, and Asian sessions directly on the chart.
Each session can be shown as a highlighted background zone, or with extended highs and lows for liquidity tracking.
Session highs and lows remain projected forward after the session ends, allowing traders to monitor sweeps, retests, and reactions throughout the day.
Session times are fully customizable and can be aligned with the trader’s own timezone or broker feed.
This structure helps traders place price action into context, whether during quiet Asian trading, London-driven volatility, or New York reversals.
Opening Range Breakouts (ORB)
Supports three independent ORBs, each with configurable session times.
During the defined ORB window, the indicator captures the high and low of the range and plots a live updating box.
Once the ORB closes, the range locks and projects breakout targets (T1 and T2) based on user-defined risk-to-reward multiples.
Alerts are included for breakouts of highs, lows, or target levels.
Traders can use a single ORB or multiple—for example, tracking an Asian ORB into London, or London into New York.
Visualization and Clarity
Color-coded boxes and levels for sessions and ORBs.
Labels such as “Range High” and “Range Low” ensure clarity without clutter.
Flexible display settings allow highlighting full zones, just lines, or minimal markers depending on preference.
Practical Applications
This indicator is useful for:
Liquidity and volatility analysis: Observe where session highs and lows form and how they influence later trading.
Breakout and reversal strategies: Use ORB ranges to define risk and plan target projections.
Time-based research: Explore how different session overlaps or ORBs affect markets like indices, FX, and commodities.
Risk planning: Built-in R-multiple targets provide a consistent framework for evaluating setups.
Why It’s Different
Instead of showing sessions and ORBs separately, this indicator integrates them into one framework. Traders can:
See when and where sessions open and establish range levels.
Define precise ORBs with customizable timing.
Track breakout levels and targets in real time with alerts.
The result is a clear, time-structured view of the trading day, helping traders align setups with session dynamics and opening range behavior.
This indicator does not generate buy or sell signals. It is an analytical and visualization tool, providing structure for traders to better interpret intraday price action.

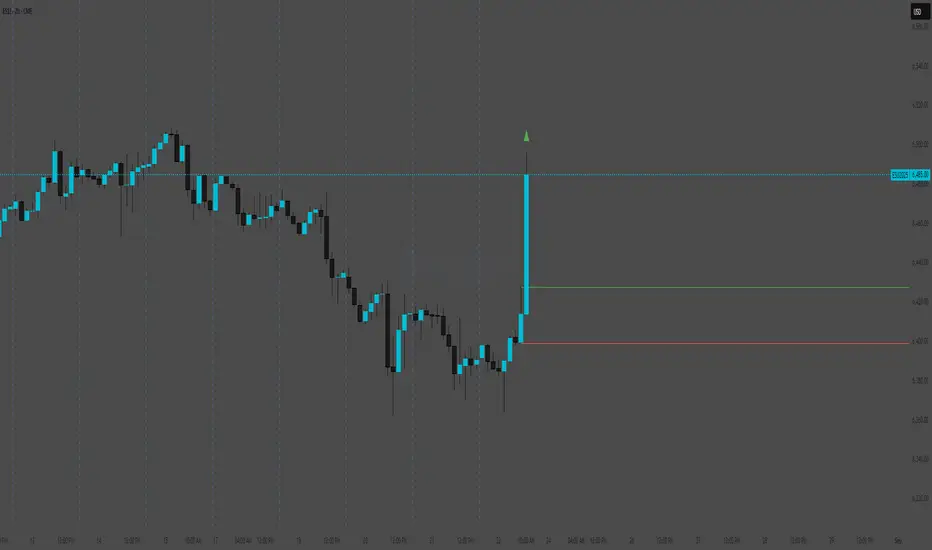
Smart Wick AnalyzerSmart Wick Analyzer (SWA)
Purpose: Highlight potential liquidity‑grab candles (long wicks) and turn them into actionable, rule‑based buy/sell signals with trend, volume, and cooldown filters.
Type: Indicator (not a strategy). Educational tool to contextualize wick events.
🧠 What This Script Does
SWA looks for candles where the wick is large relative to its body—a common signature of liquidity sweeps / rejection. It then adds three confirmations before marking a trade signal:
1. Wick Event
• Upper‑wick event (possible rejection from above)
• Lower‑wick event (possible rejection from below)
• Condition: wick length > body × Wick‑to‑Body Ratio
2. Context Filters
• Trend filter : closing price vs. SMA of lookbackBars
• Volume filter : current volume vs. average volume × volumeThreshold
3. Signal Hygiene
• Cooldown : prevents clustering; a minimum number of bars must pass before a new signal is allowed.
If a candle passes these checks:
• Buy Signal (triangle up): long lower wick + price above SMA + relative‑high volume + cooldown passed
• Sell Signal (triangle down): long upper wick + price below SMA + relative‑high volume + cooldown passed
The signal candle is also bar‑colored black for quick visual focus.
⸻
✳️ What the Dotted Lines Mean (including the green one)
On every signal bar the script draws two dotted horizontal levels, extended to the right:
• Open line of the signal candle
• Close line of the signal candle
• They use the signal color: green for Buy, red for Sell.
How to interpret (example: green = Buy signal):
• The green dotted close line represents the momentum validation level. If subsequent candles close above this line, it indicates follow‑through after the wick rejection (buyers defended into the close).
• The green dotted open line is a risk context / invalidation reference. If price falls back below it soon after the signal, the wick event may have failed or devolved into chop.
In your annotated chart: the candle initially looked constructive (“closing above could be positive momentum”), but later price failed and rotated down—hence a sell signal interpreted when an upper‑wick event occurred under down‑trend conditions.
⸻
⚙️ Inputs & What They Control
• Wick‑to‑Body Ratio (wickThreshold): how “extreme” a wick must be to count as a liquidity‑grab.
• Lookback Period (lookbackBars):
• SMA period for trend context
• Volume MA for relative‑volume check
• Volume Multiplier (volumeThreshold): strengthens/loosens volume confirmation.
• Cooldown Bars (cooldownBars): minimum spacing between consecutive signals.
• Enable Alerts (showAlerts): turns on alert conditions.
⸻
🔔 Alerts (exact titles)
• “SWA Buy Alert” — potential reversal / Buy signal detected
• “SWA Sell Alert” — potential reversal / Sell signal detected
⸻
📌 How to Use (practical guide)
1. Scan for the black‑colored signal candle and its dotted lines.
2. For Buy signals (green): Prefer continuation if price closes above the green close line within the next few bars. Manage risk using the open line or your own level.
3. For Sell signals (red): Prefer continuation if price closes below the red close line.
4. Avoid chasing during low‑volume / counter‑trend signals; the filters help, but structure (HTF trend, S/R, session context) still matters.
5. Use the cooldown to reduce noise on fast time frames.
⸻
✅ Why This Isn’t Just “Another Wick Indicator”
• The script does not flag every long‑wick; it requires trend alignment and relative volume to suggest participation.
• The two reference lines (open/close) provide post‑signal state tracking—a simple, visual framework to judge follow‑through vs. failure without additional tools.
• Cooldown logic discourages clustered, low‑quality repeats around the same zone.
⸻
⚠️ Notes & Limitations
• Works across markets/time frames, but wick behavior varies by instrument and session. Parameters may need adjustment.
• Signals are contextual, not guarantees. Consolidation and news spikes can invalidate wick reads.
• This indicator is not a strategy; it does not backtest performance on its own.
⸻
📄 Disclaimer
This tool is for educational purposes only and should be combined with personal analysis and risk management. Markets are uncertain; past behavior does not guarantee future results.

ATR x2 AUTODescription:
This indicator automatically plots ATR-based horizontal levels for each of the most recent candles, helping traders visualize potential stop-loss hunting zones, breakout areas, or price reaction points.
It works by taking the Average True Range (ATR) over a customizable period and multiplying it by a user-defined factor (default: ×2). For each of the last N candles (default: 5), it calculates and draws:
Below green candles (bullish) → A horizontal line placed ATR × multiplier below the candle’s low.
Above red candles (bearish) → A horizontal line placed ATR × multiplier above the candle’s high.
Doji candles → No line is drawn.
Each line extends to the right indefinitely, allowing traders to monitor how price reacts when returning to these ATR-based levels. This makes the tool useful for:
Identifying likely stop-loss clusters below bullish candles or above bearish candles.
Anticipating liquidity sweeps and fakeouts.
Supporting breakout or reversal strategies.
Key Features:
Customizable ATR length, multiplier, number of recent candles, and line thickness.
Separate colors for bullish and bearish candle levels.
Automatic real-time updates for each new bar.
Clean overlay on the main price chart.
Inputs:
ATR Length → Period used for ATR calculation.
Multiplier → Factor applied to the ATR distance.
Number of Candles → How many recent candles to track.
Line Thickness and Colors → Full visual customization.
Usage Tip:
These levels can be combined with key market structure points such as support/resistance, trendlines, or the 200 EMA to anticipate high-probability price reactions.

Liquidity Grab Entry Signals [Daily Enhanced]Liquidity Grab Entry Signals is a powerful tool designed to detect intraday reversal opportunities around daily high/low liquidity zones.
Core features: – Plots current daily high/low levels
– Identifies price interaction with these key zones
– Confirms rejection via strong engulfing candles
– Plots real-time long/short entry signals directly on chart
– Includes alerts for both long and short setups
This script is ideal for scalpers and intraday traders looking to exploit stop hunts, liquidity sweeps, and false breakouts.
Optimized for instruments like US30, NAS100, Gold, BTC and more.
Customize the sensitivity buffer to suit your asset and timeframe.
Use this in combination with VWAP, FVG or Smart Money concepts for enhanced confirmation.
---
Built for: 1s–15m charts
Includes: Alerts + Custom Settings
Type: Non-repainting
Trade with clarity around the most manipulated price levels of the day.

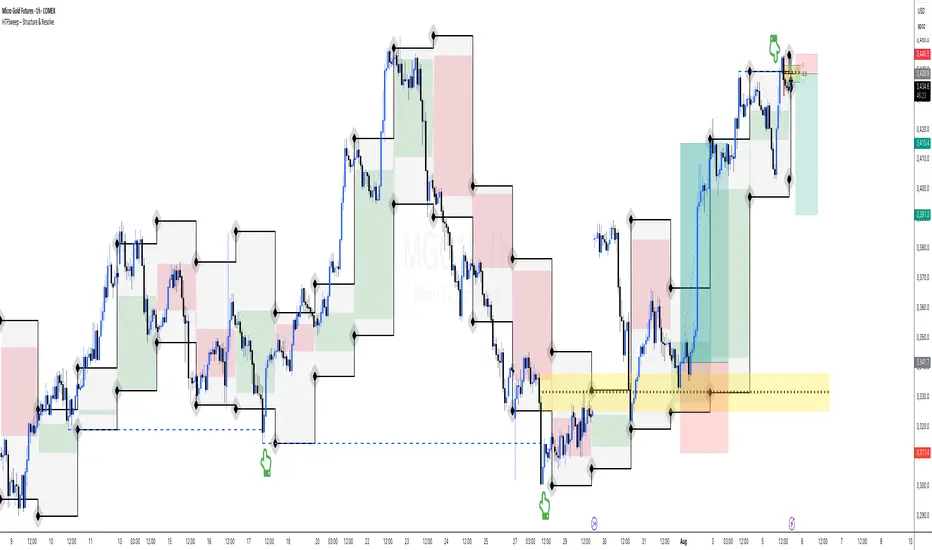
HTFSweep – Structure & ResolveThis indicator isolates higher timeframe Open, High, Low, and Close levels and projects them onto lower timeframes.
It is designed as a structural lens, not a trading signal — a tool for experienced operators who study how intraday price interacts with higher‑timeframe liquidity anchors.
Key Features:
Selectable higher timeframe (default: Daily).
Plots Open, High, Low, Close lines across intraday charts.
Bullish/Bearish candle bodies shaded for context.
Background fill between High and Low for zone visualization.
Purpose:
This script is not a “buy/sell” tool. It is a scope, intentionally minimal, highlighting a repeating place of structural and liquidity significance. Use it to track sweeps of higher‑timeframe levels and confirm structural shifts intraday.
⚠️ Disclaimer: This script provides market structure visualization only. It does not generate trading signals or financial advice.
COMEX_MINI:MGC1!
AymaN Entry Signal – With HTF + Pin Bar + Multi TP + BE + V1Ayman Entry Signal – Indicator Description
Overview
Ayman Entry Signal – With HTF + Pin Bar + Multi TP + BE + Stats Panel (V1)
This is a professional-grade Pine Script indicator designed for scalping and intraday trading, with full trade management, multi-confirmation logic, and advanced visualization. The tool is ideal for traders focused on XAUUSD (Gold), Forex, and other volatile instruments who seek both precision entries and structured exits with dynamic risk control.
Main Features
Advanced Entry Logic:
- EMA fast/slow crossovers (configurable)
- Optional conditions: Break of Structure (BoS), Order Block (OB), Fair Value Gap (FVG), Liquidity sweeps, Pin Bars
- HTF confirmation using EMA or BoS
- Real-time entry condition display
Trade Management:
- Dynamic calculation of Entry, SL (with ATR buffer), TP1, TP2
- Supports Partial Close and Break Even logic after TP1
- Visual PnL label (dynamic and color-coded)
Statistics Panel:
- Shows total trades, win/loss/breakeven count, cumulative PnL
- Filter by custom date or session
- Fully customizable panel appearance
Trade Visualization:
- Trade box includes all trade levels (Entry, SL, TP1, TP2)
- Visual display of trade conditions and PnL result
- Option to keep previous trades on chart
Alert System:
- Alerts for Buy and Sell entries
- Compatible with webhook automation systems like MT5/MT4
Customization & Inputs
- Capital & risk per trade
- Value per pip/point
- SL buffer (ATR-based)
- Manual EMA override
- Enable/disable: EMA, BoS, OB, FVG, Liquidity, Pin Bars
- HTF: timeframe + confirmation logic
- Trade box/labels visibility
- Full color customization
- PnL label position: top, center, or bottom
Recommended Use
- Ideal for Gold scalping (XAUUSD), also effective for Forex
- Best on 1m–15m charts; use HTF confirmation from 15m–4H
- Pairs well with semi-automated systems using alerts and webhooks
Disclaimer
Note: This is a non-executing indicator. It does not place trades but provides visual and statistical guidance for professional manual or semi-automated trading.

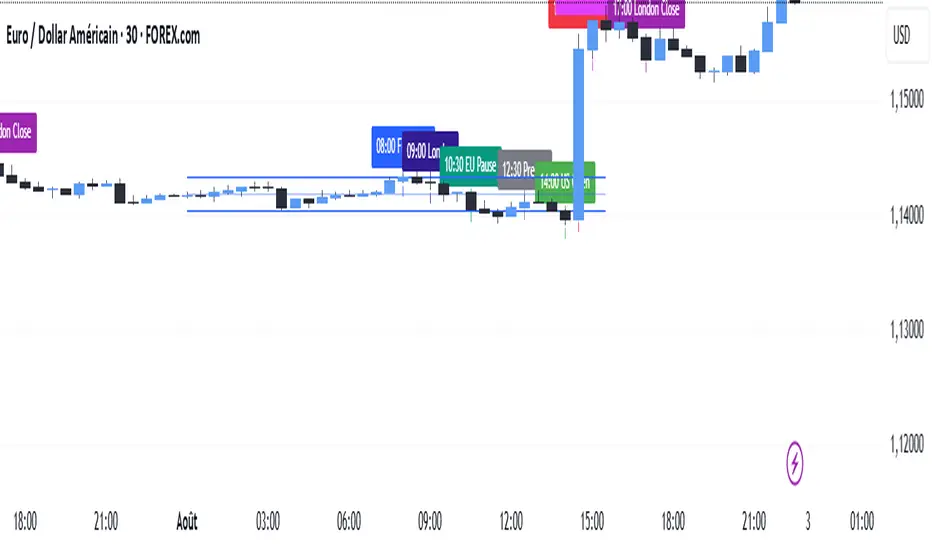
SMC TimingThis indicator (“SMC Timing”) visually marks the exact moments when the market typically experiences large liquidity injections—moments that often trigger strong directional moves. By plotting dashed vertical lines and labels at key session boundaries and news events (Frankfurt open, London open, EU mid-session pause, Pre-US, US open, 14:30 U.S. news releases, 15:00 breakout window, and the London close), it draws your attention to the times when stop-runs and institutional orders tend to pile into the market.
Traders can use these timing zones to:
Anticipate liquidity sweeps where smart-money often liquidates weak positions or hunts stops.
Plan higher-probability entries just before or directly after these injections, reducing slippage and improving execution.
Improve win-rate consistency by aligning your trades with the natural ebb and flow of institutional flow rather than fading it.
With customizable session toggles, a “today-only” filter, and a small vertical offset to keep markers clear of price bars, this tool seamlessly integrates into any chart. Positioning yourself around these highlighted times helps you capture the bulk of intraday moves and avoids getting caught in low-liquidity chop.
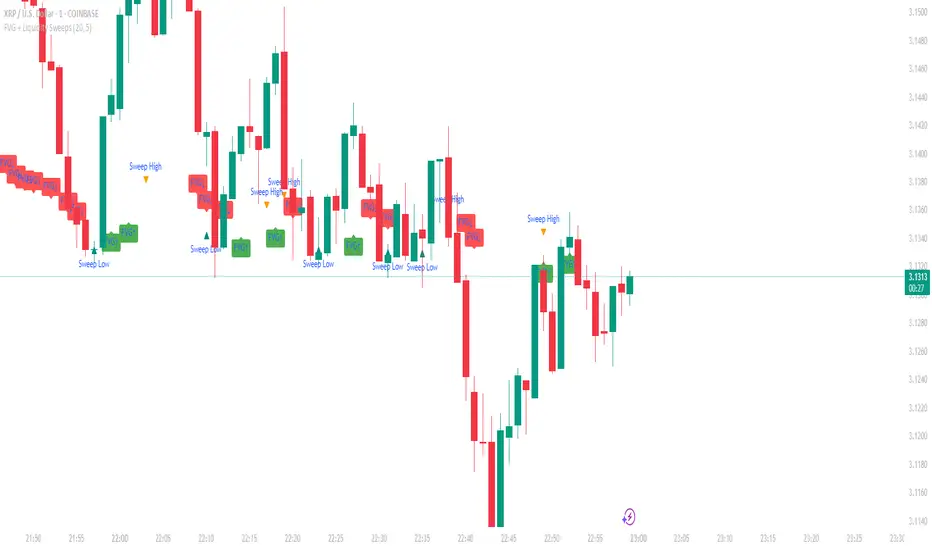
NativeLenSA CISD w/1st 5m FVG5m CISD + FVG Indicator which works best on 5m TimeFrame, with the concept of 5m Liquidity sweeps of the previous highs/lows and the next candle closing below/above the opening price of candle that swept the highs/lows.
A line marking +CISD or -CISD will show as soon as the CISD is created, and a first 5m Fair Value Gap will also be displayed. This is advantageous for an extra confluence and re-entry.
The indicator also provides the trader with:
i. The flexibility of allowing to only show Bearish, Bullish or both Bearish and Bullish CISD + FVG,
ii. Showing only London Session, New York Session, or both London and New York Sessions' CISD & FVG,
iii. Option of hiding/showing 5m CISD+FVG on time frames greater than 5m,
iv. Adjustable:
(a) Look back bars (max=300),
(b) CISD line length,
(c) FVG line length,
v. Customizable Bearish and Bullish CISD line colors.
I hope you find value in this indicator, and convenient for time when trading, no CISD markups needed

FVG + Liquidity Sweepsthis is a test and i don't know if it is gonna actually work but let me know if it does.
Liquidity Trap Zones [PhenLabs]📊 Liquidity Trap Zones
Version: PineScript™ v6
📌 Description
The goal of the Liquidity Trap Zones indicator is to try and help traders identify areas where market liquidity appears abundant but is actually thin or artificial, helping traders avoid potential fake outs and false breakouts. This advanced indicator analyzes the relationship between price wicks and volume to detect “mirage” zones where large price movements occur on low volume, indicating potential liquidity traps.
By highlighting these deceptive zones on your charts, the indicator helps traders recognize where institutional players might be creating artificial liquidity to trap retail traders. This enables more informed decision-making and better risk management when approaching key price levels.
🚀 Points of Innovation
Mirage Score Algorithm: Proprietary calculation that normalizes wick size relative to volume and average bar size
Dynamic Zone Creation: Automatically generates gradient-filled zones at trap locations with ATR-based sizing
Intelligent Zone Management: Maintains clean charts by limiting displayed zones and auto-updating existing ones
Scale-Invariant Design: Works across all assets and timeframes with intelligent normalization
Real-Time Detection: Identifies trap zones as they form, not after the fact
Volume-Adjusted Analysis: Incorporates tick volume when available for more accurate detection
🔧 Core Components
Mirage Score Calculator: Analyzes the ratio of price wicks to volume, normalized by average bar size
ATR-Based Filter: Ensures only significant price movements are considered for trap zone creation
EMA Smoothing: Reduces noise in the mirage score for clearer signals
Gradient Zone Renderer: Creates visually distinct zones with multiple opacity levels for better visibility
🔥 Key Features
Real-Time Trap Detection: Identifies liquidity mirages as they develop during live trading
Dynamic Zone Sizing: Adjusts zone height based on current market volatility (ATR)
Smart Zone Management: Automatically maintains a clean chart by limiting the number of displayed zones
Customizable Sensitivity: Fine-tune detection parameters for different market conditions
Visual Clarity: Gradient-filled zones with distinct borders for easy identification
Status Line Display: Shows current mirage score and threshold for quick reference
🎨 Visualization
Gradient Trap Zones: Purple gradient boxes with darker centers indicating trap strength
Mirage Score Line: Orange line in status area showing current liquidity quality
Threshold Reference: Gray line showing your configured detection threshold
Extended Zone Display: Zones automatically extend forward as new bars form
📖 Usage Guidelines
Detection Settings
Smoothing Length (EMA) - Default: 10 - Range: 1-50 - Description: Controls responsiveness of mirage score. Lower values make detection more sensitive to recent price action
Mirage Threshold - Default: 5.0 - Range: 0.1-20.0 - Description: Score above this level triggers trap zone creation. Higher values reduce false positives but may miss subtle traps
Filter Settings
ATR Length for Range Filter - Default: 14 - Range: 1-50 - Description: Period for volatility calculation. Standard 14 works well for most timeframes
ATR Multiplier - Default: 1.0 - Range: 0.0-5.0 - Description: Minimum bar range as multiple of ATR. Higher values filter out smaller moves
Display Settings
Zone Height Multiplier - Default: 0.5 - Range: 0.1-2.0 - Description: Controls trap zone height relative to ATR. Adjust for visual preference
Max Trap Zones - Default: 5 - Range: 1-20 - Description: Maximum zones displayed before oldest are removed. Balance clarity vs. history
✅ Best Use Cases
Identifying potential fakeout levels before entering trades
Confirming support/resistance quality by checking for liquidity traps
Avoiding stop-loss placement in trap zones where sweeps are likely
Timing entries after trap zones are cleared
Scalping opportunities when price approaches known trap zones
⚠️ Limitations
Requires volume data - less effective on instruments without reliable volume
May generate false signals during news events or genuine volume spikes
Not a standalone system - combine with price action and other indicators
Zone creation is based on historical data - future price behavior not guaranteed
💡 What Makes This Unique
First indicator to specifically target liquidity mirages using wick-to-volume analysis
Proprietary normalization ensures consistent performance across all markets
Visual gradient design makes trap zones immediately recognizable
Combines multiple volatility and volume metrics for robust detection
🔬 How It Works
1. Wick Analysis: Calculates upper and lower wicks for each bar. Normalizes by average bar size to ensure scale independence
2. Mirage Score Calculation: Divides total wick size by volume to identify thin liquidity. Applies EMA smoothing to reduce noise. Scales result for optimal visibility
3. Zone Creation: Triggers when smoothed score crosses threshold. Creates gradient boxes centered on trap bar. Sizes zones based on current ATR for market-appropriate scaling
💡 Note: Liquidity Trap Zones works best when combined with traditional support/resistance analysis and volume profile indicators. The zones highlight areas of deceptive liquidity but should not be the sole factor in trading decisions. Always use proper risk management and confirm signals with price action.

MP MTF LiquidityMP MTF Liquidity
Multi-Timeframe Liquidity Levels – Automatic High/Low Tracking
This indicator automatically tracks and draws liquidity levels (recent highs and lows) from up to 6 custom timeframes directly on your chart. It’s designed for advanced traders who want to visualize important swing points and liquidity pools across multiple timeframes—ideal for Smart Money Concepts (SMC), ICT, and price action trading.
Key Features:
Multi-Timeframe Support:
Select up to 6 different timeframes (ex: 1H, 4H, Daily, Weekly, etc.), each with separate color and visibility controls.
Real Liquidity (No Repaint):
Levels are only drawn from fully closed bars on each timeframe—no lines from currently forming candles, ensuring accuracy and no forward-looking bias.
Automatic Detection:
Highs and lows are detected automatically. Levels that get swept (price breaks through) are converted to dashed lines for easy visual distinction.
Customizable:
Choose line colors for highs/lows and set the maximum number of active levels per timeframe to keep charts clean.
Extended Lines:
All levels are extended to the right, helping you see how current price interacts with past liquidity.
How It Works:
On every new bar of your chosen higher timeframe(s), the indicator records the high and low of the previous (just-closed) candle.
These levels are extended as rays until price sweeps (crosses) them.
When a level is swept, it is redrawn as a dashed line to highlight liquidity grabs or stop hunts.
No lines are drawn for the “live” bar—only confirmed, closed levels are displayed.
Who is this for?
SMC, ICT, and price action traders seeking high-confidence liquidity zones.
Intraday, swing, and multi-timeframe traders who want an automated, visual edge.
Anyone wanting to avoid repainting or “fake” levels from unfinished candles.
Tip:
Combine this indicator with your favorite order block, fair value gap (FVG), or market structure tools for even greater context and confluence.
Disclaimer:
No indicator guarantees profits. Always use with proper risk management and in conjunction with your trading plan.
