ICT Sweep + FVG Entry (v6) • Antoine📌 ICT Sweep + FVG Entry (Antoine)
This indicator is designed for price action traders who follow ICT concepts and want a mechanical tool to spot liquidity sweeps, fair value gaps (FVGs), and precise entry signals.
🔎 Key Features
Liquidity Pools (HTF)
• Automatically plots recent swing highs/lows from a higher timeframe (5m/15m).
• These act as Buy Side Liquidity (BSL) and Sell Side Liquidity (SSL) levels where stop orders accumulate.
Sweep Detection
• Identifies when price breaks a pool (BSL/SSL) but closes back inside → a classic liquidity grab.
• Plots a triangle on the chart when a sweep is confirmed.
Fair Value Gap (FVG) Highlighting
• Detects bullish and bearish FVGs on the execution timeframe (ideal for 1m).
• Option to display active FVG zones with shaded boxes.
Entry Signals
• A signal (cross) appears when:
A liquidity sweep occurs.
An FVG forms in the direction of the rejection.
Price retests the FVG (entry at the 50% mid-level or edge).
Alerts Ready
• Get alerted for sweeps (bullish/bearish) and for entry confirmations (long/short FVG retests).
🎯 How to Use
Choose your HTF (5m or 15m) → The indicator maps major liquidity pools.
Drop to LTF (1m) → Wait for a sweep signal at one of the pools.
Confirm with FVG → If an FVG appears in the sweep’s direction, the indicator waits for a retest.
Entry → Enter on the retest of the FVG (edge or 50%).
Risk Management
Stop loss: just beyond the sweep’s wick.
Target: opposite liquidity pool.
Minimum recommended R:R: 1:2.
✅ Why this helps
This tool makes it easier to trade ICT-style setups without missing opportunities:
No need to manually draw every swing high/low.
Automatic FVG detection saves time.
Clear sweep + FVG + retest logic keeps your entries mechanical and disciplined.
⚠️ Disclaimer: This script is for educational purposes only. It does not guarantee profits. Always use proper risk management.
Search in scripts for "sweep"

ICT Liquidity Sweep/Swing Fail Pattern V.1# ICT Liquidity Sweep/Swing Fail Pattern V.1
## Indicator Description & User Guide
---
## 📊 Indicator Overview
**Name:** ICT Liquidity Sweep/Swing Fail Pattern V.1
**Type:** Support/Resistance & Liquidity Detection
**Trading Style:** ICT Concepts (Inner Circle Trader)
**Best Timeframes:** 1M, 5M, 15M, 1H
---
## 🎯 Core Features
### 1. **Support & Resistance Lines**
- Automatically draws key swing high and swing low levels
- Based on significant pivot points in price structure
- Updates dynamically as new swings form
### 2. **"X" Mark - Liquidity Sweep**
- **Symbol:** X marker on chart
- **Meaning:** Indicates a liquidity sweep (stop hunt)
- **What it shows:** Price briefly moved beyond a key level to trigger stops, then reversed
- **Trading significance:** High-probability reversal zones after liquidity is taken
### 3. **"SFP" Label - Swing Failure Pattern**
- **Symbol:** SFP text label
- **Meaning:** Swing Failure Pattern detected
- **What it shows:** Price attempted to make a new high/low but failed and reversed sharply
- **Trading significance:** Strong reversal signal - smart money rejecting the level
---
## 📈 How to Use This Indicator
### Entry Setup Strategy:
#### **For SHORT Trades (Sell):**
1. Wait for **SFP** to appear at a swing high
2. Look for **X marker** confirming liquidity sweep above the high
3. **Entry Zone (Red Box):** Enter SHORT positions when price returns to this zone
4. **Stop Loss:** Place above the red zone (above the swept high)
5. **Take Profit (Green Box):** Target the green zone below
#### **For LONG Trades (Buy):**
1. Wait for **SFP** to appear at a swing low
2. Look for **X marker** confirming liquidity sweep below the low
3. **Entry Zone (Green Box):** Enter LONG positions when price returns to this zone
4. **Stop Loss:** Place below the green zone (below the swept low)
5. **Take Profit (Red Box):** Target the red zone above
---
## 🎨 Color Coding System
| Color | Zone Type | Usage |
|-------|-----------|-------|
| 🔴 **Red Box** | Stop Loss / Supply Zone | Place SL here for LONG trades / Entry zone for SHORT trades |
| 🟢 **Green Box** | Take Profit / Demand Zone | Target zone for LONG trades / Place SL here for SHORT trades |
| ❌ **X Mark** | Liquidity Sweep Point | Stop hunt occurred - reversal likely |
| 📝 **SFP Label** | Swing Failure Pattern | Failed breakout - strong reversal signal |
---
## 💡 Trading Examples
### Example 1: SHORT Trade (As shown in your chart)
```
1. SFP appears at swing high (Red zone around 4,000)
2. X marker confirms liquidity sweep above the high
3. Entry: SHORT when price re-enters red zone
4. Stop Loss: Above red zone (e.g., 4,002)
5. Take Profit: Green zone below (3,964-3,972)
6. Risk:Reward = 1:3+
```
### Example 2: LONG Trade
```
1. SFP appears at swing low (Green zone)
2. X marker confirms liquidity sweep below the low
3. Entry: LONG when price re-enters green zone
4. Stop Loss: Below green zone
5. Take Profit: Previous red zone above
6. Risk:Reward = 1:2 minimum
```
---
## ⚠️ Important Trading Rules
### ✅ DO:
- Wait for BOTH SFP and X marker confirmation
- Enter on price returning to the zone (not on first touch)
- Use proper position sizing (1-2% risk per trade)
- Combine with market structure analysis
- Look for confluences (orderblocks, fair value gaps)
### ❌ DON'T:
- Trade against the higher timeframe trend
- Enter without confirmation signals
- Ignore the colored zones for SL/TP placement
- Overtrade - wait for quality setups
- Move stop loss to breakeven too early
---
## 🔧 Indicator Settings (Typical)
**Adjustable Parameters:**
- Swing Length: Number of bars to identify swing points
- Show/Hide X markers
- Show/Hide SFP labels
- Zone opacity and colors
- Line thickness
---
## 📚 ICT Concepts Explained
### **Liquidity Sweep:**
Smart money intentionally pushes price beyond key levels to trigger retail stop losses, then reverses to their intended direction. The X marker identifies these moments.
### **Swing Failure Pattern (SFP):**
Price attempts to make a new high/low but lacks follow-through, indicating weak momentum and likely reversal. Similar to a "false breakout" but more specific to swing structures.
### **Supply & Demand Zones:**
- **Red zones** = Areas where selling pressure overwhelmed buyers
- **Green zones** = Areas where buying pressure overwhelmed sellers
- These zones act as magnets for price to return and react
---
## 🎓 Best Practices
1. **Confluence is Key:**
- Combine with daily/weekly bias
- Check for orderblocks nearby
- Look for imbalances (FVG)
2. **Session Timing:**
- Best during London/New York sessions
- Avoid low liquidity periods
3. **Risk Management:**
- Never risk more than 1-2% per trade
- Use proper lot sizing
- Take partial profits at key levels
4. **Timeframe Correlation:**
- Check higher timeframe for bias
- Enter on lower timeframe for precision
- Exit based on higher timeframe targets
---
## 📞 Support & Updates
**Version:** 1.0
**Compatibility:** TradingView Pine Script v5
**Updates:** Regular improvements based on ICT methodology
---
## ⚡ Quick Reference Card
| Signal | Action | SL Placement | TP Target |
|--------|--------|--------------|-----------|
| SFP + X at High | SHORT at Red Zone | Above Red | Green Zone |
| SFP + X at Low | LONG at Green Zone | Below Green | Red Zone |
**Remember:** The indicator shows you WHERE to trade, but YOU decide WHEN based on confirmation and market context.
---
*Disclaimer: This indicator is a tool for technical analysis. Always use proper risk management and never trade with money you cannot afford to lose.*

Liquidity Sweep Sniper AP StyleAP Capital – Liquidity Sweep Sniper (Fab-Style)
📌 Overview
This indicator is a precision scalping tool inspired by professional liquidity-based trading concepts often demonstrated by elite intraday scalpers.
The script focuses on liquidity sweeps followed by strong displacement, aiming to capture short, high-probability momentum moves — particularly effective on lower timeframes (1–5 min) during active market sessions.
It is not a signal spam tool. Signals appear only when multiple objective conditions align.
🧠 Core Concept
Markets do not move randomly — they seek liquidity before expanding.
This indicator identifies:
Buy-side / Sell-side liquidity
Liquidity sweeps (stop-hunts)
Strong displacement candles reclaiming price
Optional higher-timeframe trend alignment
Only when all conditions are met does a signal print.
🔍 What the Indicator Detects
1️⃣ Liquidity Pools
Equal highs or equal lows detected within a configurable lookback
Minimum number of touches required
ATR-based tolerance to adapt to volatility
These levels represent areas where stop orders are likely resting.
2️⃣ Liquidity Sweep
A valid sweep requires:
Price to wick beyond the liquidity level
Candle to close back inside the range
This indicates failed breakout / stop-hunt behaviour.
3️⃣ Displacement Confirmation
After the sweep, the candle must show:
Strong body (default >60% of candle range)
Candle range large relative to ATR
Clear directional intent (momentum)
This filters out weak reactions and chop.
4️⃣ Optional Trend Filter
EMA-based higher-timeframe bias
Helps align scalps with dominant direction
Can be enabled or disabled
📈 Signals
BUY: Sell-side liquidity sweep → bullish displacement
SELL: Buy-side liquidity sweep → bearish displacement
Signals are plotted directly on the chart and can be used with alerts.
⚙️ Recommended Usage
Markets: XAUUSD, indices, liquid FX pairs
Timeframes: 1m–5m
Sessions: London & New York (best performance)
Risk Management: Always required — this tool does not place trades
Best used as a confirmation tool, not standalone.
⚠️ Important Notes
This indicator is inspired by liquidity-based scalping concepts, not an exact replication of any individual trader’s private strategy.
No indicator predicts the future — this tool highlights high-probability scenarios, not guarantees.
Past performance is not indicative of future results.

FOMC Sweep Reaction AP Capital – FOMC Sweep Reaction v1.0
AP Capital – FOMC Sweep Reaction v1.0 is a news-reaction and liquidity-based trading tool designed specifically to track and trade FOMC volatility on Gold (XAUUSD) and other highly reactive instruments.
The indicator focuses on liquidity sweeps, structure breaks, and EMA reclaims that commonly occur around Federal Reserve interest-rate decisions and Powell speeches, helping traders identify high-probability reversal or continuation moves after the initial spike.
🔍 What This Indicator Detects
This tool highlights the most repeatable FOMC behaviours observed across multiple months of broker data:
• Sweeps of previous day’s high or low
• Stop-hunt wicks into liquidity pools
• EMA13 reclaim after the news spike
• Break and close beyond short-term structure
• Momentum shift following volatility exhaustion
The goal is not to predict the news, but to react to confirmed price behaviour after liquidity has been taken.
📌 Core Features
• FOMC Sweep Detection
Identifies aggressive wicks into prior highs/lows during news volatility
• EMA Reclaim Confirmation
Uses EMA13 to validate momentum shift after the sweep
• Market Structure Awareness
Filters reactions that fail to break structure to avoid false reversals
• Session-Aligned Logic
Designed around London → NY → FOMC release timing
• Clean Visuals
Minimal chart clutter for fast decision-making during volatile conditions
🧠 How to Use
Wait for FOMC release / Powell speech
Allow price to sweep previous liquidity (PDH / PDL / local extremes)
Observe reclaim of EMA13
Enter only after structure confirmation
Manage trade using EMA trailing or structure-based exits
⚠️ This is a reaction system, not a prediction tool.
📊 Best Use Cases
• XAUUSD (Gold)
• NASDAQ / US indices
• High-impact macro news events
• 5-min to 15-min timeframes
⚠️ Important Notes
• News volatility is extreme — risk management is essential
• Not designed for low-volatility or ranging markets
• Best combined with a clear trading plan and strict risk rules
📎 Disclaimer
This indicator is for educational purposes only and does not constitute financial advice. Trading during high-impact news events involves significant risk.

cd_HTF_bias_CxOverview:
No matter our trading style or model, to increase our success rate, we must move in the direction of the trend and align with the Higher Time Frame (HTF). Trading "gurus" call this the HTF bias. While we small fish tend to swim in all directions, the smart way is to flow with the big wave and the current. This indicator is designed to help us anticipate that major wave.
________________________________________
Details and Usage:
This indicator observes HTF price action across preferably seven different pairs, following specific rules. It confirms potential directional moves using CISD levels on a Medium Time Frame (MTF). In short, it forecasts the likely direction (HTF bias). The user can then search for trade opportunities aligned with this bias on a Lower Time Frame (LTF), using their preferred pair, entry model, and style.
________________________________________
Timeframe Alignment:
The commonly accepted LTF/MTF/HTF combinations include:
• 1m – 15m – H4
• 3m – H1 – Daily / 3m – 30m – Daily
• 5m – H1 – Daily
• 15m – H4 – Weekly
• H1 – Daily – Monthly
• H4 – Weekly – Quarterly
Example: If you're trading with a 3m model on a 30m/3m setup, you should seek trades in the direction of the H1/Daily bias.
________________________________________
How It Works:
The indicator first looks for sweeps on the selected HTF — when any of the last four candles are swept, the first condition is met.
The second step is confirmation with a CISD close on the MTF — once a candle closes above/below the CISD level, the second condition is fulfilled. This suggests the price has made its directional decision.
Example: If a previous HTF candle is swept and we receive a bearish CISD confirmation on H1, the HTF bias becomes bearish.
After this, you may switch to a more granular setup like HTF: 30m and MTF: 3m to look for trade entries aligned with the bias (e.g., 30m sweep + 3m CISD).
________________________________________
How Is Bias Determined?
• HTF Sweep + MTF CISD = SC (Sweep & CISD)
• Latest Bullish SC → Bias: Bullish
• Latest Bearish SC → Bias: Bearish
• Price closes above the last Bearish SC → Bias: Strong Bullish
• Price closes below the last Bullish SC → Bias: Strong Bearish
• Strong Bullish bias + Bearish CISD (without HTF sweep) → Bias: Bullish
• Strong Bearish bias + Bullish CISD (without HTF sweep) → Bias: Bearish
• Bearish price violates SC high, but Bullish SC is untouched → Bias: Bullish
• Bullish price violates SC low, but Bearish SC is untouched → Bias: Bearish
• If neither side generates SC → Bias: No Bias
The logic is built on the idea that a price overcoming resistance is stronger, and encountering resistance is weaker. This model is based on the well-known “Daily Bias” structure, but with personal refinements.
________________________________________
What’s on the Screen?
• Classic HTF zones (boxes)
• Potential MTF CISD levels
• Confirmed MTF lines
• Sweep zones when HTF sweeps occur
• Result table showing current bias status
________________________________________
Usage:
• Select HTF and MTF timeframes aligned with your trading timeframe.
• Adjust color and position settings as needed.
• Enter up to seven pairs to track via the menu.
• Use the checkbox next to each pair to enable/disable them.
• If “Ignore these assets” is checked, all pairs will be disabled, and only the currently open chart pair will be tracked.
________________________________________
Alerts:
You can choose alerts for Bullish, Bearish, Strong Bullish, or Strong Bearish conditions.
There are two types of alert sources:
1. From the indicator’s internal list
2. From TradingView’s watchlist
Visual example:
________________________________________
How I Use It:
• For spot trades, I use HTF: Weekly and MTF: H4 and look for Bullish or Strong Bullish pairs.
• For scalping, I follow bias from HTF: Daily and MTF: H1.
Example: If the indicator shows a Bearish HTF Bias, I switch to HTF: 30m and MTF: 3m and enter trades once bearish conditions are met (timeframe alignment).
________________________________________
Important Notes:
• The indicator defines CISD levels only at HTF high and low levels.
• If your chart is on a higher timeframe than your selected HTF/MTF, no data will appear.
Example: If HTF = H1 and MTF = 5m, opening a chart on H4 will result in a blank screen.
• The drawn CISD level on screen is the MTF CISD level.
• Not every alert should be traded. Always confirm with personal experience and visual validation.
• Receiving multiple Strong Bullish/Bearish alerts is intentional. (Trick 😊)
• Please share your feedback and suggestions!
________________________________________
And Most Importantly:
Don't leave street animals without water and food!
Happy trading!

cd_sweep&cisd_CxOverview:
When the price is at a significant zone/level on a higher time frame (HTF), and it sweeps (breaks through and then closes back below/above) the high or low of the previous HTF candle, it is common to look for a Change in State of Delivery (CISD) on a lower time frame (LTF) to enter a trade.
This model can be summarized as:
HTF Sweep → LTF CISD (Optional: SMT / Divergences)
________________________________________
Working Principle & Details:
1. The indicator monitors price action on the selected HTF and tracks any sweep (violation) of the previous HTF candle's high or low. Simultaneously, it identifies CISD levels on the LTF. If SMT is enabled, it will appear as a label on the chart.
When both HTF sweep and LTF CISD conditions are met, the indicator marks the chart at the open of the next candle and triggers an alert if set.
CISD levels are tracked and updated whenever a new HTF high/low is formed.
2. The indicator monitors the formation of entry models on up to six selected pairs, displaying results in two separate tables:
o HTF Sweep Query Table: Monitors live HTF candles and reports pairs that meet the sweep condition.
o CISD Table: Displays the pairs where a valid entry model has formed. A "🔥" symbol indicates the condition has occurred.
3. Bias Visualization:
Based on the selected HTF, a visual band is shown at the bottom of the chart using the chosen bullish/bearish colors.
Bias is determined by:
o Candle closing above/below the previous one suggesting continuation.
o A failed close after a sweep implying potential reversal.
4. HTF Candles:
Displays HTF candles based on the user-defined time frame.
5. Optional SMT (Smart Money Technique):
Must be enabled in the menu and requires the correlated pair to be entered correctly for accurate results.
Displayed only as a visual confirmation, not a requirement for model formation.
If the currently open symbol sweeps the previous candle while the correlated symbol does not (or vice versa), an "SMT" label appears on the chart.
6. Color & Table Positioning:
Controlled via the settings menu.
________________________________________
Warnings:
• The indicator only marks CISDs that form at HTF high/low zones.
• Entering every time the model forms does not guarantee profitability.
• Waiting for the model to appear at significant HTF levels/zones increases the likelihood of success.
• HTF and LTF selections should follow commonly accepted combinations or user-tested time frames.
• If you want to trigger alerts only for symbols entered in the indicator, ensure the "Use indicator alerts" option is enabled.
• To set alerts for the TradingView watchlist instead, disable the "Use indicator alerts" option.
________________________________________
Feel free to share your thoughts and suggestions.
Happy trading! 💫

Institutional Sweep Zone (Range-Based)Institutional Sweep Zone (Range-Based)
This indicator models potential stop sweep zones based on institutional capital ranges, helping traders visualize where high-probability liquidity grabs are likely to occur.
Unlike traditional volatility bands, this tool estimates price movement by calculating how far a specific amount of capital—entered into the market—can push price. By defining a lower and upper capital range (in millions of USD), the indicator dynamically draws bands representing the distance institutions could realistically move price in either direction.
It supports directional control, allowing you to focus on long sweeps, short sweeps, or both simultaneously. The pip cost is auto-calibrated based on the selected currency pair, making it highly adaptive to major FX pairs.
Key Features:
-Capital input range (in millions of USD)
-Directional sweep targeting: Long, Short, or Both
-Auto-detection of pip value based on FX pair
-Visual sweep zone mapped above and below current price
-Designed to highlight areas of institutional stop hunts
Why use it?
-Helps avoid setting stops inside common sweep zones
-Improves trade survivability when paired with higher timeframe strategies
-Offers a unique way to view price through an institutional lens
Created by: The_Forex_Steward
Explore more advanced tools and concepts on my TradingView profile.

Chainbey Ai - Liquidity Zones (Pivot Sweeps) - Chain Style📌 Indicator Description
Chainbey Ai – Liquidity Zones (Pivot Sweeps) – Chain Style
This indicator automatically identifies and visualizes liquidity zones on the chart based on confirmed swing highs and lows, helping traders spot areas where stop-loss clusters, institutional interest, and liquidity grabs are likely to occur.
Unlike simple pivot markers, this script draws true liquidity zones (price areas, not single lines) and tracks when price sweeps those zones — a common behavior before strong reversals or continuations.
The indicator is designed to stay stable when switching pairs or timeframes, using time-anchored zones for reliable positioning across all markets.
🔍 Key Features
Buy-Side Liquidity Zones
Marked above swing highs (potential stop-loss pools)
Sell-Side Liquidity Zones
Marked below swing lows
Liquidity Sweep Detection
Highlights when price grabs liquidity using wick or close
Zone Strength Filters
ATR-based swing size filtering
Optional volume confirmation
Cooldown logic to reduce clutter
Time-Anchored Zones
Zones remain aligned when switching symbols or timeframes
Highly Customizable
Control pivot strength, zone size, filters, and visibility
Works on All Markets
Crypto, Forex, Indices, Commodities, Stocks
🧠 How to Use
Trend Continuation
Look for price to sweep liquidity and continue in trend direction
Reversal Setup
Liquidity sweep + rejection can signal potential reversals
Confluence Tool
Combine with trend, RSI, MACD, structure, or volume analysis
Risk Management
Liquidity zones can act as logical SL/TP reference areas
⚠️ This is a market structure & liquidity tool, not a buy/sell signal generator.
Always use confirmation before entering trades.
⚙️ Recommended Settings (BTC 30m)
Pivot Length: 9–12
Min Swing Size (ATR): 1.5 – 2.5
Cooldown Bars: 30 – 50
Max Active Zones: 15 – 20
Volume Filter: Optional (1.2 – 1.4x)

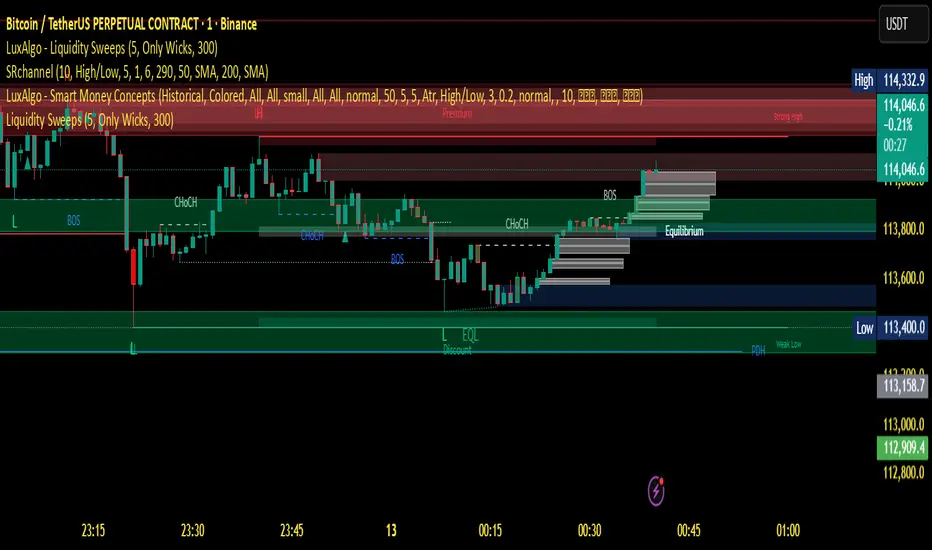
Liquidity Sweeps 2nd attemptLiquidity Sweeps 2nd attempt
The Liquidity Sweeps indicator detects the presence of liquidity sweeps on the user's chart, while also providing potential areas of support/resistance or entry when Liquidity levels are taken.
In the event of a Liquidity Sweep a Sweep Area is created which may provide further areas of interest.
Swing Structure + Session Sweeps“Scalper-Friendly Trend & Sweep Detector”
Swing Structure + Session Sweeps with TEMA Cloud
This powerful all-in-one tool is designed for intraday traders, swing traders, and scalpers who want to spot high-probability reversals, trend continuations, and liquidity sweeps with confluence.
🔹 Core Features
Multi-layered TEMA Cloud (9, 20, 34, 50) for clear trend structure
Dynamic Bull/Bear labels when the trend flips
Centerline for TEMA 20 to visualize core trend direction
Session-based liquidity sweep detection (Asia, London, NY)
Volume and absorption dots to catch hidden pressure
Swing high/low detection (external and internal)
Visual VWAP, daily highs/lows, and customizable session zones
Optional alerts for volume spikes, absorption, and reversal sweeps
📈 Use it to:
Confirm directional bias
Anticipate pullbacks and breakouts
Identify volume-backed reversals
Align trades with session strength and swing confluence
⚙️ Built for scalpers, intraday opportunists, and precision chartists alike.

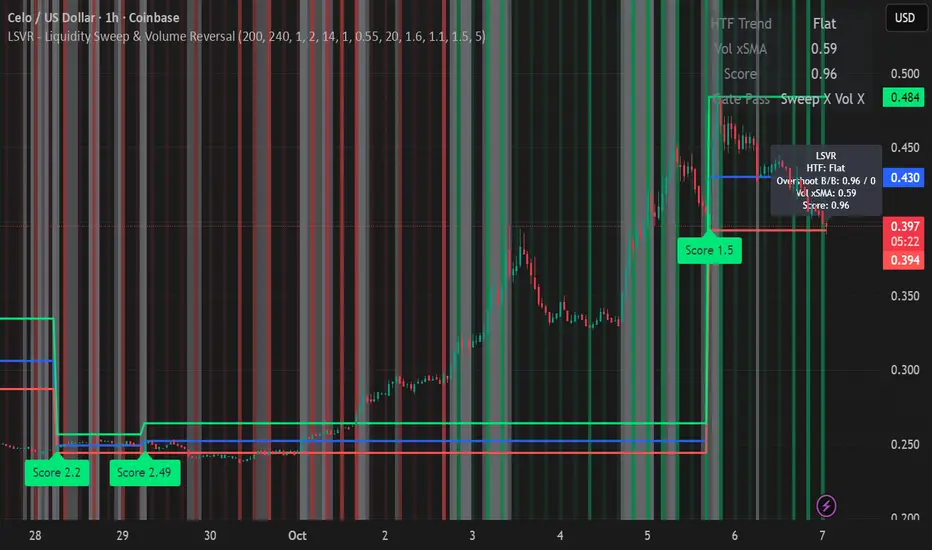
LSVR - Liquidity Sweep & Volume ReversalLSVR condenses a pro workflow into one visual overlay: Higher-Timeframe (HTF) Trend → Liquidity Sweep & Reclaim → Volume Confirmation. A signal only prints when all three gates align at bar close, and the chart shows everything you need—trend context, the sweep “trap” candle, and a projected Entry/SL/TP based on your chosen R multiple.
How it works
HTF Trend Filter: Projects a smoothed KAMA/EMA from a higher timeframe to the chart using a safe, lookahead-off request. Long signals are considered only above the HTF line; shorts only below.
Liquidity Sweep & Reclaim: Finds confirmed swing highs/lows, then detects an ATR-scaled overshoot through that swing followed by a reclaim (close back inside a configurable % of the bar range).
Volume Confirmation: Requires either a volume spike over Volume SMA × multiplier or optional OBV divergence. No participation = no signal.
Score: Each setup is scored: trend (0/1) + overshoot strength (0..1.5) + conviction (0/1). Signals fire only when the score ≥ Min Signal Score.
What you see
HTF Ribbon (subtle green/red backdrop) for bias.
Sweep Box on the signal candle (green = long, red = short).
Signal markers (“L” / “S”) with a small score label.
Projected lines that persist until the next signal: Entry (close), Stop (beyond swept swing), Target (R multiple).
Heatmap that intensifies when the score crosses your threshold.
Dashboard (top-right): HTF direction, Volume×SMA, current Score, gate pass status.
Tooltip on the last bar with quick stats.
Quick start
Apply to any liquid symbol and set HTF to ~3–6× your chart timeframe (e.g., 15m chart → 1H–4H).
Trade with the HTF trend: take L signals above the HTF line and S signals below it.
Entry = signal bar close, SL = beyond the swept swing, TP = your Projected Take-Profit (R).
Tighten or loosen selectivity with Min Signal Score, Reclaim %, Overshoot (ATR×), and Cooldown.
Recommended presets
Choppy/crypto 15m: minScore 1.25, reclaimPct 0.60–0.65, overshootATR 1.0–1.2, useOBVDiv=false, cooldown 8.
FX 5m / session trend: minScore 1.0–1.1, reclaimPct 0.50–0.55, overshootATR 0.8–1.0, useOBVDiv=true, cooldown 5.
Indices 1m (RTH): minScore 1.2, reclaimPct 0.55–0.60, useOBVDiv=false, cooldown 10.
Non-repainting by design
HTF values use lookahead_off with realtime offset.
Swings are confirmed pivots (no “forming” pivots).
Signals print at bar close only.
Notes
OBV divergence can add sensitivity on liquid markets; keep it off for stricter filtering.
Use Cooldown to avoid clustered sweeps.
This is an overlay/analysis tool, not financial advice. Test settings in Replay/Paper Trading before using live.
LP Sweep / Reclaim & Breakout Grading: Long-onlySignals
1) LP Sweep & Reclaim (mean-reversion entry)
Compute LP bounds from prior-bar window extremes:
lpLL_prev = lowest low of the last N bars (offset 1).
lpHH_prev = highest high of the last N bars (offset 1).
Sweep long trigger: current low dips below lpLL_prev and closes back above it.
Real-time quality grading (A/B/C) for sweep:
Trend filter & slope via EMA(88).
BOS bonus: close > last confirmed swing high.
Body size vs ATR, location above a long EMA, headroom to swing high (penalty if too close), and multi-sweep count bonus.
Sum → score → grade A/B/C; A or B required for sweep entry.
2) Trend Breakout (momentum entry)
Core trigger: close > previous Donchian high (length boLen) + ATR buffer.
Optional filter: close must be above the default EMA.
Breakout grading (A/B/C) in real time combining:
Trend up (price > EMA and EMA rising),
Body/ATR, Gap above breakout level (in ATR),
Volume vs MA,
Upper-wick penalty,
Position-in-Score: headroom to last swing high (penalty if too near) + EMA slope bonus.
Sum → score → A or B required if grading enabled.

OB Sweeps ReversalOB Sweeps Reversal is a high-precision market structure tool that identifies and dynamically tracks bullish and bearish order blocks — key zones where institutional participants are likely to be active. These zones act as support and resistance levels, adapting to market behavior in real time.
The script monitors price interaction with each OB and classifies its status as:
Unmitigated (price has not yet returned)
Mitigating (price is testing the zone)
Invalidated (zone has been broken)
Traders can use these zones directly as actionable support/resistance — or wait for additional confirmation via the system’s liquidity sweep detection and optional filters.
🔍 Key Features:
Automatically detects and plots bullish and bearish OBs
Tracks mitigation status and updates visuals accordingly
Detects liquidity sweeps of recent highs/lows
Optional filters:
• 200 EMA trend direction
• Momentum of current or previous candle
Plots stop-loss and take-profit lines using ATR-based logic
Clean entry labels with full contextual data
Built-in alert system with constant-string messages (automation ready)
📈 How to Use:
Load the script on any timeframe (15m–4H recommended)
Observe the live OB zones as they develop
Trade based on price interaction:
• Bounce off a bullish OB = potential long setup
• Rejection from a bearish OB = potential short
• Sweep + snapback into an OB = optional trap reversal entry
SL/TP levels are drawn automatically for reference
Use alerts to automate or monitor high-conviction setups
The order blocks themselves are valuable on their own — even without waiting for a signal. They can be used as dynamic support and resistance zones, offering excellent structure-based trading opportunities.
🧠 Ideal For:
Traders who follow price action and market structure
Those using support/resistance, OBs, or supply/demand
Intraday and swing traders looking for cleaner structure alignment
Users who prefer low-frequency, high-quality setups
⚠️ Note:
This tool does not produce frequent signals. It is designed for precision and discipline, with a focus on clarity and confluence. It complements — not replaces — a trader’s decision-making process.
This script is open-source and designed with integrity, precision, and trader usability in mind. No links, no upsells, no promotions — just a reliable system for structural market analysis.

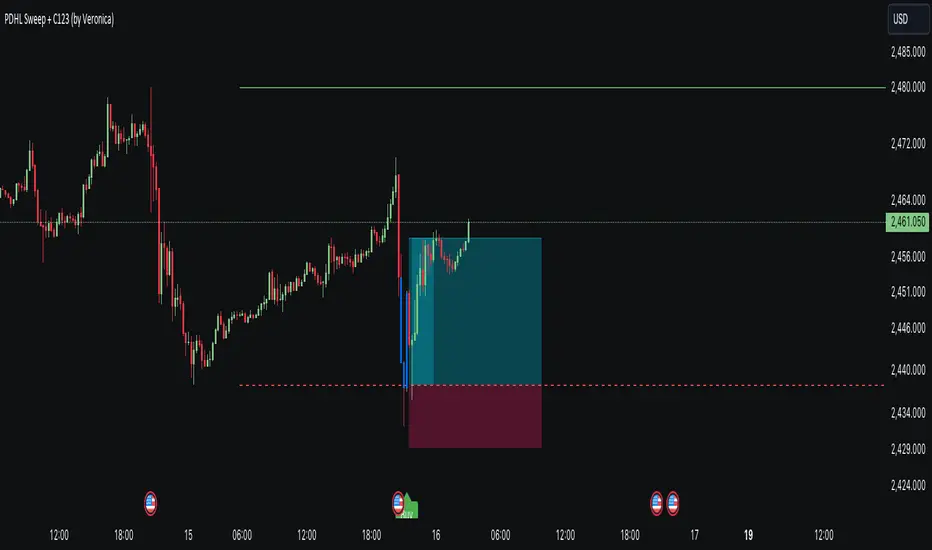
PDHL Sweep + C123 (by Veronica)The "PDHL Sweep + C123" is an indicator to identify potential reversal or continuation patterns in the market by combining key price levels from the previous day with a custom three-candle pattern analysis.
Key Features:
1. Previous Day High/Low Sweep:
The indicator automatically plots horizontal lines marking the previous day's high and low prices.
If the price crosses these key levels, the lines will change from solid to dashed, indicating a potential sweep or breakout.
2. Three-Candle Pattern Analysis:
The indicator identifies specific three-candle patterns that could signal a bullish or bearish setup. The pattern is validated if certain conditions are met, including the relationship between candle bodies and whether the price has crossed the previous day's high or low.
3. Marubozu Condition (Optional):
Users can enable a condition that checks if the Candle 1 and 3 in the pattern is a Marubozu, with a customizable body size percentage.This adds an extra layer of confirmation to the pattern. Default is switch on for both candle 1 and 3.
4. Customizable Alerts:
Users can set alerts for when a "Buy" or "Sell" signal is triggered, allowing them to stay informed of potential trading opportunities without constantly monitoring the charts.
Callout Signals:
When a valid bullish or bearish pattern is identified, the indicator places a "Buy" or "Sell" callout on the chart for clear visual signaling.
5. Customizable colour and text:
Users can customize the color and text of these callouts to suit their preferences.
How to Use:
Bullish Signal: A "Buy" callout will appear when a valid three-candle bullish pattern is detected and the price has crossed below the previous day's low.
Bearish Signal: A "Sell" callout will appear when a valid three-candle bearish pattern is detected and the price has crossed above the previous day's high.
Customize the appearance of the indicator, including line colors, callout colors, and text colors, to match your charting style.
This indicator is ideal for traders who rely on price action and key levels for their trading decisions. It provides clear signals and alerts, helping you stay on top of potential market reversals or continuations.
Liquidity Sweep ReversalOverview
The Liquidity Sweep Reversal indicator is a sophisticated intraday trading tool designed to identify high-probability reversal opportunities after liquidity sweeps occur at key market levels. Based on Smart Money Concepts (SMC) and Institutional Order Flow analysis, this indicator helps traders catch market reversals when stop-loss clusters are hunted.
Key Features
🎯 Multi-Level Liquidity Analysis
Previous Day High/Low (PDH/PDL) detection
Previous Week High/Low (PWH/PWL) tracking
Session highs/lows for Asian, London, and New York markets
Real-time level validation and usage tracking
⚡ Advanced Signal Generation
CISD (Change In State of Delivery) detection algorithm
Engulfing pattern recognition at key levels
Liquidity sweep confirmation system
Directional bias filtering to avoid false signals
⏰ Kill Zone Integration
Pre-configured optimal trading windows
Asian Kill Zone (20:00-00:00 EST)
London Kill Zone (02:00-05:00 EST)
New York AM/PM Kill Zones (08:30-11:00 & 13:30-16:00 EST)
Optional kill zone-only trading mode
🛠 Customization Options
Multiple timezone support (NY, London, Tokyo, Shanghai, UTC)
Flexible HTF (Higher Time Frame) selection
Adjustable signal sensitivity
Visual customization for all levels and signals
Hide historical signals option for cleaner charts
How It Works
The indicator continuously monitors price action around key liquidity levels
When price sweeps liquidity (stop-loss hunting), it marks potential reversal zones
Confirmation signals are generated through CISD or engulfing patterns
Trade signals appear as arrows with color-coded candles for easy identification
Best Suited For
Intraday traders focusing on 1m to 15m timeframes
Smart Money Concepts (SMC) practitioners
Scalpers looking for high-probability reversal entries
Traders who understand liquidity and market structure
Usage Tips
Works best on liquid forex pairs and major indices
Combine with volume analysis for stronger confirmation
Use proper risk management - not all signals will be winners
Monitor higher timeframe bias for better accuracy
==============================================
日内流动性掠夺反向开单指标
指标简介
这是一款基于Smart Money概念(SMC)开发的高级日内交易指标,专门用于识别市场在关键价格水平扫除流动性后的反转机会。通过分析机构订单流和流动性分布,帮助交易者精准捕捉止损扫单后的市场反转点。
核心功能
多维度流动性分析
前日高低点(PDH/PDL)自动标记
前周高低点(PWH/PWL)动态跟踪
亚洲、伦敦、纽约三大交易时段高低点识别
关键位使用状态实时监控,避免重复信号
智能信号系统
CISD(Change In State of Delivery)算法检测
关键位吞没形态识别
流动性扫除确认机制
方向过滤系统,大幅降低虚假信号
黄金交易时段
内置Kill Zone时间窗口
支持亚洲、伦敦、纽约AM/PM四个黄金时段
可选择仅在Kill Zone内交易
时区智能切换,全球交易者适用
个性化设置
支持多时区切换(纽约/伦敦/东京/上海/UTC)
HTF周期自动适配或手动选择
信号灵敏度可调
所有图表元素均可自定义样式
历史信号隐藏功能,保持图表整洁
适用人群
日内短线交易者(1分钟-15分钟)
SMC交易体系践行者
追求高胜率反转入场的投机者
理解流动性和市场结构的专业交易者
使用建议
推荐用于主流加密货币、外汇对和股指期货
配合成交量分析效果更佳
严格止损,理性对待每个信号
关注更高时间框架的趋势方向
风险提示: 任何技术指标都不能保证100%准确,请结合自己的交易系统和风险管理使用。

Wick SweepThe Wick Sweep indicator identifies potential trend reversal zones based on price action patterns and swing points. Specifically, it looks for "Wick Sweeps," a concept where the market temporarily breaks a swing low or high (creating a "wick"), only to reverse in the opposite direction. This pattern is often indicative of a market attempting to trap traders before making a larger move. The indicator marks these zones using dashed lines, helping traders spot key areas of potential price action.
Key Features:
* Swing Low and High Detection: The indicator identifies significant swing lows and highs within a user-defined period by employing Williams fractals.
* Wick Sweep Detection: Once a swing low or high is identified, the indicator looks for price movements that break through the low or high (creating a wick) and then reverses direction.
* Fractal Plotting: Optionally, the indicator plots fractal points (triangle shapes) on the chart when a swing low or high is detected. This can assist in visually identifying the potential wick sweep areas.
* Line Plotting: When a wick sweep is detected, a dashed line is drawn at the price level of the failed low or high, visually marking the potential reversal zone.
Inputs:
* Periods: The number of bars used to identify swing highs and lows. A higher value results in fewer, more significant swing points.
* Line Color: The color of the dashed lines drawn when a wick sweep is detected. Customize this to match your chart's theme or preferences.
* Show Fractals: A toggle that, when enabled, plots triangle shapes above and below bars indicating swing highs (up triangles) and swing lows (down triangles).
Functionality:
* Swing High and Low Calculation:
- The indicator calculates the swing low and swing high based on the periods input. A swing low is identified when the current low is the lowest within a range of (2 * periods + 1), with the lowest point being at the center of the period.
- Similarly, a swing high is identified when the current high is the highest within the same range.
* Wick Sweep Detection:
- Once a swing low or high is detected, the script looks for a potential wick. This happens when the price breaks the swing low or high and then reverses in the opposite direction.
- For a valid wick sweep, the price should briefly move beyond the identified swing point but then close in the opposite direction (i.e., a bullish reversal for a swing low and a bearish reversal for a swing high).
- A line is drawn at the price level of the failed low or high when a wick sweep is confirmed.
Confirmations for Reversal:
* The confirmation for a wick sweep requires that the price not only break the swing low/high but also close in the opposite direction (i.e., close above the low for a bullish reversal or close below the high for a bearish reversal).
* The confirmation is further refined by checking that the price movement is within a reasonable distance from the original swing point, which prevents the indicator from marking distant, unimportant price levels.
Additional Notes:
* The Wick Sweep indicator does not provide standalone trading signals; it is best used in conjunction with other technical analysis tools, such as trend analysis, oscillators, or volume indicators.
* The periods input can be adjusted based on the trader’s preferred level of sensitivity. A lower period value will result in more frequent swing points and potentially more signals, while a higher value will focus on more significant market swings.
* The indicator may work well in ranging markets where price tends to oscillate between key support and resistance levels.

Engulfing Candle Indicator with SweepTHIS IS ENGULFED SWEEP CANDLE
This TradingView indicator identifies and highlights bullish and bearish engulfing candlestick patterns with an additional condition: the recent candle must "sweep" the high or low of the previous candle. This refined approach helps to confirm the strength of the engulfing pattern by ensuring that the current candle extends beyond the previous candle's range.
Features:
- **Bullish Engulfing Detection**: Identifies a bullish engulfing pattern where the current candle fully engulfs the previous candle's body, and the low of the current candle is below the low of the previous candle.
- **Bearish Engulfing Detection**: Identifies a bearish engulfing pattern where the current candle fully engulfs the previous candle's body, and the high of the current candle is above the high of the previous candle.
- **Visual Indicators**: Marks bullish engulfing patterns with a green label below the bar and bearish engulfing patterns with a red label above the bar.
- **Alert Conditions**: Provides customizable alerts for detected patterns, enabling you to be notified when a bullish or bearish engulfing pattern with a sweep is detected.
#### Usage:
1. **Apply to Chart**: Add the indicator to your chart to start detecting engulfing patterns with sweep conditions.
2. **Set Alerts**: Configure alerts to receive notifications when the indicator identifies a bullish or bearish engulfing pattern with a sweep.
#### Ideal For:
- Traders looking for additional confirmation in engulfing patterns.
- Users who want to incorporate price action signals into their trading strategy.
By incorporating the sweep condition, this indicator aims to enhance the reliability of the engulfing patterns and provide more actionable signals.
---
Feel free to adjust the description based on any specific details or features you want to highlight. If there are any additional features or details about the indicator that should be included, let me know!

NQ Lunch High Low First Sweep StrategyThis script identifies the FIRST liquidity sweep of the Lunch session high or low
after the Lunch session has ended, based on ICT / Killzone concepts.
Logic summary:
• Tracks Lunch session High and Low (New York time)
• After Lunch session closes, monitors the market on 5-minute timeframe
• Triggers ONLY on the first sweep:
– Price wicks beyond Lunch High and closes back below → SHORT signal
– Price wicks beyond Lunch Low and closes back above → LONG signal
• Generates an alert at the exact bar where entry is expected
• Designed specifically for Nasdaq (NQ) futures
• One trade per day – no overtrading
Notes:
• Intended for 5-minute charts only
• Uses New York session timing
• This script does NOT manage exits (TP/SL) – entry logic only
• Best used as a confluence tool, not a standalone system
Educational & discretionary use only.

CHOCH & Liquidity Sweep Detectorso think of this one as an upgraded version from the previous liquidity sweep and reversal indicator i shared. This one:
Identifies when price wicks above a swing high then closes below it (bearish sweep 💧)
Identifies when price wicks below a swing low then closes above it (bullish sweep 💧)
Orange labels mark the sweeps with dashed lines showing the liquidity level
CHOCH (Change of Character) Detection
After a liquidity sweep, it watches for structure breaks
Bearish CHOCH: After bullish sweep, price breaks below previous structure low (🔴 SHORT setup)
Bullish CHOCH: After bearish sweep, price breaks above previous structure high (🟢 LONG setup)
Market Structure Tracking
Shows current structure highs/lows with dotted lines
Tracks whether market is in bullish, bearish, or neutral trend
Dashboard (bottom-right)
Shows current trend direction
Liquidity sweep status
CHOCH confirmation
Setup Ready alert when both conditions align
Clear action recommendation
How to use with tf alignment indicator:
Apply both indicators to your 1hr/4hr chart
Wait for alignment (Daily/Weekly/Monthly all bearish or bullish)
Look for liquidity sweep (💧 label appears)
Wait for CHOCH (big red/green label with "CHOCH")
Enter on retest of the broken structure level

Engulfing Sweeps - Milana TradesEngulfing Sweeps
The Engulfing Sweeps Candle is a candlestick pattern that:
1)Takes liquidity from the previous candle’s high or low.
2)Fully engulfs previous candles upon closing.
3)Indicates strong buying or selling pressure.
4)Helps determine the bias of the next candle.
Logic Behind Engulfing Sweeps
If you analyze this candle on a lower timeframe, you’ll often see popular models like PO3 (Power of Three) or AMD (Accumulation – Manipulation – Distribution).
Once the candle closes, the goal is to enter a position on the retracement of the distribution phase.
How to Use Engulfing Sweeps?
Recommended Timeframes:
4H, Daily, Weekly – these levels hold significant liquidity.
Personally, I prefer 4H, as it provides a solid view of mid-term market moves.
Step1 - Identify Engulfing Sweep Candle
Step 2-Switch to a lower timeframe (15m or 5m).And you task identify optimal trade entry
Look for an entry pattern based on:
FVG (Fair Value Gap)
OB (Order Block)
FIB levels (0/0.25/0.5/ 0.75/ 1)
Wait for confirmation and take the trade.
Automating with TradingView Alerts
To avoid missing the pattern, you can set up alerts using a custom script. Once the pattern forms, TradingView will notify you so you can analyze the chart and take action. This approch helps me be more freedom

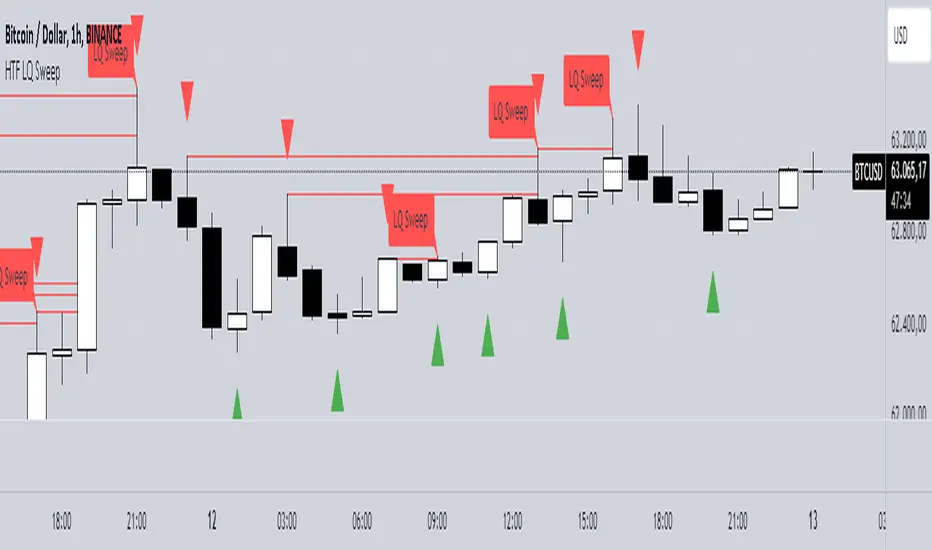
HTF LQ SweepThe following script recognises QL sweeps in the desired time frame with alarm function!
Theory:
There is liquidity above highs and below lows. If this is tapped and the market reacts strongly immediately, the probability of a reversal is greatly increased! In the chart, this is defined in such a way that a candle has its wicks BELOW the old low, but the close is ABOVE the old low. the same applies to the high, of course!
In such a case we have an "LQ Sweep"
How does the script work?
Williams 3 fractals are used as a basis. These are meaningful as lows or highs. Whenever a fractal is created, the price level is saved.
This means that not only the last fractal is relevant, but all historical fractals as long as they have not been reached!
If a candle reaches the level, but shows a rejection and closes within the level again, we have our "LQ Sweep" setup.
In the script you can select the timeframe in which the market has to be analysed. When the QL sweep occurs, an alert is triggered. This saves a lot of time because you can analyse different markets in different timeframes at the same time!
Each QL Sweep is marked in the chart when we are in the selected timeframe. These can also be deactivated so that only the last sweep is displayed.
Benefits for the trader:
An LQ sweep is a nice confirmation for a reversal.
If we have such an LQ sweep, we can wait in the lower timeframe for further confirmation, such as a structural break, to position our entries there.
The alarm function saves us a lot of time and we only go to the chart when a potential setup has been created.
You can set different time frames in the script: The selected time frame is then scanned and sends a signal when the event occurs.
Liquidity Sweeps by EVThis indicator is designed to detect liquidity sweeps and stop hunts by identifying when price briefly moves beyond key swing highs or lows and then rejects those levels. It highlights areas where buy-side or sell-side liquidity has been taken, offering traders a clear and objective way to read liquidity-driven market behavior.
Buy-side liquidity sweeps occur when price trades above a previous swing high and fails to hold, while sell-side liquidity sweeps occur when price trades below a previous swing low and quickly recovers. All detections are based on confirmed pivots, ensuring the indicator is fully non-repainting and reliable in live trading conditions.
The indicator allows users to choose between close-based or wick-based confirmation and can optionally mark only the first sweep of each liquidity level to reduce chart noise. Liquidity levels can be visualized directly on the chart, providing precise contextual references for market structure, VWAP confluence, and potential reversals.

Liquidity Sweep Pro [Whale Edition]Liquidity Sweep Pro is a next-generation trading tool that bridges the gap between Smart Money Concepts (SMC) and Quantitative Volume Analysis.
Traditional "Liquidity Sweep" indicators often generate false signals by marking every wick crossover as a trade setup. This indicator solves that problem by filtering setups through a Quant VSA Engine. It asks not just "Did price sweep a level?" but "Was there institutional money behind this move?"
🔬 How It Works
The indicator operates on three synchronized layers:
1. Market Structure (Liquidity Pools) It automatically identifies key pivot points where retail Stop Losses are likely clustered:
Buy Side Liquidity (BSL): Areas above swing highs.
Sell Side Liquidity (SSL): Areas below swing lows.
2. The Quant Engine (Whale Detection) Instead of using simple volume averages, we apply statistical modeling to detect anomalies:
Log-Normal Z-Score: Normalizes volume data to detect statistically significant outliers (Sigma > 2.5). This adapts to market volatility, filtering out noise.
Kaufman Efficiency Ratio (KER): Analyzes the quality of price movement to classify the "Whale" type:
❄️ Absorption (Iceberg): High Volume + Low Price Movement. Signals a potential reversal.
🚀 Propulsion (Drive): High Volume + High Price Efficiency. Signals an aggressive breakout.
3. The Trigger (Smart Entry) A trade signal is generated ONLY when:
Price sweeps a liquidity level (wicking below/above).
Price closes back within the range.
Institutional Activity is confirmed (High Z-Score Volume).
Trend (EMA 200) and Momentum (RSI) filters are aligned.
🛡️ Features
Intrabar Analysis: Uses request.security_lower_tf to analyze the internal volume delta of the candle for maximum precision.
Automated Risk Management: Plots Entry, Take Profit, and Stop Loss levels directly on the chart based on ATR (Average True Range) and your preferred Risk:Reward ratio.
Unified Alerts: Includes a single "ANY SWEEP" alert condition, allowing you to monitor both Long and Short setups with just one TradingView alert.
Visual Classification: Candles with institutional activity are marked with a 🐋 symbol, even if no sweep occurs, helping you read the narrative.
⚙️ Best Settings & Usage
Timeframes: Works best on 15m, 1h, and 4h charts.
LTF Interval (Input): This is crucial.
If trading on the 1h chart, set LTF to 1 minute.
If trading on the 4h chart, set LTF to 5 minutes.
Whale Threshold: Default is 2.5 Sigma. Increase to 3.0 for fewer, higher-confidence signals, or decrease to 2.0 for more frequency.
⚠️ Disclaimer
This tool is for educational purposes only. It identifies statistical probabilities, not certainties. Always manage your risk and do not rely solely on one indicator.
