PFA_ATR Locha: Clean Volatility RegimePerfect 👍
Below is the **TradingView-ready publishing text** using **ONLY**:
* **Bold →** ` ... `
* *Italics →* ` ... `
No markdown, no emojis, no extra formatting — **100% compatible with TradingView indicator description**.
ATR Locha – Volatility Regime Indicator
A market-condition tool to identify volatility compression and expansion
Description
ATR Locha is a volatility-regime indicator based on ATR expressed as a percentage of price (ATR%) . Instead of predicting price direction, it focuses on identifying market stress states —periods of unusually low volatility (compression) and unusually high volatility (panic or expansion).
Markets often remain calm for long periods and then move sharply when volatility expands. ATR Locha helps traders visually identify these conditions and prepare accordingly.
What the Indicator Shows
• ATR% line showing current volatility intensity
• Lower shaded zone representing volatility compression (ATR Locha zone)
• Upper shaded zone representing volatility expansion / panic
• Regime label displaying the current market state
Core Concept
Price trends often change only after volatility changes.
ATR Locha does not answer “Where will price go?”
It answers “Is risk quietly building or already exploding?”
How to Use ATR Locha
1. Compression Zone (ATR Locha Zone)
When ATR% enters the lower shaded region:
• Market volatility is suppressed
• Price ranges become narrow
• Risk of sudden expansion increases
Trading Insight
• Reduce leverage
• Avoid chasing late trends
• Prepare for breakouts or regime shifts
2. Expansion / Panic Zone
When ATR% enters the upper shaded region:
• Volatility is elevated
• Market is emotionally driven
• Large candles and gaps are common
Trading Insight
• Book partial profits
• Tighten stop losses
• Avoid aggressive fresh entries
3. Normal Regime
When ATR% stays between both zones:
• Market is balanced
• Trends or ranges behave normally
Trading Insight
• Follow your regular trading strategy
Best Use-Cases
• Index analysis (NIFTY, BANKNIFTY, global indices)
• Positional and swing trading
• Risk management and position sizing
• Market regime identification
Advantages (Pros)
• Clear identification of market regimes
• Objective and non-directional
• Acts as an early warning system
• Works well on daily and weekly charts
• Complements any price-based strategy
Limitations (Cons)
• Not a buy or sell signal
• Does not predict price direction
• Volatility compression can persist longer than expected
• Requires confirmation from price structure or volume
Common Mistakes to Avoid
• Using ATR Locha as a standalone trading system
• Expecting immediate breakouts from compression
• Ignoring price action and structure
• Over-leveraging during low volatility periods
Recommended Combinations
• ATR Locha + price structure analysis
• ATR Locha + trend indicators
• ATR Locha + options volatility (IV) analysis
• ATR Locha + support and resistance levels
Summary
ATR Locha is not a trading strategy.
It is a volatility and risk-condition detector .
It helps traders understand whether the market is:
• Calm
• Balanced
• Or under stress
Used correctly, ATR Locha improves discipline, risk awareness, and timing quality.
Disclaimer
ATR Locha is intended for educational and analytical purposes only. It does not constitute investment advice, trading recommendations, or a guarantee of future performance. Market conditions can change rapidly, and volatility regimes may persist longer than anticipated. Users should apply independent judgment, proper risk management, and additional confirmation before making any trading decisions.
Search in scripts for "swing trading"

PFA_PahadiPFA Pahadi Indicator
Market Structure through Swing Triangles
What is the PFA Pahadi Indicator?
The **PFA Pahadi Indicator** is a *price-structure visualization tool* that converts raw market movement into a series of **connected swing triangles**. By linking **Pivot Low → Pivot High → Pivot Low** and additionally connecting the **bases (Low → Low)**, the indicator visually resembles a *mountain (pahadi) range*—hence the name.
It focuses purely on **market structure**, not prediction, helping traders and analysts understand how price is *actually climbing, resting, and declining* over time.
Key Benefits
• Clear Market Structure
The indicator highlights **higher highs, higher lows, lower highs, and lower lows** in a clean, uncluttered way, making trend identification intuitive even on higher timeframes.
• Noise Reduction
By relying only on **confirmed pivots**, minor fluctuations are filtered out. This helps traders avoid reacting to short-term volatility and focus on meaningful swings.
• Visual Trend Strength Assessment
The *slope and shape* of the triangles reveal whether the trend is:
* Expanding (strong trend)
* Contracting (distribution / accumulation)
* Flattening (range / base building)
• Excellent for Positional & Swing Trading
Works particularly well on **weekly and daily charts**, where price structure matters more than intraday noise.
• No Repainting
All lines are drawn only after pivot confirmation. Once plotted, the structure does **not change retroactively**, ensuring analytical integrity.
• Complements Moving Averages & Volume
When combined with long-term averages or volume trends, the PFA Pahadi Indicator helps identify:
* Healthy pullbacks
* Structural breakdowns
* Failed rallies
Practical Use-Cases
• Trend Continuation Analysis
Higher base lines (Low → Low) indicate sustained accumulation and trend continuation.
• Structural Weakness Detection
Flattening or declining bases despite new highs may indicate **distribution** or **trend exhaustion**.
• Long-Term Support Mapping
The connected bases often act as *dynamic structural support zones* rather than exact price levels.
Limitations
• Not a Timing Indicator
The PFA Pahadi Indicator does **not provide entry or exit signals** on its own. It is a *context tool*, not a trigger.
• Lag Due to Confirmation
Because pivots require confirmation, the structure appears **after the move has occurred**. This is intentional for accuracy but unsuitable for scalping.
• Sensitive to Pivot Length Settings
Short pivot lengths may create too many triangles; longer lengths may miss smaller but tradable swings.
• Works Best in Trending Markets
In sideways or choppy conditions, the structure may appear flat and less informative.
Disclaimer
The PFA Pahadi Indicator is a market structure visualization tool and does not constitute investment advice, trading recommendations, or a guarantee of future performance. It is designed for educational and analytical purposes only.
All market decisions should be taken in conjunction with other tools such as volume analysis, risk management rules, broader market context, and individual financial suitability. Past price structures do not ensure future outcomes. Users are advised to validate the indicator across multiple securities and timeframes before applying it in live trading.
Philosophy Behind the Name
Markets don’t move in straight lines. They climb, pause, retrace, and climb again—just like a pahadi path. This indicator simply helps you see that path clearly.

Kinetic Scalper [BULLBYTE]KINETIC SCALPER - ADVANCED MOMENTUM & CONFLUENCE TRADING SYSTEM
A SOPHISTICATED MULTI-FACTOR ANALYSIS INDICATOR FOR PRECISION ENTRIES
The Kinetic Scalper is a comprehensive trading analysis tool that combines volume-weighted momentum calculations, multi-oscillator divergence detection, and a proprietary 15-factor confluence scoring system to identify high-probability reversal setups across all timeframes.
WHAT MAKES THIS INDICATOR ORIGINAL
This is NOT a simple mashup of existing indicators.
The Kinetic Scalper features a completely custom momentum engine called the "Kinetic Pulse" - a volume-weighted momentum oscillator with Fisher Transform normalization that fundamentally differs from standard RSI or other momentum indicators. Every component feeds into a unified algorithmic framework designed specifically for this system.
KEY INNOVATIONS:
KINETIC PULSE ENGINE
Unlike standard RSI which uses simple price changes, the Kinetic Pulse applies:
→ Volume weighting to price movements (high-volume moves carry more weight)
→ EMA smoothing instead of traditional SMA (faster response to changes)
→ Fisher Transform normalization for improved signal clarity
→ Adaptive period adjustment based on current volatility regime
→ Result: A momentum oscillator that responds to conviction, not just price noise
15-FACTOR CONFLUENCE SCORING SYSTEM
Every signal is graded based on the number of confirming factors present:
→ Momentum position (oversold/overbought extremes)
→ Momentum velocity (direction change confirmation)
→ Momentum acceleration (strength of reversal)
→ Multi-oscillator divergence (price vs. 3 oscillators)
→ Volume confirmation (above-average participation)
→ Volume delta analysis (buying vs. selling pressure)
→ Higher timeframe alignment (trend confirmation from larger timeframe)
→ Session timing (major forex session awareness)
→ Structure clearance (clear path to profit targets)
→ Support/resistance proximity (confluence with key levels)
→ Market regime filtering (trending vs. choppy conditions)
Signals are graded A+, A, or B based on how many factors align:
• CONSERVATIVE MODE: A+ requires 12+ factors, A requires 9+, B requires 7+
• BALANCED MODE: A+ requires 10+ factors, A requires 7+, B requires 5+
• AGGRESSIVE MODE: A+ requires 8+ factors, A requires 5+, B requires 3+
TRADE ANALYSIS STATE MACHINE
A sophisticated monitoring system that tracks trade conditions in real-time using:
→ 5-state analysis framework (Factors Aligned / Positive Bias / Mixed Signals / Factors Weakening / Negative Bias)
→ Hysteresis-based transitions (different thresholds to enter vs. exit states)
→ Confidence smoothing with EMA (reduces noise, prevents flip-flopping)
→ Minimum commitment periods before state changes
→ Override logic for significant events (near TP/SL, momentum reversals)
→ Result: Stable, actionable guidance that doesn't change on every bar
INSTRUMENT-AWARE CALIBRATION
Automatically detects what you're trading and applies optimized parameters:
→ Forex Majors: Standard ATR, high session weight
→ Forex Crosses: Tighter stops, moderate session weight
→ Crypto: Wider stops (1.8x multiplier), reduced session weight (24/7 markets)
→ Indices: Moderate-wide stops, high session weight
→ Commodities: Moderate stops, moderate session weight
WHAT THIS INDICATOR DOES
The Kinetic Scalper is designed to identify high-confluence reversal opportunities by analyzing multiple dimensions of market behavior simultaneously.
CORE FUNCTIONS:
1. SIGNAL GENERATION
→ Identifies potential reversal points at oversold/overbought extremes
→ Confirms with multi-oscillator divergence detection
→ Validates with volume, higher timeframe, and structural analysis
→ Filters out low-probability setups automatically
→ Grades signals based on total confluence factors present
2. AUTOMATED TRADE TRACKING
→ Calculates structure-based or ATR-based stop loss levels
→ Projects take profit targets using risk-to-reward ratios
→ Monitors live position status (P/L, distance to targets, R-multiple)
→ Tracks TP1 and TP2 hits automatically
→ Displays outcome markers (TP HIT, PARTIAL WIN, STOPPED)
3. REAL-TIME CONDITION MONITORING
→ Analyzes 6 factor categories during active trades
→ Provides confidence scoring (0-100 scale)
→ Generates actionable guidance based on current market state
→ Alerts when conditions deteriorate or improve
→ Helps with trade management decisions
4. COMPREHENSIVE MARKET ANALYSIS
→ Session detection (Asian, London, New York, Overlap)
→ Volatility regime identification (Low, Normal, High, Extreme)
→ Trend state classification (Trending Up/Down, Ranging, Transitioning)
→ Volume analysis (relative volume and delta approximation)
→ Choppiness filtering (blocks signals in ranging markets)
WHY USE THIS INDICATOR
PROBLEM: Most momentum indicators generate too many false signals at extremes.
SOLUTION: The Kinetic Scalper requires MULTIPLE confirming factors before generating a signal, dramatically reducing noise and focusing on high-confluence setups.
ADVANTAGES:
✓ QUALITY OVER QUANTITY
→ Signal grading ensures you can filter for only the highest-quality setups
→ A+ signals have 10-12+ confirming factors aligned
→ Cooldown periods prevent over-trading the same move
✓ COMPLETE TRADE FRAMEWORK
→ Entry signals with confluence justification
→ Calculated stop loss based on market structure or ATR
→ Two profit targets with clear risk-to-reward ratios
→ Live trade monitoring with factor analysis
→ Outcome tracking and visual markers
✓ ADAPTIVE TO MARKET CONDITIONS
→ Volatility-based period adjustment for momentum calculations
→ Instrument-specific ATR multipliers
→ Session awareness for forex traders
→ Higher timeframe trend filtering
→ Automatic regime detection (trending vs. choppy)
✓ TRANSPARENT METHODOLOGY
→ Every input has detailed tooltips explaining its purpose
→ Signal tooltips show exactly why a signal was generated
→ Dashboard displays all relevant market conditions
→ Factor scores are visible during trades
→ No "black box" mystery calculations
✓ NON-REPAINTING & RELIABLE
→ All signals use barstate.isconfirmed (only on closed bars)
→ Higher timeframe data uses lookahead_off with historical offset
→ No future data access or repainting behavior
→ What you see is what you get - signals don't disappear or move
HOW THE INDICATOR WORKS
SIGNAL GENERATION PROCESS:
STEP 1: MOMENTUM ANALYSIS
The Kinetic Pulse engine calculates volume-weighted momentum:
→ Price changes are weighted by volume ratio vs. 20-bar average
→ High-volume moves have more influence on the oscillator
→ Gains and losses are smoothed using EMA (not SMA like RSI)
→ Fisher Transform is applied for normalization to 0-100 scale
→ Result: Momentum reading that emphasizes conviction, not noise
STEP 2: REVERSAL DETECTION
The indicator looks for potential reversal conditions:
→ Kinetic Pulse reaching oversold zone (below dynamic lower threshold)
→ Momentum velocity turning positive after being negative (for longs)
→ OR bullish divergence detected on multiple oscillators
→ Price making lower lows while oscillators make higher lows = divergence
STEP 3: MULTI-OSCILLATOR DIVERGENCE CONFIRMATION
Divergence is validated across three sources:
→ Kinetic Pulse divergence
→ CCI divergence
→ Stochastic divergence
→ Multiple oscillators confirming divergence increases signal reliability
STEP 4: CONFLUENCE FACTOR SCORING
The system evaluates all 15 possible confirming factors:
→ Momentum position: Is pulse oversold/overbought? (+0 to +2 points)
→ Momentum direction: Is velocity reversing? (+0 to +2 points)
→ Momentum acceleration: Is reversal strengthening? (+0 to +1 point)
→ Divergence count: How many oscillators show divergence? (+0 to +2 points)
→ Volume strength: Is volume above 1.3x average? (+0 to +1 point)
→ Volume delta: Is cumulative delta positive/negative? (+0 to +1 point)
→ HTF alignment: Does higher timeframe support direction? (+0 to +2 points)
→ Session timing: Is it a prime trading session? (+0 to +1 point)
→ Clear air: Is path to targets clear of obstacles? (+0 to +1 point)
→ Structure confluence: Are we near support/resistance? (+0 to +1 point)
→ Market regime: Is market trending, not choppy? (+0 to +1 point)
Total possible score: 15 points
Minimum for signal: 3-12 points depending on sensitivity mode
STEP 5: FILTER VALIDATION
Before generating a signal, additional checks are performed:
→ Volume must be above minimum threshold (if filter enabled)
→ Higher timeframe must not oppose the signal direction (if filter enabled)
→ Target path must be clear of major resistance/support (if filter enabled)
→ Volatility must not be EXTREME (blocks signals in chaos)
→ Risk-to-reward ratio must meet minimum requirement
→ Cooldown period must have elapsed since last signal
STEP 6: SIGNAL GRADING
If all filters pass, the signal is graded based on score:
→ A+ Grade: Highest confluence (8-12+ factors depending on sensitivity)
→ A Grade: High confluence (5-9+ factors)
→ B Grade: Moderate confluence (3-7+ factors)
Only graded signals (A+, A, or B) are displayed.
STEP 7: TRADE LEVEL CALCULATION
Stop loss and targets are calculated automatically:
STOP LOSS METHODS:
• Structure-Based: Uses recent swing low/high with ATR buffer, constrained by min/max ATR limits
• ATR-Based: Pure ATR multiplier with min/max constraints
• Fixed ATR: Simple ATR multiplier, no adjustments
TARGET CALCULATION:
• TP1: Entry ± (Stop Distance × Target 1 R:R)
• TP2: Entry ± (Stop Distance × Target 2 R:R)
• Default: TP1 at 1.0 R:R (1:1), TP2 at 2.0 R:R (1:2)
STEP 8: TRADE MONITORING
Once a signal is taken, the indicator tracks:
→ Current P/L in ticks and R-multiples
→ Distance to each target in ATR units
→ Distance to stop loss in ATR units
→ TP1 hit detection (marks with label, updates lines)
→ TP2 hit detection (closes trade, marks outcome)
→ Stop loss hit detection (closes trade, differentiates partial vs. full loss)
STEP 9: FACTOR ANALYSIS (DURING TRADES)
The Trade Analysis Panel monitors 6 key factor categories:
→ Momentum: Is momentum still aligned with trade direction? (-15 to +15 pts)
→ Position: Current R-multiple position (-12 to +12 pts)
→ Volume: Is volume still supportive? (-6 to +6 pts)
→ HTF Alignment: Does HTF still support trade? (-6 to +8 pts)
→ Target Proximity: How close are we to targets? (0 to +10 pts)
→ Stop Proximity: Are we dangerously close to stop? (-15 to +3 pts)
Raw scores are summed and smoothed using 5-bar EMA to create Confidence Score (0-100).
STEP 10: STATE MACHINE TRANSITIONS
Based on smoothed confidence, the system transitions between 5 states:
→ FACTORS ALIGNED (72+): Everything looks good
→ POSITIVE BIAS (58-72): Conditions favorable
→ MIXED SIGNALS (48-58): Neutral conditions
→ FACTORS WEAKENING (22-48): Concerning signals
→ NEGATIVE BIAS (<22): Poor conditions
Hysteresis prevents rapid flipping between states (different entry/exit thresholds).
RECOMMENDED TIMEFRAMES & INSTRUMENTS
TIMEFRAME VERSATILITY:
Despite the name "Scalper," this indicator works on ALL timeframes:
✓ LOWER TIMEFRAMES (1m - 15m)
→ Ideal for: Scalping and very short-term trades
→ Expect: More signals, faster trades, requires active monitoring
→ Best for: Forex majors, liquid crypto pairs
→ Tip: Use Conservative sensitivity to reduce noise
✓ MID TIMEFRAMES (15m - 1H)
→ Ideal for: Intraday trading and day trading
→ Expect: Moderate signal frequency, 1-4 hour trade duration
→ Best for: Forex, indices, major crypto
→ Tip: Balanced sensitivity works well here
✓ HIGHER TIMEFRAMES (4H - Daily)
→ Ideal for: Swing trading and position trading
→ Expect: Fewer signals, higher-quality setups, multi-day trades
→ Best for: All instruments
→ Tip: Can use Aggressive sensitivity for more opportunities
INSTRUMENT COMPATIBILITY:
✓ FOREX MAJORS (EUR/USD, GBP/USD, USD/JPY, etc.)
→ Auto-detected or manually select "Forex Major"
→ Session filtering is highly valuable here
→ London/NY overlap generates best signals
✓ FOREX CROSSES (EUR/GBP, AUD/NZD, etc.)
→ Auto-detected or manually select "Forex Cross"
→ Slightly tighter stops applied automatically
→ Session weight reduced vs. majors
✓ CRYPTOCURRENCIES (BTC, ETH, SOL, etc.)
→ Auto-detected or manually select "Crypto"
→ Wider stops (1.8x multiplier) due to volatility
→ Session filtering less relevant (24/7 markets)
→ Works well on both spot and perpetual futures
✓ INDICES (S&P 500, NASDAQ, DAX, etc.)
→ Auto-detected or manually select "Index"
→ Session opens (NY, London) are important
→ Moderate stop widths applied
✓ COMMODITIES (Gold, Silver, Oil, etc.)
→ Auto-detected or manually select "Commodity"
→ Moderate stops and session awareness
→ Works well on both spot and futures
VISUAL ELEMENTS EXPLAINED
SIGNAL MARKERS:
The indicator offers 3 display styles (choose in settings):
• PREMIUM STYLE (Default)
→ Signal appears below/above candles with connecting line
→ Background panel with grade badge (LONG , SHORT , etc.)
→ Entry price displayed
→ Direction arrow pointing to entry candle
→ Most informative, best for detailed analysis
• MINIMAL STYLE
→ Simple dot marker with grade text next to it
→ Clean, unobtrusive design
→ Best for mobile devices or cluttered charts
→ Less visual noise
• CLASSIC STYLE
→ Diamond marker with grade badge below/above
→ Traditional indicator aesthetic
→ Good balance between info and simplicity
ALL STYLES INCLUDE:
→ Signal tooltips with complete trade plan details
→ Grade display (A+, A, or B)
→ Color coding (bright colors for A+, standard for A/B)
SIGNAL TOOLTIP CONTENTS:
When you hover over any signal marker, you'll see:
→ Signal direction and grade
→ Confluence score (actual points vs. required)
→ Reason for signal (divergence type, reversal pattern)
→ Complete trade plan (Entry, Stop, TP1, TP2)
→ Risk in ticks
→ Risk-to-reward ratios
→ Market conditions at signal (Pulse value, HTF status, Volume, Session)
TRADE LEVEL LINES:
When Trade Tracking is enabled:
• ENTRY LINE (Yellow/Gold)
→ Solid horizontal line at entry price
→ Shaded zone around entry (±ATR buffer)
→ Label showing entry price
→ Extends 20-25 bars into future
• STOP LOSS LINE (Orange/Red)
→ Dashed line at stop level
→ Label showing stop price and distance in ticks
→ Turns dotted and changes color after TP1 hit (breakeven implied)
→ Deleted when trade closes
• TAKE PROFIT 1 LINE (Blue)
→ Dotted line at TP1 level
→ Label showing price and R:R ratio (e.g., "1:1.0")
→ Turns solid and changes to green when hit
→ Deleted after TP1 hit
• TAKE PROFIT 2 LINE (Blue)
→ Solid line at TP2 level
→ Label showing price and R:R ratio (e.g., "1:2.0")
→ This is the "full win" target
→ Deleted when trade closes
OUTCOME MARKERS:
When trade milestones are reached:
• - Green label appears when first target is touched
• - Green label when second target is touched (trade complete)
• - Red label if stop loss hit before any target
• - Orange label if TP1 hit but then stopped out
PREVIOUS DAY LEVELS:
If enabled (Show Previous Day Levels):
• PDH (Previous Day High) - Solid red/orange line
→ Label shows "PDH: "
→ Useful resistance reference for intraday trading
• PDL (Previous Day Low) - Solid green line
→ Label shows "PDL: "
→ Useful support reference for intraday trading
BACKGROUND TINTS:
Subtle background colors indicate states:
→ Light green tint: Active long position being tracked
→ Light red tint: Active short position being tracked
→ Light orange tint: Extreme volatility warning (signals blocked)
DASHBOARD GUIDE
The indicator features TWO dashboard panels:
━━━━━━━━━━━━━━━━━━━━━━━━━━━━━━━━━━━━━━━━━━━━━━━━━━━━━━━━━━━━━━━━━━━━━━━━━━━━━
MAIN DASHBOARD (Top Right by default)
━━━━━━━━━━━━━━━━━━━━━━━━━━━━━━━━━━━━━━━━━━━━━━━━━━━━━━━━━━━━━━━━━━━━━━━━━━━━━
WHEN NO TRADE IS ACTIVE:
→ Bias: Current market bias (BULLISH, BEARISH, NEUTRAL, LEAN LONG/SHORT)
→ Based on Kinetic Pulse position and velocity
→ Helps you understand overall momentum direction
→ Pulse: Current Kinetic Pulse value (0-100 scale)
→ <30 = Oversold (potential long setups developing)
→ >70 = Overbought (potential short setups developing)
→ 40-60 = Neutral zone
→ Volatility: Current volatility regime (LOW, NORMAL, HIGH, EXTREME)
→ Calculated from ATR ratio vs. 100-period average
→ EXTREME volatility blocks all signals (too chaotic)
→ Trend: Market state classification
→ TREND UP / TREND DOWN: ADX > 25, directional movement clear
→ RANGING: ADX < 20, choppy conditions
→ TRANSITIONING: ADX 20-25, developing conditions
→ VOLATILE: Extreme ATR regime
→ Session: Current forex session
→ ASIAN (00:00-08:00 UTC)
→ LONDON (07:00-16:00 UTC)
→ NEW YORK (13:00-22:00 UTC)
→ LDN/NY (13:00-16:00 UTC) - Overlap period, highest volatility
→ OFF-HOURS: Outside major sessions
→ Volume: Current volume vs. 20-bar average
→ Displayed as multiplier (e.g., "1.45x" = 45% above average)
→ Green if >1.3x (high volume, bullish for signal quality)
→ Red if <0.8x (low volume, bearish for signal quality)
→ HTF: Higher timeframe analysis status
→ BULLISH: HTF momentum supports longs
→ BEARISH: HTF momentum supports shorts
→ NEUTRAL: No clear HTF direction
→ Best Score: Highest confluence score currently available
→ Shows both long and short scores
→ Format: " / "
→ Example: "8/7 " means long score is 8, threshold is 7, long is leading
→ Helps you anticipate which direction might signal next
→ PDH/PDL: Previous day high and low prices
→ Quick reference for intraday support/resistance
WHEN TRADE IS ACTIVE:
→ Trade: Direction and grade (e.g., "LONG ")
→ Entry: Entry price of current trade
→ P/L: Current profit/loss
→ Shown in ticks and R-multiples
→ Format: "+45 | +0.75R" or "-20 | -0.35R"
→ Green when positive, red when negative
→ TP1: First target status
→ Shows price and distance if not hit
→ Shows "HIT" in green if reached
→ TP2: Second target price and distance
→ Stop: Stop loss price and current distance from stop
→ Bars: Number of bars since entry (trade duration)
━━━━━━━━━━━━━━━━━━━━━━━━━━━━━━━━━━━━━━━━━━━━━━━━━━━━━━━━━━━━━━━━━━━━━━━━━━━━━
TRADE ANALYSIS PANEL (Bottom Left by default)
━━━━━━━━━━━━━━━━━━━━━━━━━━━━━━━━━━━━━━━━━━━━━━━━━━━━━━━━━━━━━━━━━━━━━━━━━━━━━
This panel provides algorithmic analysis of market conditions. It does NOT provide investment advice or recommendations.
WHEN NO TRADE IS ACTIVE:
Shows scanning status and signal readiness:
→ Long/Short Readiness Gauges
→ Visual bar showing proximity to signal threshold
→ Score display (e.g., "8/7" means 8 points scored, 7 needed)
→ "RDY" indicator when threshold reached
→ Status Messages
→ "Scanning for setups..." - Normal scanning mode
→ "Long setup ready - cooldown: X bars" - Signal qualified but in cooldown
→ "Oversold conditions - watch for reversal" - Setup developing
→ "Choppy conditions detected" - Warning about market state
→ "Extreme volatility - signals blocked" - Safety filter active
WHEN TRADE IS ACTIVE:
Header shows current analysis state:
→ FACTORS ALIGNED (Green) - Everything looks good, confidence 72+
→ POSITIVE BIAS (Light Green) - Conditions favorable, confidence 58-72
→ MIXED SIGNALS (Blue) - Neutral conditions, confidence 48-58
→ FACTORS WEAKENING (Orange) - Concerning signals, confidence 22-48
→ NEGATIVE BIAS (Red) - Poor conditions, confidence <22
Confidence Score:
→ Displayed as percentage (0-100%)
→ Visual gauge (|||||.....)
→ Trend indicator (Rising, Falling, Stable)
→ Shows momentum of confidence change
Factor Breakdown (if enabled):
Shows 6 factor categories with individual scores:
→ Momentum: Is momentum aligned with trade? (-15 to +15 points)
→ Positive if velocity matches trade direction
→ Negative if momentum opposes trade
→ Position: Current R-multiple analysis (-12 to +12 points)
→ Positive if trade is in profit
→ Negative if underwater
→ Score increases as profit grows
→ Volume: Is volume supportive? (-6 to +6 points)
→ Positive if volume above average
→ Negative if volume weak
→ HTF Align: Higher timeframe status (-6 to +8 points)
→ Positive if HTF still supports trade direction
→ Negative if HTF turned against trade
→ Target: Proximity to profit targets (0 to +10 points)
→ Higher score when approaching targets
→ Bonus if TP1 already hit and near TP2
→ Stop Dist: Distance from stop loss (-15 to +3 points)
→ Negative if dangerously close to stop (<0.3 ATR)
→ Positive if well away from stop (>1.5 ATR)
Each factor shows:
• Score value with +/- indicator
• Trend symbol: + (improving), - (deteriorating), = (stable)
• Visual gauge
Guidance Messages:
→ "TARGET 2 APPROACHING" - TP2 within 0.3 ATR
→ "TARGET 1 APPROACHING" - TP1 within 0.3 ATR
→ "STOP PROXIMITY WARNING" - Stop within 0.3 ATR
→ "Factors aligned - Holding" - Positive state, stay in trade
→ "Conditions favorable" - Still looking good
→ "Conditions mixed - " - Neutral assessment
→ "Factors deteriorating" - Warning of weakening setup
→ "Confluence weakening - secure gains" - Consider exit if profitable
COMPACT MODE (Mobile-Friendly):
→ Reduces panel size by showing only essential info
→ Factor icons instead of full breakdowns
→ Simplified guidance messages
→ Perfect for smaller screens
SETTINGS GUIDE
MASTER SETTINGS:
Instrument Type
→ Purpose: Optimizes ATR multipliers and session weights for your asset
→ Options: Auto-Detect (recommended), Forex Major, Forex Cross, Crypto, Index, Commodity
→ Default: Auto-Detect
→ When to change: If auto-detection is incorrect for your symbol
Signal Sensitivity
→ Purpose: Controls how many factors required before generating signals
→ Options:
• Conservative: Requires 12+ for A+, 9+ for A, 7+ for B (fewer, highest quality)
• Balanced: Requires 10+ for A+, 7+ for A, 5+ for B (recommended)
• Aggressive: Requires 8+ for A+, 5+ for A, 3+ for B (more frequent)
→ Default: Balanced
→ When to change: If you want fewer signals (Conservative) or more opportunities (Aggressive)
Enable Trade Signals
→ Purpose: Master on/off switch for signal generation
→ Default: ON
→ When to disable: If you only want to use the analysis dashboards without signals
Enable Trade Tracking
→ Purpose: Tracks active trades and monitors conditions until TP/SL hit
→ Default: ON
→ When to disable: If you manage trades manually and don't want automatic tracking
Show Entry/Stop/Target Levels
→ Purpose: Displays trade plan lines and labels on chart
→ Default: ON
→ When to disable: If you prefer clean charts or manage levels yourself
DISPLAY SETTINGS:
Color Theme
→ Purpose: Optimizes colors for your chart background
→ Options: Dark (for dark charts), Light (for light charts)
→ Default: Dark
Signal Display Style
→ Purpose: Visual style of signal markers
→ Options:
• Premium: Badge with line and background panel (most detailed)
• Minimal: Simple dot with grade text (cleanest)
• Classic: Diamond marker with badge (traditional)
→ Default: Premium
Signal Distance
→ Purpose: How far signal labels appear from price bars (in ATR units)
→ Range: 0.5 to 10.0
→ Default: 2.0
→ When to adjust: Increase to 3.0-4.0 if signals hide behind candle wicks
TP/SL Label Distance
→ Purpose: Spacing of price labels to prevent overlap
→ Range: 0.5 to 5.0
→ Default: 1.5
Show Previous Day Levels
→ Purpose: Display PDH/PDL reference lines
→ Default: ON
→ Best for: Intraday traders who respect previous day levels
MAIN DASHBOARD:
Show Main Dashboard
→ Purpose: Toggle visibility of market conditions table
→ Default: ON
Main Dashboard Position
→ Options: Top Right, Top Left, Bottom Right, Bottom Left
→ Default: Top Right
→ When to change: To avoid overlap with TradingView's built-in panels
TRADE ANALYSIS PANEL:
Show Trade Analysis Panel
→ Purpose: Toggle factor analysis dashboard
→ Default: ON
Analysis Panel Position
→ Options: Top Right, Top Left, Bottom Right, Bottom Left, Middle Right, Middle Left
→ Default: Bottom Left
→ Recommended: Bottom Right or Middle Right to avoid overlap with Main Dashboard
Compact Mode
→ Purpose: Reduces panel size for mobile or smaller screens
→ Default: OFF
→ When to enable: Mobile trading, small screens, or minimalist preference
Show Factor Details
→ Purpose: Displays individual factor scores vs. overall confidence only
→ Default: ON
→ When to disable: For more compact view showing only state and confidence
RISK MANAGEMENT:
Stop Loss Method
→ Purpose: How stop loss distance is calculated
→ Options:
• Structure-Based: Uses swing highs/lows with ATR buffer (recommended)
• ATR-Based: Pure ATR multiplier with min/max constraints
• Fixed ATR: Simple multiplier, no adjustments
→ Default: Structure-Based
→ Impact: Structure-Based respects market geometry but constrains within safe limits
ATR Stop Multiplier
→ Purpose: Multiplier for ATR-based stop calculation
→ Range: 0.5 to 3.0
→ Default: 1.5
→ When to adjust:
• Increase to 2.0-2.5 for more breathing room (fewer false stops)
• Decrease to 1.0-1.2 for tighter stops (but more stop-outs)
Maximum Stop Distance (ATR)
→ Purpose: Cap on stop width to prevent excessive risk
→ Range: 1.0 to 5.0
→ Default: 2.5
→ Impact: If structure-based stop exceeds this, ATR-based stop is used instead
Minimum Stop Distance (ATR)
→ Purpose: Floor on stop width to avoid noise-induced stops
→ Range: 0.2 to 1.0
→ Default: 0.5
→ Impact: Prevents stops too tight to survive normal volatility
Target 1 Risk/Reward Ratio
→ Purpose: R:R for first profit target
→ Range: 0.5 to 2.0
→ Default: 1.0 (1:1 ratio)
→ Common values: 1.0 for quick profit taking, 1.5 for patient trading
Target 2 Risk/Reward Ratio
→ Purpose: R:R for second profit target (full win)
→ Range: 1.0 to 4.0
→ Default: 2.0 (1:2 ratio)
→ Common values: 2.0-3.0 for balanced risk/reward
Minimum R:R Required
→ Purpose: Filters out signals with poor risk/reward
→ Range: 0.5 to 2.0
→ Default: 1.0
→ Impact: Signals where potential reward doesn't meet this ratio are rejected
→ WARNING: Always ensure your position sizing means a stop loss = no more than 1-2% of your account, regardless of R:R ratio
SIGNAL FILTERS:
Session Awareness
→ Purpose: Weights signals higher during major forex sessions
→ Default: ON
→ Impact: Doesn't block signals, but session quality factors into scoring
→ Best for: Forex traders
Session Timezone
→ Purpose: Timezone for session calculations
→ Options: UTC, America/New_York, Europe/London, Asia/Tokyo, Asia/Hong_Kong
→ Default: UTC
→ When to change: Match your broker's server time
Higher Timeframe Alignment
→ Purpose: Checks HTF momentum before generating signals
→ Default: ON
→ Impact: Filters counter-trend signals, improves quality
→ Recommended: Keep enabled
HTF Timeframe
→ Purpose: Which higher timeframe to check
→ Default: Auto (blank field)
→ Auto selection:
• 1m chart → 5m HTF
• 5m chart → 15m HTF
• 15m chart → 1H HTF
• 1H chart → 4H HTF
• 4H+ chart → Daily HTF
→ Manual override: Enter any timeframe (e.g., "60" for 1-hour)
Volume Confirmation
→ Purpose: Requires above-average volume for signals
→ Default: ON
→ Impact: Filters low-liquidity false signals
→ Recommended: Keep enabled
Minimum Volume Ratio
→ Purpose: Volume threshold vs. 20-bar average
→ Range: 0.3 to 2.0
→ Default: 0.8 (80% of average)
→ When to adjust:
• Increase to 1.2-1.5 for only high-volume signals
• Decrease to 0.5-0.7 for more permissive filtering
Structure Clearance Check
→ Purpose: Ensures clear path to targets (no nearby resistance/support)
→ Default: ON
→ Impact: Prevents trades with immediate obstacles
→ Recommended: Keep enabled
Minimum Bars Between Signals
→ Purpose: Cooldown period after each signal
→ Range: 1 to 10
→ Default: 3
→ Impact: After a signal, this many bars must pass before another in same direction
→ When to adjust:
• Increase to 5-7 to prevent over-trading
• Decrease to 1-2 for faster re-entries
ADVANCED TUNING:
Momentum Period
→ Purpose: Base period for Kinetic Pulse calculation
→ Range: 5 to 30
→ Default: 14
→ When to adjust:
• Lower (8-10): More responsive, noisier
• Higher (18-21): Smoother, slower to react
→ Note: If Adaptive Period enabled, this is adjusted automatically
Adaptive Period
→ Purpose: Auto-adjusts momentum period based on volatility
→ Default: ON
→ Impact: Shortens period in high volatility, lengthens in low volatility
→ Recommended: Keep enabled for automatic optimization
Divergence Lookback
→ Purpose: How far back to search for divergence patterns
→ Range: 10 to 60
→ Default: 30
→ When to adjust:
• Shorter (15-20): Only recent divergences
• Longer (40-50): Catches older divergences (may be less relevant)
Swing Detection Bars
→ Purpose: Bars required on each side to confirm swing high/low
→ Range: 2 to 7
→ Default: 3
→ Impact on stops:
• Lower (2-3): More swing points, potentially tighter stops
• Higher (5-7): Only major swings, wider stops
Choppiness Index Threshold
→ Purpose: Threshold above which market considered choppy
→ Range: 38.2 to 80.0
→ Default: 61.8
→ Impact:
• Lower (50-55): Stricter quality filter (fewer signals in ranging markets)
• Higher (65-70): More permissive (allows signals in choppier conditions)
HOW TO READ SIGNALS
SIGNAL ANATOMY:
When a signal appears, you'll see:
1. DIRECTIONAL MARKER
→ Arrow, dot, or diamond pointing to entry candle (depends on style)
→ Positioned below price for LONG, above price for SHORT
→ Connected to price with line (Premium style)
2. GRADE BADGE
→ Displays signal quality: LONG , SHORT , etc.
→ Color coding:
• Bright green/cyan for A+ longs
• Standard green for A/B longs
• Bright pink/magenta for A+ shorts
• Standard red for A/B shorts
3. ENTRY PRICE (Premium style only)
→ Shows exact entry price at signal generation
4. TOOLTIP (all styles)
→ Hover over signal to see complete trade plan
→ Includes: Entry, Stop, TP1, TP2, Risk, R:R ratios, market conditions, signal reason, confluence score
INTERPRETING GRADES:
→ A+ SIGNALS (Highest Quality)
• 8-12+ confirming factors aligned
• Multiple divergences OR strong momentum reversal
• HTF alignment + volume + session timing + clear structure
• These are your highest-probability setups
• Recommended action: Give these priority, consider larger position size
→ A SIGNALS (High Quality)
• 5-9+ confirming factors aligned
• Good confluence, most key factors present
• Missing 1-2 optimal conditions
• These are still quality trades
• Recommended action: Standard position size, solid setups
→ B SIGNALS (Moderate Quality)
• 3-7+ confirming factors aligned
• Minimum viable confluence
• May be missing HTF alignment, volume, or session timing
• Higher variance outcomes
• Recommended action: Smaller position size or skip if conservative
SIGNAL NARRATIVE:
Each signal tooltip includes a narrative explaining WHY it was generated:
→ "Multi-divergence at oversold extreme"
• Multiple oscillators showing bullish divergence
• Kinetic Pulse in oversold zone
• High-quality reversal setup
→ "Bullish divergence near support"
• Divergence detected
• Price near key support level (swing low or PDL)
• Structure confluence
→ "Momentum reversal with HTF alignment"
• Kinetic Pulse velocity reversing
• Higher timeframe supports direction
• Strong trend-following setup
→ "Oversold momentum reversal"
• Extreme Kinetic Pulse reading reversing
• May not have divergence but strong momentum shift
READING THE TRADE PLAN:
Every signal comes with a complete trade plan:
→ ENTRY: The close price of the signal candle
• This is where the signal triggered
• If using limit orders, you might improve on this price
→ STOP: Calculated stop loss level
• Based on your Stop Loss Method setting
• Distance shown in ticks
• Risk tolerance: Ensure this represents ≤1-2% of your account
→ TP1: First profit target
• Default: 1:1 risk-reward
• This is your partial profit or first exit
• Consider taking 50% off at TP1
→ TP2: Second profit target
• Default: 1:2 risk-reward
• This is your "full win" target
• Hold remaining position for this level
SIGNAL FREQUENCY EXPECTATIONS:
Frequency varies by timeframe, sensitivity, and market conditions:
→ AGGRESSIVE MODE
• Lower timeframes (1m-5m): 5-15 signals per day
• Mid timeframes (15m-1H): 2-5 signals per day
• Higher timeframes (4H-D): 1-3 signals per week
→ BALANCED MODE (Default)
• Lower timeframes: 3-8 signals per day
• Mid timeframes: 1-3 signals per day
• Higher timeframes: 2-5 signals per week
→ CONSERVATIVE MODE
• Lower timeframes: 1-4 signals per day
• Mid timeframes: 0-2 signals per day
• Higher timeframes: 1-3 signals per week
Note: Frequency also depends on market volatility and trending vs. ranging conditions.
Example - Kinetic Scalper Trade Sequence
Here's an example showing the complete trade lifecycle with all dashboard transitions, annotations, and descriptions.
INSTRUMENT & TIMEFRAME DETAILS
Symbol: Nifty 50 Index (NSE)
Date: December 15, 2025
Session: London session (active trading hours)
Instrument Type: Index (auto-detected)
TRADE SEQUENCE BREAKDOWN
SCREENSHOT 1: Pre-Signal Setup Building (Image 1)
Time: ~12:00-14:30 UTC+5:30(approx.)
Price Action: Uptrend showing signs of exhaustion near 26,200
Market State: Price at session highs
Main Dashboard (Top Right):
- Bias: LEAN SHORT
- Pulse: 58.9 (approaching overbought)
- Volatility: NORMAL
- Trend: TRANSITIONING
- Session: LONDON (favorable timing)
- Volume: 0.98x (slightly below average)
- HTF: BULLISH (caution for counter-trend)
- Best Score: 9/5 (Short score building)
- PDH/PDL: 26098.25 / 25938.95
Trade Analysis Panel (Bottom Left):
- Status: NO ACTIVE TRADE
- Long Score: 5/5 (RDY)
- Short Score: 9/5 (RDY)
- Panel Message: "Short pattern developing - score: 9"
Description :
Setup Development Phase: The indicator identifies a potential short opportunity as price reaches the previous day's high. The short confluence score has climbed to 9/15 points, meeting the 'Balanced' sensitivity threshold for a Grade B signal. Notice the 'LEAN SHORT' bias and the Kinetic Pulse reading of 58.9 approaching overbought territory. The Trade Analysis panel shows 'Short pattern developing' with 9/5 factors aligned. Key factors: momentum approaching reversal zone, price at resistance (PDH), and London session providing favorable conditions.
SCREENSHOT 2: Signal Generated & Trade Entered (Image 2)
Time: ~13:00 UTC+5:30 (signal bar)
Entry Price: 26,184.65
Signal Grade: Grade
Main Dashboard (Top Right):
- Trade: SHORT
- Entry: 26184.65
- P/L: 5.95 pts | +0.2R (early positive movement)
- TP1: 26157.00 (33.2 pts away)
- TP2: 26129.35 (60.84 pts away)
- Stop: 26212.30 (22.1 pts away)
- Bars: 1 (just entered)
Trade Analysis Panel (Bottom Left):
- Header: TRADE ANALYSIS
- Status Bar: "Conditions mixed - improving 57%"
- Confidence: 57% RISING
- Factor Breakdown:
- Momentum: -4 (velocity not yet aligned)
- Position: +4 (slight profit)
- Volume: +2 = (volume present)
- HTF Align: +2 = (not strongly aligned)
- Target: +0 - (far from TP)
- Stop Dist: +3 - (good distance)
- Bottom Status: "Conditions mixed - Monitoring"
- Disclaimer: "Analysis only - Not financial advice"
Description:
Signal Activation: A Grade A short signal triggers at 26,184.65 after the short confluence score reached qualifying levels. The indicator places a structure-based stop loss at 26,212.30 (27.65 points risk) with dual targets at 1:1 and 1:2 risk-reward ratios.
The Trade Analysis Panel immediately begins monitoring with an initial confidence score of 57% - classified as 'MIXED SIGNALS' but showing a 'RISING' trend. Factor analysis reveals: momentum not yet aligned (-4 points as price just reversed), position slightly favorable (+4 points already +0.2R), volume adequate (+2), HTF showing weak alignment (+2 as we're counter-trend), stop well-placed (+3), but targets still distant (0 points).
Notice how the Main Dashboard switches from market scanning mode to active trade tracking, now displaying entry price, live P/L in both points (5.95 pts) and R-multiples (+0.2R), and distances to all key levels. The analysis panel provides real-time factor scoring to help monitor trade health.
SCREENSHOT 3: TP1 Hit - Trade Performing Well (Image 3)
Time: ~14:20 UTC+5:30(approx)
Price: ~26,154 (TP1 zone)
Bars in Trade: 29
Main Dashboard (Top Right):
- Trade: SHORT
- Entry: 26184.65
- P/L: 30.85 pts | +1.12R (excellent progress)
- TP1: HIT (displayed in green)
- TP2: 26129.35 (24.44 pts away)
- Stop: 26212.30 (58.5 pts away - well protected)
- Bars: 29
Trade Analysis Panel (Bottom Left):
- Header: TRADE ANALYSIS
- Status Bar: "Multiple factors positive"
- Confidence: 78% RISING
- Factor Breakdown:
- Momentum: +8 = (ALIGNED)
- Position: +8 + (strong profit zone)
- Volume: +2 + (continued support)
- HTF Align: +8 = (now strongly aligned)
- Target: +10 + (TP1 achieved, approaching TP2)
- Stop Dist: +3 + (excellent cushion)
- Bottom Status: "Multiple factors positive"
- Visual State: Green background (FACTORS ALIGNED state)
Description:
Trade Execution Phase - First Target Achieved: After 29 bars , price reaches the first take-profit target at 26,157.00. The ' ' marker confirms partial profit taking. Current P/L shows +30.85 points (+1.12R), exceeding the initial 1:1 risk-reward.
The Trade Analysis Panel shows dramatic improvement - confidence has surged to 78% (FACTORS ALIGNED state) with most factors now positive:
- Momentum factor improved to +8 (velocity aligned with trade direction)
- Position factor at +8 (over +1R profit zone)
- HTF Align jumped to +8 (higher timeframe now confirming the move)
- Target factor maxed at +10 (TP1 achieved, TP2 within reach)
- Stop Distance at +3 (58.5 points cushion providing safety)
Notice the panel status displays 'Multiple factors positive' with a green-tinted background, indicating optimal trade conditions. The confidence trend shows 'RISING' suggesting continued momentum. With TP1 secured and only 24.44 points to TP2, the trade is well-positioned for a full 1:2R win.
SCREENSHOT 4: TP2 Reached - Trade Complete (Image 4)
Time: ~15:00+ UTC+5:30
Final Exit: 26,129.35 (TP2)
Final Result: Full TP2 win
Main Dashboard (Top Right):
- Bias: NEUTRAL (reverted to scanning mode)
- Pulse: 45.2 (returned to neutral zone)
- Volatility: NORMAL
- Trend: TREND DOWN (confirmed the move)
- Session: LONDON
- Volume: 1.26x (increased as move developed)
- HTF: BEARISH (fully aligned post-trade)
- Best Score: 5/5 (neutral after completion)
Trade Analysis Panel (Bottom Left):
- Status: NO ACTIVE TRADE (reverted)
- Long Score: 5/5 (RDY)
- Short Score: 5/5 (RDY)
- Panel Message: "Scanning - prime session active"
- Light blue/cyan background (back to scanning mode)
Description:
Trade Completion - Full Target Achieved: The short trade reaches its second take-profit target at 26,129.35, securing a complete 1:2 risk-reward win. The ' ' marker confirms the exit. Final results:
- Entry: 26,184.65
- Exit: 26,129.35
- Profit: 55.30 points (approximately +2.0R)
- Outcome: Full TP2 success
Post-Trade Analysis: After trade closure, the indicator automatically returns to market scanning mode. The Main Dashboard reverts to showing market conditions rather than trade metrics. Notice how the 'Trend' now displays 'TREND DOWN' - confirming the move we captured. Volume increased to 1.26x during the winning move, validating the signal quality.
The Trade Analysis Panel switches back to 'NO ACTIVE TRADE' status and resumes displaying long/short setup scores. The confidence-based factor monitoring was instrumental throughout the trade:
- Initial entry at 57% confidence (MIXED SIGNALS)
- Peak confidence of 78% at TP1 (FACTORS ALIGNED)
- Real-time factor updates helped confirm trade validity
This example demonstrates the indicator's complete workflow: setup identification → signal generation → entry execution → live trade monitoring → systematic exit at targets.
KEY FEATURES DEMONSTRATED
1. Dual Dashboard System
- Main Dashboard: Market conditions (scanning) → Trade metrics (active position)
- Analysis Panel: Setup scores (scanning) → Factor-based confidence (in-trade)
2. Visual Trade Management
- Color-coded entry zones (yellow)
- Risk levels clearly marked (red dashed stop)
- Profit targets with R:R ratios labeled
- Achievement markers ( , )
3. Real-Time Factor Analysis
- 6-factor scoring system (Momentum, Position, Volume, HTF, Target, Stop Dist)
- Confidence percentage with trend indicators
- State machine (MIXED → FACTORS ALIGNED)
- Hysteresis prevents false state changes
4. Risk Management
- Structure-based stop placement (respects swing highs)
- Multiple take-profit levels (1:1 and 1:2 R:R)
- Live P/L tracking in points and R-multiples
- Distance monitoring to all key levels
This complete example showcases the indicator's progression from setup identification through trade completion, demonstrating how the dual-dashboard system and factor-based analysis provide continuous trade guidance. The structured stop-loss and dual-target approach delivered the planned 1:2 risk-reward ratio with systematic, rule-based execution.
ALERT SYSTEM
The indicator includes 9 built-in alert conditions:
SIGNAL ALERTS:
→ High-Grade Long Signal (A+)
• Triggers only on A+ long signals
• For traders who want only the highest-quality longs
• Message: "KINETIC SCALPER: LONG @ "
→ High-Grade Short Signal (A+)
• Triggers only on A+ short signals
• For traders who want only the highest-quality shorts
• Message: "KINETIC SCALPER: SHORT @ "
→ Long Signal
• Triggers on ANY qualified long signal (A+, A, or B)
• For traders who want all long opportunities
• Message: "KINETIC SCALPER: LONG @ "
→ Short Signal
• Triggers on ANY qualified short signal
• For traders who want all short opportunities
• Message: "KINETIC SCALPER: SHORT @ "
TRADE MANAGEMENT ALERTS:
→ TP1 Hit
• Triggers when first profit target is reached
• Useful for partial profit taking notifications
• Message: "KINETIC SCALPER: TP1 REACHED"
→ TP2 Reached
• Triggers when second profit target is reached
• Trade is complete, full win achieved
• Message: "KINETIC SCALPER: TP2 REACHED"
→ Stop Loss Hit
• Triggers when stop loss is reached
• Important for trade management and risk tracking
• Message: "KINETIC SCALPER: STOP LOSS"
ANALYSIS STATE ALERTS:
→ Analysis State: Negative Bias
• Triggers when factor analysis enters "Negative Bias" state
• Warning that trade conditions are deteriorating
• Consider reducing position or preparing to exit
• Message: "KINETIC SCALPER: Analysis state changed to NEGATIVE BIAS"
→ Analysis State: Factors Weakening
• Triggers when factor analysis enters "Factors Weakening" state
• Caution that confluence is diminishing
• Monitor trade closely
• Message: "KINETIC SCALPER: Analysis state changed to FACTORS WEAKENING"
HOW TO SET UP ALERTS:
1. Click the "Create Alert" button in TradingView
2. Condition: Select "Kinetic Scalper "
3. Choose your desired alert from the dropdown
4. Configure your alert options:
→ Once Per Bar Close (recommended for non-repainting)
→ Frequency: Once Per Bar Close or Only Once
5. Set expiration and notification methods (popup, email, webhook, etc.)
6. Create alert
RECOMMENDED ALERT STRATEGY:
For active traders:
→ Set "Long Signal" and "Short Signal" alerts for all opportunities
→ Set "TP1 Hit", "TP2 Reached", and "Stop Loss Hit" for trade management
→ Consider "Analysis State: Negative Bias" for trade monitoring
For selective traders:
→ Set only "High-Grade Long Signal (A+)" and "High-Grade Short Signal (A+)"
→ Focus on the absolute highest-quality setups
→ Set TP/SL alerts for position management
USAGE TIPS & BEST PRACTICES
SIGNAL SELECTION:
✓ GRADE MATTERS
→ A+ signals have statistically more confluence factors
→ If you're conservative, trade only A+ signals
→ B signals can work but require more discretion
✓ CONFLUENCE WITH YOUR ANALYSIS
→ Use this indicator as CONFIRMATION, not sole decision criteria
→ Combine with your own support/resistance analysis
→ Check for fundamental events (news, economic data)
→ Respect major round numbers and psychological levels
✓ SESSION TIMING (Forex)
→ Best signals often occur during London/NY overlap
→ Avoid signals 10 minutes before major news releases
→ Asian session signals can be valid but lower liquidity
✓ TIMEFRAME CONFLUENCE
→ If you get an A+ signal on 15m, check if 1H chart agrees
→ Higher timeframe confirmation adds conviction
→ Avoid signals that oppose the daily/4H trend
TRADE MANAGEMENT:
✓ POSITION SIZING
→ ALWAYS size positions so stop loss = 1-2% of account
→ Never risk more than you can afford to lose
→ Smaller position on B signals, standard on A, larger on A+ (within limits)
✓ PARTIAL PROFIT TAKING
→ Consider taking 50% off at TP1
→ Move stop to breakeven after TP1 hit
→ Let remaining position run to TP2
✓ TRAILING STOPS
→ The indicator doesn't auto-trail stops (manual decision)
→ After TP1, you might manually move stop to entry (breakeven)
→ Consider ATR-based trailing stop for runners
✓ WATCH THE ANALYSIS PANEL
→ If state changes to "Factors Weakening" while in profit, consider exit
→ "Negative Bias" during a trade is a strong warning
→ "Factors Aligned" confirms your trade thesis is still valid
RISK MANAGEMENT:
✓ NEVER IGNORE STOPS
→ The calculated stop is there for a reason
→ Moving stop further away increases risk exponentially
→ If stopped out, accept it and wait for next setup
✓ AVOID REVENGE TRADING
→ If you get stopped out, resist urge to immediately re-enter
→ Signal cooldown helps with this
→ Wait for next qualified signal
✓ RESPECT VOLATILITY WARNINGS
→ If indicator shows "EXTREME" volatility, signals are blocked for a reason
→ Don't force trades in chaotic conditions
→ Wait for regime to normalize
✓ CORRELATION RISK
→ Be aware of correlation if trading multiple pairs
→ EUR/USD and GBP/USD are highly correlated
→ Don't stack risk on correlated instruments
OPTIMIZATION:
✓ START WITH DEFAULTS
→ Default settings are well-tested
→ Don't over-optimize for recent market behavior
→ Give settings at least 20-30 trades before judging
✓ TIMEFRAME-SPECIFIC ADJUSTMENTS
→ Lower timeframes: Consider increasing Signal Distance to 3.0-4.0
→ Higher timeframes: ATR Stop Multiplier might go to 2.0-2.5
→ Crypto: Ensure Instrument Type is set to "Crypto" for proper stops
✓ SENSITIVITY CALIBRATION
→ Too many signals? Switch to Conservative
→ Missing good setups? Try Balanced or Aggressive
→ Quality > Quantity always
✓ KEEP A JOURNAL
→ Track which signal grades work best for you
→ Note which sessions produce best results
→ Review stopped trades for patterns
THINGS TO AVOID:
✗ DON'T chase signals after several bars have passed
✗ DON'T ignore the stop loss or move it further away
✗ DON'T overtrade by taking every B-grade signal
✗ DON'T trade during major news if you're not experienced
✗ DON'T use this as your only analysis tool
✗ DON'T expect 100% win rate (no indicator has this)
✗ DON'T risk more than 1-2% per trade regardless of signal grade
UNDERSTANDING THE METHODOLOGY
WHY VOLUME WEIGHTING?
Traditional momentum oscillators treat all price moves equally. A 10-point move on low volume is weighted the same as a 10-point move on high volume.
The Kinetic Pulse corrects this by:
→ Calculating volume ratio vs. 20-bar average
→ Applying square root transformation to volume ratio (prevents extreme weights)
→ Multiplying price changes by volume weight
→ Result: High-volume moves influence the oscillator more than low-volume noise
This helps filter false breakouts and emphasizes moves with participation.
WHY FISHER TRANSFORM?
Fisher Transform is a mathematical transformation that:
→ Normalizes probability distributions
→ Creates sharper turning points
→ Amplifies extremes while compressing the middle
→ Makes overbought/oversold levels more distinct
Applied to the Kinetic Pulse, it helps identify genuine extremes vs. noise.
WHY MULTI-OSCILLATOR DIVERGENCE?
Single-source divergence can give false signals. By requiring divergence confirmation across multiple oscillators (Kinetic Pulse, CCI, Stochastic), the system filters out:
→ Divergences caused by calculation quirks in one oscillator
→ Temporary momentum anomalies
→ False divergence on noisy, low-timeframe charts
Multiple sources confirming the same pattern increases reliability.
WHY ADAPTIVE PERIODS?
Fixed periods can be:
→ Too slow during high volatility (miss fast reversals)
→ Too fast during low volatility (generate noise)
The adaptive system:
→ Shortens period when ATR ratio > 1.3 (high volatility = need faster response)
→ Lengthens period when ATR ratio < 0.7 (low volatility = need noise filtering)
→ Keeps period in reasonable range (60% to 140% of base period)
→ Result: Oscillator adjusts to current market pace automatically
WHY HYSTERESIS IN STATE MACHINE?
Without hysteresis, the analysis state would flip-flop on every bar, creating:
→ Confusing, contradictory guidance
→ Analysis paralysis
→ Lack of actionable information
Hysteresis solves this by:
→ Using different thresholds to ENTER vs. EXIT a state
→ Example: Enter "Factors Aligned" at 72+ confidence, but don't exit until <62
→ This creates stable states that persist through minor fluctuations
→ Requires minimum commitment period (3 bars) before state changes
→ Overrides commitment for significant events (near TP/SL)
→ Result: Stable, trustworthy analysis that changes only when truly warranted
WHY CONFIDENCE SMOOTHING?
Raw factor scores fluctuate bar-by-bar based on momentary conditions. Smoothing:
→ Uses 5-period EMA on raw confidence scores
→ Filters out single-bar anomalies
→ Preserves genuine trends in confidence
→ Prevents false state transitions
→ Result: More reliable assessment of actual trade health
WHY INSTRUMENT-SPECIFIC PARAMETERS?
Different instruments have different characteristics:
→ Forex is highly liquid, respects technical levels well, standard ATR works
→ Crypto is extremely volatile, needs wider stops (1.8x) to avoid false stops
→ Indices respect session opens strongly, session weighting is important
→ Commodities fall in between
Auto-detection applies research-based multipliers automatically.
WHY STRUCTURE-BASED STOPS?
ATR-based stops can:
→ Place stop in middle of consolidation (easily hit)
→ Ignore obvious invalidation levels
→ Be too tight during expansion or too wide during contraction
Structure-based stops:
→ Use actual swing highs/lows (where traders actually place stops)
→ Add small ATR buffer to avoid stop hunting
→ Constrain within min/max ATR limits for safety
→ Result: Stops that respect market geometry while managing risk
DISCLAIMER & RISK WARNING
READ THIS CAREFULLY BEFORE USING THIS INDICATOR
This indicator is provided for EDUCATIONAL and INFORMATIONAL purposes only.
❌ NOT FINANCIAL ADVICE
This indicator does NOT constitute financial advice, investment recommendations, or solicitation to buy or sell any financial instrument. All information is for educational purposes only.
❌ NO GUARANTEES
→ Past performance does NOT guarantee future results
→ No indicator can predict future price movements with certainty
→ Signal grades represent confluence, NOT win probability
→ A+ signals can lose, B signals can win - markets are probabilistic
❌ SUBSTANTIAL RISK
Trading financial instruments involves SUBSTANTIAL RISK of loss:
→ You can lose your entire investment
→ Leveraged trading amplifies both gains AND losses
→ Never trade with money you cannot afford to lose
→ Never risk more than 1-2% of your account per trade
❌ YOUR RESPONSIBILITY
→ All trading decisions are YOUR responsibility
→ You must conduct your own analysis before entering trades
→ Consult a licensed financial advisor before trading
→ Understand the risks specific to your jurisdiction and situation
→ Only trade with capital you can afford to lose completely
❌ NO HOLY GRAIL
→ This indicator is a TOOL, not a complete trading system
→ It should be used as part of a broader analysis framework
→ Combine with your own technical analysis, risk management, and judgment
→ No indicator works 100% of the time in all market conditions
❌ ANALYSIS PANEL DISCLAIMER
The "Trade Analysis Panel" provides ALGORITHMIC ANALYSIS of market factors.
→ It does NOT provide investment advice or recommendations
→ Factor scores are mathematical calculations, not predictions
→ Guidance messages are informational, not directives
→ All trading decisions remain your responsibility
❌ BACKTESTING LIMITATIONS
→ This is an indicator, not a strategy, so no backtesting results are provided
→ Any backtesting you perform includes hindsight bias and optimization bias
→ Historical performance does not indicate future performance
→ Slippage, commissions, and real-world execution differ from backtests
❌ MARKET CONDITIONS
→ This indicator performs differently in trending vs. ranging markets
→ Extreme volatility can produce false signals or whipsaws
→ Low liquidity periods increase execution risk
→ Major news events can invalidate technical analysis
BY USING THIS INDICATOR, YOU ACKNOWLEDGE:
→ You have read and understood this disclaimer
→ You accept full responsibility for your trading decisions
→ You understand the substantial risks involved in trading
→ You will not hold the author liable for any losses incurred
→ You are using this tool as part of your own due diligence process
KEY FEATURES SUMMARY
✅ Volume-Weighted Kinetic Pulse Engine (proprietary momentum calculation)
✅ 15-Factor Confluence Scoring System (graded signals: A+, A, B)
✅ Multi-Oscillator Divergence Detection (Pulse + CCI + Stochastic)
✅ Higher Timeframe Trend Alignment Filter
✅ Adaptive Period Adjustment (volatility-responsive)
✅ Instrument-Aware Calibration (Forex, Crypto, Indices, Commodities)
✅ Structure-Based Stop Loss Calculation (respects swing highs/lows)
✅ Automated Trade Tracking (entry, stop, TP1, TP2, P/L)
✅ Real-Time Factor Analysis State Machine (5-state system with hysteresis)
✅ Session Awareness (Asian, London, New York, Overlap)
✅ Volatility Regime Detection (blocks signals in extreme conditions)
✅ Choppiness Filter (reduces signals in ranging markets)
✅ Volume Confirmation (relative volume and delta analysis)
✅ Clean Air Check (validates clear path to targets)
✅ Comprehensive Dashboards (market conditions + trade analysis)
✅ Customizable Display (3 signal styles, color themes, positioning)
✅ 9 Built-In Alert Conditions (signals, TP/SL hits, state changes)
✅ Fully Non-Repainting (barstate.isconfirmed, lookahead_off)
✅ Previous Day Levels (PDH/PDL reference lines)
✅ Mobile-Friendly Compact Mode (for smaller screens)
TECHNICAL SPECIFICATIONS
→ Pine Script Version: v6
→ Indicator Type: Overlay (displays on price chart)
→ License: Mozilla Public License 2.0
→ Copyright: BULLBYTE
→ Object Limits: 300 labels, 100 lines, 50 boxes
→ Memory Management: Automatic cleanup system (FIFO queue)
→ Repainting: Non-repainting (signals confirmed on bar close)
→ Timeframe Support: All timeframes (1s to Monthly)
→ Instrument Support: Forex, Crypto, Indices, Commodities, Stocks
→ HTF Data Handling: lookahead_off with historical offset
VERSION HISTORY
v1.0 - Initial Release
→ Kinetic Pulse engine with volume weighting and Fisher Transform
→ 15-factor confluence scoring system
→ Trade analysis state machine with hysteresis
→ Automated trade tracking and monitoring
→ Dual dashboard system (market conditions + factor analysis)
→ 9 alert conditions
→ 3 signal display styles
→ Instrument-aware calibration
→ Full risk management framework
WHO IS THIS INDICATOR FOR?
IDEAL FOR:
✓ Scalpers and day traders seeking high-confluence reversal entries
✓ Swing traders who want quality over quantity
✓ Traders who appreciate systematic, rules-based analysis
✓ Multi-timeframe traders who value HTF confirmation
✓ Forex traders who respect session timing
✓ Crypto traders needing volatility-adjusted parameters
✓ Traders who want complete trade management (entry, stop, targets)
✓ Analytical traders who want transparency in signal generation
NOT IDEAL FOR:
✗ Traders seeking a "set and forget" holy grail system
✗ Traders who don't want to learn the methodology
✗ Traders unwilling to accept losing trades as part of the process
✗ Traders who need constant signals (this is a quality-focused system)
✗ Traders who ignore risk management
FINAL THOUGHTS
The Kinetic Scalper is the result of extensive research into momentum behavior, volume confirmation, and multi-factor confluence analysis. It's designed to identify high-probability reversal setups while maintaining strict risk management and providing complete transparency.
This is NOT a magic solution. It's a sophisticated TOOL that requires:
→ Understanding of the methodology
→ Proper risk management discipline
→ Patience to wait for quality setups
→ Willingness to accept losses as part of trading
→ Integration with your own analysis and judgment
Used properly as part of a complete trading plan, the Kinetic Scalper can help you identify high-confluence opportunities and manage trades systematically.
Remember: Quality over quantity. Discipline over emotion. Risk management over everything.
Trade smart. Trade safe.
© 2025 BULLBYTE | Kinetic Scalper v1.0 | For Educational Purposes Only

NVentures Liquidity Radar Pro**NVentures Institutional Liquidity Radar Pro (NV-ILR Pro)** is a comprehensive liquidity analysis tool engineered for traders who understand that price moves from liquidity to liquidity. This indicator reveals where stop orders cluster, where institutional players left their footprints, and where the next liquidity grab is likely to occur.
Unlike conventional support/resistance indicators, ILR Pro combines multiple institutional concepts into a unified confluence scoring system — helping you identify high-probability zones where significant price reactions are most likely.
⯌ **Multi-Layer Liquidity Detection**
> The core engine identifies swing-based liquidity pools where retail stop-losses typically cluster. Each zone is dynamically sized using ATR, ensuring relevance across all timeframes and instruments. Zones automatically fade over time through a freshness decay system, keeping your chart focused on what matters now.
⯌ **Institutional Order Block Detection**
> Order Blocks mark the last opposing candle before a strong institutional move — the footprint of smart money entering positions. ILR Pro automatically detects both bullish and bearish Order Blocks using volume confirmation and consecutive candle validation. When price returns to these zones, institutions often defend their positions.
⯌ **Fair Value Gap Integration (Optional)**
> FVGs represent price imbalances where aggressive orders created inefficiencies. These gaps often act as magnets for price or provide optimal entry zones for mean-reversion strategies. FVG detection is disabled by default for a cleaner chart experience — enable it in settings when you want the full picture.
⯌ **Smart Confluence Scoring**
> Each liquidity zone receives a confluence score based on multiple factors:
- Overlapping swing levels (+1 per overlap)
- Nearby Order Blocks (+1)
- Higher Timeframe alignment (+2 bonus)
Zones with scores of 4+ are highlighted as high-confluence areas where institutional activity is most concentrated.
⯌ **Higher Timeframe Confluence**
> A liquidity zone on your current timeframe gains significant weight when it aligns with HTF structure. ILR Pro automatically checks for HTF swing alignment and awards bonus confluence points — no manual multi-timeframe analysis required.
⯌ **Liquidity Sweep Detection**
> Not every break of a level is a true breakout. ILR Pro identifies sweep patterns where price penetrates a liquidity zone but closes back inside, indicating that liquidity was grabbed without genuine continuation. Swept zones are visually marked, helping you avoid false breakout traps.
⯌ **Mitigation & Test Tracking**
> The indicator tracks how many times price has tested each zone and automatically marks Order Blocks as mitigated once price fully trades through them. This helps you focus on fresh, untested levels with higher reaction probability.
⯌ **Volume-Weighted Significance**
> Zones formed on high relative volume carry more weight. The volume scoring system identifies where significant participation occurred, filtering out noise from low-volume price action.
**PRACTICAL APPLICATION**
**For Breakout Traders**
> Identify where liquidity pools cluster above/below current price. When price sweeps these zones and reverses, you have confirmation of a liquidity grab — often the precursor to the real move in the opposite direction.
**For Mean-Reversion Traders**
> Enable FVG detection and look for price returning to unfilled gaps within high-confluence liquidity zones. The combination of gap-fill tendency and institutional defense creates high-probability reversal setups.
**For Trend Traders**
> Use Order Blocks as pullback entry zones within established trends. When price retraces to a bullish OB in an uptrend (or bearish OB in a downtrend), institutions often step in to defend their positions.
**For Multi-Timeframe Analysts**
> The HTF confluence system does the work for you. Zones marked with "HTF" in the label align with higher timeframe structure — these are your highest conviction levels.
**CONFIGURATION GUIDE**
**Essential Settings**
- Swing Detection Length: 5-8 for intraday, 8-15 for swing trading
- HTF Timeframe: One or two timeframes above your trading TF (e.g., D for H4 charts)
- Min Confluence to Display: 2 for comprehensive view, 3-4 for only high-probability zones
**Visual Clarity**
- FVGs are disabled by default — enable under "Fair Value Gaps" section when needed
- Zone transparency adjustable from 50-95%
- Label size options: tiny, small, normal
**Performance Optimization**
- Reduce Max Zones/OBs/FVGs for faster loading on lower-end systems
- Decrease Lookback Period for intraday scalping
**WHAT MAKES THIS DIFFERENT**
Most liquidity indicators simply draw lines at swing highs and lows. ILR Pro goes further:
→ **Confluence over quantity** — Not all levels are equal. The scoring system highlights where multiple institutional concepts align.
→ **Dynamic relevance** — Freshness decay ensures old, tested levels fade while fresh zones remain prominent.
→ **Sweep intelligence** — Distinguishes between genuine breakouts and liquidity grabs through wick analysis.
→ **Institutional integration** — Combines retail liquidity pools with smart money concepts (OBs, FVGs) in one unified tool.
→ **HTF awareness** — Automatic higher timeframe validation without switching charts.
**STATISTICS PANEL**
The built-in statistics table displays:
- Active resistance/support zones
- High confluence zone count
- Swept zone count
- Active Order Blocks
- Active FVGs (when enabled)
- Current ATR value
- Selected HTF
**ALERTS INCLUDED**
- Price approaching high confluence zone
- Liquidity sweep detected
- Bullish/Bearish Order Block formed
- Bullish/Bearish FVG detected (when enabled)
**NOTES**
This indicator works on all markets and timeframes. For optimal results on Forex, consider using Daily as your HTF for H1-H4 trading. For indices and crypto, Weekly HTF often provides stronger confluence.
The indicator uses User-Defined Types (UDTs) for clean data management and respects Pine Script's drawing limits (500 boxes/labels/lines).
**DISCLAIMER**
This indicator is for educational and informational purposes only. It does not constitute financial advice. All trading decisions are solely your responsibility. Past performance of any trading system or methodology is not indicative of future results.

Higher Low /Lower Low S+ Trend shiftThis indicator identifies Higher Lows (HL) and Lower Lows (LL) to help traders visualize trend structure and directional shifts on the chart.
Instead of relying on lagging indicators, it focuses on price structure itself, which is the foundation of trend analysis, swing trading, and risk management.
What the Indicator Shows
Higher Low (HL) – indicates rising demand and potential trend strength
Lower Low (LL) – indicates increasing supply and potential trend weakness
These are detected using confirmed swing structure, ensuring clarity rather than reacting to every minor fluctuation.
Why This Indicator Is Useful
Many traders conceptually understand HL and LL but struggle to:
Identify them consistently
Avoid over-marking noisy swings
Keep structure visible when zooming or adjusting charts
This indicator solves that by:
Marking only meaningful swing points
Keeping markers anchored to price, not screen position
Providing a clean structural view without clutter
It allows traders to see trend health at a glance.
How Traders Commonly Use It
This indicator is commonly used for:
Trend confirmation (series of HLs or LLs)
Early warning of trend weakening or reversal
Defining logical stop-loss levels
Avoiding counter-trend trades
Adding structure context to other setups (breakouts, pullbacks, ORB, momentum)
It works well as a context tool, not a signal generator.
Design Philosophy
Minimal visual footprint
Only structural points are marked
Background shading optionally reflects recent structure direction
No dependency on oscillators or indicators
The goal is to keep price action readable and honest.
Best Use Cases
Swing trading
Trend following
Momentum continuation
Market structure analysis
Suitable for Daily, 4H, 1H, and higher timeframes.
Notes
This is not a buy/sell indicator
No future data is used (non-repainting)
Best used with broader market context and risk management

Momentum Quality Index (MQI)
Welcome to the Momentum Quality Index! This indicator aims to provide insight into short term trends by measuring the efficiency of price movement relative to the momentum of the trend. This indicator is designed to work better on short term time frames, capturing the micro-level of trends for practices such as day-trading, options trading, and shorter term swing trading.
How to read:
The main way of reading this indicator is through moving average crossovers. Upwards crossovers indicates uptrends whereas downwards crossovers indicates downtrends.
Customization:
This indicator includes a few adjustable options for fine tuning, such as optimized smoothing options and moving average length for efficiency in spotting reversals.
Malama's Quantum FusionOverview
Malama's Quantum Fusion is an advanced, unified trading indicator that builds upon and significantly extends the core concepts from "Malama's Quantum Swing Modulator" (MQSM). It intelligently fuses swing-based probability zones with a full reversal signal engine, multi-layered trend confirmation, regime detection, and optional multi-timeframe (MTF) alignment. Signals are generated only when multiple independent systems converge, resulting in higher-conviction setups with reduced false signals in ranging or choppy conditions.
The system combines:
Probability Zones — Swing pivots, ATR uncertainty bands, and weighted scoring from oscillators (RSI, MFI), volume, price deviation, and regime-adjusted momentum.
Reversal Signal Engine — Precise candle pattern detection requiring alignment with EMA structure and a dual Supertrend cloud, plus customizable filters.
Final qualified signals demand strict confluence: reversal pattern + high-probability zone proximity (optional) + trend cloud + filters + optional MTF trend confirmation.
Key Features
Uncertainty Zones: ATR-shaded bands around a central EMA wave for market context.
Trend Cloud: Dual Supertrend (fast/slow) fill visualizing bullish/bearish/mixed states.
Dynamic S/R Lines: Auto-drawn from EMA crosses, extending forward until price invalidation (close beyond level).
Comprehensive Dashboard: On-chart table displaying regime (Trending/Ranging/Choppy via ADX/DMI), cloud status, detailed support/resistance analysis (price, probability %, confidence %, action), MTF status, RSI/MFI, volume spike, ATR, and current signal.
Visual Signals: Diamond labels (◆ BUY / ◆ SELL), bar coloring, dynamic stop-loss lines (candle extremes), and 2:1 risk-reward target lines.
Multiple Alerts: For qualified/raw signals, high-probability zones, regime shifts, and cloud flips.
Differences from Malama's Quantum Swing Modulator (MQSM)
MQF incorporates the foundational probability zone and superposition scoring logic from MQSM but evolves it into a complete trading system:
Signal Generation: MQSM focuses solely on zone analysis and probability scoring (no actual BUY/SELL signals). MQF adds a dedicated reversal engine with candle patterns, strict filters (volume spike, ADX chop avoidance, max candle range), and requires zone alignment for signals.
Trend & Structure Enhancements: Adds fast/slow EMA structure, dual Supertrend cloud for visual trend bias, dynamic extending S/R lines from EMA crosses, and optional MTF Supertrend/ADX confirmation.
Expanded Dashboard: MQSM's table is simpler (support/resistance levels with prob/confidence/action). MQF's unified dashboard includes regime, cloud, MTF, oscillators, volume, ATR, and live signal status.
Additional Filters & Regime Handling: More granular ADX thresholds (trend/chop), volume spike integration into confidence scoring, and cloud alignment bonuses.
Visual & Risk Aids: MQF provides signal labels, bar colors, SL/target lines, and pivot plotting options not present in MQSM.
In essence, MQSM provides contextual zone analysis for manual decision-making, while MQF delivers automated, confluence-based entry signals with richer visuals and risk guides.
How to Use
Context First: Monitor regime, cloud, and zone probabilities to avoid low-quality environments.
Zone Setup: Look for price nearing high-probability support/resistance (ideally >60–75%).
Signal Execution: Wait for qualified ◆ BUY/SELL diamonds—only fired on full alignment. Use plotted SL and 2:1 targets as starting points.
Customization: Tune filters (e.g., enable MTF for higher timeframes, adjust zone probability threshold) to suit scalping, intraday, or swing trading.
Best on 15m–4H timeframes across stocks, forex, crypto, or futures.
Disclaimer
This indicator is for educational and informational purposes only. It is not financial advice. Past performance does not guarantee future results. Always use proper risk management and combine with your own analysis. Trading involves substantial risk of loss.

Advanced Rainbow EMA + SMMA SystemAdvanced Rainbow EMA + SMMA System
This custom indicator overlays eight rainbow‑colored EMAs (20, 25, 30, 35, 40, 45, 50, 55) together with two Smoothed Moving Averages (SMMA 50 in white, SMMA 200 in red).
Features:
🌈 Rainbow EMAs: Smooth gradient from yellow → gold → orange → dark orange → tomato → crimson → red → blue, showing short‑ to medium‑term momentum.
⚪🔴 Smoothed Moving Averages: Thick white SMMA (50) and thick red SMMA (200) for long‑term trend context.
🟩🟥 Background shading: Green when EMAs align bullish and SMMA 50 > SMMA 200, red when bearish.
📈📉 Signal arrows: “BUY” labels on Golden Cross (SMMA 50 crossing above SMMA 200), “SELL” labels on Death Cross (SMMA 50 crossing below SMMA 200).
🔔 Alerts: Built‑in TradingView alerts for Golden/Death Cross and for strong bullish/bearish EMA alignment.
Use case: This tool helps traders quickly visualize short‑term momentum against long‑term smoothed trend direction. It highlights strong trending conditions, potential reversals, and crossover signals, making it suitable for swing trading, trend following, and confirmation of entries/exits.

Triple VWAP: Anchored# Triple VWAP: Anchored + Last 2 Sessions
## 📊 Overview
**Triple VWAP** is a professional-grade Volume Weighted Average Price (VWAP) indicator designed for serious traders who need multi-timeframe volume analysis on a single chart. This indicator combines three powerful VWAP calculations: a custom **Anchored VWAP** from any historical date, a real-time **Current Session VWAP**, and **Previous Session VWAP** reference levels—all with configurable standard deviation bands.
Perfect for intraday traders, swing traders, and institutional-level analysis on Indian markets (Nifty, BankNifty) and global instruments.
***
## ✨ Key Features
### 🎯 Three Independent VWAP Calculations
**📍 Anchored VWAP (Long-term Reference)**
- Anchor VWAP from any specific date and time (year, month, day, hour, minute)
- Ideal for tracking price action from significant market events, earnings, or trend reversals
- Maintains accumulation from your chosen anchor point throughout the entire timeframe
**📅 Current Session VWAP (Real-Time)**
- Automatically resets at the start of each trading day
- Calculates dynamically as new bars form during the session
- Shows institutional trading levels and intraday fair value
**📆 Previous Session VWAP (Reference Levels)**
- Displays yesterday's final VWAP as horizontal reference lines
- Helps identify support/resistance zones from prior session
- Useful for gap analysis and opening range strategies
### 📐 Standard Deviation Bands
Each VWAP calculation includes optional standard deviation bands:
- **±1 SD** - Identifies normal price deviation zones
- **±2 SD** - Marks extreme price movements (high probability reversal zones)
- **±3 SD** - Ultra-extreme levels (rare price extensions)
Configure which SD levels to display for each VWAP type independently.
### 🎨 Customizable Visual Settings
- **Independent Color Schemes**: Assign unique colors to each VWAP type and its SD bands
- **Adjustable Line Widths**: Configure VWAP and SD line thickness (1-5 for VWAP, 1-3 for SD)
- **Plot Styles**: Previous session plots use cross-style for clear differentiation from real-time plots
- **Background Zones**: Optional colored zones when price extends beyond ±2 SD levels
- **Session Labels**: Automatic date labels marking each VWAP anchor point
### 📊 Information Dashboard
Real-time statistics table displaying:
- Current VWAP values for all three calculations
- Live standard deviation values
- ±1 SD levels for quick reference
- Distance from price to each VWAP (percentage format)
- Session tracking counter
- Color-coded proximity indicators
***
## 🔧 How to Use
### For Intraday Trading
1. **Current Session VWAP** acts as dynamic support/resistance—price above VWAP indicates bullish bias, below indicates bearish bias
2. Use **±1 SD bands** for profit targets and stop-loss placement
3. **±2 SD touches** often signal mean reversion opportunities
4. **Previous Session VWAP** provides overnight gap reference levels
### For Swing Trading
1. **Anchored VWAP** from significant events (breakouts, earnings, trend changes) shows institutional cost basis
2. Price trading consistently above/below anchored VWAP confirms trend strength
3. SD band rejections provide high-probability entry zones
### For Multi-Timeframe Analysis
1. Combine all three VWAPs to identify confluence zones
2. When current session VWAP aligns with previous session and anchored VWAP, expect strong support/resistance
3. Monitor distance percentage to gauge overextension
***
## ⚙️ Input Parameters
**📍 Anchored VWAP Configuration**
- `Enable Anchored VWAP` - Toggle on/off
- `Year, Month, Day, Hour, Minute` - Set your custom anchor point (requires confirmation)
**📅 Session VWAP Toggles**
- `Enable Current Session VWAP` - Toggle real-time daily VWAP
- `Enable Previous Session VWAP` - Toggle yesterday's reference VWAP
**General Settings**
- `VWAP Source` - Choose calculation source (default: HLC3)
- `Show ±1/2/3 SD` - Enable/disable each standard deviation level
**Visual Customization**
- Individual color pickers for each VWAP type and SD bands
- Line width adjustments
- `Show VWAP Labels` - Date labels at anchor points
- `Show Info Table` - Statistics dashboard toggle
- `Show SD Zones` - Background coloring beyond ±2 SD
***
## 💡 Trading Applications
✅ **Mean Reversion Trades**: Enter when price touches ±2 SD with reversal confirmation
✅ **Trend Following**: Trade in direction when price holds above/below VWAP
✅ **Institutional Levels**: Anchored VWAP reveals where large players accumulated positions
✅ **Gap Trading**: Use previous session VWAP to gauge gap fill probability
✅ **Volume Profile Analysis**: VWAP represents fair value based on actual volume traded
✅ **Support/Resistance Confluence**: Multiple VWAP alignment creates high-probability zones
***
## 🎓 Understanding VWAP
VWAP is the average price weighted by volume—representing the true average price paid by all market participants during a specific period. Unlike simple moving averages, VWAP gives more weight to price levels with higher trading volume, making it particularly valuable for:
- Institutional traders executing large orders
- Algorithmic trading systems
- Identifying fair value and overextended prices
- Minimizing market impact on large trades
***
## 📈 Chart Setup Recommendations
**Best Timeframes**: 1-minute to 15-minute charts for intraday; 1-hour to 4-hour for swing trading
**Compatible Markets**: Stocks, Indices (Nifty 50, Bank Nifty), Futures, Forex, Crypto
**Session Settings**: Works with standard daily sessions; automatically detects trading days (not calendar days)
***
## 🚀 What Makes This Indicator Unique
Unlike standard VWAP indicators that only show current session data, **Triple VWAP** provides:
- **Multi-session analysis** on a single chart without clutter
- **Historical anchoring** capability for event-driven analysis
- **Professional-grade statistics** dashboard
- **Independent customization** for each VWAP type
- **Optimized calculations** for real-time performance
***
## ⚠️ Important Notes
- **Anchored VWAP** requires manual date input (use significant market events like breakouts, earnings, trend reversals)
- **Session detection** based on daily timeframe changes—works on all chart timeframes
- **Previous Session VWAP** displays as static horizontal lines (reference only, not recalculated)
- **Standard Deviations** calculated using volume-weighted variance formula
- Works best on instruments with **consistent volume data**
***
## 📝 Credits & License
This indicator is published under **TradingView House Rules**. Code is original and follows Pine Script v6 best practices for performance and maintainability.
***
## 🤝 Support & Feedback
If you find this indicator valuable, please:
- ⭐ **Like** this publication
- 💬 **Comment** with your feedback or questions
- 🔔 **Follow** for updates and new releases
***
**Disclaimer**: This indicator is for educational and informational purposes only. Past performance does not guarantee future results. Always use proper risk management and combine with your own analysis before making trading decisions.
***

SUPERTREND VALIDADO ADX EMAS VWAP # Modular Trading System - SuperTrend + ADX + Multi-Filter Confirmation
## Overview
Professional modular trading system designed for trend-following strategies on 4H timeframes. Features a clean, mobile-optimized interface with customizable filters and real-time status monitoring.
## Core Features
### Validated Components (Backtested)
- **SuperTrend (ATR 10, Multiplier 3.0)**: Primary trend direction filter with visual fill
- **ADX >23**: Trend strength confirmation (14-period)
- Proven performance: 52.11% win rate, 3.162 profit factor over 4 years
### Additional Filters (Optional)
- **DI Spread >9**: Directional movement confirmation
- **Volume > EMA20**: Volume confirmation above 20-period average
- **EMA System**: 7/21/50 with dynamic coloring
- **VWAP**: Daily volume-weighted average price
### Visual Elements
- **SuperTrend Line**: Green (bullish) / Red (bearish) with background fill
- **EMA 7**: Yellow when ADX >23, White when ADX ≤23
- **EMA 21**: Green (price above) / Red (price below)
- **EMA 50**: Blue reference line
- **VWAP**: Orange line
- **PDH/PDL**: Previous day high/low levels
- **EMA Cross Signals**: Small dots marking 7/21 crossovers
### Smart Money Concepts
- Automatic Previous Day High (PDH) / Previous Day Low (PDL) tracking
- Horizontal lines extending from current price
- Clear labeling for support/resistance levels
## Status Dashboard
Compact 2-column table (top-right) shows:
```
FILTERS | STATUS
1. ADX >23 | 47.6 OK / 18.2 NO
2. DI Spread >9 | Bullish / Bearish
3. SuperTrend | Bullish / Bearish
4. Volume >EMA20 | 1.25x OK / 0.14x NO
─────────────────────────────
SIGNAL | BUY / SELL / WAIT
```
Color-coded backgrounds:
- Green: Condition met
- Red: Condition not met
- Yellow: Waiting for confirmation
## Signal Logic
### Entry Conditions
**LONG**: All active filters must align
- SuperTrend bullish (green)
- ADX >23
- DI+ > DI- (if DI Spread enabled)
- Volume > EMA20 (if Volume enabled)
- Price > EMA21 and EMA7 > EMA21 (if EMAs enabled)
**SHORT**: All active filters must align
- SuperTrend bearish (red)
- ADX >23
- DI- > DI+ (if DI Spread enabled)
- Volume > EMA20 (if Volume enabled)
- Price < EMA21 and EMA7 < EMA21 (if EMAs enabled)
### Exit Conditions
- SuperTrend direction change
- Clear "EXIT" markers on chart
### Position Management
- One position per trend (no pyramiding)
- Prevents multiple entries in same direction
- "WAIT" status when conditions partially met
## Settings & Customization
### Filters (Enable/Disable)
**Core Filters:**
- ✓ SuperTrend (VALIDATED)
- ✓ ADX >23 (VALIDATED)
**Additional Filters:**
- ⚠️ DI Spread >9 (EXPERIMENTAL)
- ⚠️ Volume > EMA20 (EXPERIMENTAL)
- ⚠️ EMAs 7/21/50 (EXPERIMENTAL)
**Visual:**
- Show EMA 7/21 Crosses (dots)
### Parameters
**SuperTrend:**
- ATR Period: 10 (default)
- ATR Multiplier: 3.0 (default)
**ADX/DI:**
- ADX Length: 14 (default)
- ADX Threshold: 23 (default)
- DI Spread Threshold: 9 (default)
**Volume:**
- Volume EMA: 20 (default)
**EMAs:**
- Fast EMA: 7 (default)
- Medium EMA: 21 (default)
- Slow EMA: 50 (default)
## Alerts
Pre-configured alerts for:
- Long Signal (BUY - Entry confirmed)
- Short Signal (SELL - Entry confirmed)
- Exit Long (EXIT LONG - SuperTrend changed)
- Exit Short (EXIT SHORT - SuperTrend changed)
- EMA Cross Up (EMA 7 crossed above EMA 21)
- EMA Cross Down (EMA 7 crossed below EMA 21)
## Best Practices
### Recommended Setup (Validated System)
```
Enable ONLY:
- SuperTrend: ON
- ADX >23: ON
- All other filters: OFF
```
### Testing New Filters
1. Enable experimental filters
2. Backtest thoroughly before live trading
3. Compare performance metrics
4. Validate with demo account first
### Timeframe
- Optimized for: 4H charts
- Tested on: Bitcoin/USDT
- Works on: Any trending instrument
## Risk Management
This indicator provides entry/exit signals but does NOT include:
- Stop loss levels
- Take profit targets
- Position sizing
Always use proper risk management:
- Maximum 1-2% risk per trade
- Use stop losses
- Follow your trading plan
## Performance Notes
**Validated Backtest Results (SuperTrend + ADX only):**
- Win Rate: 52.11%
- Profit Factor: 3.162
- Return: +45.46% (4 years)
- Tested Period: 2020-2024
- Instrument: BTC/USDT 4H
**Important:** Adding additional filters changes the system. Results may vary. Always backtest your specific configuration before live trading.
## Mobile Optimization
- Compact table design
- Clear color coding
- Minimal chart clutter
- Large signal text
- Optimized for small screens
## Use Cases
✅ **Ideal for:**
- Trend-following strategies
- Swing trading (4H timeframe)
- Clear market conditions
- Systematic traders
❌ **NOT ideal for:**
- Scalping (too slow)
- Range-bound markets
- Counter-trend strategies
- Lateral/choppy conditions
## Credits & Methodology
Based on proven technical analysis principles:
- SuperTrend (volatility-based trend following)
- ADX (trend strength measurement)
- Directional Indicators (DI+/DI-)
- Volume analysis
- EMA systems
**Designed for:** Disciplined execution over frequent trading
**Philosophy:** Quality setups > Quantity of trades
## Disclaimer
This indicator is for educational purposes only. Past performance does not guarantee future results. Always:
- Test on demo account first
- Use proper risk management
- Never risk more than you can afford to lose
- Consult a financial advisor
Trading involves substantial risk. This tool does not constitute financial advice.
---
## Version History
**v2.0 (Current)**
- Modular filter system
- 2-column compact status table
- EMA 7 dynamic coloring (yellow when ADX >23)
- EMA 50 + VWAP added
- PDH/PDL levels
- EMA cross markers
- Improved signal logic
- One position per trend
- Multiple alert conditions
---
**For support, updates, or feedback, contact the developer.**

Advanced Rainbow EMA + SMMA System - VILLAGE PILOT Advanced Rainbow EMA + SMMA System
This custom indicator overlays eight rainbow‑colored EMAs (20, 25, 30, 35, 40, 45, 50, 55) together with two Smoothed Moving Averages (SMMA 50 in white, SMMA 200 in red).
Features:
🌈 Rainbow EMAs: Smooth gradient from yellow → gold → orange → dark orange → tomato → crimson → red → blue, showing short‑ to medium‑term momentum.
⚪🔴 Smoothed Moving Averages: Thick white SMMA (50) and thick red SMMA (200) for long‑term trend context.
🟩🟥 Background shading: Green when EMAs align bullish and SMMA 50 > SMMA 200, red when bearish.
📈📉 Signal arrows: “BUY” labels on Golden Cross (SMMA 50 crossing above SMMA 200), “SELL” labels on Death Cross (SMMA 50 crossing below SMMA 200).
🔔 Alerts: Built‑in TradingView alerts for Golden/Death Cross and for strong bullish/bearish EMA alignment.
Use case: This tool helps traders quickly visualize short‑term momentum against long‑term smoothed trend direction. It highlights strong trending conditions, potential reversals, and crossover signals, making it suitable for swing trading, trend following, and confirmation of entries/exits.
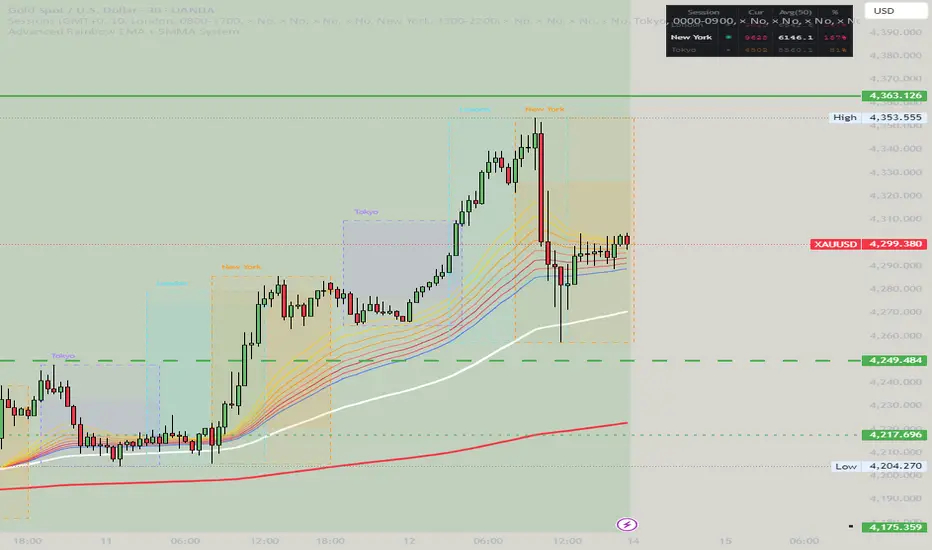
Trinity Real Move Detector DashboardRelease Notes (critical)
1. This code "will" require tweaks for different timeframes to the multiplier, do not assume the data in the table is accurate, cross check it with the Trinity Real Move Detector or another ATR tool, to validate the values in the table and ensure you have set the correct values.
2. I mention this below. But please understand that pine code has a limitation in the number of security calls (40 request.security() calls per script). This code is on the limit of that threshold and I would encourage developers to see if they can find a way around this to improve the script and release further updates.
What do we have...
The Trinity Real Move Detector Dashboard is a powerful TradingView indicator designed to scan multiple assets at once and show when each one has genuine short-term volatility "energy" — the kind that makes directional options trades (especially 0DTE or short-dated) have a high probability of follow-through, and can be used for swing trading as well. It combines a simple ATR-based volatility filter with a SuperTrend-style bias to tell you not only if the market is "awake" but also in which direction the momentum is leaning.
At its core, the indicator calculates the current ATR on your chosen timeframe and compares it to a user-defined percentage of the asset's daily ATR. When the short-term ATR spikes above that threshold, it signals "enough energy" — meaning the underlying is moving with real force rather than choppy noise. The SuperTrend logic then determines bullish or bearish bias, so the status shows "BULLISH ENERGY" (green) or "BEARISH ENERGY" (red) when energy is on, or "WAIT" when it's not. It also counts how many bars the energy has been active and shows the current ATR vs threshold for quick visual confirmation.
The dashboard displays all this in a clean table with columns for Symbol, Multiplier, Current ATR, Threshold, Status, Bars Active, and Bias (UP/DOWN). It's perfect for 3-minute charts but works on any timeframe — just adjust the multiplier based on the hints in the settings.
Editing symbols and multipliers is straightforward and user-friendly. In the indicator settings, you'll see numbered inputs like "1. Symbol - NVDA" and "1. Multiplier". To change an asset, simply type the new ticker in the symbol field (e.g., replace "NVDA" with "TSLA", "AVGO", or "ADAUSD"). You can also adjust the multiplier for each asset individually in the corresponding "Multiplier" field to make it more or less sensitive — lower numbers give more signals, higher numbers give stricter, higher-quality ones. This lets you customize the dashboard to your watchlist without any coding. For example, if you switch to a 4-hour chart or a slower-moving stock like AVGO, you may need to raise the multiplier (e.g., to 0.3–0.4) to avoid false "bullish" signals during minor bounces in a larger downtrend.
One important note about the multiplier and timeframes: the default values are optimized for fast intraday charts (like 3-minute or 5-minute). On higher timeframes (15-minute, 1-hour, 4-hour, or daily), the SuperTrend bias can be too sensitive with low multipliers (1.0 default in the code), leading to situations like the AVGO 4-hour example — where price is clearly downtrending, but the dashboard shows "BULLISH ENERGY" because the tight bands flip on small bounces. To fix this, you need to manually increase the multiplier for that asset (or all assets) in the settings. For 4-hour or daily charts, 0.25–0.35 is often better to match smoother SuperTrend indicators like Trinity. Always test on your timeframe and asset — crypto usually needs slightly lower multipliers than stocks due to higher volatility.
TradingView has a hard limit of 40 request.security() calls per script. Each asset in the dashboard requires several calls (current ATR, daily ATR, SuperTrend components, etc.), so with the full ATR-based bias, you can safely monitor about 6–8 assets before hitting the limit. Adding more symbols increases the number of calls and will trigger the "too many securities" error. This is a platform restriction to prevent excessive server load, and there's no official way around it in a single script. Some advanced coders use tricks like caching or lower-timeframe requests to squeeze in a few more, but for reliability, sticking to 6–8 assets is recommended. If you need more, the common workaround is to create two separate indicators (e.g., one for stocks, one for crypto) and add both to the same chart.
Overall, this dashboard gives you a professional-grade multi-asset scanner that filters out low-energy noise and highlights real momentum opportunities across stocks and crypto — all in one glance. It's especially valuable for options traders who want to avoid theta decay on weak moves and only strike when the market has true fuel. By tweaking the per-symbol multipliers in the settings, you can perfectly adapt it to any timeframe or asset behavior, avoiding issues like the AVGO false bullish signal on higher timeframes.

Pro Harmonic Patterns Hunter [abo0o]Advanced harmonic pattern recognition system designed for professional traders.
Automatically detects 🦈 Shark, 🦋 Butterfly, and 🦀 Crab harmonic patterns using optimized Fibonacci ratio analysis. Built with precision algorithms to identify high-probability reversal zones across any market condition.
📊 Key Features:
Real-time pattern completion detection
Multi-timeframe compatibility (all timeframes supported)
Three-tier take profit system based on Fibonacci extensions
Fixed parameters to ensure consistent performance
Clean visual presentation with directional color coding
Strict harmonic ratio validation
📈 Applications:
Works reliably across Forex, Stocks, Crypto, Indices, and Commodities. Suitable for day trading, swing trading, and position trading strategies.
🔧 Technical Details:
Automated ZigZag pivot detection
Pattern similarity filtering for quality control
Non-repainting signal generation
🌹Special thanks to TradingView for providing the platform and tools that make innovations like this possible.

ICT Premium/Discount Zones [Exponential-X]Premium/Discount Zones - Visual Market Structure Tool
Overview
This indicator helps traders visualize premium and discount price zones based on recent market structure. It automatically identifies swing highs and lows within a specified lookback period and divides the price range into three key areas: Premium Zone, Equilibrium, and Discount Zone.
What This Indicator Does
The script continuously monitors price action and calculates:
Highest High and Lowest Low within the lookback period
Equilibrium Level - the midpoint between the swing high and low
Premium Zone - the area from equilibrium to the swing high (typically viewed as relatively expensive price levels)
Discount Zone - the area from the swing low to equilibrium (typically viewed as relatively cheap price levels)
Core Calculation Method
The indicator uses pivot point logic to identify significant swing highs and lows based on the pivot strength parameter. It then calculates the highest high and lowest low over the specified lookback period. The equilibrium is computed as the arithmetic mean of these two extremes, creating a fair value reference point.
The zones are dynamically updated as new price data becomes available, ensuring the visualization remains relevant to current market conditions.
Key Features
Dynamic Zone Detection
Automatically adjusts zones based on recent price action
Uses customizable lookback period for flexibility across different timeframes
Employs pivot strength parameter to filter out minor price fluctuations
Visual Clarity
Color-coded zones for easy identification (red for premium, green for discount)
Optional equilibrium line display
Adjustable zone label placement
Customizable color schemes to match your charting preferences
Alert Capabilities
Alerts when price enters the premium zone
Alerts when price enters the discount zone
Alerts when price returns to equilibrium
Helps traders monitor key zone interactions without constant chart watching
Customization Options
Adjustable lookback period (5-500 bars)
Configurable pivot strength for swing detection (1-20 bars)
Control over box extension into the future
Toggle labels and equilibrium line on/off
Full color customization for all visual elements
How to Use This Indicator
Setup
Add the indicator to your chart
Adjust the lookback period to match your trading timeframe (shorter for intraday, longer for swing trading)
Set pivot strength to filter out noise (higher values for major swings, lower for more frequent updates)
Customize colors and labels to your preference
Interpretation
Premium Zone: Price trading here may indicate potential resistance or selling opportunities when aligned with other technical factors
Discount Zone: Price trading here may indicate potential support or buying opportunities when aligned with other technical factors
Equilibrium: Acts as a fair value reference point where price often consolidates or reacts
Trading Applications
This tool works well when combined with other forms of analysis such as:
Trend identification indicators
Volume analysis
Support and resistance levels
Price action patterns
Market structure analysis
Important Considerations
This indicator identifies zones based purely on historical price data
Premium and discount zones are relative to the recent lookback period
The effectiveness varies across different market conditions and timeframes
Should be used as part of a comprehensive trading strategy, not in isolation
Past price structure does not guarantee future price behavior
Technical Details
Calculation Method
Uses Pine Script's ta.pivothigh() and ta.pivotlow() functions for swing detection
Employs ta.highest() and ta.lowest() for range calculation
Updates dynamically with each new bar
Draws zones using box objects for clear visual representation
Performance Optimization
Efficiently manages box and line objects to minimize resource usage
Uses conditional plotting to reduce unnecessary calculations
Limited to essential visual elements for chart clarity
Timeframe Compatibility
This indicator works on all timeframes but the recommended settings vary:
1-5 minute charts: Lookback period 10-20, Pivot strength 3-5
15-60 minute charts: Lookback period 20-50, Pivot strength 5-10
Daily charts: Lookback period 50-100, Pivot strength 10-15
Weekly charts: Lookback period 20-50, Pivot strength 5-10
Adjust these values based on the volatility of your specific instrument.
Limitations and Considerations
What This Indicator Does NOT Do
Does not provide buy or sell signals on its own
Does not predict future price movements
Does not account for fundamental factors or market events
Does not guarantee profitability or accuracy
Market Condition Awareness
In strong trending markets, price may remain in premium or discount zones for extended periods
During ranging conditions, price typically oscillates between zones more predictably
High volatility can cause frequent zone recalculations
Low volatility may result in narrow zones with limited practical use
Risk Considerations
Premium and discount are relative concepts, not absolute values
What appears as a discount zone may continue lower in a downtrend
What appears as a premium zone may continue higher in an uptrend
Always use proper risk management and position sizing
Consider multiple timeframe analysis for context
Version Information
This indicator is written in Pine Script v6, ensuring compatibility with the latest TradingView features and optimal performance.
Final Notes
This tool is designed to enhance your market analysis by providing a clear visual representation of premium and discount price zones. It should be used as one component of a well-rounded trading approach that includes proper risk management, multiple forms of analysis, and realistic expectations about market behavior.
The concept of premium and discount zones is rooted in auction market theory and the idea that price oscillates around fair value. However, traders should understand that these zones are interpretive tools based on historical data and do not constitute trading advice or predictions about future price action.
Remember to backtest any strategy using this indicator on historical data before applying it to live trading, and always trade responsibly within your risk tolerance.
Disclaimer: The information provided by this indicator is for educational and informational purposes only. It does not constitute financial advice, investment advice, trading advice, or any other sort of advice. Always conduct your own research and consult with qualified financial professionals before making trading decisions.

Smart High low Pivot Points
## Description
The **Pivot High Low Indicator** is a powerful technical analysis tool designed to automatically identify and highlight significant pivot points in price action. This indicator marks crucial reversal zones where price has formed local peaks (pivot highs) and troughs (pivot lows), helping traders spot potential support/resistance levels and trend reversal points.
The indicator features intelligent price formatting that adapts to any market - from crypto tokens to large-cap stocks - displaying values in readable formats (M/B/T notation for large numbers, precise decimals for small values).
---
## Key Features
### 🎯 **Dual Pivot Detection System**
- **Pivot Highs**: Automatically identifies local price peaks where price is higher than surrounding bars
- **Pivot Lows**: Detects local price bottoms where price is lower than surrounding bars
- Independent left/right length settings for each pivot type
### 🎨 **Fully Customizable Appearance**
- Separate color controls for pivot high and low labels
- Custom text colors for optimal visibility
- Distinct label background colors (default: green for highs, red for lows)
- Clean, non-intrusive chart overlay
### ⚙️ **Flexible Configuration**
- Adjustable left/right bar lengths for sensitivity control
- Independent settings for highs and lows
- Real-time adaptation to market conditions
---
## Benefits
✅ **Identify Key Support & Resistance Levels** - Pivot points often act as important price levels where reversals occur
✅ **Spot Trend Reversals Early** - Recognize when momentum shifts from bullish to bearish or vice versa
✅ **Enhanced Market Structure Analysis** - Understand swing highs and lows for better trade timing
✅ **Works Across All Markets** - Optimized for stocks, forex, crypto, commodities, and indices
✅ **Clean Visual Presentation** - Labeled price points directly on chart without clutter
✅ **Universal Price Display** - Automatically formats prices for readability regardless of asset value
## Settings Available
### **LENGTH LEFT / RIGHT**
| Setting | Default | Min | Description |
|---------|---------|-----|-------------|
| **Pivot High - Left** | 15 | 1 | Number of bars to the left that must be lower than the pivot high |
| **Pivot High - Right** | 15 | 1 | Number of bars to the right that must be lower than the pivot high |
| **Pivot Low - Left** | 7 | 1 | Number of bars to the left that must be higher than the pivot low |
| **Pivot Low - Right** | 7 | 1 | Number of bars to the right that must be higher than the pivot low |
**💡 Tip**: Higher values = fewer, more significant pivots. Lower values = more frequent, minor pivots.
### **TEXT COLOR / LABEL COLOR**
| Setting | Default | Description |
|---------|---------|-------------|
| **Pivot High - Text Color** | White | Color of the price text on pivot high labels |
| **Pivot High - Label Color** | Green (#005703) | Background color of pivot high labels |
| **Pivot Low - Text Color** | White | Color of the price text on pivot low labels |
| **Pivot Low - Label Color** | Red (#7b0000) | Background color of pivot low labels |
## Use Cases
- 📈 **Swing Trading**: Identify swing high/low entry and exit points
- 🎯 **Support/Resistance**: Mark key levels for limit orders
- 📊 **Market Structure**: Analyze higher highs/higher lows or lower highs/lower lows
- ⚡ **Breakout Trading**: Spot when price breaks above pivot highs or below pivot lows
- 🔄 **Reversal Trading**: Enter trades at confirmed pivot points

able FRVP Reversal# able FRVP Reversal - Complete User Guide
## 📌 Overview
**able FRVP Reversal** is a professional-grade Volume Profile indicator with an integrated reversal detection system. It combines Fixed Range Volume Profile (FRVP) analysis with a confluence-based reversal scoring system to identify high-probability turning points at key volume levels.
---
## ✨ Key Features
| Feature | Description |
|---------|-------------|
| **Session-Based Volume Profile** | Automatically resets at the beginning of each regular trading session |
| **POC (Point of Control)** | Highest volume price level - strongest support/resistance |
| **VAH (Value Area High)** | Upper boundary of the 70% value area - resistance zone |
| **VAL (Value Area Low)** | Lower boundary of the 70% value area - support zone |
| **Confluence Scoring System** | 5-point scoring system for reversal detection |
| **Smart Cooldown** | Prevents signal spam with customizable cooldown period |
| **Real-time Info Table** | Displays all key metrics in a retro-style dashboard |
---
## 🔧 Installation
1. Open TradingView and go to **Pine Editor**
2. Delete any existing code and paste the indicator code
3. Click **"Add to Chart"**
4. Configure settings as needed
---
## ⚙️ Settings Explained
### 📊 Volume Profile Settings
| Setting | Default | Description |
|---------|---------|-------------|
| **Number of Rows** | 50 | Resolution of the volume profile (more rows = finer detail) |
| **Value Area %** | 70 | Percentage of volume to include in Value Area (industry standard: 70%) |
| **Profile Width** | 40 | Visual width of the histogram on chart |
| **Show Histogram** | ✓ | Display volume histogram bars |
| **Show POC/VAH/VAL** | ✓ | Display the three key levels |
| **Show Labels** | ✓ | Display price labels for each level |
| **Extend Lines** | ✓ | Extend levels to the right of current price |
| **Extend Length** | 100 | How far to extend the lines (in bars) |
### 🔄 Reversal Detection Settings
| Setting | Default | Description |
|---------|---------|-------------|
| **Enable Reversal Detection** | ✓ | Turn reversal signals on/off |
| **Min Confluence Score** | 3 | Minimum score required to trigger signal (1-5) |
| **Cooldown Bars** | 10 | Minimum bars between signals to prevent spam |
#### Understanding Min Confluence Score:
- **Score 1-2**: Very sensitive, many signals (not recommended)
- **Score 3**: Balanced - good for most traders ⭐ Recommended
- **Score 4**: Conservative - fewer but higher quality signals
- **Score 5**: Very strict - only strongest reversals
### 🎨 Color Settings
All colors are fully customizable:
- **POC Line**: Default Gold (#FFD700)
- **VAH Line**: Default Coral Red (#FF6B6B)
- **VAL Line**: Default Teal (#4ECDC4)
- **Bullish Reversal**: Default Green (#00E676)
- **Bearish Reversal**: Default Red (#FF5252)
---
## 📖 How to Read the Indicator
### Volume Profile Histogram
```
█████████████ ← High volume = Strong S/R
████████ ← Medium volume
████ ← Low volume = Weak S/R
██
```
- **Darker/Longer bars** = More trading activity at that price
- **Inside Value Area** = Colored based on session direction (Bull/Bear)
- **Outside Value Area** = Muted gray color
### Key Levels
| Level | Color | Meaning |
|-------|-------|---------|
| **POC** | Yellow | Price with highest volume - Strongest magnet |
| **VAH** | Red | Upper resistance - Look for bearish reversals |
| **VAL** | Teal | Lower support - Look for bullish reversals |
---
## 🔄 Reversal Detection System
### How the Scoring System Works
The indicator uses a **5-point confluence scoring system**. Each condition adds 1 point:
#### 🟢 Bullish Reversal Score (at VAL)
| Condition | Points | Description |
|-----------|--------|-------------|
| Price at VAL Zone | +1 | Price is within VAL ± 0.2 ATR |
| Bullish Candle | +1 | Close > Open (green candle) |
| RSI Oversold | +1 | RSI < 35 |
| Rejection Wick | +1 | Lower wick > 1.5× body size |
| Failed Breakdown | +1 | Touched below VAL but closed above |
#### 🔴 Bearish Reversal Score (at VAH)
| Condition | Points | Description |
|-----------|--------|-------------|
| Price at VAH Zone | +1 | Price is within VAH ± 0.2 ATR |
| Bearish Candle | +1 | Close < Open (red candle) |
| RSI Overbought | +1 | RSI > 65 |
| Rejection Wick | +1 | Upper wick > 1.5× body size |
| Failed Breakout | +1 | Touched above VAH but closed below |
### Signal Quality Ratings
| Score | Rating | Meaning |
|-------|--------|---------|
| 5/5 | ★★★ | Excellent - Highest probability |
| 4/5 | ★★ | Good - High probability |
| 3/5 | ★ | Acceptable - Moderate probability |
| <3 | - | No signal triggered |
---
## 📋 Info Table Explained
```
╔═ able-REV ═╗ 15 ████████ SCR
─────────────────────────────────────
ZONE UPPER VA ▒▒▓▓████ ▲
POC 4272.680 ██████·· ▲
VAH 4322.745 ████···· ·
VAL 4264.977 ██████·· ·
═ SCORE ═════════════════════════════
BULL 0/5 ········ ·
BEAR 1/5 ░······· ·
RSI 49 ▒▒▓▓···· ·
◄SIGNAL► WAIT ········ ·
```
| Row | Description |
|-----|-------------|
| **ZONE** | Current price position relative to Value Area |
| **POC/VAH/VAL** | Price levels with distance indicators |
| **BULL Score** | Current bullish confluence score |
| **BEAR Score** | Current bearish confluence score |
| **RSI** | RSI value with OB/OS status |
| **SIGNAL** | Current signal status (BUY/SELL/WAIT) |
### Zone Types
| Zone | Meaning | Bias |
|------|---------|------|
| ABOVE VAH | Price broke above resistance | Bullish (but watch for rejection) |
| ⚠ AT VAH | Price testing resistance | Watch for bearish reversal |
| UPPER VA | Price in upper value area | Slight bullish bias |
| LOWER VA | Price in lower value area | Slight bearish bias |
| ⚠ AT VAL | Price testing support | Watch for bullish reversal |
| BELOW VAL | Price broke below support | Bearish (but watch for rejection) |
---
## 📈 Trading Strategies
### Strategy 1: VAH Rejection (Bearish Reversal)
**Setup:**
1. Price approaches or touches VAH (red dashed line)
2. BEAR score reaches 3+ (or your minimum setting)
3. REV signal appears above the candle
**Entry:**
- Enter SHORT on signal candle close
- Or wait for confirmation candle
**Stop Loss:**
- Above the signal candle high
- Or above VAH + 0.5 ATR
**Take Profit:**
- First target: POC (yellow line)
- Second target: VAL (teal line)
---
### Strategy 2: VAL Bounce (Bullish Reversal)
**Setup:**
1. Price approaches or touches VAL (teal dashed line)
2. BULL score reaches 3+ (or your minimum setting)
3. REV signal appears below the candle
**Entry:**
- Enter LONG on signal candle close
- Or wait for confirmation candle
**Stop Loss:**
- Below the signal candle low
- Or below VAL - 0.5 ATR
**Take Profit:**
- First target: POC (yellow line)
- Second target: VAH (red line)
---
### Strategy 3: POC Bounce
**Setup:**
1. Price pulls back to POC after trending
2. POC acts as support/resistance
3. Watch for reversal candle patterns
**Entry:**
- Long if bullish candle at POC from below
- Short if bearish candle at POC from above
**Stop Loss:**
- Other side of POC ± buffer
---
## ⚠️ Important Notes
### When Signals Work Best
✅ **High Probability Setups:**
- Score 4-5 with clear rejection wick
- RSI confirms (oversold for long, overbought for short)
- First test of VAH/VAL in the session
- Clear trend before reversal
❌ **Low Probability Setups:**
- Score barely meeting minimum (3/5)
- Multiple tests of same level (level weakening)
- Low volume/choppy market
- News events pending
### Risk Management Rules
1. **Never risk more than 1-2% per trade**
2. **Always use stop loss** - place beyond the level
3. **Wait for candle close** - don't enter on wick touches
4. **Respect the cooldown** - avoid overtrading
5. **Consider the trend** - counter-trend reversals are riskier
---
## 🔔 Alerts
The indicator includes built-in alerts:
| Alert | Trigger |
|-------|---------|
| VAL Bullish Reversal | BULL score meets minimum at VAL |
| VAH Bearish Reversal | BEAR score meets minimum at VAH |
### Setting Up Alerts:
1. Right-click on the chart
2. Select "Add Alert"
3. Choose "able FRVP Reversal" as condition
4. Select desired alert type
5. Configure notification method
---
## 💡 Pro Tips
1. **Combine with trend analysis** - Reversals in trend direction are more reliable
2. **Watch for confluence with other S/R** - If VAH/VAL aligns with round numbers, previous highs/lows, or fib levels, the level is stronger
3. **Volume confirmation** - Higher volume on reversal candle = stronger signal
4. **Time of day matters** - Reversals during active trading hours are more reliable
5. **Adjust sensitivity by market** - Volatile assets may need higher Min Confluence Score
6. **Use multiple timeframes** - Check if reversal level aligns with higher timeframe levels
---
## 🔧 Recommended Settings by Trading Style
| Style | Min Confluence | Cooldown | Best For |
|-------|----------------|----------|----------|
| Scalping | 3 | 5-7 | Quick trades, more signals |
| Day Trading | 3-4 | 10-15 | Balanced approach |
| Swing Trading | 4-5 | 20+ | Fewer, higher quality signals |
---
## ❓ Troubleshooting
| Issue | Solution |
|-------|----------|
| No signals appearing | Lower Min Confluence Score or check if market is ranging |
| Too many signals | Increase Min Confluence Score or Cooldown Bars |
| Levels not showing | Enable Show POC/VAH/VAL in settings |
| Histogram too wide/narrow | Adjust Profile Width setting |
---
## 📞 Support
For questions, suggestions, or bug reports, please contact the developer.
---
**Version:** 1.0
**Last Updated:** 2024
**Platform:** TradingView (Pine Script v6)

EMA Cross + 12 Indicator Dashboard (Candle Filter)🚀 Ultimate EMA Trend Intelligence + 12-Factor Dashboard
Stop trading blind crossovers. Most moving average strategies fail because they lack context. This script solves that by fusing a robust 6-EMA Trend System with a powerhouse “Consensus Engine” that tracks 12 leading indicators simultaneously.
Unlike standard indicators that repaint or react too fast, this tool utilizes a strict “2-Candle Confirmation Protocol” to filter out market noise and bull/bear traps.
🔥 Why This Indicator Give You an Edge:
🛡️ The “Fakeout Shield” (2-Candle Filter): Every signal is double-checked against the previous bar’s momentum. If the trend isn’t sustained, the signal doesn’t fire. No more getting trapped by wicks.
📊 Institutional-Grade Dashboard: Get a real-time HUD (Heads-Up Display) directly on your chart. Instantly see the bias of RSI, MACD, ADX, Bollinger Bands, Volume, and more without cluttering your screen with oscillating lines.
🎯 High-Probability Confluence: A Buy/Sell signal is ONLY generated when the EMAs cross AND a “Council of 12” indicators agrees on the direction (fully adjustable consensus threshold).
🧠 Smart Volume Integration: Volume must exceed 1.5x the average to validate a move, ensuring you’re trading with the smart money, not against it.
🛠️ Key Features:
6-EMA Ribbon Logic: Covers short-term (9/26) to long-term (60/85/200) trends.
Zero-Repaint Signals: Once a candle closes and the label appears, it stays.
Fully Customizable: Adjust the strictness (e.g., require 8 out of 12 indicators to agree) to fit your trading style—from Scalping to Swing Trading.
Ready to trade with clarity? Add this to your chart and let the consensus guide you.

Multi-Timeframe CPR Pattern AnalyzerMulti-Timeframe CPR + Advanced Pattern Analyzer
A powerful, all-in-one indicator designed for professional price-action traders who use CPR (Central Pivot Range) as the core of their intraday, positional, and swing-trading strategies.
This script automatically plots Daily, Weekly, and Monthly CPR, identifies major CPR patterns, highlights Developing / Next CPR, and displays everything neatly in an interactive dashboard.
✨ Key Features
1️⃣ Daily, Weekly & Monthly CPR
Fully configurable CPR for all three timeframes
Clean plots with no vertical connector lines
Automatic zone shading
Adjustable line width, transparency, and colors
2️⃣ Support & Resistance (S1–S3, R1–R3)
Choose which timeframe’s S/R you want
Only plotted for the current day/week/month (no cluttering past charts)
Helps traders identify reaction zones and breakout levels
3️⃣ Next / Developing CPR
A unique feature rarely found in CPR indicators.
You can display:
Developing Daily CPR
Developing Weekly CPR
Next Monthly CPR (after month close)
All next/developing CPRs are plotted in a dashed style with optional transparency, plus labels:
“Developing Daily CPR”
“Developing Weekly CPR”
“Next Weekly CPR”
“Next Monthly CPR”
This allows you to anticipate the next session’s CPR in advance, a major edge for intraday, swing, and options traders.
4️⃣ Advanced CPR Pattern Detection
The script automatically detects all important CPR market structures:
📌 Narrow CPR
Uses statistical percentiles based on historical CPR width
Helps identify potential high-volatility breakout days
📌 CPR Width Contraction
Detects compression zones
Excellent for identifying trending days after tight ranges
📌 Ascending / Descending CPR
Bullish trend continuation (Ascending)
Bearish trend continuation (Descending)
📌 Virgin CPR
Highlights untouched CPR zones
Strong support/resistance zones for future days/weeks
📌 Overshoots
Detects:
Bullish Overshoot
Bearish Overshoot
Useful for understanding trend exhaustion.
📌 Breakouts
Identifies when price breaks above TC or below BC, signaling trend shifts.
📌 Rejections
Shows wick-based CPR rejections — reversal cues used by many price-action traders.
5️⃣ CPR Pattern Dashboard
A beautifully formatted dynamic table showing:
For Daily, Weekly, Monthly:
TC, Pivot, BC values
Current CPR Pattern
CPR Width with %
+ Next/Developing CPR values and patterns (for Daily/Weekly)
No need to manually calculate anything — everything is displayed in a clean, compact panel.
6️⃣ Completely Dynamic Across Timeframes
Works on all intraday, daily, weekly, and monthly charts
Automatically adjusts CPR length based on chart timeframe
Perfect for NIFTY, BANKNIFTY, FINNIFTY, stocks, crypto, forex
7️⃣ Alerts Included
Receive alerts for:
Narrow CPR formation
Virgin CPR
CPR breakouts
Pattern transitions
Great for traders who want automated monitoring.
8️⃣ Clean Chart, No Clutter
The script includes:
No vertical connecting lines
S/R only on the current period
Smart hiding of CPR on boundaries (to avoid "jump lines")
Fully toggleable features
You get a professional-grade, clutter-free CPR experience.
🎯 Why This Indicator?
This script goes beyond standard CPR tools by offering:
Next AND Developing CPR
Multi-timeframe CPR analysis
Professional CPR pattern detection
Smart dashboard visualization
Perfect setup for trend traders, reversal traders, and breakout traders
Whether you're scalping, day trading, swing trading, or doing positional analysis — this tool gives you context, structure, and precision.
📌 Recommended Use Cases
Intraday index trading (NIFTY, BANKNIFTY, NIFTY 50 Stocks)
Swing trading stocks
Crypto CPR analysis
Options directional setups
CPR-based breakout and reversal strategies
Trend continuation identification
Understanding volatility days (Narrow CPR Days)
⚠️ Disclaimer
This is a technical tool for chart analysis and does not guarantee profits. Always combine CPR analysis with price action, volume, and risk management.

Take Profit XTake Profit X
Take Profit X solves the #1 problem in trading: knowing when to exit. Instead of guessing or using single indicators, it aggregates 8 technical signals to identify high-probability exit points through multi-confirmation consensus. This eliminates premature exits and emotional decision-making.
The indicator counts confirmations from your chosen technical tools:
Green dot = Multiple signals say "take profit on longs/exit shorts"
Red dot = Multiple signals say "take profit on shorts/exit longs"
Signals appear when you reach the minimum confirmations threshold you set.
Possible Settings:
Conservative (Swing Trading)
pine
Minimum Confirmations: 4
Use: RSI, MACD, CCI, Supertrend, Price Action
Disable: Stochastic, Bollinger Bands, EMA Cross
Look Back Bars: 10
Aggressive (Day Trading)
pine
Minimum Confirmations: 2
Use: All indicators ON
Look Back Bars: 3-5
RSI OB/OS: 75/25
Balanced (Most Markets)
pine
Minimum Confirmations: 3
Use: RSI, MACD, CCI, Supertrend
Price Action: ON
Look Back Bars: 5-7

Ultimate Adaptive RSIUltimate Adaptive RSI
RSI That Adapts to Any Market
This isn't your grandpa's RSI. It dynamically adjusts its sensitivity based on market conditions—smoother in trends, responsive in ranges.
Traditional RSI fails in strong trends and changing volatility. UA-RSI fixes both by adapting its sensitivity in real-time, giving you reliable signals whether the market is trending, ranging, or transitioning between regimes.
How It Adapts:
Smart Pre-Smoothing: Uses Efficiency Ratio to detect trend strength and automatically lengthens/shortens its smoothing window.
Dominant Cycle Detection: Matches its internal period to the market's actual rhythm.
Dynamic Bands: RMS-based overbought/oversold levels that expand/contract with volatility.
Smoothing Stack: ALMA pre-smoothing → Ultimate Smoother → Jurik filter creates the cleanest RSI you've ever seen.
Trade Signals:
Buy: RSI crosses above lower band or midline + price confirms
Sell: RSI crosses below upper band or midline + price confirms
Bands expand in high volatility → wait for deeper extremes
Bands contract in low volatility → take earlier signals
Signal line for crossover entries
Adaptive smoothing = fewer false signals in trends
Day trading: Use 1.0 band multiplier
Swing trading: Use 1.2-1.5 multiplier
Ranging markets: Lower multiplier to 0.8
Trending markets: Raise multiplier to 1.5+
Bands widen in volatility = wait for deeper extremes
Bands tighten in calm markets = take earlier signals
Never trade RSI alone - always wait for price confirmation

VixTrixVixTrix - Because markets move in both directions.
VixTrix was born from a fundamental limitation in traditional volatility indicators: they only measure downside panic, completely missing the greed-driven extremes that form market tops.
How It Works:
Dual-Component Analysis:
vixBear = Panic selling intensity (distance from recent highs)
vixBull = FOMO buying intensity (distance from recent lows)
Oscillator = vixBear - vixBull = Net fear/greed imbalance
When the oscillator is positive, fear dominates (potential bottom forming). When negative, greed dominates (potential top forming).
Professional-Grade Filtering:
The magic happens with the symmetric RMS (Root Mean Square) bands. Unlike fixed percentage bands or standard deviation, RMS:
Creates mathematically symmetric positive/negative thresholds
Naturally adapts to changing volatility regimes
Provides statistical significance to extremes
VixTrix also adds selectable MA smoothing for the RMS calculation:
WMA (default): Balanced – middle-ground approach
VWMA: Volume-weighted – filters low-volume noise
EMA: Responsive – catches quick reversals
SMA: Stable – for swing trading
HMA: Fast and smooth – ideal for day trading
Signals require triple confirmation:
Statistical Extreme: Oscillator beyond RMS band
Price Action Confirmation: Correct candle color (bullish for bottoms, bearish for tops)
Momentum Continuation: Oscillator still moving toward extreme (exhaustion)
This multi-filter approach reduces premature entries and false signals while maintaining early positioning at potential reversal points.
Why This Matters for Your Trading:
In bull markets, traditional fear indicators sit near zero, giving no warning of impending tops.
VixTrix identifies when greed becomes excessive – when FOMO buying reaches statistical extremes that often precede corrections.
In range-bound markets, VixTrix excels at identifying overreactions in both directions, providing high-probability mean reversion opportunities.
During crashes, it captures the panic selling with the same precision as VixFix, but with better timing through its momentum confirmation.
VixTrix spots continuations through:
"No Signal" = Healthy Trend – Oscillator stays between RMS bands (no exhaustion)
Failed Extremes – Touches band but no triple confirmation = trend likely continues
Hidden Divergence – Price makes higher low while oscillator makes shallower low = uptrend continues
Controlled Emotions – Oscillator negative but not extreme in uptrends (greed present but not excessive)
Key Insight: When VixTrix doesn't give a signal during a pullback, institutions aren't panicking – they're just pausing before resuming the trend.
Green columns = Bullish exhaustion (potential bottoms)
Red columns = Bearish exhaustion (potential tops)
Golden RMS bands = Dynamic thresholds adapting to current volatility
Background highlights = Active signal conditions
The Result: A professional-grade oscillator that works in all market conditions – trending up, trending down, or ranging – by measuring the complete emotional spectrum driving price action.

AI Adaptive Supertrend ChannelAI Supertrend Channel – The Adaptive Trend System
Beyond Basic Supertrend: An Intelligent Trading Framework
The AI Adaptive Supertrend Channel transcends traditional trend following indicators by delivering a self-optimizing trading system. Its core innovation is a triple-adaptive engine that automatically adjusts channel width based on real-time market conditions:
Market Efficiency Detection – Widens during clean trends, tightens in choppy ranges
Normalized Volatility – Scales appropriately to any asset's price level
Dynamic Momentum Response – Expands aggressively during powerful directional moves
The Result: A smarter tool that reduces false signals in consolidation while giving trends ample room to run—eliminating the constant parameter tweaking required by static indicators.
Visual Signal Framework & Strategic Applications
Channel Architecture:
Primary Trend Line (Thick Green/Red): Your dynamic trailing stop and core trend indicator. Green signals an uptrend (buying bias), Red signals a downtrend (selling bias).
Upper & Lower Bands: Form a dynamic support/resistance channel around the trend.
Mid-Line: A critical mean reversion level and the trigger for key early signals.
Trading Signals & Strategic Meaning:
Primary Signal: Momentum Diamonds (High Conviction)
💎 Green Diamond (Higher High): Price closes above the Upper Band after making a new high. Signals strong bullish momentum continuation. Ideal for adding to long positions or entering new longs in an established uptrend.
💎 Red Diamond (Lower Low): Price closes below the Lower Band after making a new low. Signals strong bearish momentum continuation. Ideal for adding to short positions or entering new shorts in a downtrend.
Secondary Signal: Mid-Line Crosses (Early Action)
🔼 Green Triangle (Bullish Mid-Line Cross - bullMidCross): Price crosses above the Mid-Line. This is an early bullish pullback signal within a larger uptrend or a potential early reversal sign in a downtrend. Use for early entries or to confirm the end of a bearish pullback.
🔽 Red Triangle (Bearish Mid-Line Cross - bearMidCross): Price crosses below the Mid-Line. This is an early bearish pullback signal within a larger downtrend or a potential early warning of weakness in an uptrend. Use for early short entries or to take profits on longs.
Practical Trading Strategies
Trend Following: Align trades with the Primary Trend Line color. Use the line itself as a dynamic stop-loss. The Momentum Diamonds confirm the trend's strength.
Pullback Trading: Use the Mid-Line Cross triangles (bullMidCross/bearMidCross) to identify high-probability entries during trend retracements. The channel bands provide natural profit targets.
Breakout Confirmation: A Momentum Diamond following a period of consolidation often confirms a genuine breakout, offering a signal to enter with the new momentum.
Optimal Settings Guide
Default (Universal)
For most markets, timeframes
ATR: 13 | ER: 144 | Channel Width: 0.7
Volatility Factor: 100 | Vol MA: HMA | Trend MA: EMA
Day Trading (Fast, Responsive)
*15M-1H charts, scalping*
ATR: 8 | ER: 89 | Channel Width: 0.6
Volatility Factor: 120 | Vol MA: EMA | Trend MA: WMA
*Swing Trading (Smooth, Conservative)*
*Daily-Weekly, position trading*
ATR: 21 | ER: 200 | Channel Width: 0.9
Volatility Factor: 80 | Vol MA: HMA | Trend MA: LINREG
Channel Width × Factor
0.5-0.7 → Tighter (more signals, less room)
0.8-1.2 → Wider (fewer signals, more room to run)
Volatility Regime Factor
50-80 → Less sensitive to volatility (stable markets)
100-150 → More sensitive (volatile markets like crypto)
Base ATR Length
8-13 → Faster signals (lower timeframes)
17-21 → Smoother signals (higher timeframes)
Quick Adjustments:
Whipsaws → Increase Channel Width × Factor
Lagging → Decrease ATR Length
Volatile markets → Increase Volatility Regime Factor
Start with Default, adjust one parameter at a time based on your market and trading style.

KOBK KILLSHOT PRO V 1.0KOBK KILLSHOT PRO is an advanced trading system that combines multiple layers of technical analysis into one powerful, easy-to-use indicator. Whether you're scalping on lower timeframes or swing trading, this indicator provides crystal-clear entry and exit signals backed by comprehensive market analysis.
## 📝 **TradingView Publication Description**
---
### **Title:**
**KOBK KILLSHOT PRO - Advanced Multi-Timeframe Signal System**
---
### **Short Description:**
Professional-grade trading indicator combining multiple proprietary confirmation layers for high-probability entries and exits. Features intelligent signal quality rating, real-time dashboard, and adaptive exit strategies. Designed for serious traders who demand precision.
---
### **Full Description:**
**KOBK KILLSHOT PRO** is an advanced trading system that combines multiple layers of technical analysis into one powerful, easy-to-use indicator. Whether you're scalping on lower timeframes or swing trading, this indicator provides crystal-clear entry and exit signals backed by comprehensive market analysis.
---
## 🎯 **KEY FEATURES:**
**Smart Signal System:**
- Clear BUY and SELL labels appear directly on your chart
- Quality rating system (★★★★★) shows signal strength
- Early warning dots alert you to potential setups before they trigger
- Color-coded bars show trend direction at a glance
**Real-Time Dashboard:**
- Live ENTRY SIGNAL status (🟢 BUY NOW / 🔴 SELL NOW / ⏳ WAIT)
- Live EXIT SIGNAL status (🟠 EXIT NOW / ✋ HOLD)
- Current position tracking (LONG/SHORT/FLAT)
- Multiple confirmation indicators displayed in real-time
- Trend, momentum, and strength metrics updated every candle
**Flexible Exit Strategies:**
Choose from three exit modes:
- **Flip Mode:** Exit when opposite signal fires (simplest)
- **Momentum Shift:** Exit when momentum changes (faster)
- **Trail Lock:** Trailing stop that locks in profits (let winners run)
**Professional Visuals:**
- Clean, uncluttered chart interface
- Customizable colors and display options
- Toggle individual components on/off
- Works on any timeframe from seconds to daily
---
## 📊 **HOW TO USE IT:**
### **FOR BEGINNERS:**
**Step 1: Add to Chart**
- Apply KOBK KILLSHOT PRO to your chart
- Default settings work great for most traders
- Recommended timeframes: 15-second to 15-minute for active trading
**Step 2: Watch for Signals**
- **GREEN "BUY" label** = Enter LONG position
- **RED "SELL" label** = Enter SHORT position
- **Orange "EXIT" X** = Close your position
- Check the dashboard in top-right corner for confirmation
**Step 3: Follow the Quality Rating**
- **★★★★★ (5 stars)** = Highest probability setup - take these!
- **★★★★☆ (4 stars)** = Strong setup - good to trade
- **★★★☆☆ (3 stars)** = Decent setup - use caution
- **Lower ratings** = Skip unless very experienced
**Step 4: Use the Dashboard**
The live HUD tells you everything you need:
- **Entry Signal:** Shows when to enter (BUY NOW / SELL NOW / WAIT)
- **Exit Signal:** Shows when to exit (EXIT NOW / HOLD)
- **Position:** Tracks if you're LONG, SHORT, or FLAT
- **Quality:** Current signal strength rating
---
### **FOR ADVANCED TRADERS:**
**Customization Options:**
- Adjust signal sensitivity via Key Value parameter
- Control ATR period for different market conditions
- Enable/disable individual filter components
- Choose signal quality threshold (Maximum/High/Medium/Standard)
- Select preferred exit strategy based on trading style
**Filter System:**
The indicator includes multiple proprietary filters that can be toggled individually:
- Trend alignment filters
- Momentum confirmation filters
- Volatility filters
- Flow strength analysis
- Key zone detection
**Signal Quality Control:**
Set minimum quality requirements:
- **Maximum:** Only 5-star signals (very selective)
- **High:** 4-star minimum (recommended for most)
- **Medium:** 3-star minimum (more opportunities)
- **Standard:** 2-star minimum (active trading)
- **All Signals:** Every signal (experienced only)
---
## ⚙️ **RECOMMENDED SETTINGS:**
**For Scalping (15-second to 1-minute charts):**
- Key Value: 1.0
- ATR Period: 10
- Signal Quality: High (4-star minimum)
- Exit Mode: Flip or Momentum Shift
**For Day Trading (5-minute to 15-minute charts):**
- Key Value: 1.0 to 1.5
- ATR Period: 14
- Signal Quality: High
- Exit Mode: Trail Lock
**For Swing Trading (1-hour+ charts):**
- Key Value: 1.5 to 2.0
- ATR Period: 14-20
- Signal Quality: Maximum (5-star only)
- Exit Mode: Trail Lock
---
## 🎮 **SIMPLE TRADING RULES:**
1. **Wait for the signal** - Don't predict, let the indicator tell you
2. **Check the stars** - Higher quality = higher probability
3. **Verify the dashboard** - Make sure Entry Signal shows BUY NOW or SELL NOW
4. **Enter immediately** - When signal fires, don't hesitate
5. **Follow the exit** - When EXIT NOW appears, close the position
6. **Be disciplined** - Trust the system, don't override it
---
## ⚠️ **IMPORTANT NOTES:**
- **Not a holy grail:** No indicator is perfect. Use proper risk management.
- **Backtest first:** Test on demo/paper account before using real money.
- **Position sizing matters:** Never risk more than 1-2% per trade.
- **Market conditions vary:** Some days are better than others.
- **Combine with fundamentals:** Technical signals work best with good market context.
---
## 🔧 **DISPLAY OPTIONS:**
Toggle on/off as needed:
- Live Dashboard (HUD)
- Signal Quality Stars
- Early Warning Signals
- Key Zone Markers
- Trend Lines
- Additional confirmation indicators
---
## 📈 **BEST MARKETS TO USE:**
Works on any liquid market:
- Futures (NQ, ES, YM, etc.)
- Forex pairs (major and minor)
- Crypto (BTC, ETH, etc.)
- Stocks (high volume)
- Indices
---
## 💡 **PRO TIPS:**
1. **Start with higher quality settings** (4-5 stars only) until you're comfortable
2. **Use the early warning dots** to prepare for entries (get your finger ready)
3. **Pay attention to the dashboard trend indicator** - trade with the trend
4. **Don't trade during major news events** - wait for clear market direction
5. **Keep a trading journal** - track which star ratings work best for your style
6. **Adjust Key Value if needed** - higher = fewer signals, lower = more signals
---
## 🎯 **WHAT MAKES THIS DIFFERENT:**
Unlike simple indicators that just draw lines or show one metric, KOBK KILLSHOT PRO combines multiple proprietary analysis layers into one cohesive system. The intelligent filtering ensures you only see high-probability setups, while the real-time dashboard keeps you informed of market conditions every step of the way.
The star rating system is particularly powerful - it instantly tells you how many confirmation factors are aligned, so you can make quick decisions about which signals to take and which to skip.
---
## 📞 **SUPPORT:**
For questions, setup help, or optimization tips, feel free to reach out via TradingView messages. I'm here to help you succeed with this system!
---
**Disclaimer:** This indicator is for educational and informational purposes only. Trading involves substantial risk. Past performance does not guarantee future results. Always use proper risk management and never trade with money you can't afford to lose.
---
## 🏆 **START TRADING SMARTER TODAY**
