CNagda-MomentumX - Institutional FlowMomentumX is designed to empower traders with a deeper understanding of market movements by focusing on Institutional Flow and advanced market structure analytics. The core goal is to identify and visualize where major market participants are operating, and to translate these complex footprints into clear, actionable trading signals — all in real time.
Real-time institutional activity mapping
Actionable entry and exit signals based on live market structure
Intuitive dashboard and dynamic chart visuals
Fully customizable modules for trend, liquidity, and order blocks
Core Logic Design
At the heart of MomentumX lies a robust algorithmic engine built to capture and surface institutional trading behavior. By leveraging advanced mathematical models, the indicator calculates institutional volume ratios and price momentum to pinpoint aggressive moves from large participants.
Institutional Volume & Price Momentum:
Utilizes custom volume indicators and price change analysis to detect strong buying or selling pressure, filtering out retail noise.
Liquidity Grab Detection & Activity Zones:
The script identifies liquidity grabs by monitoring abrupt price sweeps at major support/resistance levels—often where institutions trigger stop hunts or reversals. All critical activity zones are automatically color-coded on the chart for instant recognition.
Dashboard Visualization:
A fully dynamic dashboard table overlays live scores for accumulation, distribution, strength, and weakness—giving traders a real-time scan of market health.
Trendline & Order Block Architecture:
The logic auto-detects pivot highs/lows to draw smart trendlines, while the order block system highlights key reversal areas and breaker zones—making market structure clear and actionable.
MomentumX is packed with high-performance modules, each engineered to simplify complex market behavior and enhance decision-making for traders:
Institutional Flow Signals:
Instantly identifies spots where institutional players drive momentum, using unique volume and price activity analytics.
Bullish/Bearish Liquidity Grab Detection:
Marks abrupt price moves that signal stop hunts or reversals, letting traders anticipate snap-backs or trend shifts.
Trendline Auto-Detection:
Smartly draws trendlines based on significant swing highs and lows, automatically adjusting as price evolves.
Order Block System (Rejection/Breaker):
Spots and highlights key reversal zones with order block rectangles, confirming rejections or breakouts at strategic levels.
Dashboard and Bar Coloring:
A clean dashboard overlay presents live market scores, while dynamic bar coloring makes trend, strength, and high-activity periods instantly visible.
User Input Toggles for Each Module:
Every major feature is fully customizable—enable or disable modules to match individual trading setups or preferences.
Scripting/Development
MomentumX’s scripting process is modular, enabling clarity, scalability, and fast optimization throughout development:
Initialization & Inputs:
Start by defining all user input options, module toggles, color settings, and calculation parameters—ensuring maximum flexibility early on.
Core Calculation Functions:
Script advanced institutional volume and price momentum algorithms. Build out swing length logic, market state filters, and activity scoring methods.
Detection Engines:
Develop and integrate engines for liquidity grabs, automated trendline detection, and order block identification—each with dedicated functions for speed and precision.
Visual Overlays & Plotting:
Implement powerful plotting logic for colored bars, score dashboards, trendlines, reversal zones, and liquidity markers—making every data point clear and actionable on the chart.
Testing Handlers:
Add diagnostic panels and debug outputs to refine calculations and assure accuracy in every market environment.
Sample Trade Setups (Usage)
Cnagda MomentumX delivers clarity for multiple trading styles by providing timely, actionable setups grounded in institutional behavior and market structure. Here’s how traders can leverage the indicator for confident decision-making:
Liquidity Grab Reversal
Enter trades around detected liquidity grabs when price sweeps major support/resistance and the dashboard signals a momentum shift.
Example: Wait for a bullish/Bearish grab near market lows/high, with institutional flow turning positive/negative—enter long/short for potential mean reversion.
Order Block Breakout
Trade breakouts when price cleanly rejects or flips key order block zones highlighted on the chart.
Example: Short at a marked breaker block after a rejection signal, confirmed by a downward institutional activity spike.
Trendline Continuation
Ride established market moves by entering on trendline confirmations plotted by the auto-detect system.
Example: Go long after a trendline retest, confirmed by a green bar color and dashboard strength score.
Dashboard Confirmation
Combine dashboard metrics (strength, accumulation, distribution) with bar color overlays for multi-factor entries.
Example: Enter trades only when all market signals align in real time for maximum probability.
For Short Entry check -- Weakness : For Long Entry Check - Strength With Other Indications
MomentumX is not just another indicator – it’s your edge for reading the market like an insider. By transparently mapping institutional flow, uncovering hidden liquidity zones, and color-coding every major structure shift, MomentumX transforms complexity into actionable clarity. Whether you’re scalping, swing trading, or investing, you’ll gain a decisive, real-time advantage on every chart.
Embrace smarter decisions, adapt to changing market conditions instantly, and join a new generation of technically empowered traders.
Customize, observe, and let the market reveal opportunities in a way you’ve never experienced before.
Happy Trading
Search in scripts for "swing trading"

LA - Opening Price based Previous day Range PivotThis "LA - Opening Price based Previous day Range Pivot" indicator is a custom technical analysis tool designed for Trading View charts. It plots support and resistance levels (often referred to as pivots or ranges) based on the current opening price combined with the previous period's trading range. The "previous period" can be daily, weekly, or monthly, making it a multi-timeframe tool. These levels are projected using Fibonacci-inspired multipliers to create potential breakout or reversal zones.
The core idea is inspired by concepts like the Opening Range Breakout (ORB) strategy or Fibonacci pivots, but it's customized here to use a dynamic range calculation (the maximum of several absolute price differences) rather than a simple high-low range. This makes it more robust for volatile markets. Levels are symmetric above (resistance) and below (support) the opening price, helping traders identify potential entry/exit points, stop-losses, or targets. This will be useful when there is a gap-up/down as in Nifty/Sensex .
Purpose of the Indicator:
To visualize potential support/resistance zones for the current trading session based on the opening price and historical range data. This helps traders anticipate price movements, such as breakouts above resistance or bounces off support
Use Cases:
Intraday Trading: On lower timeframes (e.g., 5-min or 15-min charts), it shows daily levels for short-term trades.
Swing Trading: On higher timeframes (e.g., hourly or daily), it displays weekly/monthly levels for longer holds.
Range Identification: The filled bands highlight "zones" where price might consolidate or reverse.
Conditional Display: Levels only appear on appropriate timeframes (e.g., daily levels on intraday charts <60min), preventing clutter.
Theoretical Basis: It builds on pivot point theory, where the opening price acts as a central pivot. Multipliers (e.g., 0.618 for Fibonacci golden ratio) project levels, assuming price often respects these ratios due to market psychology.
How Calculations Work
Let's dive into the math with examples. Assume a stock with:
Current daily open (cdo) = $100
Previous daily high (pdh) = $105, low (pdl) = $95, close (pdc) = $102, close 2 days ago (pdc2) = $98
Step 1: Dynamic Range Calculation (var_d2):
This is the max of:
|pdh - pdc2| = |105 - 98| = 7
|pdl - pdc2| = |95 - 98| = 3
|pdh - pdl| = |105 - 95| = 10 (previous day range)
|pdh - cdo| = |105 - 100| = 5
|pdl - cdo| = |95 - 100| = 5
|pdc - cdo| = |102 - 100| = 2
|pdc2 - cdo| = |98 - 100| = 2
Max = 10 (so range = 10). This ensures the range accounts for gaps and extended moves, not just high-low.
Step 2: Level Projections:
Resistance (above open): Open + (Range * Multiplier)
dre6 = 100 + (10 * 1.5) = 115
dre5 = 100 + (10 * 1.27) ≈ 112.7
... down to dre0 = 100 + (10 * 0.1) = 101
dre50 = 100 + (10 * 0.5) = 105 (midpoint)
Support (below open): Open - (Range * Multiplier)
dsu0 = 100 - (10 * 0.1) = 99
... up to dsu6 = 100 - (10 * 1.5) = 85
Without Indicator
With Indicator
Pros and Cons
Pros:
Multi-Timeframe Flexibility: Seamlessly integrates daily, weekly, and monthly levels, useful for aligning short-term trades with longer trends (e.g., intraday breakout confirmed by weekly support).
Dynamic Range Calculation: Unlike standard pivots (just (H+L+C)/3), it uses max of multiple diffs, capturing gaps/volatility better—great for stocks with overnight moves.
Customizable via Inputs: Users can toggle levels, adjust multipliers, or change timeframes without editing code. Inline inputs keep the UI clean.
Visual Aids: Filled bands make zones obvious; conditional colors highlight "tight" vs. "wide" ranges (e.g., for volatility assessment).
Fibonacci Integration: Levels based on proven ratios, appealing to technical traders. Symmetric supports/resistances simplify strategy building (e.g., buy at support, sell at resistance).
No Repainting: Uses historical data with lookahead, so levels are fixed once calculated—reliable for back-testing.
Cons:
Chart Clutter: With all toggles on, 50+ plots/fills can overwhelm the chart, especially on mobile or small screens. Requires manual disabling.
Complexity for Beginners: Many inputs and calculations; without understanding fib ratios or range logic, it might confuse new users.
Performance Overhead: On low timeframes (e.g., 1-min), fetching higher TF data multiple times could lag, especially with many symbols or back-tests.
Assumes Volatility Persistence: Relies on previous range projecting future moves; in low-vol markets (e.g., sideways trends), levels may be irrelevant or too wide/narrow.
No Alerts or Signals: Purely visual; no built-in buy/sell alerts or crossover conditions—users must add separately.
Hardcoded Styles/Colors: Limited customization without code edits (e.g., can't change line styles via inputs).
Also, not optimized for non-stock assets (e.g., forex with 24/7 trading).
In summary, this is a versatile pivot tool for range-based trading based on Opening price, excelling in volatile markets but requiring some setup. If you're using it, start with defaults on a daily chart and toggle off unnecessary levels.

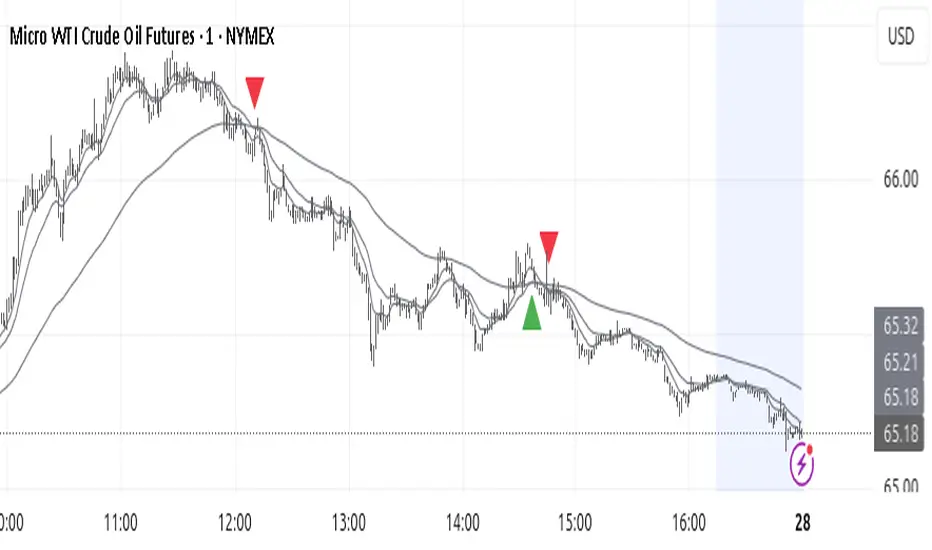
Trend TraderThe Trend Trader indicator is a trend-following tool based on a triple EMA (Exponential Moving Average) setup designed to help traders identify market direction and potential reversal zones. It plots three customizable EMAs on the chart to highlight bullish and bearish momentum, then generates trade signals when price shows a strong likelihood of continuing in the direction of the prevailing trend.
EMA Alignment: The indicator checks for bullish stacking (fast EMA above medium, medium above slow) and bearish stacking (fast EMA below medium, medium below slow). This alignment defines the prevailing market trend.
Trend Validation: A user-defined lookback period ensures signals are only taken if the market recently displayed a stacked trend, thus filtering false entries during consolidations.
Signal Generation: Buy signals appear when price dips into the zone between the fast and medium EMAs during a bullish trend. Sell signals appear when price rallies into the zone between the fast and medium EMAs during a bearish trend.
Alerts: Built-in alerts notify traders of new trade opportunities without having to constantly watch the chart.
This indicator is suitable for swing trading and intraday strategies across multiple markets, including forex, stocks, indices, and crypto.
Suggested Strategy for Profitability
This tool is best used as part of a structured trend-trading plan. Below is a suggested framework:
Entry Rules
Long (Buy Trade):
Confirm that EMA alignment is bullish (EMA1 > EMA2 > EMA3).
Wait for a Buy Signal (triangle up below price).
Ensure the higher timeframe (e.g., 4H if trading 1H) trend is also bullish to filter trades.
Short (Sell Trade):
Confirm EMA alignment is bearish (EMA1 < EMA2 < EMA3).
Wait for a Sell Signal (triangle down above price).
Higher timeframe should also be bearish to increase probability.
Stop Loss
For long positions, place the stop loss just below EMA3 or the most recent swing low.
For short positions, place the stop loss just above EMA3 or the most recent swing high.
Take Profit
Conservative: Set TP at 1.5x to 2x the stop loss distance.
Aggressive: Trail stop loss below EMA2 (for longs) or above EMA2 (for shorts) to capture larger trends.
Risk Management
Use no more than 1–2% of account risk per trade.
Trade only when the signal aligns with overall market context (higher timeframe, support/resistance, or volume confirmation).
This indicator is very similar to the indicator "Trend Scalper" by the same developer, the difference is this indicator is used to just find the trade and hold the trade or to find the reversal of a trend instead of triggering alerts every time price enters between EMA1 and EMA2.
SwingArm High Pressure V6.7.3SwingArm High Pressure V6.7.3 - User Guide
Overview
SwingArm High Pressure is a multi-timeframe trading indicator designed to identify high-probability entry zones and profit targets. This indicator works best when combined with the standard SwingArm indicator to display 8-hour and higher timeframes for complete market analysis.
Key Features
1. Multi-Timeframe Analysis
Chart Timeframe (CT): Your primary entry timeframe
Higher Timeframe 1 (HTF1): Secondary confirmation and targets
Higher Timeframe 2 (HTF2): Extended swing targets
2. Trading Type Selection
Choose between two preset configurations:
CT/15m/1H: For day trading and scalping
CT/2H/4H: For swing trading (recommended to pair with standard SwingArm for 8H+ timeframes)
3. Entry Zones
Optimal Entry Boxes (High-Pressure Zones)
BLUE boxes: Bullish optimal entry zones (high-pressure buying opportunity)
YELLOW boxes: Bearish optimal entry zones (high-pressure selling opportunity)
These represent the highest probability entries when price reaches these levels
Fresh SwingArm Zones
GREEN zones: Freshly created bullish swingarm areas
RED zones: Freshly created bearish swingarm areas
Deeper entries into zones (78.6%-88.6%) provide better risk/reward ratios
4. Fibonacci Levels
Each swingarm zone contains three Fibonacci retracement levels:
Fib. 61.8%: Early entry (consider waiting for deeper levels)
Fib. 78.6%: Good entry opportunity
Fib. 88.6%: Deep entry with excellent risk/reward
5. Zone Labels
The indicator automatically labels zones based on their function:
Internal Zones (shorter timeframes):
Display as "INTERNAL - Buy/Sell Zones"
May cycle multiple times before reaching targets
Best for scalping and quick trades
External Zones (higher timeframes):
Display as "EXTERNAL TARGET - Take Profit"
Primary profit-taking areas
Use for swing trade exits
Trading Strategy
Entry Setup
Wait for fresh zone creation (green/red zones appear)
Identify optimal entry boxes (blue/yellow high-pressure areas)
Enter at Fibonacci levels:
Best entries: 78.6%-88.6% (deeper is better)
Acceptable: 61.8% (but watch for deeper retracements)
Trade Management
Stop Loss: Place below swingarm low (long) or above swingarm high (short)
Targets: Use higher timeframe zones for profit objectives
Internal vs External: Internal zones may flip multiple times; external zones are swing targets
Timeframe Hierarchy
Lower timeframe zones = Entry areas
Higher timeframe zones = Target/profit areas
Example: Enter at 15M zones, target 2H/4H zones for exits
Alert System
Available Alerts
Fresh SwingArm Zone Alerts: Notifies when new green/red zones are created
Fib. 88.6% Break Alerts: Deepest entry level touched
Fib. 78.6% Break Alerts: Good entry level touched
Fib. 61.8% Break Alerts: Early entry level touched
Pressure ON / Optimal Alerts: High-pressure zones activated
Circle Alerts: Pressure signal confirmations
Probability Alerts: Set threshold for long/short probability notifications
Alert Messages Include:
Entry quality rating (DEEPEST, DEEP, GOOD, EARLY)
Current price level
Risk/reward guidance
Target zone information
Probability System
The indicator calculates buying and selling pressure across multiple timeframes:
Long Probability: Bullish pressure percentage
Short Probability: Bearish pressure percentage
Set custom thresholds (default 50%) to receive alerts only when probability exceeds your criteria
Customization Options
Visual Settings
RSI Candle Colors: Enable/disable and customize overbought (blue) and oversold (red) candle colors
Label Display: Toggle individual Fibonacci level labels (61.8%, 78.6%, 88.6%)
Label Colors: Customize colors for long and short labels
Label Size: Adjust label size (Tiny to Huge)
Swingarm Pressure Labels: Show/hide zone break labels
Table Display
Probability Status Table: Shows current pressure analysis
Swingarm Status: Displays current swingarm states across timeframes
Position & Size: Customize table location and text size
Statistics Table
Break Statistics: Track swingarm breaks over time
Performance Metrics: View historical break data per timeframe
Best Practices
Combine with Standard SwingArm: Use the regular SwingArm indicator to display 8-hour and higher timeframes for complete market structure
Respect Timeframe Hierarchy: Always enter on lower timeframes and target higher timeframes
Wait for Deep Entries: The 78.6% and 88.6% levels offer the best risk/reward ratios
Watch Internal Cycles: Shorter timeframe zones may reverse multiple times - don't expect straight-line moves to targets
Use Optimal Entry Boxes: Blue and yellow high-pressure zones provide the highest probability setups
Confirm with Multiple Timeframes: Look for alignment across all three selected timeframes for strongest signals
Notes
This indicator is optimized for 1m, 15m, 1H, 2H, and 4H timeframes
For best results, use in conjunction with proper risk management
Entry opportunities include both optimal entry boxes AND fresh swingarm zones
Deeper zone entries consistently provide better risk/reward ratios
Support
For questions or assistance, refer to the indicator settings tooltips or contact the developer through x.
Disclaimer:
This indicator is for educational purposes. Always practice proper risk management and never risk more than you can afford to lose.

Fibonacci Ret/Ext ProFibonacci Ret/Ext Pro - Advanced Fibonacci Retracement & Extension Tool
Transform your technical analysis with this professional-grade Fibonacci indicator that automatically detects market structure and draws precise retracement and extension levels.
Key Features:
🎯 Smart Market Structure Detection
Automatic pivot high/low identification with customizable periods
CHoCH (Change of Character) visualization
Real-time swing tracking with intelligent structure recognition
Bullish/bearish market structure highlighting
📊 Comprehensive Fibonacci Levels
Standard levels: 0, 23.6%, 38.2%, 50%, 61.8%, 78.6%, 100%
Extension levels: 127.2%, 161.8%
Negative retracement levels: -27.2%, -38.2%, -61.8%, -100%, -161.8%, -200%
Fully customizable level values and colors
⚙️ Advanced Customization
Individual level toggles - show only what you need
Custom colors for each Fibonacci level
Adjustable line widths and styles
Smart label positioning with price display
Golden Zone highlighting (customizable fill areas)
🔄 Dynamic Display Options
Real-time level extension to current bar
Swing line connections between pivots
Automatic level updates on structure changes
Clean chart display - old levels are automatically cleared
📍 Professional Labeling
Configurable label positions (left/right, above/below/on-line)
Multiple size options (tiny to large)
Price values displayed alongside Fibonacci ratios
Clean, professional appearance
How It Works:
The indicator automatically identifies significant swing highs and lows based on your chosen structure period. When market structure changes from bullish to bearish (or vice versa), it instantly calculates and displays Fibonacci levels from the most recent swing points. No manual drawing required - the algorithm handles everything automatically.
Perfect For:
Swing traders identifying key support/resistance levels
Day traders looking for precise entry/exit points
Position traders planning long-term entries
Anyone seeking professional Fibonacci analysis without manual plotting
Settings Presets:
Short (8 bars) - For intraday/scalping
Medium (21 bars) - For swing trading
Long (55 bars) - For position trading
Custom - Define your own structure period
This indicator provides clean, professional Fibonacci analysis that updates automatically as market structure evolves. No more manual Fibonacci drawing - let the algorithm identify the key levels for you.
Want to take your trading to the next level?
This Fibonacci tool is just one component of a complete trading system. For the full professional experience, check out my Optimus Indicator - a comprehensive full-stack trading system that includes:
Multi-timeframe trend analysis
Advanced buy/sell signals with filtering
Win/loss tracking and statistics
Stop loss management
Real-time alerts and notifications
And much more...
The Optimus Indicator provides everything a serious trader needs in one integrated platform. If you're ready for professional-grade trading tools, reach out privately for access to the complete system.
Disclaimer: This indicator is for educational and informational purposes only. Past performance does not guarantee future results. Always use proper risk management and never risk more than you can afford to lose.

GME Cycle Predictor# 🚀 GME Cycle Predictor - Advanced Technical Analysis Tool
**Comprehensive GameStop (GME) cycle tracking indicator based on historical patterns and market mechanics.**
## 📊 **What This Indicator Does:**
- Tracks **147-day quarterly cycles** from the January 28, 2021 squeeze
- Monitors the **1704-day major cycle** (the theoretical "big one")
- Identifies **T+35 FTD settlement periods** for forced buying pressure
- Marks **quarterly OPEX** and **swap roll dates**
- Provides **real-time buy/sell recommendations** based on cycle timing
## 🎯 **Key Features:**
### **Visual Cycle Markers:**
- 🔴 **Red Circles**: 147-day quarterly cycles
- 🟡 **Yellow Diamonds**: 1704-day major cycle (CRITICAL)
- 🟢 **Green Squares**: T+35 FTD settlement dates
- 🟠 **Orange Triangles**: Quarterly OPEX periods
- 🟣 **Purple X's**: Swap roll periods
### **Smart Trading Signals:**
- **🚀 MAJOR BUY**: 10+ days before 1704-day cycle
- **📈 BUY ZONE**: 5-10 days before 147-day cycle
- **💚 FTD BUY**: 2-5 days before T+35 settlement
- **📉 SELL ZONE**: Day of cycle completion
- **⏳ WAIT**: No active signals
## 📈 **How to Use:**
### **For Swing Trading:**
1. **BUY** when cheat sheet shows active buy signals
2. **SELL** on cycle completion days
3. **HODL** through the 1704-day major cycle
### **For Long-term Investors:**
- Monitor the **1704-day countdown** (major cycle theory)
- Accumulate during **confluence periods** (multiple cycles aligning)
- Use **147-day cycles** for entry/exit timing
## 🔧 **Technical Foundation:**
- Based on **Fail-to-Deliver (FTD)** settlement mechanics
- **Quarterly swap theory** and institutional obligations
- **Options expiration (OPEX)** pressure points
- **Historical pattern recognition** from 2021 squeeze
## ⚡ **Real-Time Features:**
- **Live countdown timers** to next major cycles
- **Dynamic trading recommendations**
- **Confluence detection** when multiple cycles align
- **Volume confirmation** for signal validation
- **Clean visual design** with minimal chart clutter
## 🎯 **Perfect For:**
- GME traders following cycle theory
- Technical analysts studying market mechanics
- Swing traders using institutional obligation cycles
- Anyone tracking the theoretical "MOASS" timing
## ⚠️ **Important Notes:**
- This indicator is based on **theoretical cycle patterns**
- Past performance does not guarantee future results
- Always use proper risk management
- The 1704-day cycle is **unproven theory** - trade responsibly
- Best used in conjunction with other technical analysis
## 🚀 **Special Feature:**
The **1704-day major cycle** countdown tracks the theoretical "Mother of All Short Squeezes" (MOASS) timing, calculated from the January 28, 2021 squeeze peak. This is the cycle many GME theorists believe will trigger the ultimate price movement.
---
**Perfect for both beginners and advanced traders who want to incorporate GME cycle theory into their technical analysis toolkit.**
*Disclaimer: This is a theoretical analysis tool based on community research. Not financial advice. Trade at your own risk.*

Trader Marks Trailing SL + TP (BE @ 60%)This script provides a unique stop-loss and take-profit management tool designed for swing traders.
It introduces a two-stage stop-loss logic that is not available in standard TradingView tools:
Break-Even Protection: Once a defined profit threshold (e.g. 66%) is reached, the stop-loss automatically moves to break-even.
ATR-Based Trailing Stop: After a chosen delay (e.g. 12 hours), the script activates a dynamic trailing stop that follows market volatility using the ATR.
Flexible Ratchet Mechanism: The stop-loss can be locked at new profit levels and will never move backwards.
This combination allows traders to secure profits while still giving the trade room to develop. The indicator is especially useful for swing trading on 4H and daily timeframes but can be applied to other styles as well.
How to use:
Enter your entry price, stop-loss, and take-profit levels.
Choose your trailing mode: Exact S/L+ (simple) or Advanced (Delay + BE + Ratchet).
Adjust parameters such as ATR length or activation delay to match your strategy.
The script helps you balance risk and reward by ensuring that once the trade moves in your favor, you cannot lose the initial risk, while still benefiting from extended market moves.

SZN - Altcoin OscillatorSZN Altcoin Oscillator – Identify Market Phases with Precision
What is the SZN Altcoin Oscillator?
The SZN Altcoin Oscillator is a multi-layered analysis indicator specifically developed for the altcoin market.
It combines different signal groups (trend, relative strength, volume, market environment, and overheating filters) into a unified oscillator in the 0–100 range.
--> The goal is to make major market movements visible while separating short-term fluctuations from broader trends.
Why not just use RSI or MACD?
Classic single indicators like RSI or MACD often react too sensitively to short-term fluctuations.
This leads to many false signals – especially during volatile altcoin phases.
--> The SZN Altcoin Oscillator solves this problem by combining and filtering multiple signal sources.
--> This smooths out overreactions and identifies true trend movements more reliably.
-----
How does it work?
The oscillator consists of five signal groups:
Price & Trend Momentum
checks the relative position of fast and slow moving averages
detects whether an altcoin is in a confirmed uptrend or downtrend
Relative Strength vs. Bitcoin & Ethereum
measures performance compared to the two market leaders
shows whether capital is rotating into altcoins or staying in majors
Volume and Breakout Filter
detects whether breakouts are confirmed by increased volume
prevents short “fakeouts” from appearing as buy signals
Market Environment (Regime Filter)
includes overall market data such as BTC dominance or TOTAL3
ensures that buy signals only trigger in suitable market phases
Overheating & Oversold Filter
marks statistically extreme zones
upward cross from oversold → buy signal
downward cross from overheated → sell signal
--> All results are displayed in a 0–100 oscillator.
Buy signal: upward cross from oversold zones
Sell signal: downward cross from overheated zones
-----
Variants (selection in the settings menu)
The indicator offers 5 preconfigured variants, optimized for different altcoin groups:
Default
The neutral standard configuration – balanced between sensitivity and stability. Suitable for a wide range of altcoins with medium to large market capitalization.
Large Caps
More conservative parameters with stronger smoothing. Designed for established projects (Top 20), where trends develop more slowly but with higher reliability.
Mid Caps
A balanced approach for mid-sized market caps. More sensitive than the Large-Cap variant, but filters more noise than the Small-Cap settings.
Small Caps
Higher sensitivity, optimized for more volatile coins (Top 100–200). Detects dynamic moves faster, but with higher risk of false signals.
Meme Coins
Adapted for highly speculative tokens. Accounts for extreme volatility and shorter cycles to better highlight overheating phases.
--> This allows each user to select the variant best suited to the asset category being analyzed.
-----
Recommended Usage
Timeframe: Daily chart (highest precision). For very new projects, the 8h chart can be used.
Asset selection: Coins with sufficient history (at least 200 trading days).
-----
Interpretation:
Oscillator rising from oversold → potential bottom / upward trend reversal
Oscillator falling from overheated → potential top / profit-taking zone
Movements in between indicate interim rallies or correction phases
The indicator is not a day-trading tool, but optimized for cyclical moves and swing trading.
-----
Notes:
The SZN Altcoin Oscillator is an additional analysis tool and does not replace independent trading decisions.
All signals are probabilistic; there is no guarantee of profits.
Effectiveness depends on the specific altcoin and the current market phase.
The indicator provides insights into broader market phases, not short-term price moves.

Enhanced Chande Momentum OscillatorEnhanced Chande Momentum Oscillator (Enh CMO)
📊 Description
The Enhanced Chande Momentum Oscillator is an advanced version of the classic Chande Momentum Oscillator with dynamic envelope boundaries that automatically adapt to market volatility. This indicator provides clear visual signals for potential price reversals and momentum shifts.
Key Features:
Original Chande Momentum Oscillator calculation
Dynamic upper and lower boundaries based on statistical analysis
Adaptive envelope that adjusts to market volatility
Visual fill area between boundaries for easy interpretation
Real-time values table with current readings
Built-in alert conditions for boundary touches
Customizable moving average types (SMA, EMA, WMA)
⚙️ Settings
CMO Settings:
CMO Length (9): Period for calculating the base Chande Momentum Oscillator
Source (close): Price source for calculations
Envelope Settings:
Envelope Length (20): Lookback period for calculating the moving average and standard deviation
Envelope Multiplier (1.5): Multiplier for standard deviation to create upper/lower bounds
Moving Average Type (EMA): Type of moving average for envelope calculation
📈 How to Use
Visual Elements
Lines:
White Line: Main Chande Momentum Oscillator
Red Line: Upper boundary (resistance level)
Green Line: Lower boundary (support level)
Yellow Line: Moving average of CMO (trend direction)
Purple Fill: Visual envelope between boundaries
Reference Lines:
Zero Line: Neutral momentum level
+50/-50 Lines: Traditional overbought/oversold levels
Trading Signals
🔴 Sell/Short Signals
CMO touches or crosses above upper boundary → Potential bearish reversal
CMO is above +50 and declining → Weakening bullish momentum
CMO crosses below yellow MA line while above zero → Momentum shift
🟢 Buy/Long Signals
CMO touches or crosses below lower boundary → Potential bullish reversal
CMO is below -50 and rising → Weakening bearish momentum
CMO crosses above yellow MA line while below zero → Momentum shift
⚡ Advanced Signals
Boundary contraction → Decreasing volatility, potential breakout coming
Boundary expansion → High volatility period, use wider stops
CMO hugging upper boundary → Strong uptrend continuation
CMO hugging lower boundary → Strong downtrend continuation
🎯 Trading Strategies
Strategy 1: Reversal Trading
Wait for CMO to touch extreme boundaries (red or green lines)
Look for divergence with price action
Enter counter-trend position when CMO starts moving back toward center
Set stop beyond the boundary breach point
Take profit near zero line or opposite boundary
Strategy 2: Momentum Confirmation
Use CMO direction to confirm trend
Enter positions when CMO crosses above/below yellow MA line
Hold positions while CMO remains on the correct side of MA
Exit when CMO crosses back through MA line
Strategy 3: Volatility Breakout
Monitor boundary width (envelope expansion/contraction)
When boundaries contract significantly, prepare for breakout
Enter in direction of CMO breakout from narrow range
Use boundary expansion as confirmation signal
⚠️ Important Notes
Best Timeframes
Scalping: 1m, 5m charts
Day Trading: 15m, 30m, 1H charts
Swing Trading: 4H, Daily charts
Market Conditions
Trending Markets: Focus on momentum confirmation signals
Ranging Markets: Focus on boundary reversal signals
High Volatility: Increase envelope multiplier (1.8-2.5)
Low Volatility: Decrease envelope multiplier (1.0-1.3)
Risk Management
Always use stop losses beyond boundary levels
Reduce position size during boundary expansion periods
Combine with price action and support/resistance levels
Monitor the real-time table for precise entry/exit levels
🔔 Alerts
The indicator includes built-in alert conditions:
"CMO Above Upper Bound": Potential reversal down signal
"CMO Below Lower Bound": Potential reversal up signal
Set these alerts to catch opportunities without constantly monitoring charts.
💡 Tips for Success
Combine with other indicators: Use with RSI, MACD, or volume indicators for confirmation
Watch for divergences: CMO making new highs/lows while price doesn't follow
Use multiple timeframes: Check higher timeframe CMO for overall trend context
Adjust settings for different assets: Crypto may need different settings than forex
Paper trade first: Test the indicator with your trading style before using real money
🎨 Customization Tips
Change colors in the Pine Script to match your chart theme
Adjust envelope length for faster (shorter) or slower (longer) signals
Modify envelope multiplier based on asset volatility
Hide the table if it obstructs your view by commenting out the table section
Complete trading solution: Pair with the Optimus Indicator (paid indicator) for multi-timeframe trend analysis and trend signals.
Together they create a powerful confluence system for professional trading setups.

Universal Gann Square & Cube LevelsUniversal Gann Square & Cube Levels - Dynamic Support/Resistance
Description:
📊 UNIVERSAL GANN LEVELS INDICATOR
This powerful indicator automatically plots Gann Square and Cube levels around the current stock price, providing dynamic support and resistance levels based on W.D. Gann's mathematical theories.
🎯 KEY FEATURES:
✅ Auto-Adaptive: Works for ANY stock price (₹20 to ₹100,000+)
✅ Real-time Detection: Uses current close price automatically
✅ Dual Level System: Square levels (black) + Cube levels (red)
✅ Customizable Range: Adjust percentage range (5% to 50%)
✅ Clean Display: Toggle square/cube lines independently
✅ Universal Compatibility: Works on all timeframes and instruments
📈 HOW IT WORKS:
Square Levels (Black Lines): Based on perfect squares (n²) around current price
Cube Levels (Red Lines): Based on perfect cubes (n³) around current price
Smart Range: Automatically calculates relevant levels within your specified percentage range
Info Display: Shows current price and level counts
⚙️ SETTINGS:
Price Range %: Control how many levels appear (default: 15%)
Show Square Levels: Toggle black square lines on/off
Show Cube Levels: Toggle red cube lines on/off
🔥 PERFECT FOR:
Day traders seeking precise entry/exit points
Swing traders identifying key support/resistance zones
Gann theory practitioners and students
Multi-timeframe analysis across all instruments
💡 USAGE TIPS:
Use 10-20% range for active day trading
Use 30-50% range for swing trading analysis
Watch for price reactions at square/cube intersections
Combine with volume analysis for confirmation
🌟 WHY THIS INDICATOR?
Unlike fixed Gann calculators, this indicator dynamically adapts to ANY price level, making it truly universal for Indian stocks, crypto, forex, and commodities.
⚠️ DISCLAIMER:
This indicator is for educational and informational purposes only. It is not financial advice and should not be considered as a recommendation to buy or sell any security. Trading involves significant risk of loss and may not be suitable for all investors. Past performance does not guarantee future results. Always conduct your own research and consult with a qualified financial advisor before making any investment decisions. The developer assumes no responsibility for any trading losses incurred through the use of this indicator.
📋 COMPATIBILITY:
All TradingView plans
All timeframes (1m to 1M)
Stocks, Crypto, Forex, Commodities
Mobile and desktop platforms

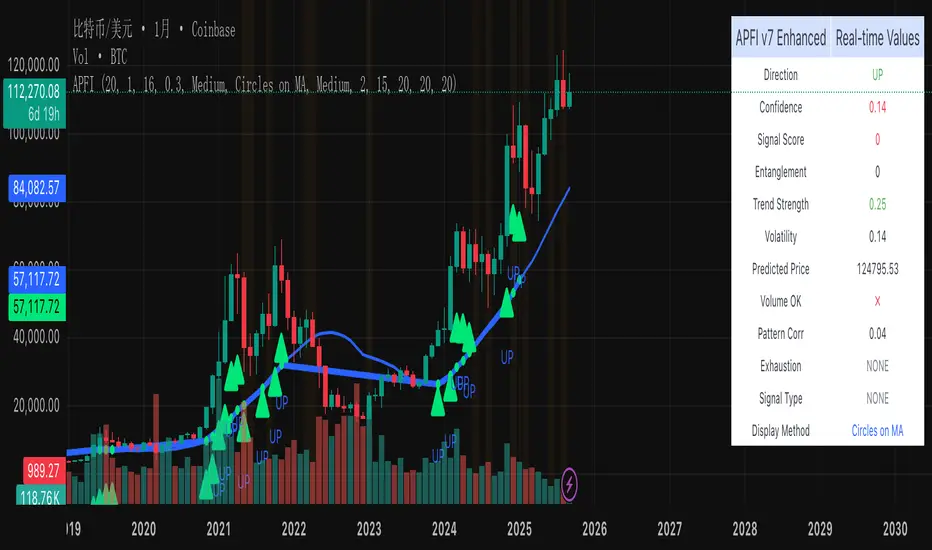
Predictive Financial Indicator# TradingView Script Description - APFI v7 Enhanced
## 📊 **Advanced Predictive Financial Indicator v7 Enhanced**
### **Overview**
This indicator combines multiple advanced technical analysis concepts to predict potential price movements and identify high-probability turning points. It uses a proprietary multi-factor scoring system that analyzes market behavior patterns, trend dynamics, and volatility characteristics to generate predictive signals.
### **Core Methodology**
#### **1. Entanglement Factor Analysis**
- **Concept**: Measures market predictability through autocorrelation analysis of price momentum
- **Purpose**: Identifies periods when price movements follow predictable patterns
- **Implementation**: Calculates correlation between current and historical price changes across multiple timeframes
- **Value**: Higher entanglement indicates more predictable market behavior, increasing signal reliability
#### **2. Trend Strength Assessment**
- **Concept**: Evaluates the relationship between current price and moving average with momentum components
- **Purpose**: Determines trend quality and persistence
- **Implementation**: Combines price-to-MA ratio with short-term momentum analysis
- **Value**: Strong trends provide better context for signal validation
#### **3. Volatility Analysis**
- **Concept**: Multi-dimensional volatility assessment using both statistical and ATR-based measures
- **Purpose**: Identifies market conditions that favor certain signal types
- **Implementation**: Combines standard deviation of returns with ATR-based volatility ratios
- **Value**: Helps distinguish between high-confidence and low-confidence market environments
#### **4. Exhaustion Detection**
- **Concept**: Identifies when trends are losing momentum across multiple timeframes
- **Purpose**: Predicts potential trend reversals before they occur
- **Implementation**: Analyzes momentum slope changes and compares short vs. long-term momentum
- **Value**: Critical for turning point identification and risk management
#### **5. Dynamic Support/Resistance Analysis**
- **Concept**: Real-time identification of key price levels with rejection confirmation
- **Purpose**: Validates signals against significant price levels
- **Implementation**: Tracks multiple touch points and calculates rejection probabilities
- **Value**: Increases signal accuracy by confirming against structural market levels
#### **6. Volume Confirmation**
- **Concept**: Validates signals using volume analysis
- **Purpose**: Ensures signals are supported by institutional activity
- **Implementation**: Compares current volume to historical averages during significant price movements
- **Value**: Filters out weak signals that lack volume support
#### **7. Pattern Correlation**
- **Concept**: Identifies recurring price patterns and their correlation with current market behavior
- **Purpose**: Leverages historical pattern recognition for signal validation
- **Implementation**: Analyzes price change patterns and correlates with historical occurrences
- **Value**: Adds statistical confidence to signal generation
### **Signal Types**
#### **Turning Point Signals (Highest Priority)**
- **Purpose**: Identify high-probability trend reversal points
- **Criteria**: Combines exhaustion detection, support/resistance validation, volume confirmation, and pattern correlation
- **Visual**: Large circles on MA line with 🎯 symbols
- **Use Case**: Major trend changes, swing trading entries
#### **Regular Directional Signals**
- **Purpose**: Identify continuation or new trend directions
- **Criteria**: Based on predictive price analysis with confidence thresholds
- **Visual**: Medium circles on MA line with ▲▼ symbols
- **Use Case**: Trend following, momentum trading
#### **Sideways Signals**
- **Purpose**: Identify range-bound market conditions
- **Criteria**: Low directional confidence with high volatility compression
- **Visual**: Small circles on MA line with ◆ symbols
- **Use Case**: Range trading, consolidation periods
### **Key Features**
#### **Multi-Factor Scoring System**
- **Exhaustion Score**: 25% weight for trend exhaustion detection
- **Levels Score**: 20% weight for support/resistance validation
- **Volatility Score**: 15% weight for market condition assessment
- **Pattern Score**: 15% weight for historical pattern correlation
- **Volume Bonus**: 10% weight for volume confirmation
- **Pattern Bonus**: 5% weight for high correlation patterns
#### **Adaptive Thresholds**
- **Dynamic Sensitivity**: Adjusts to different market conditions
- **Asset-Specific**: Optimized for different instrument types
- **Timeframe Adaptive**: Adjusts parameters based on chart timeframe
#### **Visual Display Options**
- **Bold MA Line**: MA line becomes thicker and colored at signal points
- **Circles on MA**: Precise positioning of signals on moving average
- **Combined Display**: Both methods for maximum visibility
- **Customizable Colors**: Distinct colors for each signal type
### **How to Use**
#### **Setup**
1. Apply to any timeframe (1m to 1D recommended)
2. Adjust MA period based on your trading style (default: 20)
3. Set sensitivity level (0.1-3.0, default: 1.0)
4. Choose signal strength filter (Weak/Medium/Strong)
#### **Signal Interpretation**
- **High Confidence**: Signals with score > 0.7 and strong volume confirmation
- **Medium Confidence**: Signals with score 0.5-0.7 and moderate confirmation
- **Low Confidence**: Signals with score 0.3-0.5 and weak confirmation
#### **Trading Applications**
- **Swing Trading**: Use turning point signals for major reversals
- **Day Trading**: Use regular signals for intraday momentum
- **Position Trading**: Combine with higher timeframes for trend confirmation
### **Technical Specifications**
#### **Input Parameters**
- **MA Period**: 5-200 (default: 20)
- **Sensitivity**: 0.1-3.0 (default: 1.0)
- **Confidence Threshold**: 0.1-0.9 (default: 0.3)
- **Signal Strength**: Weak/Medium/Strong (default: Medium)
#### **Display Options**
- **Signal Display Method**: Bold MA Line / Circles on MA / Both
- **Circle Size**: Small/Medium/Large
- **MA Line Thickness**: 1-5 pixels
- **Information Table**: Real-time signal data
#### **Alerts**
- **Turning Point Alerts**: High-priority reversal signals
- **Regular Signal Alerts**: Directional momentum signals
- **Exhaustion Alerts**: Trend exhaustion warnings
### **Performance Characteristics**
#### **Strengths**
- **Multi-timeframe Analysis**: Works across different chart timeframes
- **Adaptive Parameters**: Automatically adjusts to market conditions
- **High Accuracy**: Combines multiple confirmation methods
- **Clear Visual Signals**: Easy to identify and interpret
#### **Best Practices**
- **Combine with Price Action**: Use signals as confirmation, not standalone
- **Risk Management**: Always use stop losses and position sizing
- **Backtesting**: Test on historical data before live trading
- **Market Conditions**: Works best in trending and volatile markets
### **Disclaimer**
This indicator is for educational and informational purposes only. It should not be considered as financial advice. Always conduct your own research and consider your risk tolerance before making trading decisions. Past performance does not guarantee future results.
---
**Version**: 7.0 Enhanced
**Compatibility**: Pine Script v6
**Last Updated**: September 2024
**Status**: Production Ready
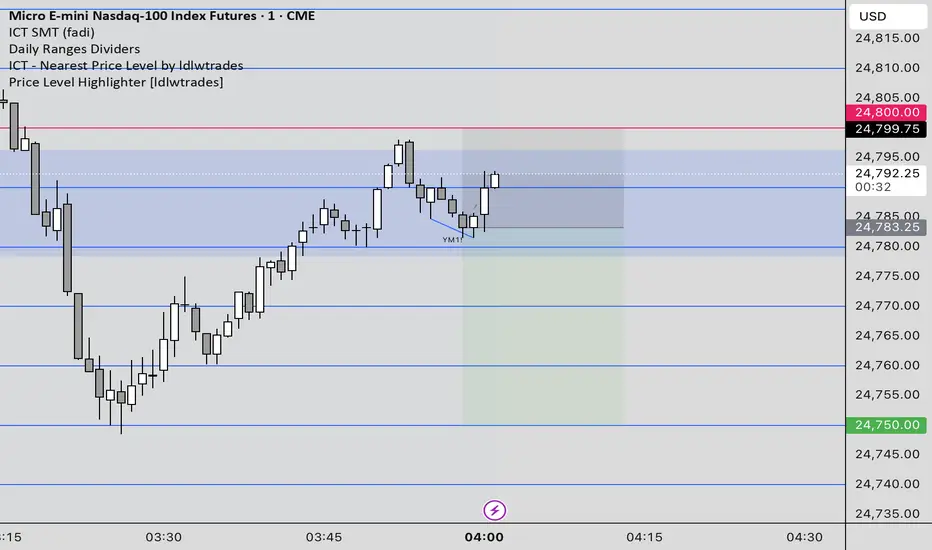
Price Level Highlighter [ldlwtrades]This indicator is a minimalist and highly effective tool designed for traders who incorporate institutional concepts into their analysis. It automates the identification of key psychological price levels and adds a unique, dynamic layer of information to help you focus on the most relevant area of the market. Inspired by core principles of market structure and liquidity, it serves as a powerful visual guide for anticipating potential support and resistance.
The core idea is simple: specific price points, particularly those ending in round numbers or common increments, often act as magnets or barriers for price. While many indicators simply plot static lines, this tool goes further by intelligently highlighting the single most significant level in real-time. This dynamic feature allows you to quickly pinpoint where the market is currently engaged, offering a clear reference point for your trading decisions. It reduces chart clutter and enhances your focus on the immediate price action.
Features
Customizable Price Range: Easily define a specific Start Price and End Price to focus the indicator on the most relevant area of your chart, preventing unnecessary clutter.
Adjustable Increment: Change the interval of the lines to suit your trading style, from high-frequency increments (e.g., 10 points) for scalping to wider intervals (e.g., 50 or 100 points) for swing trading.
Intelligent Highlighting: A key feature that automatically identifies and highlights the single horizontal line closest to the current market price with a distinct color and thickness. This gives you an immediate visual cue for the most relevant price level.
Highly Customizabile: Adjust the line color, style, and width for both the main lines and the highlighted line to fit your personal chart aesthetic.
Usage
Apply the indicator to your chart.
In the settings, input your desired price range (Start Price and End Price) to match the market you are trading.
Set the Price Increment to your preferred density.
Monitor the chart for the highlighted line. This is your active price level and a key area of interest.
Combine this tool with other confirmation signals (e.g., order blocks, fair value gaps, liquidity pools) to build higher-probability trade setups.
Best Practices
Pairing: This tool is effective across all markets, including stocks, forex, indices, and crypto. It is particularly useful for volatile markets where price moves rapidly between psychological levels.
Mindful Analysis: Use the highlighted level as a reference point for your analysis, not as a standalone signal. A break above or below this level can signify a shift in market control.
Backtesting: Always backtest the indicator on your preferred market and timeframe to understand how it performs under different conditions.

Price Level HighlighterThis indicator is a minimalist and highly effective tool designed for traders who incorporate institutional concepts into their analysis. It automates the identification of key psychological price levels and adds a unique, dynamic layer of information to help you focus on the most relevant area of the market. Inspired by core principles of market structure and liquidity, it serves as a powerful visual guide for anticipating potential support and resistance.
The core idea is simple: specific price points, particularly those ending in round numbers or common increments, often act as magnets or barriers for price. While many indicators simply plot static lines, this tool goes further by intelligently highlighting the single most significant level in real-time. This dynamic feature allows you to quickly pinpoint where the market is currently engaged, offering a clear reference point for your trading decisions. It reduces chart clutter and enhances your focus on the immediate price action.
Features
Customizable Price Range: Easily define a specific Start Price and End Price to focus the indicator on the most relevant area of your chart, preventing unnecessary clutter.
Adjustable Increment: Change the interval of the lines to suit your trading style, from high-frequency increments (e.g., 10 points) for scalping to wider intervals (e.g., 50 or 100 points) for swing trading.
Intelligent Highlighting: A key feature that automatically identifies and highlights the single horizontal line closest to the current market price with a distinct color and thickness. This gives you an immediate visual cue for the most relevant price level.
Highly Customizabile: Adjust the line color, style, and width for both the main lines and the highlighted line to fit your personal chart aesthetic.
Usage
Apply the indicator to your chart.
In the settings, input your desired price range (Start Price and End Price) to match the market you are trading.
Set the Price Increment to your preferred density.
Monitor the chart for the highlighted line. This is your active price level and a key area of interest.
Combine this tool with other confirmation signals (e.g., order blocks, fair value gaps, liquidity pools) to build higher-probability trade setups.
Best Practices
Pairing: This tool is effective across all markets, including stocks, forex, indices, and crypto. It is particularly useful for volatile markets where price moves rapidly between psychological levels.
Mindful Analysis: Use the highlighted level as a reference point for your analysis, not as a standalone signal. A break above or below this level can signify a shift in market control.
Backtesting: Always backtest the indicator on your preferred market and timeframe to understand how it performs under different conditions.
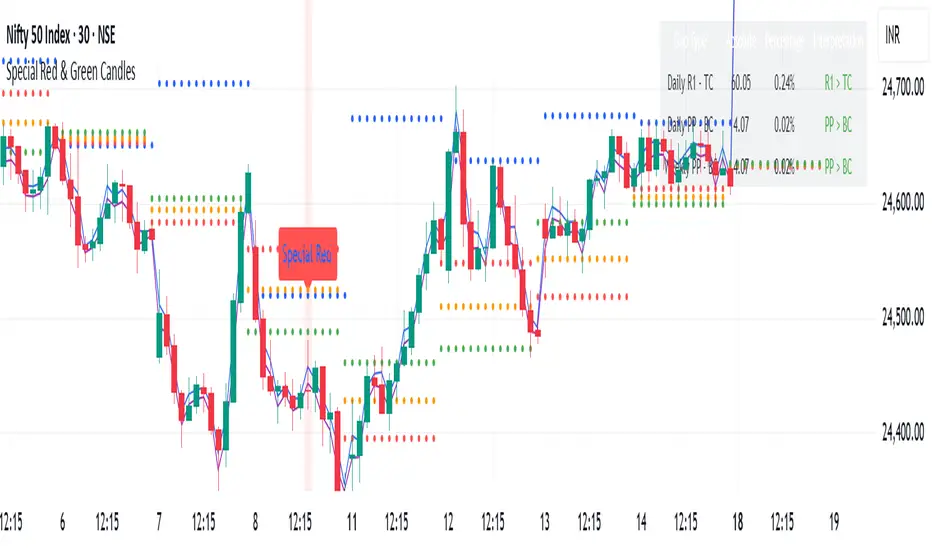
Special Red & Green CandlesCore Concept
The strategy identifies potential reversal points by looking for candles that show strong rejection (engulfing behavior) at key technical levels across multiple timeframes, combined with specific Fibonacci and volatility conditions.
Key Components
Multi-Timeframe Pivot System
Calculates Daily, Weekly, and Monthly pivot points (Standard & CPR methods)
Tracks traditional pivots (PP, R1-R4, S1-S4) and Central Pivot Range (CPR) values
Includes VWAPs (VWAP, 50-period, 250-period SMAs)
Dynamic Volatility Filter
Uses timeframe-based multipliers to adapt to different chart resolutions:
dynamicMultiplier: Defines minimum candle size requirement (0.015%-0.4% of close)
dynamicMultiplierS: Defines maximum candle size filter (0.025%-0.55% of close)
Special Candle Conditions
For Special Red Candles (Bearish Reversal):
Red candle (close < open)
Open below at least one pivot point (any timeframe)
High touches at least one pivot point
Close below 38.2% Fibonacci level of candle range
Current high is 5-bar highest but low isn't 8-bar lowest
Meets volatility conditions (absolute gap > 0.7% of close)
For Special Green Candles (Bullish Reversal):
Green candle (close > open)
Open above at least one pivot point
Low touches at least one pivot point
Close above 61.8% Fibonacci level
Current low is 5-bar lowest but high isn't 8-bar highest
Meets same volatility requirement
Additional Features
Gap Analysis Table: Shows relationships between key daily/weekly levels
Visual Indicators: Colors background, plots labels, and Fibonacci levels
Comprehensive Level Tracking: Monitors 30+ different pivot points across all timeframes
Trading Logic
This is essentially a fade-the-extreme-move strategy that identifies:
Candles that have significant range (volatility filter)
That show clear rejection at important technical levels
Across multiple timeframes simultaneously
With Fibonacci confluence for additional confirmation
Potential Use Cases
Swing Trading: Identifying reversal points in larger moves
Day Trading: Using lower timeframe signals for intraday reversals
Position Sizing: The strength of confluence could determine trade size
Risk Management
The strategy includes inherent risk controls through:
Multiple confirmation requirements (reduces false signals)
Volatility filters (avoids choppy market conditions)
Multi-timeframe confluence (increases signal reliability)
This is a sophisticated institutional-grade approach that combines traditional pivot analysis with modern volatility-based filtering and Fibonacci theory.
Katz Candle Momentum Reversal Indicator v4.1Katz Candle Momentum Reversal Indicator (CMRI) v4.1
Overview
The Katz CMRI is a comprehensive trading indicator designed to identify trend direction, momentum shifts, and potential market reversals. It combines several different concepts into a single, cohesive visual tool.
At its core, the indicator uses a custom Line Break chart calculation to filter out market noise and a Heikin-Ashi-style formula to smooth price action. This combination helps to more clearly define the underlying trend. The main output is a dynamic, multi-colored trend line accompanied by various signals that appear directly on your chart. It's designed to help traders stay with the trend while also spotting key moments of expansion, contraction, and potential reversal.
How to Interpret the Indicator
The indicator has several key visual components:
Main Trend Line: This is the thick, central line that changes color.
Green: Indicates a bullish (upward) trend.
Red: Indicates a bearish (downward) trend.
Faded/Light Colors: Suggest a potential loss of momentum or a pullback within the trend.
White: Signals a significant break in the trend structure.
Trend Cloud: The shaded area between the main trend line and the white midline (mid). A green cloud shows the trend is above the midpoint, while a red cloud shows it's below.
Upper/Lower Bands: The aqua (Trend Up) and yellow (Trend Down) lines represent the recent highs and lows of the established trend. When price is pushing against these bands, it signals trend strength.
Background Colors:
Gray: A "Contraction Zone." This indicates that the trend is losing momentum and consolidating, warning of potential chop or a reversal.
Blue: An "Expansion Event." This highlights a sudden increase in momentum in the direction of the trend.
Signal Shapes:
Diamonds: These are the primary entry signals. A green diamond below a candle signals a potential long entry, while a red diamond above a candle signals a potential short entry.
⬆️⬇️ Arrows: These are secondary momentum signals. They can be used as confirmation that the trend is continuing.
Trading Strategy & Rules
This strategy uses the primary diamond signals for entries and trend changes for exits.
Long Trade (Buy) Rules
Entry: Wait for a green diamond to appear below the price candles. For confirmation, the main trend line should turn solid green, and the price should ideally be above the white midline.
Exit:
Stop Loss: Place a stop loss below the recent swing low or below the candle where the green diamond appeared.
Take Profit: Consider exiting the trade when a red diamond appears above the candles, signaling a potential trend reversal. Alternatively, a trader might exit if the background turns gray (Contraction Zone), indicating the bullish momentum has faded.
Short Trade (Sell) Rules
Entry: Wait for a red diamond to appear above the price candles. For confirmation, the main trend line should turn solid red, and the price should ideally be below the white midline.
Exit:
Stop Loss: Place a stop loss above the recent swing high or above the candle where the red diamond appeared.
Take Profit: Consider exiting the trade when a green diamond appears below the candles. A gray "Contraction Zone" can also serve as an early warning to exit as bearish momentum wanes.
Indicator Filters Explained
The indicator includes a "Trend Filter Type" setting that allows you to adjust its sensitivity. This can help reduce false signals in choppy markets.
Raw: This is the most sensitive setting. It will generate a trend change signal as soon as the basic conditions are met. Use this for scalping or in strongly trending markets, but be aware that it may produce more false signals.
OutStep: This is the default, balanced setting. It adds an extra layer of confirmation by requiring the main trend line itself to be moving in the direction of the new trend. For example, a new green signal will only be confirmed if the trend line's value is higher than its previous value. This helps filter out weak signals.
FullStep: This is the most conservative and filtered setting. It includes the "OutStep" logic and adds further conditions related to the upper and lower trend bands. This setting will produce the fewest signals, but they are generally the highest quality, making it suitable for swing trading or avoiding choppy market conditions.
Disclaimer
This indicator is a tool for technical analysis and should not be considered financial advice. All trading involves substantial risk, including the possible loss of principal. Past performance is not indicative of future results. The signals generated by this indicator are for educational and informational purposes only. You are solely responsible for any trading decisions you make. Use this indicator at your own risk.

Trend Magic EMA RMI Trend Sniper📌 Indicator Name:
Trend Magic + EMA + MA Smoothing + RMI Trend Sniper
📝 Description:
This is a multi-functional trend and momentum indicator that combines four powerful tools into a single overlay:
Trend Magic – Plots a dynamic support/resistance line based on CCI and ATR.
Helps identify trend direction (green = bullish, red = bearish).
Acts as a trailing stop or dynamic level for trade entries/exits.
Exponential Moving Average (EMA) – Smooths price data to highlight the underlying trend.
Customizable length, source, and offset.
Serves as a trend filter or moving support/resistance.
MA Smoothing + Bollinger Bands (Optional) – Adds a secondary smoothing filter based on your choice of SMA, EMA, WMA, VWMA, or SMMA.
Optional Bollinger Bands visualize volatility expansion/contraction.
Great for spotting consolidations and breakout opportunities.
RMI Trend Sniper – A momentum-based system combining RSI and MFI.
Highlights bullish (green) or bearish (red) conditions.
Plots a Range-Weighted Moving Average (RWMA) channel to gauge price positioning.
Provides visual BUY/SELL labels and optional bar coloring for fast decision-making.
📊 Uses & Trading Applications:
✅ Trend Identification: Spot the dominant market direction quickly with Trend Magic & EMA.
✅ Momentum Confirmation: RMI Sniper helps confirm whether the market has strong bullish or bearish pressure.
✅ Dynamic Support/Resistance: Trend Magic & EMA act as adaptive levels for stop-loss or trailing positions.
✅ Volatility Analysis: Optional Bollinger Bands show squeezes and potential breakout setups.
✅ Entry/Exit Signals: BUY/SELL alerts and color-coded candles make spotting trade opportunities simple.
💡 Best Use Cases:
Swing Trading: Follow Trend Magic + EMA alignment for higher probability trades.
Scalping/Intraday: Use RMI signals with bar coloring for quick momentum entries.
Trend Following Strategies: Ride trends until Trend Magic flips direction.
Breakout Trading: Watch for price closing outside the Bollinger Bands with RMI confirmation.

Fiery River Torgi### Description of the "Fiery River" (FR) Indicator
**Overview of the Indicator**
"Fiery River" (abbreviated as FR, with variants like "FR-Torg") is a technical indicator for TradingView, written in Pine Script version 6. It combines Fibonacci levels with exponential moving averages (EMAs) and standard deviations to dynamically plot support and resistance zones on price charts. The indicator calculates "effective close" prices based on candlestick bodies for better volatility representation, then derives levels using custom Fibonacci multipliers applied to deviations from the EMA midline. It supports multi-timeframe analysis by incorporating a secondary timeframe, making it ideal for traders analyzing trends, reversals, and extensions in various markets like forex or crypto. The name evokes a "fiery" stream of adaptive levels flowing across the chart. 🔥
**Key Features**
- **Level Construction**: Uses an EMA of the "effective close" price (derived from open/close max/min) and standard deviation to create a midline. Fibonacci levels are calculated by multiplying deviations with coefficients (e.g., 1.55, 1.89, 0.89), resulting in "long" and "short" lines. It plots 9 lines total: 5 for the primary timeframe (green, red, gray, black for shorts, and a midline) and 4 for the secondary timeframe (with transparency for distinction).
- **Color Scheme**: Green for weaker levels, red for stronger, gray for mid-range, and black for shorts/extensions.
- **Fills**: Adds green fills between level pairs to highlight potential trading zones, enhancing visual clarity.
- **Alerts**: Automatic notifications trigger when the price touches specific levels (e.g., "FM-Torgi green!" for the first green line), helping with timely signals.
- **Multi-Timeframe Support**: Pulls data from a secondary timeframe (e.g., daily while main is hourly) using `request.security`, allowing comparison across scales.
- **Customization**: Inputs for EMA periods (default 89), secondary timeframe, and multipliers for flexibility.
**How to Use**
1. Add the indicator to your TradingView chart via the "Indicators" menu.
2. Configure settings: Set EMA periods, choose a secondary timeframe (e.g., 'D' for daily), and adjust Fibonacci multipliers if needed.
3. Interpret levels: Use green/red zones for entries/exits, gray for mid-support, and shorts for extensions. Fills indicate high-probability areas.
4. Enable alerts for real-time notifications on level touches.
Best combined with other tools like RSI or volume for confirmation. It's suited for swing trading or scalping on volatile assets. 📈
**Advantages and Limitations**
- **Pros**: Highly adaptive to price movements, customizable, visually intuitive with fills and multi-timeframe depth. Efficient for identifying Fibonacci-based zones without manual drawing.
- **Cons**: Can clutter the chart with many lines if not managed; requires testing on different symbols as hardcoded multipliers may not fit all markets perfectly. Potential for false signals in sideways markets.
If you'd like me to expand on the code, suggest modifications, or provide examples, let me know! 😊

EMA ± ATR Channel (True Range)EMA ± ATR Channel (True Range)
Tagline: Adaptive EMA channel with ATR-based volatility bands — perfect for swing trading, intraday setups, and managing risk on high-volatility stocks.
This script plots a dynamic price channel around a configurable EMA using the Average True Range (ATR, Wilder’s True Range) as a volatility buffer.
Upper band = EMA + (ATR × multiplier)
Lower band = EMA – (ATR × multiplier)
📊 Features:
Adjustable EMA length, ATR length, and ATR multiplier
Visual channel fill between upper and lower bands
Optional on-chart help panel with practical combos
⚡ Practical Combos for Volatile Stocks:
EMA 20 + ATR 14 × 2.0 → most common swing trading setup
EMA 10 + ATR 14 × 1.5 → very responsive, good for intraday/high-beta names
EMA 20 + ATR 20 × 2.5 → smoother, wider channel, avoids whipsaws in chaotic stocks
✅ Use cases:
Identify dynamic support/resistance zones
Volatility-based stop-loss & take-profit placement
Spot overextensions from the trend midline
🔖 Tags:
ema, atr, channel, volatility, trend, support resistance, stop loss, swing trading, intraday, risk management, indicator

ATR Stop Loss# ATR Stop Loss Indicator - Professional Trading Tool
## English Description
### 🎯 **ATR-Based Stop Loss Calculator - Your Risk Management Assistant**
**Never guess your stop loss again!** This professional indicator automatically calculates your optimal stop loss levels using the proven ATR (Average True Range) method.
#### ✨ **Key Features:**
- **Real-time ATR calculation** with customizable periods (default: 14 days)
- **Smart stop loss pricing** based on market volatility
- **Flexible ATR multiplier** (50%-300%) - adjust risk to your trading style
- **Live percentage tracking** - see exactly how much you're risking
- **Professional display** with 9 positioning options
- **Fully customizable** colors, text size, and transparency
- **Always visible** - stays on screen when you scroll or change timeframes
#### 📊 **What You See:**
```
ATR(14): $2.45
ATR Multiplier: 110%
STOP: $87.31 (-2.8%)
```
#### 🚀 **Why This Indicator is Essential:**
- **Professional Risk Management** - Set stops based on actual market volatility, not emotions
- **Saves Time** - No more manual calculations or guesswork
- **Reduces Losses** - Prevents premature stops while protecting capital
- **Improves Consistency** - Standardize your exit strategy across all trades
- **Perfect for All Styles** - Day trading, swing trading, or long-term investing
#### 💡 **How It Works:**
The indicator calculates the Average True Range over your chosen period, multiplies it by your risk preference (110% default), and subtracts from current price. This gives you a scientifically-backed stop loss that adapts to market conditions.
**Perfect for traders who want to:**
- ✅ Eliminate emotional decision-making
- ✅ Base stops on market volatility
- ✅ Maintain consistent risk management
- ✅ Save time on calculations
- ✅ Improve trading performance
---
## תיאור בעברית
### 🎯 **מחשבון Stop Loss מתקדם מבוסס ATR**
**תפסיק לנחש את רמת ה-Stop Loss שלך!** האינדיקטור המקצועי הזה מחשב אוטומטית את רמות ה-Stop Loss האופטימליות שלך בעזרת שיטת ה-ATR המוכחת.
#### ✨ **תכונות מרכזיות:**
- **חישוב ATR בזמן אמת** עם אפשרות התאמת תקופות (ברירת מחדל: 14 ימים)
- **תמחור חכם של Stop Loss** על בסיס תנודתיות השוק
- **מכפיל ATR גמיש** (50%-300%) - התאם את הסיכון לסגנון המסחר שלך
- **מעקב אחוזים חי** - ראה בדיוק כמה אתה מסכן
- **תצוגה מקצועית** עם 9 אפשרויות מיקום
- **התאמה אישית מלאה** - צבעים, גודל טקסט ושקיפות
- **תמיד גלוי** - נשאר על המסך כשאתה גולל או משנה טווחי זמן
#### 📊 **מה שתראה:**
```
ATR(14): $2.45
ATR Multiplier: 110%
STOP: $87.31 (-2.8%)
```
#### 🚀 **למה האינדיקטור הזה חיוני:**
- **ניהול סיכונים מקצועי** - קבע Stop על בסיס תנודתיות אמיתית של השוק, לא רגשות
- **חוסך זמן** - בלי עוד חישובים ידניים או ניחושים
- **מפחית הפסדים** - מונע Stop מוקדם מדי ובו זמנית מגן על ההון
- **משפר עקביות** - תקנן את אסטרטגיית היציאה שלך בכל העסקות
- **מושלם לכל הסגנונות** - Day Trading, Swing Trading או השקעות ארוכות טווח
#### 💡 **איך זה עובד:**
האינדיקטור מחשב את הממוצע של True Range על פני התקופה שבחרת, מכפיל בהעדפת הסיכון שלך (110% כברירת מחדל), ומחסיר מהמחיר הנוכחי. זה נותן לך Stop Loss מבוסס מדעית שמתאים לתנאי השוק.
**מושלם לטריידרים שרוצים:**
- ✅ לחסל קבלת החלטות רגשית
- ✅ לבסס Stop על תנודתיות השוק
- ✅ לשמור על ניהול סיכונים עקבי
- ✅ לחסוך זמן על חישובים
- ✅ לשפר את ביצועי המסחר
---
### 🏷️ **Tags:** ATR, Stop Loss, Risk Management, Trading Tools, Volatility, Technical Analysis

Advanced Grid Trading System - [WOLONG X DBG]Overview
This sophisticated grid trading system combines Bollinger Bands breakout analysis with RSI filtering to create a comprehensive automated trading approach. The system implements advanced grid management with dynamic lot sizing, intelligent ATR-based spacing, and comprehensive risk management features including drawdown protection, time-based trading controls, and multi-level position management.
Methodology
The indicator employs a multi-layered analytical approach based on established technical analysis principles:
Core Signal Generation
Bollinger Bands Breakout Engine: Utilizes customizable period Bollinger Bands (default 35) with highest/lowest price detection over the calculation period to identify potential reversal points when price breaks below recent lows or above recent highs
RSI Confirmation Filter: Implements RSI-based signal filtering with customizable maximum RSI values to avoid entries during overbought/oversold conditions, requiring RSI below (50 - max_rsi_value) for buy signals and above (50 + max_rsi_value) for sell signals
Grid Management System: Advanced progressive grid system with configurable pip-based spacing, intelligent ATR-based distance calculation, and cumulative lot sizing with customizable multipliers
Advanced Features
Dynamic Lot Sizing: Eight calculation methods including Fixed Lot, Dynamic by Balance/Equity, and risk-based percentage approaches (Low Risk 20%, Medium Risk 40%, High Risk 80%, Extreme Risk 120%, Margin Loading)
Comprehensive Risk Management: Multi-layered drawdown protection with percentage and absolute value limits, automatic position closure options, and trading suspension features with time-based recovery
Time-Based Controls: Configurable GMT-based trading hours with start/stop times for session-specific trading and market condition adaptation
Key Components
Signal Types
Primary Entry Signals: Buy signals when price breaks below recent lowest values within Bollinger period with RSI confirmation; Sell signals when price breaks above recent highest values with RSI confirmation
Grid Expansion Logic: Automatic additional entries based on configurable pip distances from base price, triggered when price moves against initial position by specified intervals
Take Profit Systems: Dual-mode TP calculation using either weighted average across all positions or individual level TP with customizable pip values
Stop Loss Protection: Grid-wide SL with customizable pip distances or default 1000-pip protection
Visual Elements
Bollinger Bands Display: Three-line Bollinger Bands system with upper, middle (SMA), and lower bands for trend and volatility analysis
Grid Base Line: Yellow dashed line showing initial grid entry level with right extension for reference
Comprehensive TP/SL Lines: Dual-line system showing both first order reference levels (dotted, light colors) and official Martingale weighted average levels (solid, bold colors)
Entry Point Labels: Detailed entry markers showing BUY/SELL direction, grid level, and lot size information
Dual Dashboard System: Main control panel (top-right) and dark theme entry log (bottom-right) with real-time status updates
Usage Instructions
Basic Configuration
Capital Management: Select lot calculation method from dropdown (recommended: "Low Risk 20%" for conservative approach)
Grid Parameters: Configure trading distance (default 35 pips) and enable smart distance for ATR-based dynamic adjustments
Strategy Settings: Set Bollinger period (35), RSI period (20), and maximum RSI value (15) for signal filtering
Risk Controls: Configure maximum drawdown percentage and action when limits are exceeded
Signal Interpretation
Buy Entry Conditions: Generated when current close price breaks below the lowest price in the Bollinger calculation period, with RSI below (50 - max_rsi_value)
Sell Entry Conditions: Generated when current close price breaks above the highest price in the Bollinger calculation period, with RSI above (50 + max_rsi_value)
Grid Expansion: Automatic additional entries when price moves against position by configured pip distances, with progressive lot sizing using multipliers
Exit Conditions: Weighted average TP achievement, breakeven after specified grid levels, or manual cycle completion
Dashboard Analysis
Main Control Panel: Displays current grid level, trading direction, open orders count, total volume, next lot size, grid P&L, current balance, floating drawdown, RSI status, trading hours, and system locks
Dark Theme Entry Log: Shows recent entry history with timestamps, entry types (BUY/SELL), prices, lot sizes, and grid levels for trade tracking
Risk Monitoring: Real-time drawdown tracking with color-coded warnings and automatic protection activation
Risk Management Features
Automatic Protections
Drawdown Limits: Configurable percentage (default 100%) and absolute USD drawdown limits with four response options: Close Orders and Stop 24h/Until Restart, or Prevent New Grid/Until Restart
Position Sizing: Eight dynamic lot calculation methods based on account equity, balance, or risk tolerance with maximum lot size limits
Grid Limitations: Maximum number of grid levels (default 9) to prevent excessive exposure accumulation
Time Controls: GMT-based trading hour restrictions to avoid high-volatility periods or specific market sessions
Confirmation Requirements
Multi-Indicator Alignment: Requires both Bollinger Bands breakout and RSI confirmation before signal generation
Intelligent Spacing: ATR-based grid spacing adjustment using short-term (96-period) vs long-term (672-period) ATR ratio for market volatility adaptation
Progressive Sizing: Configurable lot multipliers for different grid levels (Order 2: 1.0x, Orders 3-5: 2.0x, Orders 6+: 1.5x default)
Optimal Settings
Timeframe Recommendations
Scalping: 1M-5M charts with reduced grid spacing (20-25 pips) and tighter RSI filters
Day Trading: 15M-1H charts with standard settings (35 pips) and default RSI parameters
Swing Trading: 4H-Daily charts with increased spacing (50+ pips) and relaxed RSI filters
Market Conditions
Trending Markets: Reduce RSI maximum value to 10-12, increase grid spacing to 40-50 pips, enable breakeven functionality
Ranging Markets: Standard settings with weighted TP enabled and moderate grid spacing
High Volatility: Enable smart distance, reduce maximum grid levels to 6-7, increase drawdown limits
Advanced Features
Customization Options
Lot Calculation Methods: Eight different approaches from fixed lot (0.01) to risk-based percentage calculations with margin loading options
Grid Multipliers: Separate multiplier settings for different grid levels (2nd order, 3rd-5th orders, 6th+ orders) with decimal precision
TP/SL Configuration: Individual or weighted average TP calculation with positive/negative pip values, breakeven after specified levels
Visual Controls: Toggle options for dashboard display, entry labels, TP/SL lines, lot information, and dark theme components
Technical Specifications
Grid Management: Up to 50 configurable grid levels with progressive lot sizing and cumulative position tracking
Risk Controls: Dual drawdown limits (percentage and absolute) with four different response actions and time-based recovery
Time Management: GMT-based trading hours with flexible start/end times supporting overnight sessions
Alert System: Five comprehensive alert conditions for new signals, drawdown warnings, maximum levels, and cycle completion
Important Limitations
Lagging Nature: Signals may appear after optimal entry points due to confirmation requirements and breakout validation
Grid Risk: Progressive lot sizing can lead to significant exposure accumulation during extended adverse price movements
Market Dependency: Performance varies significantly between trending and ranging market conditions, requiring parameter adjustments
Computational Load: Complex multi-array calculations and real-time dashboard updates may impact performance on slower devices
No Guarantee: All signals are suggestions based on technical analysis calculations and may be incorrect
Educational Disclaimers
This indicator is designed for educational and analytical purposes only. It represents a technical analysis tool based on mathematical calculations of historical price data and should not be considered as financial advice or trading recommendations.
Risk Warning: Grid trading involves substantial risk of loss and is not suitable for all investors. The progressive lot sizing methodology can lead to significant exposure accumulation during adverse market movements. Past performance of any trading system or methodology is not necessarily indicative of future results.
Important Notes:
Always conduct your own analysis before making trading decisions
Use appropriate position sizing and risk management strategies
Never risk more than you can afford to lose
Consider your investment objectives, experience level, and risk tolerance
Seek advice from qualified financial professionals when needed
Grid trading can result in multiple simultaneous positions with compounding risk exposure
Performance Disclaimer: Backtesting results do not guarantee future performance. Market conditions change constantly, and what worked in the past may not work in the future. The indicator's mathematical calculations are based on historical data patterns that may not repeat. Always paper trade new strategies before risking real capital.
System Limitations: The indicator relies on technical analysis principles and may produce false signals during unusual market conditions, news events, or periods of extreme volatility. Users should implement additional confirmation methods and maintain strict risk management protocols.

Gann Trading Strategy📈 Simple & Powerful Gann-Based Trading System
This indicator automatically calculates key Gann support and resistance levels based on W.D. Gann's mathematical principles. Simply input either the highest price (for bearish setups) or lowest price (for bullish setups), and the indicator automatically generates all trading levels.
🎯 Key Features:
Automatic Level Calculation - Just select High/Low price projection basis
Complete Trading Framework - Entry zone, 3 Take Profit levels, and Exit level
Visual Trading Zones - Color-coded zones around each level for better entry/exit timing
Smart Alerts - Get notified when price reaches key levels
Bullish & Bearish Setups - Works for both long and short trading strategies
Customizable Display - Show/hide levels, adjust colors, line styles, and zone widths
🚀 How to Use:
Select "Lowest Price" for bullish setup or "Highest Price" for bearish setup
Input the relevant high or low price from your analysis
The indicator automatically calculates and displays all trading levels
Use the green entry zone for entries, blue levels for take profits, red level for exits
📊 Perfect for:
Swing trading
Position sizing and risk management
Support/resistance analysis
Multi-timeframe analysis
Uses time-tested Gann principles to automatically find key price levels for trading.

Sine Weighted Trend Navigator [QuantAlgo]🟢 Overview
The Sine Weighted Trend Navigator utilizes trigonometric mathematics to create a trend-following system that adapts to various market volatility. Unlike traditional moving averages that apply uniform weights, this indicator employs sine wave calculations to distribute weights across historical price data, creating a more responsive yet smooth trend measurement. Combined with volatility-adjusted boundaries, it produces actionable directional signals for traders and investors across various market conditions and asset classes.
🟢 How It Works
At its core, the indicator applies sine wave mathematics to weight historical prices. The system generates angular values across the lookback period and transforms them through sine calculations, creating a weight distribution pattern that naturally emphasizes recent price action while preserving smoothness. The phase shift feature allows rotation of this weighting pattern, enabling adjustment of the indicator's responsiveness to different market conditions.
Surrounding this sine-weighted calculation, the system establishes volatility-responsive boundaries through market volatility analysis. These boundaries expand and contract based on current market conditions, creating a dynamic framework that helps distinguish meaningful trend movements from random price fluctuations.
The trend determination logic compares the sine-weighted value against these adaptive boundaries. When the weighted value exceeds the upper boundary, it signals upward momentum. When it drops below the lower boundary, it indicates downward pressure. This comparison drives the color transitions of the main trend line, shifting between bullish (green) and bearish (red) states to provide clear directional guidance on price charts.
🟢 How to Use
Green/Bullish Trend Line: Rising momentum indicating optimal conditions for long positions (buy)
Red/Bearish Trend Line: Declining momentum signaling favorable timing for short positions (sell)
Steepening Green Line: Accelerating bullish momentum with increasing sine-weighted values indicating strengthening upward pressure and high-probability trend continuation
Steepening Red Line: Intensifying bearish momentum with declining sine-weighted calculations suggesting persistent downward pressure and optimal shorting opportunities
Flattening Trend Lines: Gradual reduction in directional momentum regardless of color may indicate approaching consolidation or trend exhaustion requiring position management review
🟢 Pro Tips for Trading and Investing
→ Preset Strategy Selection: Utilize the built-in presets strategically - Scalping preset for ultra-responsive 1-15 minute charts, Default preset for balanced general trading, and Swing Trading preset for 1-4 hour charts and multi-day positions.
→ Phase Shift Optimization: Fine-tune the phase shift parameter based on market bias - use positive values (0.1-0.5) in trending bull markets to enhance uptrend sensitivity, negative values (-0.1 to -0.5) in bear markets for improved downtrend detection, and zero for balanced neutral market conditions.
→ Multiplier Calibration: Adjust the multiplier according to market volatility and trading style. Use lower values (0.5-1.0) for tight, responsive signals in stable markets, higher values (2.0-3.0) during earnings seasons or high-volatility periods to filter noise and reduce whipsaws.
→ Sine Period Adaptation: Customize the sine weighted period based on your trading timeframe and market conditions. Use 5-14 for day trading to capture short-term momentum shifts, 14-25 for swing trading to balance responsiveness with reliability, and 25-50 for position trading to maintain long-term trend clarity.
→ Multi-Timeframe Sine Validation: Apply the indicator across multiple timeframes simultaneously, using higher timeframes (4H/Daily) for overall trend bias and lower timeframes (15m/1H) for entry timing, ensuring sine-weighted calculations align across different time horizons.
→ Alert-Driven Systematic Execution: Leverage the built-in trend change alerts to eliminate emotional decision-making and capture every mathematically-confirmed trend transition, particularly valuable for traders managing multiple instruments or those unable to monitor charts continuously.
→ Risk Management: Increase position sizes during strong directional sine-weighted momentum while reducing exposure during frequent color changes that indicate mathematical uncertainty or ranging market conditions lacking clear directional bias.
Trend lines indicator by ForexBeeEnhanced 3-Swing Trendline Zones - Complete Feature Guide
WHAT THIS INDICATOR DOES
This indicator automatically draws trendline zones on your chart using a 3-point validation system. Instead of just connecting any two price points like basic trendline tools, it waits for three swing points to confirm the trendline is valid before drawing it.
FEATURE 1: SWING POINT DETECTION
What it detects:
Swing highs: Price points where the high is higher than surrounding candles
Swing lows: Price points where the low is lower than surrounding candles
These show up as small arrows on your chart labeled "SH" (swing high) and "SL" (swing low)
Settings that control this:
Swing Length : Default is 6, range 1-20
Higher numbers = fewer, more significant swing points
Lower numbers = more swing points, including minor ones
Example: Setting 5 means each swing point must be higher/lower than 5 candles on each side
How to use this setting:
On 1-minute charts: Use 5-10 to filter out noise
On daily charts: Use 2-3 for more sensitivity
Volatile markets: Increase the number
Quiet markets: Decrease the number
Please See the Below Images To See the difference of swing length of 6 and 8
Display control:
Show Swing Points : Turn the arrows on/off
Default: ON (you'll see the arrows)
Turn OFF if arrows clutter your chart
FEATURE 2: RETRACEMENT VALIDATION SYSTEM
What this does:
After finding two swing points, the system checks if the second swing represents a proper market retracement, not just random price movement.
How it works:
Finds the highest point between two swing lows (or lowest point between two swing highs)
Calculates how much the second swing retraced from this extreme point
Only accepts swings that retrace between your set percentages
Settings that control this:
Lower Limit % : Default 50%, range 0-100%
Upper Limit % : Default 90%, range 0-100%
These create a "valid retracement zone"
Why this matters:
Eliminates random trendlines that don't follow market structure
Ensures trendlines represent actual retracement patterns
Based on Elliott Wave and Fibonacci principles
FEATURE 3: ATR-BASED ZONE WIDTH
What ATR means:
Average True Range measures how much price typically moves in a given period. Instead of fixed-width trendlines, this creates zones that adapt to market volatility.
Settings that control this:
Zone Width (ATR Multiple) : Default 0.3, range 0.1-1.0
ATR Length : Default 14, range 1-50 periods
How zone width works:
Multiplier 0.1 = Very narrow zones (tight around trendline)
Multiplier 0.5 = Medium zones
Multiplier 1.0 = Wide zones (accommodates more price movement)
ATR Length explained:
14 periods = Uses last 14 candles to calculate average volatility
Shorter periods (7) = More sensitive to recent volatility changes
Longer periods (21) = Smoother, less sensitive to volatility spikes
Practical impact:
During high volatility: Zones automatically become wider
During low volatility: Zones automatically become narrower
Prevents false breakouts during normal market noise
Creates realistic support/resistance areas instead of precise lines
FEATURE 4: VISUAL ZONE SYSTEM
Active Uptrend Zones:
Green upper boundary line (solid, thick)
Lime green lower boundary line (solid, thick)
Green fill between lines (80% transparency)
These represent dynamic support levels
Active Downtrend Zones:
Blue upper boundary line (solid, thick)
Navy blue lower boundary line (solid, thick)
Red fill between lines (80% transparency)
These represent dynamic resistance levels
Broken/Expired Zones:
Gray/silver boundary lines (dashed, thick)
Original fill color maintained (green for uptrend zones, red for downtrend zones)
Shows historical trendlines that are no longer active
FEATURE 5: BREAK DETECTION SYSTEM
How breaks are detected:
The system monitors when price violates the zone boundaries, indicating the trendline structure has failed.
Settings that control this:
Use Wick Break : True/False toggle
TRUE: Break occurs when candle high/low touches zone boundary
FALSE: Break occurs when candle close price crosses zone boundary
Conservative vs Aggressive approach:
Wick Break = TRUE (Aggressive) :
- More sensitive, earlier signals
- May produce more false breaks during volatile periods
- Good for scalping and short-term trading
Wick Break = FALSE (Conservative) :
- Requires candle to close beyond zone
- Fewer false signals, more reliable breaks
- Better for swing trading and position trading
What happens when zone breaks:
Zone lines change from solid to dashed
Zone lines change color to gray/silver
Fill color remains original (green/red) for identification
Zone stops extending forward
Zone is removed from active monitoring
FEATURE 6: ZONE EXPIRATION SYSTEM
What expiration does:
Allows trendlines to automatically become inactive after a set number of bars, even if they haven't been broken.
Settings that control this:
Use Zone Expiration : True/False toggle
Zone Expiration (Bars) : Default 500, range 1-1000
FALSE: Zones run indefinitely until broken
TRUE: Zones expire after specified number of bars
Visual result:
Expired zones look identical to broken zones
Lines become dashed and gray/silver
Fill colors remain original (green/red)
FEATURE 7: MULTI-TIMEFRAME TREND ANALYSIS TABLE
What the table shows:
A small table on your chart that monitors trend conditions across four different timeframes simultaneously.
Settings that control this:
TF1, TF2, TF3, TF4 : Four customizable timeframes
Default: 4H, 8H, 1D, 1W
Table Position : 9 positions (top/middle/bottom + left/center/right)
Text Size : Tiny, Small, Normal, Large, Huge
How trend detection works:
Uptrend Pattern : Current candle's high AND low are both higher than previous candle's high AND low on specified timeframes
This creates higher highs and higher lows
Shows consistent buying pressure
Table displays green background with upward arrow (▲)
Downtrend Pattern : Current candle's high AND low are both lower than previous candle's high AND low on specified timeframes
This creates lower highs and lower lows
Shows consistent selling pressure
Table displays red background with downward arrow (▼)
Range/Sideways Pattern : Current candle creates either inside bar or outside bar
Inside bar: Current range smaller than previous candle
Outside bar: Current range larger than previous candle
Shows market indecision or consolidation
Table displays orange background with diamond symbol (◆)
No Clear Pattern : None of the above conditions are met
Table displays gray background with horizontal line (⎯)
How to interpret the table:
All timeframes green (uptrend): Strong bullish alignment
All timeframes red (downtrend): Strong bearish alignment
Mixed colors: Conflicting timeframes, exercise caution
Mostly orange: Market in consolidation phase
Tooltip explanations: Hover over each cell for detailed description
FEATURE 8: BACKGROUND COLOR SYSTEM
What background colors show:
Optional feature that colors your chart background based on the current timeframe's trend condition.
Settings that control this:
Show Background Colors : True/False toggle
Background Transparency : 80-98% range
Default: OFF (no background colors)
Color scheme:
Green background: Current timeframe showing uptrend
Red background: Current timeframe showing downtrend
Orange background: Current timeframe showing range/consolidation
No background: No clear trend pattern
Transparency levels:
80%: More visible background color
95%: Subtle background hint
98%: Very subtle background tint
