GSO + RSI + MACD + MFI + Bollinger BandsThis script uses a Gann Swing Oscillator , RSI , MACD , MFI and Bollinger Bands to generate long and short signals for cryptocurrencies on the 5 minute chart.
The Gann Swing Oscillator was inspired by HPotter's GSO.
This script is for educational purposes only. This script is NOT to be used as financial advice. I will not accept liability for any losses which may occur as a result of using this script.
Search in scripts for "swing"

[blackcat] L2 Zero-lag EMA Swing TradeLevel: 2
Background
This script is a comprehensive work of mine, incorporating Ehlers zero-lag EMA and my first script published: MA fingerprint for long entries.
Function
Ehlers zero-lag EMA algorithm in this scripts is mainly used for short signal production, while my MA fingerprint algorithm is used for long entries.
Key Signal
a ---> Ehlers Zero-lag EMA fast line for subjective long jugement
b ---> Ehlers Zero-lag EMA slow line for subjective short jugement
long --> Swing long entry with partial postion
short --> Swing short entry with partial postion
Remarks
Feedbacks are appreciated. This script is optimized for 1D time frame.
Readme
In real life, I am a prolific inventor. I have successfully applied for more than 60 international and regional patents in the past 12 years. But in the past two years or so, I have tried to transfer my creativity to the development of trading strategies. Tradingview is the ideal platform for me. I am selecting and contributing some of the hundreds of scripts to publish in Tradingview community. Welcome everyone to interact with me to discuss these interesting pine scripts.
The scripts posted are categorized into 5 levels according to my efforts or manhours put into these works.
Level 1 : interesting script snippets or distinctive improvement from classic indicators or strategy. Level 1 scripts can usually appear in more complex indicators as a function module or element.
Level 2 : composite indicator/strategy. By selecting or combining several independent or dependent functions or sub indicators in proper way, the composite script exhibits a resonance phenomenon which can filter out noise or fake trading signal to enhance trading confidence level.
Level 3 : comprehensive indicator/strategy. They are simple trading systems based on my strategies. They are commonly containing several or all of entry signal, close signal, stop loss, take profit, re-entry, risk management, and position sizing techniques. Even some interesting fundamental and mass psychological aspects are incorporated.
Level 4 : script snippets or functions that do not disclose source code. Interesting element that can reveal market laws and work as raw material for indicators and strategies. If you find Level 1~2 scripts are helpful, Level 4 is a private version that took me far more efforts to develop.
Level 5 : indicator/strategy that do not disclose source code. private version of Level 3 script with my accumulated script processing skills or a large number of custom functions. I had a private function library built in past two years. Level 5 scripts use many of them to achieve private trading strategy.
Cycle Swing MomentumAdaptive Ultra-Smooth Momentum indicator
The Cycle-Swing-Indicator "CSI" provides an optimized "momentum" oscillator based on the current dominant cycle by looking at the swing of the dominant cycle instead of the raw source momentum. Offering the following improvements:
Smoothness
Zero delay
Sharpness at turning points
Robust and adaptable to market conditions
Accurate deviation detection
The following common problems with standard indicators are solved by this indicator:
First, normal indicators introduce a lot of false signals due to their noisy signal line. Second, to compensate for the noise, one would normally try to add some smoothing. But this only results in adding more delay to the indicator, which makes it almost useless. Third, standard indicators require a length adjustment to derive reliable signals. However, you never know how to set the right length.
All three problems described above are solved by the developed adaptive cyclic algorithm.
The above chart shows current Bitcoin 4h data from the last days as of writing with the proposed signal reading for this indicator. The standard momentum indicator is included for comparison.
HOW TO USE
The indicator works without any parameter and can be applied to any chart and any time-frame. It will adapt automatically to the Dominant Cycle and use the dominant cycle of the source data to derive the ultra smooth momentum curve. Adaptive upper/lower bands are included and highlight areas with extreme readings. Automatic divergence detection can be turned off/on.
HOW TO READ
The indicator can be used like any oscillator. In addition, it provides adaptive high and low bands.
* Look for turns above the upper/lower bands
* Look for divergences between source and signals line
Further reading/Original source:
The indicator uses the dominant cycle to optimize signal, smoothing and cyclic memory. To get more in-depth information on the Cycle Swing Indicator, please read Chapter 10 "Cycle Swing Indicator: Trading the swing of the dominant cycle" of the book "Decoding the Hidden Market Rhythm, Part 1" available at your favorite book store.
Related ideas:
Please also check the cyclic RSI indicator which also uses cyclic information to improve the signal.

L1 Mid-Term Swing Oscillator v1Level: 1
Background
Oscillators are widely used set of technical analysis indicators. They are popular primarily for their ability to alert of a possible trend change before that change manifests itself in price and volume . They should work best in times of sideways markets.
Function
L1 Short-Mid-Long-Term Swing Oscillator puts three terms of oscillators to cover short-term, middle-term and long-term oscillators at the same time. By resonating all these three oscillators, short-term scalping signal and middle term swing signal are disclosed. You can see both short and mid term signal under one indicator which give you more confidence to follow the trend.
Key Signal
I didn't handle the key signals well. I piled up all the useful signals I found, and it is really difficult to classify them one by one. I feel tired when I think about this problem. Therefore, the code of the overall signal is rather confusing, sorry.
Pros and Cons
Pros:
1. Three oscillators are used to cover short, mid, long term oscillations.
2. Short-Mid term resonance can be observed to have higher confidence level.
3. Use single indicator for scalping and swing trading is possible.
Cons:
1. No deep dive into very accurate long and short entries.
2. A trade off between sensitivity and stability may be needed by traders' subjective judge.
Remarks
I enjoyed the fun of put three different oscillator together to cover short, mid, long terms. But how to use them perfectly is really more brainstorming.
Readme
In real life, I am a prolific inventor. I have successfully applied for more than 60 international and regional patents in the past 12 years. But in the past two years or so, I have tried to transfer my creativity to the development of trading strategies. Tradingview is the ideal platform for me. I am selecting and contributing some of the hundreds of scripts to publish in Tradingview community. Welcome everyone to interact with me to discuss these interesting pine scripts.
The scripts posted are categorized into 5 levels according to my efforts or manhours put into these works.
Level 1 : interesting script snippets or distinctive improvement from classic indicators or strategy. Level 1 scripts can usually appear in more complex indicators as a function module or element.
Level 2 : composite indicator/strategy. By selecting or combining several independent or dependent functions or sub indicators in proper way, the composite script exhibits a resonance phenomenon which can filter out noise or fake trading signal to enhance trading confidence level.
Level 3 : comprehensive indicator/strategy. They are simple trading systems based on my strategies. They are commonly containing several or all of entry signal, close signal, stop loss, take profit, re-entry, risk management, and position sizing techniques. Even some interesting fundamental and mass psychological aspects are incorporated.
Level 4 : script snippets or functions that do not disclose source code. Interesting element that can reveal market laws and work as raw material for indicators and strategies. If you find Level 1~2 scripts are helpful, Level 4 is a private version that took me far more efforts to develop.
Level 5 : indicator/strategy that do not disclose source code. private version of Level 3 script with my accumulated script processing skills or a large number of custom functions. I had a private function library built in past two years. Level 5 scripts use many of them to achieve private trading strategy.

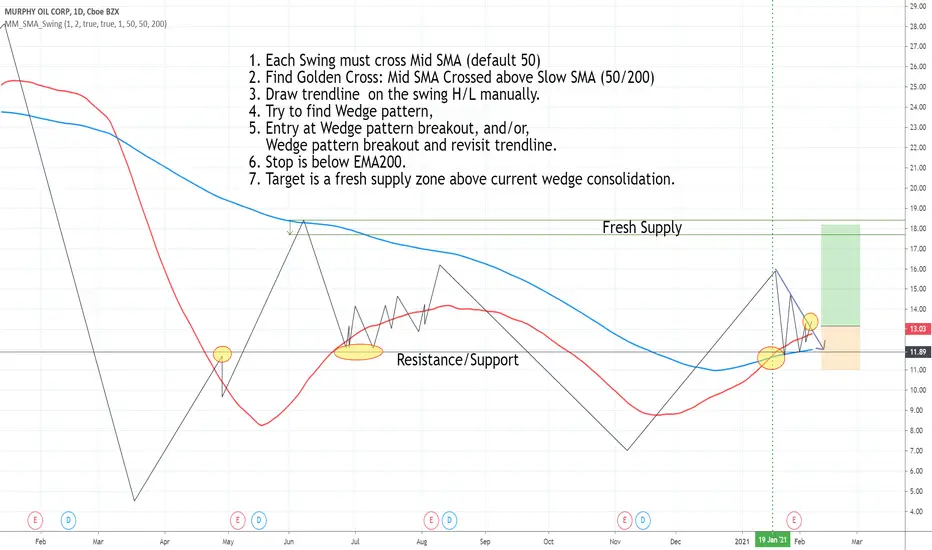
Draw swing Lines based on SMA// Draw swing Lines based on SMA
// Each swing line must cross SMA
// ---------------------------------------------------
// Input:
// sma(Number): Default 50;
// showSMA: Default 'true'; if showSMA ='false', do not show SMA line;
// Deviation(%): Default "1"; To draw a new swing line, Price must cross SMA more than (n% of SMA)
// In weekly chart, better use "2" or more to avoid small ZigZag;
// ---------------------------------------------------
// This swing Lines could be used:
// 1. Verify reversal pattern, such as, double tops;
// 2. Help to draw accurate trend line, avoid noice; Set showSMA=false, to see trend line clearly;
// 3. Use two of this study together with different SMA, Set showSMA=false,
// Such as, SMA20 and SMA200, to see small waves in bigger wave
// ---------------------------------------------------
// In this sample Chart -- AMD 1h (Feb to Jun 2020)
// Added this study with SMA(50),
// Hide price chart and SMA line, to show the Swing line only,
// I drew some sample trend lines, and identified one Double top;
Multi Timeframe Moving Average Collection | Swing [aamonkey]This is a Multi Timeframe Moving Average Collection (Swing Edition).
Why use it?
- Spot cluster of MAs on one chart
- See support and resistance
- Spot "freefall zones"
In the default settings you will get:
20, 100 and 200 MA of the 1D, W, and the W chart.
The color indicates significance!
From weaker to stronger support/resistance:
green(1D),yellow(W),red(M)
- Length of the MAs is modifiable
- Timeframes of the MAs is modifiable
- Which MAs you want to see
- Colors
Why use this if there is a Swing edition, that can do the same?
You can use this Swing Edition if you don't want to change between the Swing and Scalp timeframes in the settings.
Just turn on of the two on or off.

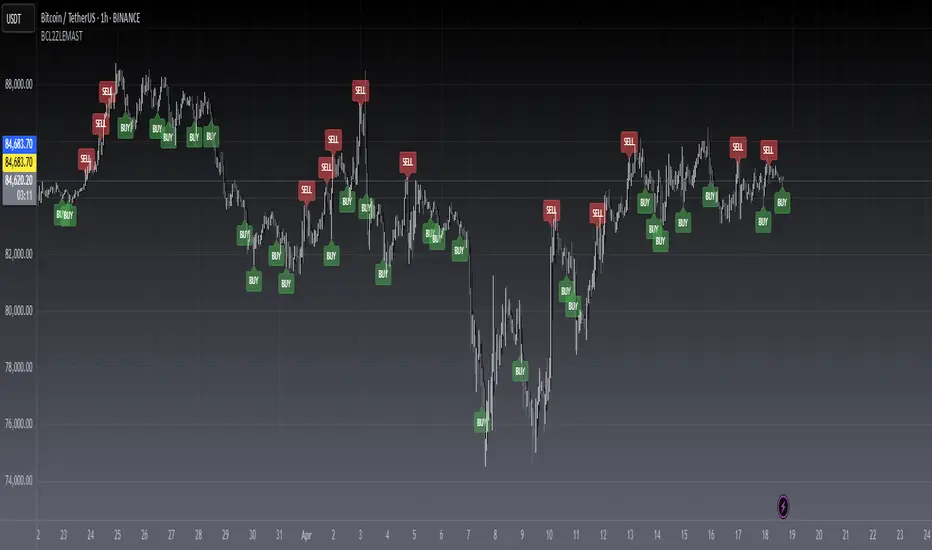
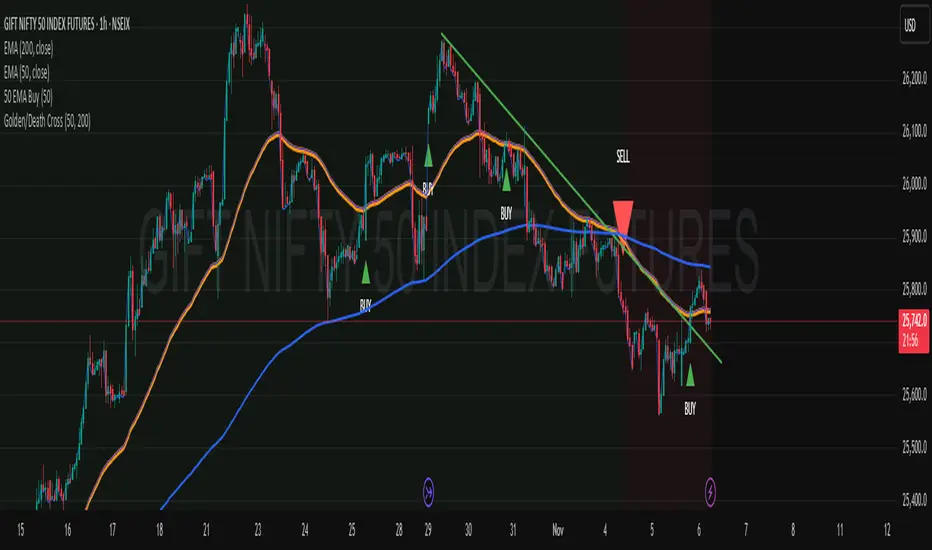
Philakone 5EMA Swing Trading Strategy [Buy&Sell Signals]Fork of the "Philakone 55 EMA Swing Trading Strategy" made by lvynnil
-Added 200EMA
-Changed shape of the arrows and added text of Buy & Sell
All credits go to lvynnil
For more informations about the original script go to:

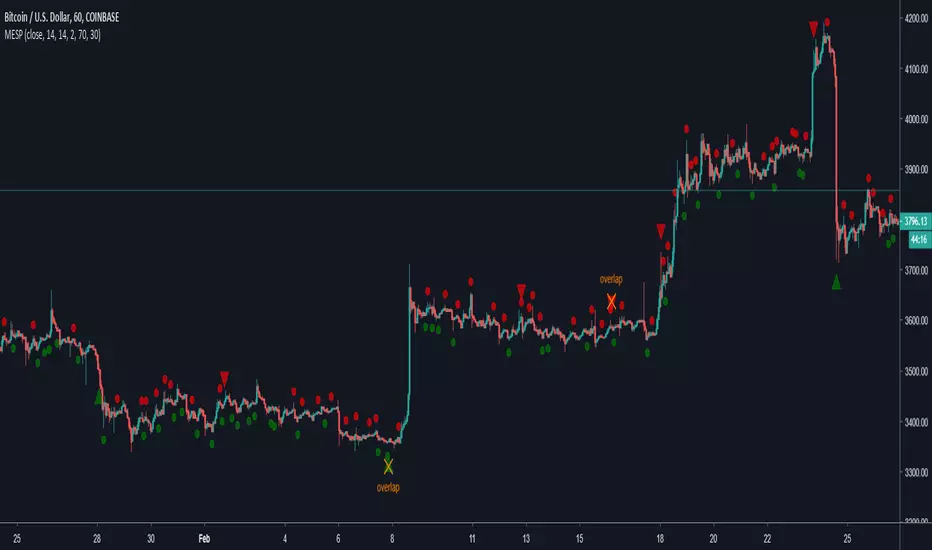
Momentum Exhaustion + Swing Points ComboCombination of @Zeenobit's Swing Points and Momentum Exhaustion indicators; RSX instead of RSI from @jaggedsoft/@everget's RSX Divergences script(s).
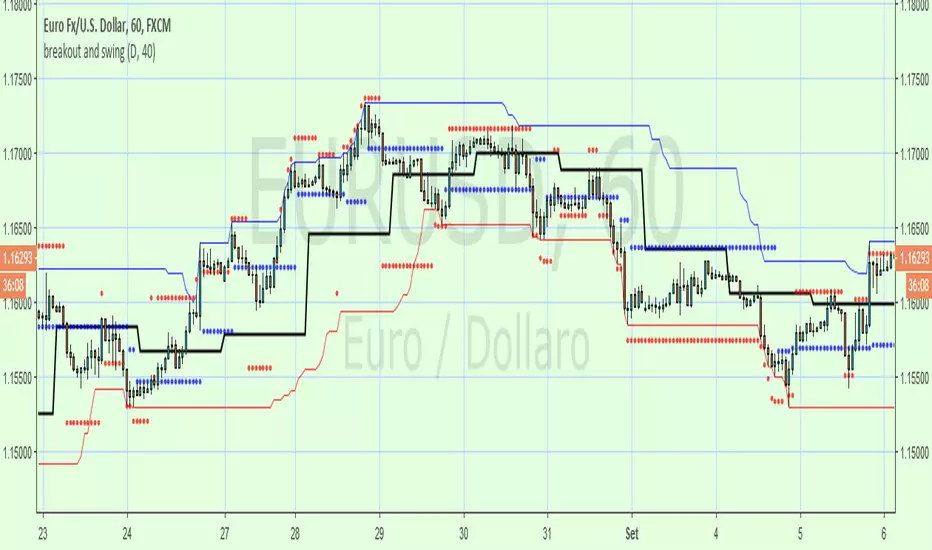
breakout and swingA Price Action system that use swing point and breakout
above the black line (breakout) is long, below short
swing/support/resistance points (blue circles) are displayed after a top or botton, breaking it means an inversion
red circles try to guest a target after a top/bottom or after a swing break.
the main trend is made by the black line that is set on Day period suitable for 1h to 15m time frame , for small TF you can set a smaller period from setting command
By default a set a 40 period channel high/low (the highest and lowest 40 bar back) that is ok for 1 h or smaller tf , but look to long for daily tf, adjust it yourself
Alto Basso Swing Pivots + Barry Support Resistance Levels2 indicators, 1 script: swing pivots and Barry support resistance levels
Alto
high swing pivot
Basso
low swing pivot
Dal Segno
lookback period length for swing pivots
Barry Length
length for support resistance calculation
--------------------------------------------------------------------------------------------------------------------------------------------------------------------------------------------
Use swing pivots for confirmation of new structure levels on short term
Barry support resistance levels in proximity to standard pivots or Fibonacci levels may indicate greater strength
credit to BacktestRookies and likebike
stay ♯
Example: Dal Segno 13, Barry Length 21

RSI Swing Signal - ChartThis indicator is the chart version intended to accompany my custom RSI oscillator:
CLICK HERE TO SEE BASE INDICATOR
CLICK HERE TO SEE BASE INDICATOR

YTC - Swing Highs & Lows v.2.0This Indicator Plots Swing Highs & Swing Lows based on Lance Beggs of (Your Trading Coach) definition:
A Swing High (SH) is a price bar high preceed by two lower highs (LH) and followed by two lower highs (LH)
In the event of multiple candles forming equal highs, this will still be defined as a swing high, provided that there are two candles with lower highs both preceding and following the multiple candle formation.
Added the verification of all the possible casuistry:
If there are two, three or four bars followed with the same highs or lows and surrounded with tiny bars
Or two or three bars with equal highs or lows alternating with tiny bars.
New parameter to activate repaint (NOT repaints by default)

YTC - Swing Highs & LowsThis Indicator Plots Swing Highs & Swing Lows based on Lance Beggs of (Your Trading Coach) definition:
A Swing High (SH) is a price bar high preceed by two lower highs (LH) and followed by two lower highs (LH)
In the event of multiple candles forming equal highs, this will still be defined as a swing high, provided that there are two candles with lower highs both preceding and following the multiple candle formation.

CM Gann Swing High Low V2CM Gann Swing High Low V2
Added Improvements:
Used PineScript “linebr" code so solid lines plot only when condition = true.
Via Inputs Tab:
Ability to Turn On/Off Highlight Bars When Crossing Above/Below Swing High Low
Ability to Turn On/Off Back Ground Highlights When Crossing Above/Below Swing High Low
Ability to Turn On/Off linebr plots.
Other Features: All Available Via Inputs Tab
Ability to Adjust Moving Average Values to adjust Sensitivity.
Ability to Turn On/Off Triangles Above/Below Bars based on Indicator.
Ability to Turn On/Off Triangles at Top And Bottom Of Screen Showing Direction of Indicator.
***Basically you have Option to View Indicator about every way possible.
***Special Thanks to Glaz for Original Code.


ATR + BB Swing StrategyMechanical daily stock swing strategy using ATR stops, Heikin Ashi trend confirmation, and Bollinger Bands context. Entries occur above 50 SMA on bullish Heikin Ashi candles; initial stop is 3xATR with trailing stop of highest close minus 2xAtr, reducing to 1.5xATR when profit protection triggers (+2R and momentum weakening). Exits are fully ATR-based, giving a simple, rules-driven approach to ride trends while protecting gains

The BLUE Red Candle Swing w AlertsThe script is for high probability swing entries based on a extremely strong bearish candles which typically come right before a green push up.
When a bearish candle has a higher than average ATR, it is a sign that there could be a large reversal coming next.
Use this indicator to help you set the stop loss and take profit based on the range of the highlighted Red candle.
*So if the ATR of this candle is $3.00 then set a $3.00 stop loss and take profit.
There is also a sc
Rules for the ATR RED/Blue Impulse candle
*Use the 50% line or midline of the candle to help refine your entries
*Use the range of the Blue candle as your stop loss range and for your 1st take profit target!
*Add more positions if there is a clear trend after the candle

Anurag BN / Nifty Swing Master [FINAL - Clean Compile]This script is a complete Swing Trading System designed for Bank Nifty and Nifty 50 options. It operates directly on the Spot/Index chart but mathematically calculates the correct Option Strike (ATM/ITM) and estimates P&L in Rupees.
It uses a Non-Repainting Daily Trend Filter combined with an Intraday Entry Trigger to find high-probability setups.
What we are checking before giving a signal:
For a CALL Option (Buy Signal):
Daily Trend Alignment: The previous day's Daily EMA must be below the current price (indicating a Bullish macro trend).
Intraday Crossover: The price must cross above the Intraday 20 EMA (the entry trigger).
Volume Confirmation: (Optional) Volume must be higher than the 20-period Volume Moving Average to ensure momentum.
Session Filter: The trade must occur within the specified trading hours (09:15 - 15:00) to avoid opening/closing volatility.
For a PUT Option (Sell Signal):
Daily Trend Alignment: The previous day's Daily EMA must be above the current price (indicating a Bearish macro trend).
Intraday Crossunder: The price must cross below the Intraday 20 EMA (the entry trigger).
Volume Confirmation: (Optional) Volume must be higher than the 20-period Volume Moving Average.
Session Filter: The trade must occur within the specified trading hours.
Key Features:
Strike Selection: Automatically displays the correct ATM/ITM Strike (e.g., "BUY 48200 CE").
Live Dashboard: Shows Real-time P&L (in Points and ₹), Entry Price, Strike, and Trade Status.
Risk Management: Plots fixed Stop Loss (1.5x ATR) and Target (2x Risk) lines on the chart that do not move during the trade.
Auto-Breakeven: Optionally moves Stop Loss to entry price after the trade moves 1R in profit.

Crypto Swing Pro [All-in-One] v2 [R2D2]1. Introduction
Crypto Swing Pro (CSP) is a professional-grade technical analysis suite designed for high-volatility cryptocurrency markets. It consolidates the top five institutional-grade indicators—RSI, EMAs, OBV, MACD, and Bollinger Bands—into a single overlay.
New in v2.0: The script now includes a fully integrated Alert System. You no longer need to stare at the chart all day. You can set the script to email you or ping your phone exactly when a MACD Cross occurs or when Volatility Squeezes, ensuring you never miss a move.
2. Installation
1. Open TradingView: Go to your chart.
2. Open Pine Editor: Click the tab at the bottom of the screen.
3. Paste Code: Delete existing code and paste the v2.0 script above.
4. Save: Name it CSP v2.
5. Add to Chart: Click "Add to Chart".
3. How to Set Up Alerts
This is the most powerful feature of v2.0. You can set alerts for specific conditions without needing to write code.
1. Click the "Alert" Button: Located on the top menu bar of TradingView (looks like an alarm clock).
2. Condition: In the "Condition" dropdown menu, select CSP v2.
3. Select Trigger: A second dropdown will appear. Choose the specific signal you want to track:
MACD Buy Signal: Triggers when MACD crosses bullish.
RSI Oversold (<30): Triggers when price is mathematically cheap.
Volatility Squeeze: Triggers when a big move is imminent.
Price Cross Over 200 EMA: Triggers on major trend reversals.
4. Options: Select "Once Per Bar Close" (Recommended to avoid false signals during the candle fluctuation).
5. Notify: Check "Notify in App" or "Send Email".
6. Create: Click Create. You will now be notified even if you are asleep.
4. The Dashboard (HUD)
The on-screen table gives you an instant "Health Check" of the asset.
Indicator Status Meaning
RSI (14) Green (<30) Oversold. Look for long entries.
Red (>70) Overbought. Look to take profit.
MACD BULLISH Momentum is up.
TREND UPTREND Price is above the 200 EMA (White Line).
VOLATILITY SQUEEZE CRITICAL: Market is coiling. A breakout is coming soon.
VOLUME ACCUMULATION Whales are buying (OBV is rising).
5. Configuration & Visuals
Hover over the indicator name on the chart and click the Settings (Gear) icon.
Toggle Indicators: Uncheck any indicator (like Bollinger Bands or EMA 20) to hide them if you want a cleaner view. The Dashboard will still calculate them in the background.
Dashboard Position: Move the table to any corner or turn it off entirely if it blocks your price view.
Color Themes: Adjust the RSI background colors or EMA colors to fit your chart theme (Light/Dark mode).
6. Best Practices
The "Squeeze" Play: If you get a Volatility Squeeze alert, do not enter immediately. Wait for the price to break out of the Bollinger Bands. The squeeze is the "Get Ready" signal; the breakout is the "Go" signal.
The "Trend" Filter: If the 200 EMA (White Line) is above the price (Downtrend), ignore all "MACD Buy" alerts. Trade with the macro trend, not against it.

Accurate Swing Trading + Support Resistance 2 more setting accurate swing trading, 2 setting mode. 1 trend. 2. buy sell. and add support resisten

Gold Master: Swing + Daily Scalp (Fixed & Working)How to use it correctly
Daily chart → Focus only on big green/red triangles (Swing trades)
5m / 15m / 1H chart → Focus on small circles (Scalp trades)
You can turn each system on/off independently in the settings
Works perfectly on XAUUSD, GLD, GC futures, and even DXY (inverse signals).

TMA SWING USE HOURLY TFTma Swing use hourly is a very strong potential buy and sell signal strategy where it give buy signal when 50 ema croses 200 ema and vise versa
RightFlow Universal Volume Profile - Any Market Any TimeframeSummary in one paragraph
RightFlow is a right anchored microstructure volume profile for stocks, futures, FX, and liquid crypto on intraday and daily timeframes. It acts only when several conditions align inside a session window and presents the result as a compact right side profile with value area, POC, a bull bear mix by price bin, and a HUD of profile VWAP and pressure shares. It is original because it distributes each bar’s weight into multiple mid price slices, blends bull bear pressure per bin with a CLV based split, and grows the profile to the right so price action stays readable. Add to a clean chart, read the table, and use the visuals. For conservative workflows read on bar close.
Scope and intent
• Markets. Major FX pairs, index futures, large cap equities and ETFs, liquid crypto.
• Timeframes. One minute to daily.
• Default demo used in the publication. SPY on 15 minute.
• Purpose. See where participation concentrates, which side dominated by price level, and how far price sits from VA and POC.
Originality and usefulness
• Unique fusion. Right anchored growth plus per bar slicing and CLV split, with weight modes Raw, Notional, and DeltaProxy.
• Failure mode addressed. False reads from single bar direction and coarse binning.
• Testability. All parts sit in Inputs and the HUD.
• Portable yardstick. Value Area percent and POC are universal across symbols.
• Protected scripts. Not applicable. Method and use are fully disclosed.
Method overview in plain language
Pick a scope Rolling or Today or This Week. Define a window and number of price bins. For each bar, split its range into small slices, assign each slice a weight from the selected mode, and split that weight by CLV or by bar direction. Accumulate totals per bin. Find the bin with the highest total as POC. Expand left and right until the chosen share of total volume is covered to form the value area. Compute profile VWAP for all, buyers, and sellers and show them with pressure shares.
Base measures
Range basis. High minus low and mid price samples across the bar window.
Return basis. Not used. VWAP trio is price weighted by weights.
Components
• RightFlow Bins. Price histogram that grows to the right.
• Bull Bear Split. CLV based 0 to 1 share or pure bar direction.
• Weight Mode. Raw volume, notional volume times close, or DeltaProxy focus.
• Value Area Engine. POC then outward expansion to target share.
• HUD. Profile VWAP, Buy and Sell percent, winner delta, split and weight mode.
• Session windows optional. Scope resets on day or week.
Fusion rule
Color of each bin is the convex blend of bull and bear shares. Value area shading is lighter inside and darker outside.
Signal rule
This is context, not a trade signal. A strong separation between buy and sell percent with price holding inside VA often confirms balance. Price outside VA with skewed pressure often marks initiative moves.
What you will see on the chart
• Right side bins with blended colors.
• A POC line across the profile width.
• Labels for POC, VAH, and VAL.
• A compact HUD table in the top right.
Table fields and quick reading guide
• VWAP. Profile VWAP.
• Buy and Sell. Pressure shares in percent.
• Delta Winner. Winner side and margin in percent.
• Split and Weight. The active modes.
Reading tip. When Session scope is Today or This Week and Buy minus Sell is clearly positive or negative, that side often controls the day’s narrative.
Inputs with guidance
Setup
• Profile scope. Rolling or session reset. Rolling uses window bars.
• Rolling window bars. Typical 100 to 300. Larger is smoother.
Binning
• Price bins. Typical 32 to 128. More bins increase detail.
• Slices per bar. Typical 3 to 7. Raising it smooths distribution.
Weighting
• Weight mode. Raw, Notional, DeltaProxy. Notional emphasizes expensive prints.
• Bull Bear split. CLV or BarDir. CLV is more nuanced.
• Value Area percent. Typical 68 to 75.
View
• Profile width in bars, color split toggle, value area shading, opacities, POC line, VA labels.
Usage recipes
Intraday trend focus
• Scope Today, bins 64, slices 5, Value Area 70.
• Split CLV, Weight Notional.
Intraday mean reversion
• Scope Today, bins 96, Value Area 75.
• Watch fades back to POC after initiative pushes.
Swing continuation
• Scope Rolling 200 bars, bins 48.
• Use Buy Sell skew with price relative to VA.
Realism and responsible publication
No performance claims. Shapes can move while a bar forms and settle on close. Education only.
Honest limitations and failure modes
Thin liquidity and data gaps can distort bin weights. Very quiet regimes reduce contrast. Session time is the chart venue time.
Open source reuse and credits
None.
Legal
Education and research only. Not investment advice. Test on history and simulation before live use.
