Gann Octave 8 Ver.2.0Gann Octave 8 Ver.2.0 - Complete Trading Guide
Overview
This indicator combines W.D. Gann's time-tested principles of market geometry with modern technical analysis. It identifies key market structures and projects precise support/resistance levels along with angular momentum lines to help traders identify high-probability trading opportunities.
________________________________________
Core Concepts
1. Gann's Octave Division (The Rule of 8)
W.D. Gann discovered that markets move in harmonic divisions based on the number 8. This indicator divides any swing movement into 8 equal parts (octaves):
• 0% - Swing extreme (High for bearish, Low for bullish)
• 12.5% - First octave
• 25% - Quarter level
• 37.5% - Three-eighths level
• 50% - Midpoint (most critical level)
• 62.5% - Five-eighths level
• 75% - Three-quarter level
• 87.5% - Seventh octave
• 100% - Swing extreme (opposite end)
Why 8? Gann believed natural market cycles follow mathematical harmonics. The octave division provides precise entry and exit points that frequently act as support/resistance zones.
2. Gann Angles (Price-Time Relationship)
Gann angles represent the relationship between price movement and time. Each angle shows different momentum levels:
• 1x1 (Black) - 45° angle, perfect balance between price and time. Most important Gann angle. Represents the natural trend line.
• 2x1 (Red) - Steeper angle, 2 units of price per 1 unit of time. Shows strong momentum.
• 1x2 (Red) - Flatter angle, 1 unit of price per 2 units of time. Shows weak momentum.
• 4x1 & 1x4 (Blue) - Even more extreme angles indicating very strong or very weak trends.
• 8x1 & 1x8 (Orange) - Most extreme angles, parabolic moves or complete consolidation.
Key Principle: When price is above the 1x1 angle = bullish. Below 1x1 = bearish. When price crosses from one angle to another, it signals a change in momentum.
________________________________________
How the Indicator Works
Structure Detection
The indicator automatically identifies market swings using pivot points:
1. Bullish Structure (Green): Detected when price makes a higher high
o Octave levels calculated from swing low (0%) to swing high (100%)
o Gann angles project upward from the swing low
2. Bearish Structure (Red): Detected when price makes a lower low
o Octave levels calculated from swing high (0%) to swing low (100%)
o Gann angles project downward from the swing high
Dynamic Updates
• Swing Tracker ON: Levels update continuously as the swing evolves
• Swing Tracker OFF: Levels lock at the initial swing detection (cleaner charts)
Historical Structures
The indicator maintains previous swing structures based on "Number of Swings to Show":
• Set to 1: Only current structure (cleanest)
• Set to 2-3: Current + recent history (recommended for context)
• Set to 4+: Multiple historical structures (may overlap but shows pattern)
________________________________________
Trading Strategy
Entry Signals
BUY SIGNALS (Green Triangle Up ▲)
Signal 1: Bounce from Support Levels
• Price drops to 0%, 50%, or 100% level and reverses
• Best when combined with bullish candlestick pattern (hammer, engulfing)
• Entry: On signal confirmation
• Stop Loss: Below the support level (0.5-1% below)
• Target: Next octave level up (12.5%, 25%, 50%)
Signal 2: Breakout Above Resistance
• Price breaks above 50% or 100% level with momentum
• Confirms trend continuation or reversal
• Entry: On close above the level
• Stop Loss: Below the breakout level
• Target: Previous swing high or next major level
Signal 3: Gann Angle Support
• Price bounces off 1x1 angle (black line)
• Indicates trend is intact
• Entry: When price respects the angle
• Stop Loss: Below the 1x1 angle
• Target: Next resistance level
SELL SIGNALS (Red Triangle Down ▼)
Signal 1: Rejection from Resistance Levels
• Price rallies to 0%, 50%, or 100% level and reverses
• Best when combined with bearish candlestick pattern (shooting star, bearish engulfing)
• Entry: On signal confirmation
• Stop Loss: Above the resistance level (0.5-1% above)
• Target: Next octave level down (87.5%, 75%, 50%)
Signal 2: Breakdown Below Support
• Price breaks below 50% or 0% level with momentum
• Confirms trend continuation or reversal
• Entry: On close below the level
• Stop Loss: Above the breakdown level
• Target: Previous swing low or next major level
Signal 3: Gann Angle Resistance
• Price fails at 1x1 angle (black line)
• Indicates trend weakness
• Entry: When price rejects the angle
• Stop Loss: Above the 1x1 angle
• Target: Next support level
________________________________________
Advanced Trading Techniques
1. The 50% Rule (Most Powerful)
The 50% octave level is the most critical in Gann theory:
• In Uptrend: Price should not break below 50% retracement. If it holds = trend intact, go long.
• In Downtrend: Price should not break above 50% retracement. If it holds = trend intact, go short.
• Reversal: Breaking and closing beyond 50% often signals trend reversal.
2. Gann Angle Confluence
When multiple Gann angles converge with octave levels = HIGH probability zone:
• Look for price to bounce or reverse at these zones
• Example: 1x2 angle meets 50% level = strong support/resistance
• These zones often become pivot points
3. Multiple Timeframe Analysis
• Use higher timeframe (daily) for major structure
• Use lower timeframe (5min, 15min) for precise entries
• Take trades when both timeframes align
4. Swing Failure Pattern
• Price breaks a key level (e.g., 50%) but quickly reverses back
• This "false breakout" often leads to strong move in opposite direction
• Wait for signal in the reversal direction
________________________________________
Settings Optimization
For Day Trading (Scalping)
• Structure Period: 0-2 (22 bars or less)
• Number of Swings: 1 (only current structure)
• Signal Sensitivity: High
• Swing Tracker: OFF (cleaner)
For Swing Trading
• Structure Period: 4-5 (44-88 bars)
• Number of Swings: 2-3
• Signal Sensitivity: Medium
• Swing Tracker: ON or OFF (preference)
For Position Trading
• Structure Period: 6-8 (176+ bars)
• Number of Swings: 3-5
• Signal Sensitivity: Low
• Swing Tracker: ON
________________________________________
Common Patterns to Watch
Bullish Reversal Setup
1. Price in bearish structure (red levels)
2. Price drops to 100% level (swing low)
3. Buy signal appears (green triangle)
4. Price breaks back above 50% level
5. Action: Go long with stop below 100%
Bearish Reversal Setup
1. Price in bullish structure (green levels)
2. Price rises to 100% level (swing high)
3. Sell signal appears (red triangle)
4. Price breaks back below 50% level
5. Action: Go short with stop above 100%
Trend Continuation
1. Price respects 1x1 Gann angle
2. Small pullback to 25% or 37.5% level
3. Buy/sell signal appears
4. Action: Enter in trend direction
________________________________________
________________________________________
Signal Sensitivity Guide
• Low: Conservative, only major breakouts (3-5 signals per day)
• Medium: Balanced, includes approaches (5-10 signals per day)
• High: Aggressive, includes bounces (10-20 signals per day)
Choose based on your trading style and risk tolerance
________________________________________
Final Words
This indicator is a powerful tool, but remember:
"The market is never wrong. Opinions are." - W.D. Gann
• No indicator is 100% accurate
• Always combine with price action and volume
• Backtest on your instrument and timeframe
• Keep learning and adapting your strategy
• Discipline and risk management are more important than the perfect setup
Happy Trading! 📈
Search in scripts for "swing"

zuperviewResourcesLibrary "zuperview"
ComputeMAValue(maType, series, period)
ComputeMAValue
@description Computes the moving average (MA) value based on the specified MA type.
Parameters:
maType (string) : (string) The type of moving average: "EMA", "SMA", "RMA", "WMA", "HMA", "VWMA", "LinReg".
series (float) : (float) The input price series (typically close).
period (simple int) : (int) The number of periods used for MA calculation.
Returns: (float) The computed MA value or `na` if maType is invalid.
ComputeATRValue(period)
ComputeATRValue
@description Computes the moving average (ATR) value based on the specified ATR type.
Parameters:
period (int) : (int) The number of periods used for MA calculation.
Returns: (float) The computed ATR value or `na` if maType is invalid.
Max(src, period)
Parameters:
src (float)
period (int)
Min(src, period)
Parameters:
src (float)
period (int)
ComputeRSIValue(src, period, smooth)
ComputeRSIValue
@description Computes the moving average (RSI) value based on the specified RSI type.
Parameters:
src (float) : (series) Input series (series float), which can be close (`close`), open (`open`), high (`high`), low (`low`), or any other price-based series.
period (int) : (int) The number of periods used for MA calculation.
smooth (int)
Returns: (float) The computed RSI value or `na` if maType is invalid.
ComputeSMMAValue(src, period)
ComputeSMMAValue
@description Computes the moving average (SMMA) value based on the specified SMMA type.
Parameters:
src (float) : (series) Input series (series float), which can be close (`close`), open (`open`), high (`high`), low (`low`), or any other price-based series.
period (int) : (int) The number of periods used for MA calculation.
Returns: (float) The computed SMMA value or `na` if maType is invalid.
ComputeStochasticValue(src, periodD, periodK, smoothingMethod, smoothingPeriod)
ComputeStochasticValue
@description Computes the moving average (SMMA) value based on the specified SMMA type.
Parameters:
src (float) : (series) Input series (series float), which can be close (`close`), open (`open`), high (`high`), low (`low`), or any other price-based series.
periodD (simple int) : (int) The number of periods used for MA calculation.
periodK (int) : (int) The number of periods used for MA calculation.
smoothingMethod (string) : (string) The type of moving average: "EMA", "SMA", "RMA", "WMA", "HMA", "VWMA", "LinReg".
smoothingPeriod (simple int) : (int) The number of periods used for MA calculation.
Returns: (float) The computed Stochastic(K, D) value or `na` if maType is invalid.
FindSwingsByNeighborhood(arraySwingTop, arraySwingBottom, neighborhood)
Find Swings By Neighborhood
@description Computes the moving average (SMMA) value based on the specified SMMA type.
Parameters:
arraySwingTop (array) : (array): An array to store detected swing highs.
arraySwingBottom (array) : (array): An array to store detected swing lows.
neighborhood (int) : (int): The number of bars to consider when identifying a swing point.
Returns: none
FindSwingsByOffset(arraySwingTop, arraySwingBottom, minSwingLength)
Find Swings By Offset
@description Identifies swing points based on a minimum swing length criteria.
Parameters:
arraySwingTop (array) : (array): An array to store detected swing highs.
arraySwingBottom (array) : (array): An array to store detected swing lows.
minSwingLength (float) : (float): The minimum price movement required to qualify as a swing point.
Returns: none
SwingPoint
Fields:
Key (series int)
IsTop (series bool)
Price (series float)
BarStart (series int)
BarEnd (series int)
TimeStart (series int)
TimeEnd (series int)
Sign (series int)
Label (series label)

AoDivergenceLibrary_Library "AoDivergenceLibrary_"
this has functions which calculate and plot divergences which are used for ao divergences. essentially, this finds divergences by using the ao divergence logic. this logic has been used in "AO Hid & Reg Div with LC & Kernel".
regBullDivergence(swingLow, osc, colour)
Parameters:
swingLow (bool)
osc (float)
colour (color)
regBearDivergence(swingHigh, osc, colour)
Parameters:
swingHigh (bool)
osc (float)
colour (color)
hidBullDivergence(swingHigh, osc, colour)
Parameters:
swingHigh (bool)
osc (float)
colour (color)
hidBearDivergence(swingHigh, osc, colour)
Parameters:
swingHigh (bool)
osc (float)
colour (color)

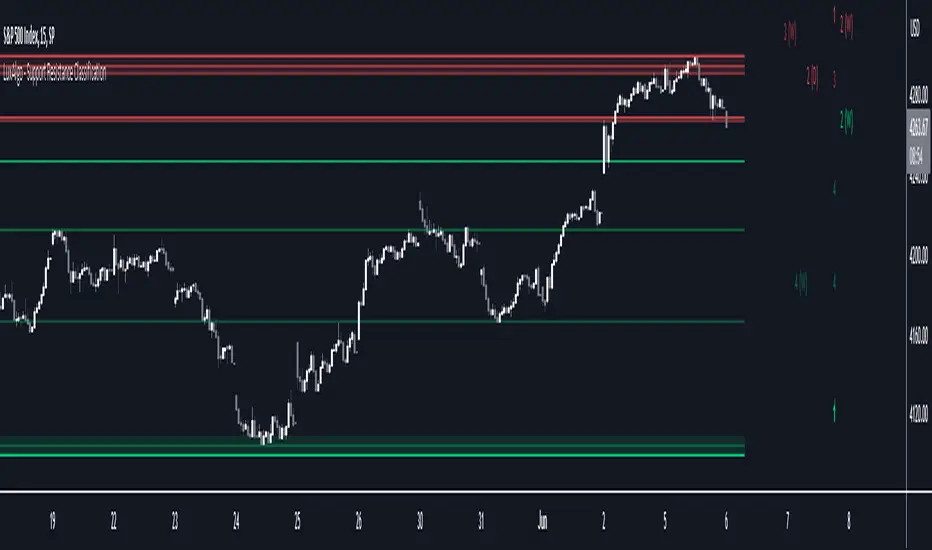
Support Resistance Classification [LuxAlgo]The Support Resistance Classification indicator shows SR levels from a user-defined range using higher time-frame data (HTF). Levels are classified 1 through 10 based on their strength, with lower values indicating stronger support/resistance levels.
This indicator doesn't use visible range functionality, in contrast to our Support Resistance Classification (VR) indicator, it uses a set lookback period to find support/resistance levels.
Since both techniques cannot be used together in 1 script, we developed a separate, NON-VR version.
🔶 USAGE
Certain indicators on higher timeframes can provide longer-term support/resistance levels on lower timeframes. Users can use the provided levels and use them as references for future support/resistance levels.
The classification algorithm measures the strength of a support/resistance level using the set range and is in a range of 1 to 10, with higher values indicating a weaker support/resistance.
Supports/resistances highlighted by the indicator can be used for future applications by marking them on the chart (quickly done with alt + h).
🔶 DETAILS
All calculations are based on what is seen in the last amount of bars, which is the period between the blue vertical line and the last candle:
Since only Swings which are not broken are included, every break would exclude that swing. Therefore, even when 'value' is chosen at Settings ('Value'), breaks are always calculated on the entire line.
🔶 SETTINGS
Lookback: Amount of bars from current bar to x bars back , this is the period where support/resistance levels are calculated.
Fade: After x breaks the line becomes invisible
Value:
value:
• SMA, upper/lower: the breaks are triggered on the moving average itself
• Fibonacci Pivot Point levels, Previous High, Previous Low: only last HTF values can be used for breaks
• Swings (see SWING SETTINGS)
line:
• SMA, upper/lower: the breaks are triggered on the entire line, based on its latest value
• Fibonacci Pivot Point Levels, Previous High, Previous Low: breaks are triggered on the entire line, based on its latest value
• Swings (see SWING SETTINGS)
🔹 Swing Settings
Swings are always calculated at the current timeframe, setting an HTF is not applicable to Swings.
Left/Right: for Swing calculation ( pivothigh , pivotlow )
Show: enables you to see the pivot points
🔹 Set
N°: The concerning number
TYPE:
• SMA (Simple Moving Average)
• Previous High/Low
• Upper/Lower ( Bollinger Bands )
• Pivot Point levels : "Fibonacci"
LENGTH: sets the 'Number of bars', needed for calculations (applicable for SMA, upper/lower)
MULT: sets the 'Standard deviation factor' (only applicable for upper/lower - BB)
HTF: sets 'Higher Time Frame' (applicable for SMA, upper/lower, Previous High/Low, Fibonacci)
🔹 Show Values
You can make up to 5 values visible (if you want to check/verify), except for Swings (see SWING SETTINGS)
To do so, enable (A -> E), and choose the N° you want to see.
This also is a useful tool if you're not sure which value you want to set.
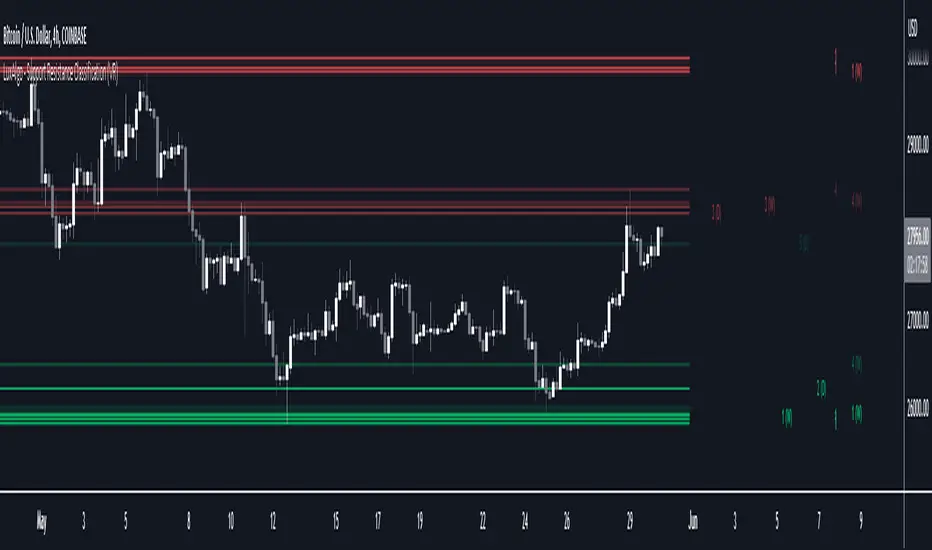
Support Resistance Classification (VR) [LuxAlgo]The Support Resistance Classification (VR) indicator shows SR levels on any chart's visible range using higher time-frame data (HTF). Levels are classified 1 through 10 based on their strength, with lower values indicating stronger support/resistance levels.
This indicator uses visible range functionality, whereas if you adjust your chart to show previous price data, the indicator may show new levels.
🔶 USAGE
Certain indicators on higher timeframes can provide longer term support/resistance levels on lower timeframes. Users can use the provided levels on a chart visible range and use them as reference for future support/resistance levels.
The classification algorithm measures the strength of a support/resistance level using the entire chart visible range and is in a range of 1 to 10, with higher values indicating a weaker support/resistance.
Supports/resistances highlighted by the indicator can be used for future applications by marking them on the chart (quickly done with alt + h).
🔶 DETAILS
All calculations are based on what you see on the Visible Chart, as such changing the chart will recalculate the indicator.
Since only Swings which are not broken are included, every break would exclude that swing. Therefore, even when 'value' is chosen at Settings ('Value'), breaks are always calculated on the entire line.
🔶 SETTINGS
Fade: After x breaks the line becomes invisible
Value:
value:
• SMA, upper/lower: the breaks are triggered on the moving average itself
• Fibonacci Pivot Point levels, Previous High, Previous Low: only last HTF values can be used for breaks
• Swings (see SWING SETTINGS)
line:
• SMA, upper/lower: the breaks are triggered on the entire line, based on its latest value
• Fibonacci Pivot Point Levels, Previous High, Previous Low: breaks are triggered on the entire line, based on its latest value
• Swings (see SWING SETTINGS)
🔹 Swing Settings
Swings are always calculated at current timeframe, setting a HTF is not applicable on Swings.
Left/Right: for Swing calculation ( pivothigh , pivotlow )
Show: enables you to see the pivot points
🔹 Set
N°: The concerning number
TYPE:
• SMA (Simple Moving Average)
• Previous High/Low
• Upper/Lower ( Bollinger Bands )
• Pivot Point levels : "Fibonacci"
LENGTH: sets the 'Number of bars', needed for calculations (applicable for SMA, upper/lower)
MULT: sets the 'Standard deviation factor' (only applicable for upper/lower - BB)
HTF: sets 'Higher Time Frame' (applicable for SMA, upper/lower, Previous High/Low, Fibonacci)
🔹 Show Values
You can make up to 5 values visible (if you want to check/verify), except for Swings (see SWING SETTINGS)
To do so, enable (A -> E), and choose the N° you want to see.
This also is a useful tool if you're not sure which value you want to set.
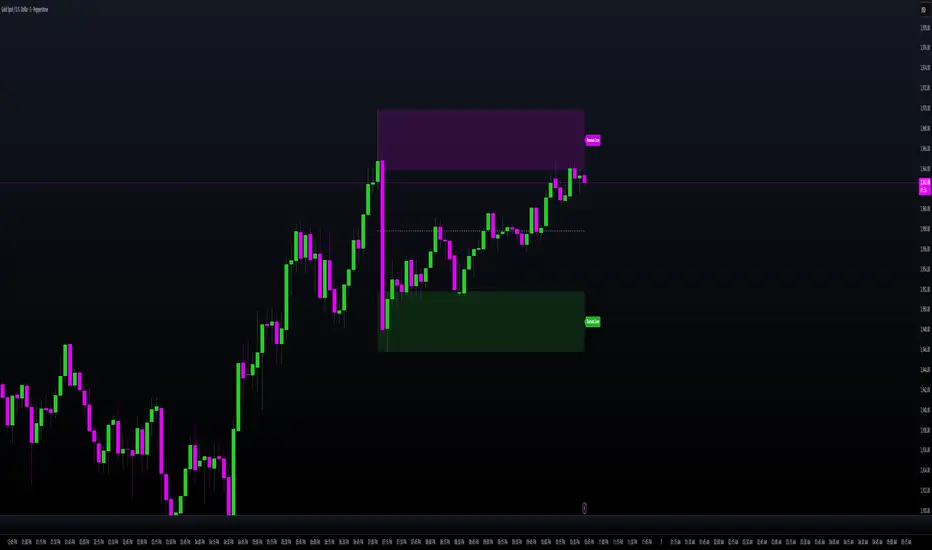
ICT/SMC HUDOverview
This indicator is an ICT/SMC-inspired market structure tool that detects:
Swing Structure (pivot-based)
BOS (Break of Structure) and CHoCH (Change of Character)
Liquidity Sweeps (buy-side & sell-side)
Premium/Discount filter using a simple equilibrium (EQ) midpoint
A Hold Score (0–5) system calculated from a higher timeframe (HTF)
Optional TP/SL visualization box (with TP2 expansion when Hold Score is strong)
⚠️ This is an educational tool, not a guaranteed trading system.
Core Logic (Where signals come from)
This script builds a simplified ICT/SMC framework using 3 layers:
1) Market Structure via Swings (Pivot High/Low)
The script finds swing highs/lows using:
ta.pivothigh(high, swingLen, swingLen)
ta.pivotlow(low, swingLen, swingLen)
These swings become the reference points for structure breaks.
2) BOS / CHoCH Detection
BOS Up = price closes above the last swing high
BOS Down = price closes below the last swing low
trend updates to 1 (bullish) or -1 (bearish) based on BOS
CHoCH triggers when BOS occurs against the current trend
CHoCH Up = trend was bearish, then BOS Up happens
CHoCH Down = trend was bullish, then BOS Down happens
3) Liquidity Sweep + Premium/Discount Filter
Sell-side sweep: low breaks below last swing low, but closes back above it
Buy-side sweep: high breaks above last swing high, but closes back below it
Equilibrium (EQ) midpoint is:
(lastSwingHigh + lastSwingLow) / 2
Discount = price below EQ
Premium = price above EQ
Signal Rules (Buy / Sell)
Buy Signal
Sell-side sweep + (CHoCH Up or BOS Up)
OR
BOS Up while price is in Discount
Sell Signal
Buy-side sweep + (CHoCH Down or BOS Down)
OR
BOS Down while price is in Premium
Hold Score System (0–5) — HTF confirmation
The script calculates a Hold Score from HTF using 5 checks:
HTF EMA Bias
Bullish hold bias: EMA Fast > EMA Mid
Bearish hold bias: EMA Fast < EMA Mid
Volatility Expansion
Uses HTF Bollinger Band width; if width is increasing, expansion is “OK”
Mid Acceptance
HTF close relative to HTF BB basis (SMA)
Follow-through after Entry
Requires N consecutive bars closing in favor of the entry direction
No Opposite Break
Avoid holding if opposite BOS/CHoCH appears
Hold Score = sum of the 5 checks (0–5)
TP/SL Box (Optional)
When a new Buy/Sell signal occurs:
Entry is set at current close
SL uses:
Swing-based stop (lowest/ highest of last N bars)
optional ATR buffer
TP1 and TP2 are set using Risk:Reward ratios
TP2 Expansion (Optional)
If Hold Score ≥ threshold:
TP2 RR increases by extraRRonHold
Can be set to expand only (never shrink)
Auto-hide TP/SL Drawings (Optional)
If enabled, the TP/SL box/lines/labels will automatically disappear after N bars.
This is useful for clean charts while still keeping Hold Score logic running.
Best Use Cases
✅ Works best during liquidity sessions:
London Killzone
New York Killzone
✅ Recommended timeframes:
Structure: 15m / 1h
Entry refinement: 5m / 1m
Hold Score HTF: 1h or 4h
Inputs Guide (Quick)
Swing length (Structure): controls swing sensitivity (higher = fewer swings)
Hold Score HTF: HTF used for Hold Score confirmation
TP/SL Box: visualization tool, not order execution
Auto-hide: removes drawings after N bars for clean charts
TP2 Expand: increases TP2 target when Hold Score is strong
Disclaimer
This indicator does not place trades and does not guarantee profits. Always manage risk, backtest, and validate with your own strategy.

Algo Structure [ValiantTrader_]Explanation of the "Algo Structure" Trading Indicator
This Pine Script indicator, created by ValiantTrader_, is a multi-timeframe swing analysis tool that helps traders identify key price levels and market structure across different timeframes. Here's how it works and how traders can use it:
Core Components
1. Multi-Timeframe Swing Analysis
The indicator tracks swing highs and lows across:
The current chart timeframe
A higher timeframe (weekly by default)
An even higher timeframe (monthly by default)
2. Swing Detection Logic
Current timeframe swings: Identified when price makes a 3-bar high/low pattern
Higher timeframe swings: Uses the highest high/lowest low of the last 3 bars on those timeframes
3. Visual Elements
Horizontal lines marking swing points
Labels showing the timeframe and percentage distance from current price
An information table summarizing key levels
How Traders Use This Indicator
1. Identifying Key Levels
The indicator draws recent swing highs (red) and swing lows (green)
These levels act as potential support/resistance areas
Traders watch for price reactions at these levels
2. Multi-Timeframe Analysis
By seeing swings from higher timeframes (weekly, monthly), traders can:
Identify more significant support/resistance zones
Understand the broader market context
Spot confluence areas where multiple timeframes align
3. Measuring Price Distance
The percentage display shows how far current price is from each swing level
Helps assess potential reward/risk at current levels
Shows volatility between swings (wider % = more volatile moves)
4. Table Summary
The info table provides a quick reference for:
Exact price levels of swings
Percentage ranges between highs and lows
Comparison across timeframes
5. Trading Applications
Breakout trading: When price moves beyond a swing high/low
Mean reversion: Trading bounces between swing levels
Trend confirmation: Higher highs/lows in multiple timeframes confirm trends
Support/resistance trading: Entering trades at swing levels with other confirmation
Customization Options
Traders can adjust:
The higher timeframes analyzed
Whether to show the timeframe labels
Whether to display swing levels
Whether to show the info table
The indicator also includes price alerts for new swing highs/lows on the current timeframe, allowing traders to get notifications when market structure changes.
This tool is particularly valuable for traders who incorporate multi-timeframe analysis into their strategy, helping them visualize important price levels across different time perspectives

ICT Unicorn Model [Kodexius]ICT Unicorn Model is a market structure and imbalance confluence tool that automatically detects high probability “Unicorn” setups by combining three key elements into a single, clean script:
-A first, clean break of that swing level (displacement style break)
-A Fair Value Gap that overlaps a breaker candle body range
Instead of plotting every pivot or every imbalance independently, the script waits for a specific sequence: price establishes a valid swing, breaks that swing for the first time, and prints a setup only when the resulting context aligns with a valid, volatility filtered FVG and a clearly defined breaker range.
Each detected setup is drawn directly on the chart with labeled zones (Breaker and FVG) and is then actively monitored. If price violates the breaker boundary based on your chosen invalidation basis (Close or Wick), the setup is marked inactive and can optionally be removed to keep the chart clean.
This indicator is designed for traders who work with ICT style concepts such as liquidity runs, displacement, breaker blocks, and imbalance reversion, and who want a structured, rules based visualization rather than discretionary drawing.
🔹 Features
🔸 Fair Value Gap Detection With Volatility Filtering
Bullish and bearish FVGs are detected using classic three candle imbalance logic. To avoid low quality gaps during compression, the script applies an ATR based minimum size filter using the “FVG Min Size (ATR Multiplier)” input. Only gaps larger than ATR * threshold are considered valid.
🔸 First Break Validation (Clean Break Logic)
A key part of the model is identifying a “first break” of a swing level. The script checks whether the swing price has already been invalidated between the swing bar and the current bar. If it has, the swing is ignored. This helps reduce repeated signals and focuses on fresh structural breaks.
🔸 Breaker and FVG Confluence With Overlap Requirement
After a valid break occurs, the script defines a breaker range using the body of the swing candle (open and close). A setup is only created if this breaker body range overlaps the detected FVG price range. This overlap requirement is what filters many “almost” conditions and keeps signals more selective.
Bullish Unicorn:
Bearish Unicorn:
🔸 Configurable Invalidation Basis (Close or Wick)
You can choose how a setup fails:
-Close: invalidation requires a candle close beyond the breaker boundary
-Wick: invalidation occurs as soon as any wick crosses beyond the breaker boundary
This allows the tool to adapt to different trading styles, from conservative confirmation to more sensitive risk control.
🔸 Automatic Cleanup of Failed Setups
If “Delete Invalidated Setups” is enabled, the script removes the breaker box, FVG box, and label as soon as the setup is invalidated. If disabled, the zones remain visible for review while the setup is marked inactive internally.
🔸 Clear Chart Visuals
Each setup plots:
-A labeled Breaker zone box
-A labeled FVG zone box
-A directional Unicorn label (Bull or Bear) that updates position as the chart advances
Colors for bullish and bearish structures are fully configurable.
🔸 Alert Conditions
Two alert conditions are provided:
-Bullish Unicorn Setup Detected
-Bearish Unicorn Setup Detected
Alerts trigger only on the bar a new setup is created.
🔹 Calculations
This section summarizes the main computations used internally. The goal here is to explain the model mechanics rather than reproduce every implementation detail.
1. Swing Detection (Pivot High / Pivot Low)
Swing levels are detected using a symmetric pivot definition with “Swing Length” bars on both sides:
float ph = ta.pivothigh(high, swingLength, swingLength)
float pl = ta.pivotlow(low, swingLength, swingLength)
When a pivot is confirmed, its price and originating bar index are stored:
-Swing High: price = pivot high, isHigh = true
-Swing Low: price = pivot low, isHigh = false
The script keeps a limited history (most recent swings) to stay efficient.
2. Fair Value Gap Detection
FVGs use the classic three candle displacement imbalance:
Bullish FVG condition
bool isBullFVG = high < low
Bullish gap range is defined as:
-Top = low
-Bottom = high
Bearish FVG condition
bool isBearFVG = low > high
Bearish gap range is defined as:
-Top = low
-Bottom = high
3. ATR Based Minimum Gap Filter
ATR is computed (length 14), then the gap size is compared against a user threshold:
float atr = ta.atr(14)
bool validBullFVG = isBullFVG and (bullFvgTop - bullFvgBot) > (atr * fvgThreshold)
bool validBearFVG = isBearFVG and (bearFvgTop - bearFvgBot) > (atr * fvgThreshold)
This prevents very small imbalances from generating setups in low volatility conditions.
4. “First Break” Check Using Level Invalidation Scan
Before accepting a swing break, the script scans forward from the swing bar to the current bar to confirm the level has not already been breached. The scan can be based on wick or close:
-Wick mode: uses high or low
-Close mode: uses close
Conceptually:
priceToCheck = mode == "Wick" ? (checkBelow ? low : high) : close
If a prior breach is found, the swing is treated as already invalidated and is ignored for setup creation.
5. Break Of Structure Condition
Bullish break requirement
A bullish setup requires breaking a stored swing high with bullish body intent:
-close > swingHighPrice
-open < close
Bearish break requirement
A bearish setup requires breaking a stored swing low with bearish body intent:
-close < swingLowPrice
-open > close
An additional proximity filter is applied in the bearish branch to reduce weak or overly extended breaks by requiring the prior close to be reasonably near the swing level.
6. Breaker Range Construction
Once a qualifying swing is found, the breaker range is derived from the body of the swing candle (the candle at the swing bar index). The body boundaries are:
float breakerTop = math.max(bOpen, bClose)
float breakerBot = math.min(bOpen, bClose)
This models the breaker as the candle body range rather than full wick range, which typically produces more practical invalidation boundaries.
7. Overlap Test Between Breaker and FVG
A setup is only created if the breaker body overlaps the FVG zone. Conceptually the script rejects cases where one range is fully above or fully below the other:
-If there is no overlap, no setup is created
-If overlap exists, the Unicorn setup is valid
8. Active Monitoring and Invalidation
Each setup remains active until invalidated. Invalidation is evaluated every bar using your selected basis:
-Close basis: compares close to breaker boundary
-Wick basis: compares high or low to breaker boundary
Bullish invalidation
Setup fails if price crosses below breaker bottom.
Bearish invalidation
Setup fails if price crosses above breaker top.
If deletion is enabled, all drawings related to that setup are removed immediately on invalidation.
9. Drawing Updates and Object Lifecycle
Breaker and FVG boxes are extended to the right while the setup is active to keep zones visible into the near future. The Unicorn label is also repositioned as new bars print so the most recent context stays readable.

Advanced ICC Multi-Timeframe 1.0Advanced ICC Multi-Timeframe Trading System
A comprehensive implementation and interpretation of the Indication, Correction, Continuation (ICC) trading methodology made popular by Trades by Sci, enhanced with advanced multi-timeframe analysis and automation features.
⚠️ CRITICAL TRADING WARNINGS:
DO NOT blindly follow BUY/SELL signals from this indicator
This indicator shows potential entry points but YOU must validate each trade
PAPER TRADE EXTENSIVELY before risking real capital
BACKTEST THOROUGHLY on your chosen instruments and timeframes
The ICC methodology requires understanding and discretion - automated signals are guidance only
This tool aids analysis but does not replace proper trade planning, risk management, or trader judgment
⚠️ Important Disclaimers:
This indicator is not endorsed by or affiliated with Trades by Sci
This is an early implementation and interpretation of the ICC methodology
May not work exactly as Trades by Sci executes his trades and entries
Requires further debugging, backtesting, and real-world validation
Completely free to use - no purchase required
I'm just one person obsessed with this method and wanted some better visualization of the chart/entries
About ICC:
The ICC method identifies complete market cycles through three phases: Indication (breakout), Correction (pullback), and Continuation (entry). This indicator automates the identification of these phases and adds powerful features for modern traders.
Key Features:
Multi-Timeframe Capabilities:
Automatic timeframe detection with optimized settings for 5m, 15m, 30m, 1H, 4H, and Daily charts
Higher timeframe overlay to view HTF ICC levels on lower timeframe charts for precise entry timing
Smart defaults that adjust swing length and consolidation detection based on your timeframe
Advanced Phase Tracking:
Complete ICC cycle tracking: Indication, Correction, Consolidation, Continuation, and No Setup phases
Live structure detection shows potential peaks/troughs before full confirmation
Intelligent invalidation logic detects failed setups when market structure reverses
Dynamic phase backgrounds for instant visual confirmation
Three Types of Entry Signals:
Traditional Entries - Price crosses back through the original indication level (strongest signals)
"BUY" (green) / "SELL" (red)
Breakout Entries - Price breaks out of consolidation range in the same direction
"BUY" (green) / "SELL" (red)
Reversal Entries (Optional, can be toggled off) - Price breaks consolidation in opposite direction, indicating failed setup
"⚠ BUY" (yellow) / "⚠ SELL" (orange)
More aggressive, counter-trend signals
Can be disabled for more conservative trading
Professional Features:
Volatility-based support/resistance zones (ATR-adjusted) that adapt to market conditions
Historical zone tracking (0-3 configurable) with visual hierarchy
Comprehensive real-time info table displaying all key metrics
Full alert system for entries, indications, and consolidation detection
Visual distinction between high-confidence trend entries and cautionary reversal entries
📖 USAGE GUIDE
Entry Signal Types:
The indicator provides three types of entry signals with visual distinction:
Strong Entries (High Confidence):
"BUY" (bright green) / "SELL" (bright red)
Includes traditional entries (crossing back through indication level) and breakout entries (breaking consolidation in trend direction)
These are trend continuation or breakout signals with higher probability
Recommended for all traders
Reversal Entries (Caution - Counter-Trend):
"⚠ BUY" (yellow) / "⚠ SELL" (orange)
Triggered when price breaks out of correction/consolidation in the OPPOSITE direction
Indicates a failed setup and potential trend reversal
More aggressive, counter-trend plays
Can be toggled off in settings for more conservative trading
Recommended only for experienced traders or after thorough backtesting
Swing Length Settings:
The swing length determines how many bars on each side are needed to confirm a swing high/low. This is the most important setting for tuning the indicator to your style.
Auto Mode (Recommended for beginners): Toggle "Use Auto Timeframe Settings" ON
5-minute: 30 bars
15-minute: 20 bars
30-minute: 12 bars
1-hour: 7 bars
4-hour: 5 bars
Daily: 3 bars
Manual Mode: Toggle "Use Auto Timeframe Settings" OFF
Lower values (3-7): More aggressive, detects smaller swings
Pros: More signals, faster entries, catches smaller moves
Cons: More noise, more false signals, requires tighter stops
Best for: Scalping, active day trading, volatile markets
Higher values (12-20): More conservative, only major swings
Pros: More reliable signals, fewer false breakouts, clearer structure
Cons: Fewer signals, delayed entries, might miss smaller opportunities
Best for: Swing trading, position trading, trending markets
Default Manual Setting: 7 bars (balanced for 1H charts)
Minimum: 3 bars
Consolidation Bars Setting:
Determines how many bars without new structure are needed before flagging consolidation.
Lower values (3-10): Faster detection, catches brief pauses, more sensitive
Best for: Lower timeframes, volatile markets, avoiding any chop
Higher values (20-40): More reliable, only flags true extended consolidation
Best for: Higher timeframes, trending markets, patient traders
Current defaults scale with timeframe (more bars needed on shorter timeframes)
Historical S/R Zones:
Shows previous support and resistance levels to provide context.
Default: 2 historical zones (shows current + 2 previous)
Range: 0-3 zones
Visual Hierarchy: Older zones are more transparent with dashed borders
Usage: Higher numbers (2-3) show more historical context but can clutter the chart. Start with 2 and adjust based on your preference.
Live Structure Feature (Yellow Warning ⚠):
Provides early warning of potential structure changes before full confirmation.
What it does: Detects potential swing highs/lows after just 2 bars instead of waiting for full swing_length confirmation
Live Peak: Shows when a high is followed by 2 lower closes (potential top forming)
Live Trough: Shows when a low is followed by 2 higher closes (potential bottom forming)
Important: These are UNCONFIRMED - they may be invalidated if price reverses
Use case: Get early awareness of potential reversals while waiting for confirmation
Displayed in: Info table only (no visual markers on chart to reduce clutter)
Only shows: Peaks higher than last swing high, or troughs lower than last swing low (filters out noise)
Higher Timeframe (HTF) Analysis:
View higher timeframe ICC structure while trading on lower timeframes.
How to enable: Toggle "Show Higher Timeframe ICC" ON
Setup: Set "Higher Timeframe" to your reference timeframe
Example: Trading on 15-minute? Set HTF to 240 (4-hour) or 60 (1-hour)
Example: Trading on 5-minute? Set HTF to 60 (1-hour) or 15 (15-minute)
What it shows:
HTF indication levels displayed as dashed lines
Blue = HTF Bullish Indication
Purple = HTF Bearish Indication
HTF phase and levels shown in info table
Trading workflow:
Check HTF phase for overall market direction
Wait for HTF correction phase
Drop to lower timeframe to find precise entries
Enter when lower TF shows continuation in alignment with HTF
Best practice: HTF should be 3-4x your trading timeframe for best results
Reversal Entries Toggle:
Default: ON (shows all signal types)
Toggle OFF for more conservative trading (only trend continuation signals)
Recommended: Backtest with both settings to see which works better for your style
New traders should consider disabling reversal entries initially
Volatility-Based Zones:
When enabled, support/resistance zones automatically adjust their height based on ATR (Average True Range).
More volatile = wider zones
Less volatile = tighter zones
Toggle OFF for fixed-width zones
Community Feedback Welcome:
This is an evolving project and your input is valuable! Please share:
Bug reports and issues you encounter
Feature requests and suggestions for improvement
Results from your backtesting and live trading experience
Feedback on the reversal entry feature (too aggressive? working well?)
Ideas for better aligning with the ICC methodology
Perfect for traders learning or implementing the ICC methodology with the benefit of modern automation, multi-timeframe analysis, and flexible entry signal options.

MILLION MEN - Smart ZonesMILLION MEN — Smart Zones
What it is
A smart, structure-based Support/Resistance indicator that automatically anchors dynamic Smart Zones from the latest confirmed swing high and low. It identifies two adaptive regions — the Premium Zone near swing highs and the Discount Zone near swing lows — with an optional 50% equilibrium line for balanced price analysis.
How it works (high-level)
Confirmed swings: Uses ta.pivothigh and ta.pivotlow with adaptive or manual lookback.
Smart pairing: When both recent pivots are confirmed, the script anchors a new pair and builds zones based on that range.
Dynamic zones:
Discount Zone: Bottom portion of the range (e.g., 25%).
Premium Zone: Top portion of the range.
Midline: Optional 50% equilibrium; can extend right.
Lifecycle control:
Zones auto-update as new highs/lows appear.
Option to re-anchor when a new swing pair forms.
Option to auto-expire after a set number of bars for clean charts.
Color scheme:
Green = Discount Zone
Fuchsia = Premium Zone
Gray = Midline
How to use
Works well on 5m–1H for intraday, or 4H–1D for swing.
Use the Discount Zone for long bias setups and the Premium Zone for short bias confirmations.
Combine with your preferred momentum, VWAP, or volume tools for confluence.
Adjust Zone Depth % and Auto-expire depending on your timeframe.
Originality & value
Unlike static S/R indicators, Smart Zones evolve with price structure — re-anchoring on new swing formations while maintaining clarity and balance. Its confirmed-pivot logic avoids repainting and produces professional, non-cluttered charts for precision trading.
Limitations & transparency
Pivots confirm with delay equal to pivot length; this prevents repaint.
Results differ by asset and volatility regime.
Non-standard chart types (Heikin-Ashi, Renko, Range) are not supported.
This script provides analytical guidance, not financial advice.
Smart Structure Breaks & Order BlocksOverview (What it does)
The indicator “Smart Structure Breaks & Order Blocks” detects market structure using swing highs and lows, identifies Break of Structure (BOS) events, and automatically draws order blocks (OBs) from the origin candle. These zones extend to the right and change color/outline when mitigated or invalidated. By formalizing and automating part of discretionary analysis, it provides consistent zone recognition.
Main Components
Swing Detection: ta.pivothigh/ta.pivotlow identify confirmed swing points.
BOS Detection: Determines if the recent swing high/low is broken by close (strict mode) or crossover.
OB Creation: After a BOS, the opposite candle (bearish for bullish BOS, bullish for bearish BOS) is used to generate an order block zone.
Zone Management: Limits the number of zones, extends them to the right, and tracks tagged (mitigated) or invalidated states.
Input Parameters
Left/Right Pivot (default 6/6): Number of bars required on each side to confirm a swing. Higher values = smoother swings.
Max Zones (default 4): Maximum zones stored per direction (bull/bear). Oldest zones are overwritten.
Zone Confirmation Lookback (default 3): Ensures OB origin candle validity by checking recent highs/lows.
Show Swing Points (default ON): Displays triangles on swing highs/lows.
Require close for BOS? (default ON): Strict BOS (close required) vs loose BOS (line crossover).
Use candle body for zones (default OFF): Zones drawn from candle body (ON) or wick (OFF).
Signal Definition & Logic
Swing Updates: Latest confirmed pivots update lastHighLevel / lastLowLevel.
BOS (Break of Structure):
Bullish – close breaks last swing high.
Bearish – close breaks last swing low.
Only one valid BOS per swing (avoids duplicates).
OB Detection:
Bullish BOS → previous bearish candle with lowest low forms the OB.
Bearish BOS → previous bullish candle with highest high forms the OB.
Zones: Bull = green, Bear = red, semi-transparent, extended to the right.
Zone States:
Mitigated: Price touches the zone → border highlighted.
Invalidated:
Bull zone → close below → turns red.
Bear zone → close above → turns green.
Chart Appearance
Swing High: red triangle above bar
Swing Low: green triangle below bar
Bull OB: green zone (border highlighted on touch)
Bear OB: red zone (border highlighted on touch)
Invalid Zones: Bull zones turn reddish, Bear zones turn greenish
Practical Use (Trading Assistance)
Trend Following Entries: Buy pullbacks into green OBs in uptrends, sell rallies into red OBs in downtrends.
Focus on First Touch: First mitigation after BOS often has higher reaction probability.
Confluence: Combine with higher timeframe trend, volume, session levels, key price levels (previous highs/lows, VWAP, etc.).
Stops/Targets:
Bull – stop below zone, partial take profit at swing high or resistance.
Bear – stop above zone, partial take profit at swing low or support.
Parameter Tuning (per market/timeframe)
Pivot (6/6 → 4/4/8/8): Lower for scalping (3–5), medium for day trading (5–8), higher for swing trading (8–14). Increase to reduce noise.
Strict Break: ON to reduce false breaks in ranging markets; OFF for earlier signals.
Body Zones: ON for assets with long wicks, OFF for cleaner OBs in liquid instruments.
Zone Confirmation (default 3): Increase for stricter OB origin, fewer zones.
Max Zones (default 4 → 6–10): Increase for higher volatility, decrease to avoid clutter.
Strengths
Standardizes BOS and OB detection that is usually subjective.
Tracks mitigation and invalidation automatically.
Adaptable: allows body/wick zone switching for different instruments.
Limitations
Pivot-based: Signals appear only after pivots confirm (slight lag).
Zones reflect past balance: Can fail after new events (news, earnings, macro data).
Range-heavy markets: More false BOS; consider stricter settings.
Backtesting: This script is for drawing/visual aid; trading rules must be defined separately.
Workflow Example
Identify higher timeframe trend (4H/Daily).
On lower TF (15–60m), wait for BOS and new OB.
Enter on first mitigation with confirmation candle.
Stop beyond zone; targets based on R multiples and swing points.
FAQ
Q: Why are zones invalidated quickly?
A: Flow reversal after BOS. Adjust pivots higher, enable Strict mode, or switch to Body zones to reduce noise.
Q: What does “tagged” mean?
A: Price touched the zone once = mitigated. Implies some orders in that zone may have been filled.
Q: Body or Wick zones?
A: Wick zones are fine in clean markets. For volatile pairs with long wicks, body zones provide more realistic areas.
Customization Tips (Code perspective)
Zone storage: Currently ring buffer ((idx+1) % zoneLimit). Could prioritize keeping unmitigated zones.
Automated testing: Add strategy.entry/exit for rule-based backtests.
Multi-timeframe: Use request.security() for higher timeframe swings/BOS.
Visualization: Add labels for BOS bars, tag zones with IDs, count touches.
Summary
This indicator formalizes the cycle Swing → BOS → OB creation → Mitigation/Invalidation, providing consistent structure analysis and zone tracking. By tuning sensitivity and strictness, and combining with higher timeframe context, it enhances pullback/continuation trading setups. Always combine with proper risk management.

FibExtender [tradeviZion]FibExtender : A Guide to Identifying Resistance with Fibonacci Levels
Introduction
Fibonacci levels are essential tools in technical analysis, helping traders identify potential resistance and support zones in trending markets. FibExtender is designed to make this analysis accessible to traders at all levels, especially beginners, by automating the process of plotting Fibonacci extensions. With FibExtender, you can visualize potential resistance levels quickly, empowering you to make more informed trading decisions without manually identifying every pivot point. In this article, we’ll explore how FibExtender works, guide you step-by-step in using it, and share insights for both beginner and advanced users.
What is FibExtender ?
FibExtender is an advanced tool that automates Fibonacci extension plotting based on significant pivot points in price movements. Fibonacci extensions are percentages based on prior price swings, often used to forecast potential resistance zones where price might reverse or consolidate. By automatically marking these Fibonacci levels on your chart, FibExtender saves time and reduces the complexity of technical analysis, especially for users unfamiliar with calculating and plotting these levels manually.
FibExtender not only identifies Fibonacci levels but also provides a customizable framework where you can adjust anchor points, colors, and level visibility to suit your trading strategy. This customization allows traders to tailor the indicator to fit different market conditions and personal preferences.
Key Features of FibExtender
FibExtender offers several features to make Fibonacci level analysis easier and more effective. Here are some highlights:
Automated Fibonacci Level Identification : The script automatically detects recent swing lows and pivot points to anchor Fibonacci extensions, allowing you to view potential resistance levels with minimal effort.
Customizable Fibonacci Levels : Users can adjust the specific Fibonacci levels they want to display (e.g., 0.618, 1.0, 1.618), enabling a more focused analysis based on preferred ratios. Each level can be color-coded for visual clarity.
Dual Anchor Points : FibExtender allows you to choose between anchoring levels from either the last pivot low or a recent swing low, depending on your preference. This flexibility helps in aligning Fibonacci levels with key market structures.
Transparency and Visual Hierarchy : FibExtender automatically adjusts the transparency of levels based on their "sequence age," creating a subtle visual hierarchy. Older levels appear slightly faded, helping you focus on more recent, potentially impactful levels.
Connection Lines for Context : FibExtender draws connecting lines from recent lows to pivot highs, allowing users to visualize the price movements that generated each Fibonacci extension level.
Step-by-Step Guide for Beginners
Let’s walk through how to use the FibExtender script on a TradingView chart. This guide will ensure that you’re able to set it up and interpret the key information displayed by the indicator.
Step 1: Adding FibExtender to Your Chart
Open your TradingView chart and select the asset you wish to analyze.
Search for “FibExtender ” in the Indicators section.
Click to add the indicator to your chart, and it will automatically plot Fibonacci levels based on recent pivot points.
Step 2: Customizing Fibonacci Levels
Adjust Levels : Under the "Fibonacci Settings" tab, you can enable or disable specific levels, such as 0.618, 1.0, or 1.618. You can also change the color for each level to improve visibility.
Set Anchor Points : Choose between "Last Pivot Low" and "Recent Swing Low" as your Fibonacci anchor point. If you want a broader view, choose "Recent Swing Low"; if you prefer tighter levels, "Last Pivot Low" may be more suitable.
Fib Line Length : Modify the line length for Fibonacci levels to make them more visible on your chart.
Step 3: Spotting Visual Clusters (Manual Analysis)
Identify Potential Resistance Clusters : Look for areas on your chart where multiple Fibonacci levels appear close together. For example, if you see 1.0, 1.272, and 1.618 levels clustered within a small price range, this may indicate a stronger resistance zone.
Why Clusters Matter : Visual clusters often signify areas where traders expect heightened price reaction. When levels are close, it suggests that resistance may be reinforced by multiple significant ratios, making it harder for price to break through. Use these clusters to anticipate potential pullbacks or consolidation areas.
Step 4: Observing the Price Action Around Fibonacci Levels
As price approaches these identified levels, watch for any slowing momentum or reversal patterns, such as doji candles or bearish engulfing formations, that might confirm resistance.
Adjust Strategy Based on Resistance : If price hesitates or reverses at a clustered resistance zone, it may be a signal to secure profits or tighten stops on a long position.
Advanced Insights (for Intermediate to Advanced Users)
For users interested in the technical workings of FibExtender, this section provides insights into how the indicator functions on a code level.
Pivot Point and Swing Detection
FibExtender uses a pivot-high and pivot-low detection function to identify significant price points. The upFractal and dnFractal variables detect these levels based on recent highs and lows, creating the basis for Fibonacci extension calculations. Here’s an example of the code used for this detection:
// Fractal Calculations
upFractal = ta.pivothigh(n, n)
dnFractal = ta.pivotlow(n, n)
By setting the number of periods for n, users can adjust the sensitivity of the script to recent price swings.
Fibonacci Level Calculation
The following function calculates the Fibonacci levels based on the selected pivot points and applies each level’s specific ratio (e.g., 0.618, 1.618) to project extensions above the recent price swing.
calculateFibExtensions(float startPrice, float highPrice, float retracePrice) =>
fibRange = highPrice - startPrice
var float levels = array.new_float(0)
array.clear(levels)
if array.size(fibLevels) > 0
for i = 0 to array.size(fibLevels) - 1
level = retracePrice + (fibRange * array.get(fibLevels, i))
array.push(levels, level)
levels
This function iterates over each level enabled by the user, calculating extensions by multiplying the price range by the corresponding Fibonacci ratio.
Example Use Case: Identifying Resistance in Microsoft (MSFT)
To better understand how FibExtender highlights resistance, let’s look at Microsoft’s stock chart (MSFT), as shown in the image. The chart displays several Fibonacci levels extending upward from a recent pivot low around $408.17. Here’s how you can interpret the chart:
Clustered Resistance Levels : In the chart, note the grouping of several Fibonacci levels in the range of $450–$470. These levels, particularly when tightly packed, suggest a zone where Microsoft may encounter stronger resistance, as multiple Fibonacci levels signal potential barriers.
Applying Trading Strategies : As price approaches this clustered resistance, traders can watch for weakening momentum. If price begins to stall, it may be wise to lock in profits on long positions or set tighter stop-loss orders.
Observing Momentum Reversals : Look for specific candlestick patterns as price nears these levels, such as bearish engulfing candles or doji patterns. Such patterns can confirm resistance, helping you make informed decisions on whether to exit or manage your position.
Conclusion: Harnessing Fibonacci Extensions with FibExtender
FibExtender is a powerful tool for identifying potential resistance levels without the need for manual Fibonacci calculations. It automates the detection of key swing points and projects Fibonacci extensions, offering traders a straightforward approach to spotting potential resistance zones. For beginners, FibExtender provides a user-friendly gateway to technical analysis, helping you visualize levels where price may react.
For those with a bit more experience, the indicator offers insight into pivot points and Fibonacci calculations, enabling you to fine-tune the analysis for different market conditions. By carefully observing price reactions around clustered levels, users can identify areas of stronger resistance and refine their trade management strategies accordingly.
FibExtender is not just a tool but a framework for disciplined analysis. Using Fibonacci levels for guidance can support your trading decisions, helping you recognize areas where price might struggle or reverse. Integrating FibExtender into your trading strategy can simplify the complexity of Fibonacci extensions and enhance your understanding of resistance dynamics.
Note: Always practice proper risk management and thoroughly test the indicator to ensure it aligns with your trading strategy. Past performance is not indicative of future results.
Trade smarter with TradeVizion—unlock your trading potential today!

---Advanced Harmonic Pattern Scanner v5Summary of the Script:
All Patterns Covered: The script includes all major harmonic patterns: Butterfly, Gartley, Crab, Bat, Cypher, and Three Drives. Both bullish and bearish versions are detected.
ZigZag Swings: The zigzag logic helps find swing points (X, A, B, C, D) which are essential for forming these patterns. You can adjust the zigzagDepth parameter to fine-tune how sensitive the pattern detection is to price swings.
Fibonacci Levels: Each pattern uses specific Fibonacci retracement or extension levels to identify potential patterns, and the script compares price movements to these ratios.
Visual Aid: It uses plotshape() to display detected patterns on the chart and optional line.new() functions to connect the swing points for a better visual representation of the patterns.
How to Customize:
Timeframe: You can run this script on different timeframes by changing the chart on TradingView (1 min, 1 hour, 1 day, etc.).
ZigZag Sensitivity: Adjust the zigzagDepth to refine how frequently swing points are detected. Larger numbers will reduce sensitivity and show fewer but more pronounced patterns.
Pattern Refinement: Modify Fibonacci levels to experiment with custom harmonic patterns or adjust thresholds for the existing ones.
This code is an advanced version and scans the market comprehensively for all major harmonic patterns. Let me know if you need further modifications or explanations!

SVDThis indicator aims to compare between two charts if trader isn't sure which one is more active and powerful, it does NOT show entries or help your chart analysis directly.
The main features of this indicator is to show vitality and range of any given chart.
Volatility: it calculates the average profit of every swing in the range and the final result will be the chart volatility, which indicate how profitable this chart is.
Range: it calculates the profit of the whole range compared to the total price. (E.g. range bottom is 0.1 and range top is 0.2 the range will be 100%)
Extra: indicator shows the total direction of the chart in term of (STRONG UPTREND, UPTREND, SIDEWAYS, DOWNTREND, STRONG DOWNTREND), if you got (Somthing_wrong) please contact me.
How to use: apply the indicator on different charts that you have chosen and the higher (volatility & range) the more profitable the chart is.
inputs:
Lookback length: how long the range is (how many candles are included).
How intense should the Swing be: how many candles should be counted as a confirmation complete swing.
Show counted Swings: if checked as true, will show the swings counted in the volatility calculation.
For any notes on the indicator to be edited, or for another indicator ideas please comment.

TRAPPER TRENDLINES — RSIBuilds dynamic RSI trendlines by connecting the two most recent confirmed RSI swing points (highs→highs for resistance, lows→lows for support). Includes optional channel shading for the 30–70 zone, an RSI moving average, clean break alerts, and simple bullish/bearish divergence alerts versus price.
How it works
RSI pivots: A point on RSI is a swing high/low only if it is the most extreme value compared with a set number of bars on the left and the right (the Pivot Lookback).
RSI trendlines:
Resistance connects the last two confirmed RSI swing highs.
Support connects the last two confirmed RSI swing lows.
Lines can be Full Extend (update into the future) or Pivot Only.
Channel block: Optional fill of the 30–70 range for fast visual context.
Alerts:
Breaks of RSI support/resistance trendlines.
Basic bullish/bearish RSI divergences versus price pivots.
Inputs
RSI
RSI Length: Default 14 (standard).
Pivot Lookback: Bars to the left/right required to confirm an RSI swing.
Overbought / Oversold: 70 / 30 by default.
Line Extension: Full Extend or Pivot Only.
Visuals
Show RSI Moving Average / Signal Length: Optional smoothing line on RSI.
RSI/Signal colors: Customize plot colors.
Show 30–70 Channel Block: Toggle the middle-zone fill.
Tint pane background when RSI in channel: Optional subtle background when RSI is between OB/OS.
Divergences & Alerts
Enable RSI TL Break Alerts: Alert conditions for RSI line breaks.
Enable Divergence Alerts: Bullish/Bearish divergence alerts versus price.
Pairing with price for confluence/divergence
For accurate confluence and clearer divergences, align this RSI tool with your price trendline tool (for example, TRAPPER TRENDLINES — PRICE):
Set RSI Pivot Lookback equal to the Pivot Left/Right size used on price.
Example: Price uses Pivot Left = 50 and Pivot Right = 50 → set RSI Pivot Lookback = 50.
Keep RSI Length = 14 and OB/OS = 70/30 unless you have a specific edge.
Interpretation:
Confluence: Price reacts at its trendline while RSI reacts at its own line in the same direction.
Divergence: Price makes a higher high while RSI makes a lower high (bearish), or price makes a lower low while RSI makes a higher low (bullish), using matched pivot windows.
Suggested settings
Higher timeframes (4H / 1D / 1W): Pivot Lookback = 50; optional RSI MA length 14; channel block ON.
Intraday (15m / 30m / 1H): Pivot Lookback = 30; optional RSI MA length 14.
Always mirror your price pivot size to this RSI Pivot Lookback for consistent swings.
Reading the signals
RSI trendline touch/hold: Momentum reacting at structure; look for confluence with price levels.
RSI Trendline Break Up / Down: Momentum shift; consider price structure and retests.
Bullish/Bearish Divergence: Confirm only when pivots are matched and the new swing is confirmed.
Notes & limitations
Pivots require future bars to confirm by design; trendlines update as new swings confirm.
Divergence logic compares RSI pivots to price pivots with the same lookback; mismatched windows can produce false positives.
No strategy entries/exits or performance claims are provided. This is an analytical tool.
Alerts (titles/messages)
RSI: Trendline Break Up — “RSI broke falling resistance line.”
RSI: Trendline Break Down — “RSI broke rising support line.”
RSI: Bullish Divergence — “Bullish RSI divergence confirmed.”
RSI: Bearish Divergence — “Bearish RSI divergence confirmed.”
Quick start
Add the indicator to a separate pane.
Set Pivot Lookback to match your price tool’s pivot size (e.g., 50).
Optionally toggle the RSI MA and Channel Block for clarity.
Enable alerts if you want notifications on RSI line breaks and divergences.
Use with TRAPPER TRENDLINES — PRICE or any price-based trendline tool for confluence/divergence analysis.
Compliance
This script is for educational purposes only and does not constitute financial advice. Trading involves risk. Past performance does not guarantee future results. No performance claims are made.

Sylvain Zig-Zag [MyTradingCoder]This Pine Script version of ZigZagHighLow is a faithful port of Sylvain Vervoort's original study, initially implemented in NinjaScript and later added to the thinkorswim standard library. This indicator identifies and connects swing points in price data, offering a clear visualization of market moves that exceed a specified threshold. Additionally, it now includes features for detecting and plotting support and resistance levels, enhancing its utility for technical analysis.
Overview
The Sylvain Zig-Zag study excels at highlighting significant price swings by plotting points where the price change, combined with volatility adjustments via the Average True Range (ATR), exceeds a user-defined percentage. It effectively smooths out minor fluctuations, allowing traders to focus on the primary market trends. This tool is particularly useful in identifying potential turning points, trends in price movements, and key support and resistance levels, making it a valuable addition to your technical analysis arsenal.
How It Works
The Sylvain Zig-Zag indicator works by detecting swing points in the price data and connecting them to form a zigzag pattern. A swing point is identified when the price moves a certain distance, defined by a combination of percentage change and ATR. This distance must be exceeded for a swing point to be plotted.
When the price moves upwards and exceeds the previous high by a specified percentage plus a factor of the ATR, a new high swing point is plotted. Conversely, a low swing point is plotted when the price moves downwards and exceeds the previous low by the same criteria. This ensures that only significant price moves are considered, filtering out minor fluctuations and providing a clear view of the overall market trend.
In addition to plotting zigzag lines, the indicator can now identify and draw support and resistance levels based on the detected swing points. These levels are crucial for identifying potential reversal areas and market structure.
Key Features
Swing Point Detection: Accurately identifies significant price swings by considering both percentage price change and volatility (via Average True Range).
Dynamic Support/Resistance: Automatically generates support and resistance lines based on the identified swing points, providing potential areas of price reversals.
Customizable Parameters: Tailor the indicator's sensitivity to your preferred trading style and market conditions. Adjust parameters like percentage reversal, ATR settings, and absolute/tick reversals.
Visual Clarity: Choose to display the ZigZag line, support/resistance levels, new trend icons, continuation icons, and even customize bar colors for easy visual analysis.
Trading Applications
Trend Identification: Easily visualize the prevailing market trend using the direction of the ZigZag line and support/resistance levels.
Entry/Exit Signals: Potential entry points can be identified when the price interacts with the dynamic support/resistance levels.
Stop-Loss Placement: Use recent swing points as logical places for setting stop-loss orders.
Profit Targets: Project potential price targets based on the distance between previous swing points.
Input Parameters
Several input parameters can be adjusted to customize the behavior of the Sylvain Zig-Zag indicator. These parameters allow traders to fine-tune the detection of swing points and support/resistance levels to better suit their trading strategy and the specific market conditions they are analyzing.
High Source and Low Source:
These inputs define the price points used for detecting high and low swing points, respectively. You can choose between high, low, open, or close prices for these calculations.
Percentage Reversal:
This input sets the minimum percentage change in price required for a swing to be detected. A higher percentage value will result in fewer but more significant swing points, while a lower value will detect more frequent, smaller swings.
Absolute Reversal:
This parameter allows for an additional fixed value to be added to the minimum price change and ATR change. This can be useful for increasing the distance between swing points in volatile markets.
ATR Length:
This input defines the period used for calculating the ATR, which is a measure of market volatility. A longer ATR period will smooth out the ATR calculation, while a shorter period will make it more sensitive to recent price changes.
ATR Multiplier:
This factor is applied to the ATR value to adjust the sensitivity of the swing point detection. A higher multiplier will increase the required price movement for a swing point to be plotted, reducing the number of detected swings.
Tick Reversal:
This input allows for an additional value in ticks to be added to the minimum price change and ATR change, providing further customization in the swing point detection process.
Support and Resistance:
Show S/R: Enable or disable the plotting of support and resistance levels.
Max S/R Levels: Set the maximum number of support and resistance levels to display.
S/R Line Width: Adjust the width of the support and resistance lines.
Visual Settings
The Sylvain Zig-Zag indicator also includes visual settings to enhance the clarity of the plotted swing points and trends. You can customize the color and width of the zigzag line, and enable icons to indicate new trends and continuation patterns. Additionally, the bars can be colored based on the detected trend, aiding in quick visual analysis.
Conclusion
This port of the ZigZagHighLow study from NinjaScript to Pine Script preserves the essence of Sylvain Vervoort’s methodology while adding new features for support and resistance. It provides traders with a powerful tool for technical analysis. The combination of price changes and ATR ensures that you have a robust and adaptable tool for identifying key market movements and structural levels. Customize the settings to match your trading style and gain a clearer picture of market trends, turning points, and support/resistance areas. Enjoy improved market analysis and more informed trading decisions with the Sylvain Zig-Zag indicator.

Smart Money Concepts by WeloTradesThe "Smart Money Concepts by WeloTrades" indicator is designed to offer traders a comprehensive tool that integrates multiple advanced features to aid in market analysis. By combining order blocks, liquidity levels, fair value gaps, trendlines, and market structure analysis, the indicator provides a holistic approach to understanding market dynamics and making informed trading decisions.
Components and Their Integration:
Order Blocks and Breaker Blocks Detection
Functionality: Order blocks represent areas where significant buying or selling occurred, creating potential support or resistance zones. Breaker blocks signal potential reversals.
Integration: By detecting and visualizing these blocks, the indicator helps traders identify key levels where price might react, aiding in entry and exit decisions. The customizable settings allow traders to adjust the visibility and parameters to suit their specific trading strategy.
Liquidity Levels Analysis
Functionality: Liquidity levels indicate zones where significant price movements can occur due to the presence of large orders. These are areas where smart money might be executing trades.
Integration: By tracking these high-probability liquidity areas, traders can anticipate potential price movements. Customizable display limits and mitigation strategies ensure that the information is tailored to the trader’s needs, providing precise and actionable insights.
Fair Value Gaps (FVG)
Functionality: Fair value gaps highlight areas where there is an imbalance between buyers and sellers. These gaps often represent potential trading opportunities.
Integration: The ability to identify and analyze FVGs helps traders spot potential entries based on market inefficiencies. The touch and break detection functionalities provide further refinement, enhancing the precision of trading signals.
Trendlines
Functionality: Trendlines help in identifying the direction of the market and potential reversal points. The additional trendline adds a layer of confirmation for breaks or retests.
Integration: Automatically drawn trendlines assist traders in visualizing market trends and making decisions about potential entries and exits. The additional trendline for stronger confirmation reduces the risk of false signals, providing more reliable trading opportunities.
Market Structure Analysis
Functionality: Understanding market structure is crucial for identifying key support and resistance levels and overall market dynamics. This component displays internal, external, and composite market structures.
Integration: By automatically highlighting shifts in market structure, the indicator helps traders recognize important levels and potential changes in market direction. This analysis is critical for strategic planning and execution in trading.
Customizable Alerts
Functionality: Alerts ensure that traders do not miss significant market events, such as the formation or breach of order blocks, liquidity levels, and trendline interactions.
Integration: Customizable alerts enhance the user experience by providing timely notifications of key events. This feature ensures that traders can act quickly and efficiently, leveraging the insights provided by the indicator.
Interactive Visualization
Functionality: Customizable visual aspects of the indicator allow traders to tailor the display to their preferences and trading style.
Integration: This feature enhances user engagement and usability, making it easier for traders to interpret the data and make informed decisions. Personalization options like colors, styles, and display formats improve the overall effectiveness of the indicator.
How Components Work Together
Comprehensive Market Analysis
Each component of the indicator addresses a different aspect of market analysis. Order blocks and liquidity levels highlight potential support and resistance zones, while fair value gaps and trendlines provide additional context for potential entries and exits. Market structure analysis ties everything together by offering a broad view of market dynamics.
Synergistic Insights
The integration of multiple features allows for cross-validation of trading signals. For instance, an order block coinciding with a high-probability liquidity level and a fair value gap can provide a stronger signal than any of these features alone. This synergy enhances the reliability of the insights and trading signals generated by the indicator.
Enhanced Decision Making
By combining these advanced features into a single tool, traders are equipped with a powerful resource for making informed decisions. The customizable alerts and interactive visualization further support this by ensuring that traders can act quickly on the insights provided.
Order Blocks ( OB) & Breaker Blocks (BB) Visuals:
📝 OB Input Settings
📊 Timeframe #1
TF #1🕑: Enable or disable Timeframe 1.
What it is: A boolean input to toggle the use of the first timeframe.
What it does: Enables or disables Timeframe 1 for the OB settings.
How to use it: Check or uncheck the box to enable or disable.
📊 Timeframe 1 Selection
Timeframe #1🕑: Select the timeframe for Timeframe 1.
What it is: A dropdown to select the desired timeframe.
What it does: Sets the timeframe for Timeframe 1.
How to use it: Choose a timeframe from the dropdown list.
📊 Timeframe #2
TF #2🕑: Enable or disable Timeframe 2.
What it is: A boolean input to toggle the use of the second timeframe.
What it does: Enables or disables Timeframe 2 for the OB settings.
How to use it: Check or uncheck the box to enable or disable.
📊 Timeframe 2 Selection
Timeframe #2🕑: Select the timeframe for Timeframe 2.
What it is: A dropdown to select the desired timeframe.
What it does: Sets the timeframe for Timeframe 2.
How to use it: Choose a timeframe from the dropdown list.
Additional Info: Higher TF Chart & Lower TF Setting / Lower TF Chart & Higher TF Setting.
📏 Show OBs
OB (Length)📏: Toggle the display of Order Blocks.
What it is: A boolean input to enable or disable the display of Order Blocks.
What it does: Shows or hides Order Blocks based on the selected swing length.
How to use it: Check or uncheck the box to enable or disable.
📏 Swing Length Option
Swing Length Option: Select the swing length option.
What it is: A dropdown to choose between SHORT, MID, LONG, or CUSTOM.
What it does: Sets the length of swings for Order Blocks.
How to use it: Choose an option from the dropdown.
Additional Info: Default lengths are SHORT=10, MID=28, LONG=50.
🔧 Custom Swing Length
🔧custom: Specify a custom swing length.
What it is: An integer input for setting a custom swing length.
What it does: Overrides the default swing lengths if set to CUSTOM.
How to use it: Enter a custom integer value (only shown when CUSTOM is selected).
📛 Show BBs
BB (Method)📛: Toggle the display of Breaker Blocks.
What it is: A boolean input to enable or disable the display of Breaker Blocks.
What it does: Shows or hides Breaker Blocks.
How to use it: Check or uncheck the box to enable or disable.
📛 OB End Method
OB End Method: Select the method for determining the end of a Breaker Block.
What it is: A dropdown to choose between Wick and Close.
What it does: Sets the criteria for when a Breaker Block is considered mitigated.
How to use it: Choose an option from the dropdown.
Additional Info: Wicks: OB is mitigated when the price wicks through the OB Level. Close: OB is mitigated when the closing price is within the OB Level.
🔍 Max Bullish Zones
🔍Max Bullish: Set the maximum number of Bullish Order Blocks to display.
What it is: A dropdown to select the maximum number of Bullish Order Blocks.
What it does: Limits the number of Bullish Order Blocks shown on the chart.
How to use it: Choose a value from the dropdown (1-10).
🔍 Max Bearish Zones
🔍Max Bearish: Set the maximum number of Bearish Order Blocks to display.
What it is: A dropdown to select the maximum number of Bearish Order Blocks.
What it does: Limits the number of Bearish Order Blocks shown on the chart.
How to use it: Choose a value from the dropdown (1-10).
🟩 Bullish OB Color
Bullish OB Color: Set the color for Bullish Order Blocks.
What it is: A color picker to set the color of Bullish Order Blocks.
What it does: Changes the color of Bullish Order Blocks on the chart.
How to use it: Select a color from the color picker.
🟥 Bearish OB Color
Bearish OB Color: Set the color for Bearish Order Blocks.
What it is: A color picker to set the color of Bearish Order Blocks.
What it does: Changes the color of Bearish Order Blocks on the chart.
How to use it: Select a color from the color picker.
🔧 OB & BB Range
↔ OB & BB Range: Select the range option for OB and BB.
What it is: A dropdown to choose between RANGE and CUSTOM.
What it does: Sets how far the OB or BB should extend.
How to use it: Choose an option from the dropdown.
Additional Info: RANGE = Current price, CUSTOM = Adjustable Range.
🔧 Custom OB & BB Range
🔧Custom: Specify a custom range for OB and BB.
What it is: An integer input for setting a custom range.
What it does: Defines how far the OB or BB should go, based on a custom value.
How to use it: Enter a custom integer value (range: 1000-500000).
💬 Text Options
💬Text Options: Set text size and color for OB and BB.
What it is: A dropdown to select text size and a color picker to choose text color.
What it does: Changes the size and color of the text displayed for OB and BB.
How to use it: Select a size from the dropdown and a color from the color picker.
💬 Show Timeframe OB
Text: Toggle to display the timeframe of OB.
What it is: A boolean input to show or hide the timeframe text for OB.
What it does: Displays the timeframe information for Order Blocks on the chart.
How to use it: Check or uncheck the box to enable or disable.
💬 Show Volume
Volume: Toggle to display the volume of OB.
What it is: A boolean input to show or hide the volume information for Order Blocks.
What it does: Displays the volume information for Order Blocks on the chart.
How to use it: Check or uncheck the box to enable or disable.
Additional Info:
What it represents: The volume displayed represents the total trading volume that occurred during the formation of the Order Block. This can indicate the level of participation or interest in that price level.
How it's calculated: The volume is the sum of all traded volumes within the candles that form the Order Block.
What it means: Higher volume at an Order Block level may suggest stronger support or resistance. It shows the amount of trading activity and can be an indicator of the potential strength or validity of the Order Block.
Why it's shown: To give traders an idea of the market participation and to help assess the strength of the Order Block.
💬 Show Percentage
%: Toggle to display the percentage of OB.
What it is: A boolean input to show or hide the percentage information for Order Blocks.
What it does: Displays the percentage information for Order Blocks on the chart.
How to use it: Check or uncheck the box to enable or disable.
Additional Info:
What it represents: The percentage displayed usually represents the proportion of price movement relative to the Order Block.
How it's calculated: This can be the percentage move from the start to the end of the Order Block or the retracement level that price has reached relative to the Order Block's range.
What it means: It helps traders understand the extent of price movement within the Order Block and can indicate the significance of the price level.
Why it's shown: To provide a clearer understanding of the price dynamics and the importance of the Order Block within the overall price movement.
Additional Information
Volume Example: If an Order Block forms over three candles with volumes of 100, 150, and 200, the total volume displayed for that Order Block would be 450.
Percentage Example: If the price moves from 100 to 110 within an Order Block, and the total range of the Order Block is from 100 to 120, the percentage shown might be 50% (since the price has moved halfway through the Order Block's range).
Liquidity Levels visuals:
📊 Liquidity Levels Input Settings
📊 Current Timeframe
TF #1🕑: Enable or disable the current timeframe.
What it is: A boolean input to toggle the use of the current timeframe.
What it does: Enables or disables the display of liquidity levels for the current timeframe.
How to use it: Check or uncheck the box to enable or disable.
📊 Higher Timeframe
Higher Timeframe: Select the higher timeframe for liquidity levels.
What it is: A dropdown to select the desired higher timeframe.
What it does: Sets the higher timeframe for liquidity levels.
How to use it: Choose a timeframe from the dropdown list.
📏 Liquidity Length Option
📏Liquidity Length: Select the length for liquidity levels.
What it is: A dropdown to choose between SHORT, MID, LONG, or CUSTOM.
What it does: Sets the length of swings for liquidity levels.
How to use it: Choose an option from the dropdown.
Additional Info: Default lengths are SHORT=10, MID=28, LONG=50.
🔧 Custom Liquidity Length
🔧custom: Specify a custom length for liquidity levels.
What it is: An integer input for setting a custom swing length.
What it does: Overrides the default liquidity lengths if set to CUSTOM.
How to use it: Enter a custom integer value (only shown when CUSTOM is selected).
📛 Mitigation Method
📛Mitigation (Method): Select the method for determining the mitigation of liquidity levels.
What it is: A dropdown to choose between Close and Wick.
What it does: Sets the criteria for when a liquidity level is considered mitigated.
How to use it: Choose an option from the dropdown.
Additional Info:
Wick: Level is mitigated when the price wicks through the level.
Close: Level is mitigated when the closing price is within the level.
📛 Display Mitigated Levels
-: Select to display or hide mitigated levels.
What it is: A dropdown to choose between Remove and Show.
What it does: Displays or hides mitigated liquidity levels.
How to use it: Choose an option from the dropdown.
Additional Info:
Remove: Hide mitigated levels.
Show: Display mitigated levels.
🔍 Max Buy Side Liquidity
🔍Max Buy Side Liquidity: Set the maximum number of Buy Side Liquidity Levels to display.
What it is: An integer input to set the maximum number of Buy Side Liquidity Levels.
What it does: Limits the number of Buy Side Liquidity Levels shown on the chart.
How to use it: Enter a value between 0 and 50.
🟦 Buy Side Liquidity Color
Buy Side Liquidity Color: Set the color for Buy Side Liquidity Levels.
What it is: A color picker to set the color of Buy Side Liquidity Levels.
What it does: Changes the color of Buy Side Liquidity Levels on the chart.
How to use it: Select a color from the color picker.
Additional Info:
Tooltip: Set the maximum number of Buy Side Liquidity Levels to display. Default: 5, Min: 1, Max: 50.
If liquidity levels are not displayed as expected, try increasing the max count.
🔍 Max Sell Side Liquidity
🔍Max Sell Side Liquidity: Set the maximum number of Sell Side Liquidity Levels to display.
What it is: An integer input to set the maximum number of Sell Side Liquidity Levels.
What it does: Limits the number of Sell Side Liquidity Levels shown on the chart.
How to use it: Enter a value between 0 and 50.
🟥 Sell Side Liquidity Color
Sell Side Liquidity Color: Set the color for Sell Side Liquidity Levels.
What it is: A color picker to set the color of Sell Side Liquidity Levels.
What it does: Changes the color of Sell Side Liquidity Levels on the chart.
How to use it: Select a color from the color picker.
Additional Info:
Tooltip: Set the maximum number of Sell Side Liquidity Levels to display. Default: 5, Min: 1, Max: 50.
If liquidity levels are not displayed as expected, try increasing the max count.
✂ Box Style (Height)
✂ Box Style (↕): Set the box height style for liquidity levels.
What it is: A float input to set the height of the boxes.
What it does: Adjusts the height of the boxes displaying liquidity levels.
How to use it: Enter a value between -50 and 50.
Additional Info: Default value is -5.
📏 Box Length
b: Set the box length of liquidity levels.
What it is: An integer input to set the length of the boxes.
What it does: Adjusts the length of the boxes displaying liquidity levels.
How to use it: Enter a value between 0 and 500.
Additional Info: Default value is 20.
⏭ Extend Liquidity Levels
Extend ⏭: Toggle to extend liquidity levels beyond the current range.
What it is: A boolean input to enable or disable the extension of liquidity levels.
What it does: Extends liquidity levels beyond their default range.
How to use it: Check or uncheck the box to enable or disable.
Additional Info: Extend liquidity levels beyond the current range.
💬 Text Options
💬 Text Options: Set text size and color for liquidity levels.
What it is: A dropdown to select text size and a color picker to choose text color.
What it does: Changes the size and color of the text displayed for liquidity levels.
How to use it: Select a size from the dropdown and a color from the color picker.
💬 Show Text
Text: Toggle to display text for liquidity levels.
What it is: A boolean input to show or hide the text for liquidity levels.
What it does: Displays the text information for liquidity levels on the chart.
How to use it: Check or uncheck the box to enable or disable.
💬 Show Volume
Volume: Toggle to display the volume of liquidity levels.
What it is: A boolean input to show or hide the volume information for liquidity levels.
What it does: Displays the volume information for liquidity levels on the chart.
How to use it: Check or uncheck the box to enable or disable.
Additional Info:
What it represents: The volume displayed represents the total trading volume that occurred during the formation of the liquidity level. This can indicate the level of participation or interest in that price level.
How it's calculated: The volume is the sum of all traded volumes within the candles that form the liquidity level.
What it means: Higher volume at a liquidity level may suggest stronger support or resistance. It shows the amount of trading activity and can be an indicator of the potential strength or validity of the liquidity level.
Why it's shown: To give traders an idea of the market participation and to help assess the strength of the liquidity level.
💬 Show Percentage
%: Toggle to display the percentage of liquidity levels.
What it is: A boolean input to show or hide the percentage information for liquidity levels.
What it does: Displays the percentage information for liquidity levels on the chart.
How to use it: Check or uncheck the box to enable or disable.
Additional Info:
What it represents: The percentage displayed usually represents the proportion of price movement relative to the liquidity level.
How it's calculated: This can be the percentage move from the start to the end of the liquidity level or the retracement level that price has reached relative to the liquidity level's range.
What it means: It helps traders understand the extent of price movement within the liquidity level and can indicate the significance of the price level.
Why it's shown: To provide a clearer understanding of the price dynamics and the importance of the liquidity level within the overall price movement.
Fair Value Gaps visuals:
📊 Fair Value Gaps Input Settings
📊 Show FVG
TF #1🕑: Enable or disable Fair Value Gaps for Timeframe 1.
What it is: A boolean input to toggle the display of Fair Value Gaps.
What it does: Shows or hides Fair Value Gaps on the chart.
How to use it: Check or uncheck the box to enable or disable.
📊 Select Timeframe
Timeframe: Select the timeframe for Fair Value Gaps.
What it is: A dropdown to select the desired timeframe.
What it does: Sets the timeframe for Fair Value Gaps.
How to use it: Choose a timeframe from the dropdown list.
Additional Info: Higher TF Chart & Lower TF Setting or Lower TF Chart & Higher TF Setting.
📛 FVG Break Method
📛FVG Break (Method): Select the method for determining when an FVG is mitigated.
What it is: A dropdown to choose between Touch, Wicks, Close, or Average.
What it does: Sets the criteria for when a Fair Value Gap is considered mitigated.
How to use it: Choose an option from the dropdown.
Additional Info:
Touch: FVG is mitigated when the price touches the gap.
Wicks: FVG is mitigated when the price wicks through the gap.
Close: FVG is mitigated when the closing price is within the gap.
Average: FVG is mitigated when the average price (average of high and low) is within the gap.
📛 Show Mitigated FVG
show: Toggle to display mitigated FVGs.
What it is: A boolean input to show or hide mitigated Fair Value Gaps.
What it does: Displays or hides mitigated Fair Value Gaps.
How to use it: Check or uncheck the box to enable or disable.
📛 Fill FVG
Fill: Toggle to fill Fair Value Gaps.
What it is: A boolean input to fill the Fair Value Gaps with color.
What it does: Adds a color fill to the Fair Value Gaps.
How to use it: Check or uncheck the box to enable or disable.
📛 Shade FVG
Shade: Toggle to shade Fair Value Gaps.
What it is: A boolean input to shade the Fair Value Gaps.
What it does: Adds a shade effect to the Fair Value Gaps.
How to use it: Check or uncheck the box to enable or disable.
Additional Info: Select the method to break FVGs and toggle the visibility of FVG Breaks (fill FVG and/or shade FVG).
🔍 Max Bullish FVG
🔍Max Bullish FVG: Set the maximum number of Bullish Fair Value Gaps to display.
What it is: An integer input to set the maximum number of Bullish Fair Value Gaps.
What it does: Limits the number of Bullish Fair Value Gaps shown on the chart.
How to use it: Enter a value between 0 and 50.
🔍 Max Bearish FVG
🔍Max Bearish FVG: Set the maximum number of Bearish Fair Value Gaps to display.
What it is: An integer input to set the maximum number of Bearish Fair Value Gaps.
What it does: Limits the number of Bearish Fair Value Gaps shown on the chart.
How to use it: Enter a value between 0 and 50.
🟥 Bearish FVG Color
Bearish FVG Color: Set the color for Bearish Fair Value Gaps.
What it is: A color picker to set the color of Bearish Fair Value Gaps.
What it does: Changes the color of Bearish Fair Value Gaps on the chart.
How to use it: Select a color from the color picker.
Additional Info:
Tooltip: Set the maximum number of Bearish Fair Value Gaps to display. Default: 5, Min: 1, Max: 50.
If Fair Value Gaps are not displayed as expected, try increasing the max count.
🟦 Bullish FVG Color
Bullish FVG Color: Set the color for Bullish Fair Value Gaps.
What it is: A color picker to set the color of Bullish Fair Value Gaps.
What it does: Changes the color of Bullish Fair Value Gaps on the chart.
How to use it: Select a color from the color picker.
Additional Info:
Tooltip: Set the maximum number of Bullish Fair Value Gaps to display. Default: 5, Min: 1, Max: 50.
If Fair Value Gaps are not displayed as expected, try increasing the max count.
📏 FVG Range
↔ FVG Range: Set the range for Fair Value Gaps.
What it is: An integer input to set the range of the Fair Value Gaps.
What it does: Adjusts the range of the Fair Value Gaps displayed.
How to use it: Enter a value between 0 and 100.
Additional Info: Adjustable length only works when both RANGE & EXTEND display OFF. Range=current price, Extend=Full Range.
⏭ Extend FVG
Extend⏭: Toggle to extend Fair Value Gaps beyond the current range.
What it is: A boolean input to enable or disable the extension of Fair Value Gaps.
What it does: Extends Fair Value Gaps beyond their default range.
How to use it: Check or uncheck the box to enable or disable.
⏯ FVG Range
Range⏯: Toggle the range of Fair Value Gaps.
What it is: A boolean input to enable or disable the range display for Fair Value Gaps.
What it does: Sets the range of Fair Value Gaps displayed.
How to use it: Check or uncheck the box to enable or disable.
↕ Max Width
↕ Max Width: Set the maximum width of Fair Value Gaps.
What it is: A float input to set the maximum width of Fair Value Gaps.
What it does: Limits the width of Fair Value Gaps as a percentage of the price range.
How to use it: Enter a value between 0 and 5.0.
Additional Info: FVGs wider than this value will be ignored.
♻ Filter FVG
Filter FVG ♻: Toggle to filter out small Fair Value Gaps.
What it is: A boolean input to filter out small Fair Value Gaps.
What it does: Ignores Fair Value Gaps smaller than the specified max width.
How to use it: Check or uncheck the box to enable or disable.
➖ Mid Line Style
➖Mid Line Style: Select the style of the mid line for Fair Value Gaps.
What it is: A dropdown to choose between Solid, Dashed, or Dotted.
What it does: Sets the style of the mid line within Fair Value Gaps.
How to use it: Choose an option from the dropdown.
🎨 Mid Line Color
Mid Line Color: Set the color for the mid line within Fair Value Gaps.
What it is: A color picker to set the color of the mid line.
What it does: Changes the color of the mid line within Fair Value Gaps.
How to use it: Select a color from the color picker.
Additional Information
Mitigation Methods: Each method (Touch, Wicks, Close, Average) provides different criteria for when a Fair Value Gap is considered mitigated, helping traders to understand the dynamics of price movements within gaps.
Volume and Percentage: Displaying volume and percentage information for Fair Value Gaps helps traders gauge the strength and significance of these gaps in relation to trading activity and price movements.
Trendlines visuals:
📊 Trendlines Input Settings
📊 Show Trendlines
Trendlines & Trendlines Difference(%) ↕: Enable or disable trendlines and set the percentage difference from the first trendline.
What it is: A boolean input to toggle the display of trendlines.
What it does: Shows or hides trendlines on the chart and allows setting a percentage difference from the first trendline.
How to use it: Check or uncheck the box to enable or disable.
Additional Info: The percentage difference determines the distance of the second trendline from the first one.
📏 Trendline Length Option
📏Trendline Length: Select the length for trendlines.
What it is: A dropdown to choose between SHORT, MID, LONG, or CUSTOM.
What it does: Sets the length of trendlines.
How to use it: Choose an option from the dropdown.
Additional Info: Default lengths are SHORT=50, MID=100, LONG=200.
🔧 Custom Trendline Length
🔧custom: Specify a custom length for trendlines.
What it is: An integer input for setting a custom trendline length.
What it does: Overrides the default trendline lengths if set to CUSTOM.
How to use it: Enter a custom integer value (only shown when CUSTOM is selected).
🔍 Max Bearish Trendlines
🔍Max Trendlines Bearish: Set the maximum number of bearish trendlines to display.
What it is: A dropdown to select the maximum number of bearish trendlines.
What it does: Limits the number of bearish trendlines shown on the chart.
How to use it: Choose a value from the dropdown (2-20).
🟩 Bearish Trendline Color
Bearish Trendline Color: Set the color for bearish trendlines.
What it is: A color picker to set the color of bearish trendlines.
What it does: Changes the color of bearish trendlines on the chart.
How to use it: Select a color from the color picker.
Additional Info: Adjust to control how many bearish trendlines are displayed.
🔍 Max Bullish Trendlines
🔍Max Trendlines Bullish: Set the maximum number of bullish trendlines to display.
What it is: A dropdown to select the maximum number of bullish trendlines.
What it does: Limits the number of bullish trendlines shown on the chart.
How to use it: Choose a value from the dropdown (2-20).
🟥 Bullish Trendline Color
Bullish Trendline Color: Set the color for bullish trendlines.
What it is: A color picker to set the color of bullish trendlines.
What it does: Changes the color of bullish trendlines on the chart.
How to use it: Select a color from the color picker.
Additional Info: Adjust to control how many bullish trendlines are displayed.
📐 Degrees Text
📐Degrees ° (💬 Size): Enable or disable degrees text and set its size and color.
What it is: A boolean input to show or hide the degrees text for trendlines.
What it does: Displays the degrees text for trendlines.
How to use it: Check or uncheck the box to enable or disable.
📏 Text Size for Degrees
Text Size: Set the text size for degrees on trendlines.
What it is: A dropdown to select the size of the degrees text.
What it does: Changes the size of the degrees text displayed for trendlines.
How to use it: Choose a size from the dropdown (XS, S, M, L, XL).
🎨 Degrees Text Color
Degrees Text Color: Set the color for the degrees text on trendlines.
What it is: A color picker to set the color of the degrees text.
What it does: Changes the color of the degrees text on the chart.
How to use it: Select a color from the color picker.
♻ Filter Degrees
♻ Filter Degrees °: Enable or disable angle filtering and set the angle range.
What it is: A boolean input to filter trendlines by their angle.
What it does: Shows only trendlines within a specified angle range.
How to use it: Check or uncheck the box to enable or disable.
Additional Info: Angles outside this range will be filtered out.
🔢 Angle Range
Angle Range: Set the angle range for filtering trendlines.
What it is: Two float inputs to set the minimum and maximum angle for trendlines.
What it does: Defines the range of angles for which trendlines will be shown.
How to use it: Enter values for the minimum and maximum angles.
➖ Line Style
➖Style #1 & #2: Select the style of the primary and secondary trendlines.
What it is: Two dropdowns to choose between Solid, Dashed, or Dotted for the trendlines.
What it does: Sets the style of the primary and secondary trendlines.
How to use it: Choose a style from each dropdown.
📏 Line Thickness
: Set the thickness for the trendlines.
What it is: An integer input to set the thickness of the trendlines.
What it does: Adjusts the thickness of the trendlines displayed on the chart.
How to use it: Enter a value between 1 and 5.
Additional Information
Trendline Percentage Difference: Setting a percentage difference helps in analyzing the relative position and angle of trendlines.
Filtering by Angle: This feature allows focusing on trendlines within a specific angle range, enhancing the clarity of trend analysis.
BOS & CHOCH Market Structure visuals:
📊 BOS & CHOCH Market Structure Input Settings
📏 Market Structure Length Option
📏Market Structure: Select the market structure length option.
What it is: A dropdown to choose between INTERNAL, EXTERNAL, ALL, CUSTOM, or NONE.
What it does: Sets the type of market structure to be displayed.
How to use it: Choose an option from the dropdown.
Additional Info:
INTERNAL: Only internal structure.
EXTERNAL: Only external structure.
ALL: Both internal and external structures.
CUSTOM: Custom lengths.
NONE: No structure.
🔧 Custom Internal Length
🔧Custom Internal: Specify a custom length for internal market structure.
What it is: An integer input for setting a custom internal length.
What it does: Defines the length of internal market structures if CUSTOM is selected.
How to use it: Enter a custom integer value (only shown when CUSTOM is selected).
💬 Internal Label Size
💬Internal Label Size: Set the label size for internal market structures.
What it is: A dropdown to select the size of the labels.
What it does: Changes the size of the labels for internal market structures.
How to use it: Choose a size from the dropdown (XS, S, M, L, XL).
🟩 Internal Bullish Color
Internal Bullish Color: Set the color for bullish internal market structures.
What it is: A color picker to set the color of bullish internal market structures.
What it does: Changes the color of bullish internal market structures on the chart.
How to use it: Select a color from the color picker.
🟥 Internal Bearish Color
Internal Bearish Color: Set the color for bearish internal market structures.
What it is: A color picker to set the color of bearish internal market structures.
What it does: Changes the color of bearish internal market structures on the chart.
How to use it: Select a color from the color picker.
🔧 Custom External Length
🔧Custom External: Specify a custom length for external market structure.
What it is: An integer input for setting a custom external length.
What it does: Defines the length of external market structures if CUSTOM is selected.
How to use it: Enter a custom integer value (only shown when CUSTOM is selected).
💬 External Label Size
💬External Label Size: Set the label size for external market structures.
What it is: A dropdown to select the size of the labels.
What it does: Changes the size of the labels for external market structures.
How to use it: Choose a size from the dropdown (XS, S, M, L, XL).
🟩 External Bullish Color
External Bullish Color: Set the color for bullish external market structures.
What it is: A color picker to set the color of bullish external market structures.
What it does: Changes the color of bullish external market structures on the chart.
How to use it: Select a color from the color picker.
🟥 External Bearish Color
External Bearish Color: Set the color for bearish external market structures.
What it is: A color picker to set the color of bearish external market structures.
What it does: Changes the color of bearish external market structures on the chart.
How to use it: Select a color from the color picker.
📐 Show Equal Highs and Lows
EQL & EQH📐: Toggle visibility for equal highs and lows.
What it is: A boolean input to show or hide equal highs and lows.
What it does: Displays or hides equal highs and lows on the chart.
How to use it: Check or uncheck the box to enable or disable.
📏 Equal Highs and Lows Threshold
Equal Highs and Lows Threshold: Set the threshold for equal highs and lows.
What it is: A float input to set the threshold for equal highs and lows.
What it does: Defines the range within which highs and lows are considered equal.
How to use it: Enter a value between 0 and 10.
💬 Label Size for Equal Highs and Lows
💬Label Size for Equal Highs and Lows: Set the label size for equal highs and lows.
What it is: A dropdown to select the size of the labels.
What it does: Changes the size of the labels for equal highs and lows.
How to use it: Choose a size from the dropdown (XS, S, M, L, XL).
🟩 Bullish Color for Equal Highs and Lows
Bullish Color for Equal Highs and Lows: Set the color for bullish equal highs and lows.
What it is: A color picker to set the color of bullish equal highs and lows.
What it does: Changes the color of bullish equal highs and lows on the chart.
How to use it: Select a color from the color picker.
🟥 Bearish Color for Equal Highs and Lows
Bearish Color for Equal Highs and Lows: Set the color for bearish equal highs and lows.
What it is: A color picker to set the color of bearish equal highs and lows.
What it does: Changes the color of bearish equal highs and lows on the chart.
How to use it: Select a color from the color picker.
📏 Show Swing Points
Swing Points📏: Toggle visibility for swing points.
What it is: A boolean input to show or hide swing points.
What it does: Displays or hides swing points on the chart.
How to use it: Check or uncheck the box to enable or disable.
📏 Swing Points Length Option
Swing Points Length Option: Select the length for swing points.
What it is: A dropdown to choose between SHORT, MID, LONG, or CUSTOM.
What it does: Sets the length of swing points.
How to use it: Choose an option from the dropdown.
Additional Info: Default lengths are SHORT=10, MID=28, LONG=50.
💬 Swing Points Label Size
💬Swing Points Label Size: Set the label size for swing points.
What it is: A dropdown to select the size of the labels.
What it does: Changes the size of the labels for swing points.
How to use it: Choose a size from the dropdown (XS, S, M, L, XL).
🎨 Swing Points Color
Swing Points Color: Set the color for swing points.
What it is: A color picker to set the color of swing points.
What it does: Changes the color of swing points on the chart.
How to use it: Select a color from the color picker.
🔧 Custom Swing Points Length
🔧Custom Swings: Specify a custom length for swing points.
What it is: An integer input for setting a custom length for swing points.
What it does: Defines the length of swing points if CUSTOM is selected.
How to use it: Enter a custom integer value (only shown when CUSTOM is selected).
Additional Information
Market Structure Types: Understanding internal and external structures helps in analyzing different market behaviors.
Equal Highs and Lows: This feature identifies areas where price action is balanced, which can be significant for trading strategies.
Swing Points: Highlighting swing points aids in recognizing significant market reversals or continuations.
Benefits
Enhance your trading strategy by visualizing smart money's influence on price movements.
Make informed decisions with real-time data on significant market structures.
Reduce manual analysis with automated detection of key trading signals.
Ideal For
Traders looking for an edge in forex, equities, and cryptocurrency markets by understanding the underlying forces driving market dynamics.
Acknowledgements
Special thanks to these amazing creators for inspiration and their creations:
I want to thank these amazing creators for creating there amazing indicators , that inspired me and also gave me a head start by making this indicator! Without their amazing indicators it wouldn't be possible!
Flux Charts: Volumized Order Blocks
LuxAlgo: Trend Lines
UAlgo: Fair Value Gaps (FVG)
By Leviathan: Market Structure
Sonarlab: Liquidity Levels
Note
Remember to always backtest the indicator first before integrating it into your strategy! For any questions about the indicator, please feel free to ask for assistance.

Hosoda Waves ABCDEThe Hosoda Waves indicator was devised by Goichi Hosoda, who is also the creator of the Ichimoku system, with the idea that previous highs and lows could determine future price ranges that the market would react to.
Hosoda's projections are the NT, N, V, and E waves, which are derived from calculations based on both upward and downward ABC swings.
Hosoda's waves are derived from the following calculations:
NT Wave = C + (C - A)
N Wave = B + (B - A)
V Wave = B + (B - C)
E Wave = C + (B - A)
There are already scripts for the Hosoda waves, and my idea is to project an ABCDE swing simultaneously, meaning projecting three swings:
ABC, indicated with an A, resulting in NT-A, N-A, V-A, E-A.
BCD, indicated with a B, resulting in NT-B, N-B, V-B, E-B.
CDE, indicated with a C, resulting in NT-C, N-C, V-C, E-C.
Once the indicator is applied to the chart, the interactive Pine Script tool version 5 will prompt you to identify 5 points of "low-high-low-high-low" or "high-low-high-low-high," both for upward and downward movements and mixed.
Once clicked, these price points can be moved. If you change the time frame or market instrument, the indicator must be removed because it remains tied to the prices where it was initially drawn.
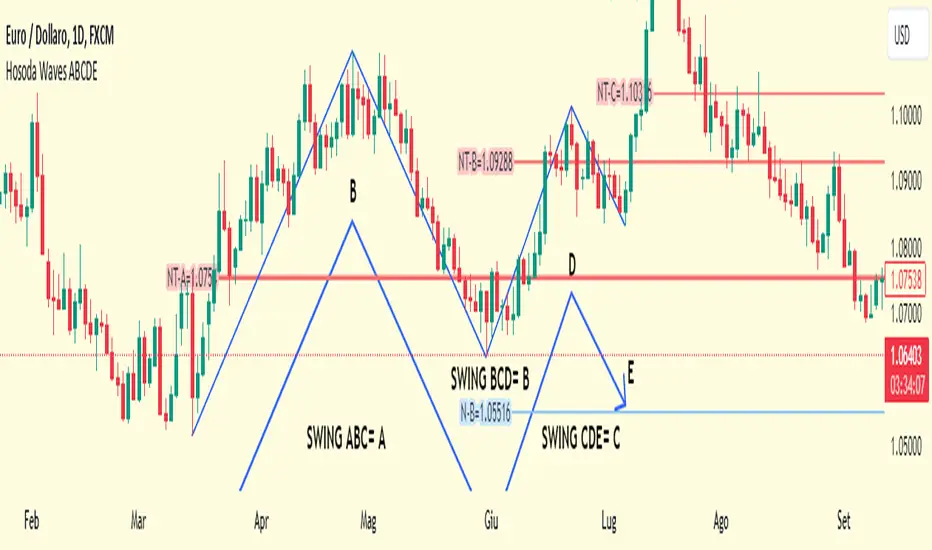
Order Blocks Volume Delta 3D | Flux ChartsGENERAL OVERVIEW:
Order Blocks Volume Delta 3D by Flux Charts is a rule-based order block and volume delta visualization tool. It detects bullish and bearish order blocks using a profile-of-price approach: the indicator finds the most actively traded price area (Point of Control, or POC) between a swing high/low and the Break of Structure (BOS), then anchors the order block to the earliest still-valid candle that traded through that POC band. From there, it tracks all candles that continue to interact with that zone and overlays both 2D and 3D volume delta views directly inside the order block.
Unlike traditional order block tools that simply use candle bodies or wicks, this indicator is volume-aware. It lets you optionally pull volume from a lower timeframe feed (for example, using 1-minute data while watching a 5-minute chart) to build a much more accurate picture of how buyers and sellers actually traded inside the zone. This makes every block not just a price box, but a volume story: which side dominated, where, and by how much.
All order blocks printed by this indicator are confirmed: BOS and retests are evaluated strictly on closed candles. Nothing is drawn or alerted on partially formed bars, which helps avoid repaint-style flicker and keeps the signals clean and stable.
What is the theory behind the indicator?:
The core idea behind Order Blocks Volume Delta 3D is that not all price levels inside an order block are equal. Some prices are barely touched, while others act like magnets where candles repeatedly trade and heavy volume passes through.
The indicator first finds a swing high or swing low, waits for a clear Break of Structure (BOS), then scans the candles between the swing point and the BOS to find the price level that was touched the most. That level is treated as the POC.
From all candles in the swing-to-BOS range that interact with this POC band, the indicator looks for the earliest candle that is not already mitigated and uses that as the anchor candle for the order block:
The top of the block equals the anchor candle’s high (for a bearish OB) or the top of its wick zone.
The bottom equals the anchor candle’s low (for a bullish OB) or the bottom of its wick zone.
This “earliest valid POC-touching candle” rule makes it easier to visualize how price and volume developed from the very start of a meaningful zone, while ignoring POC touches that are already fully mitigated by the time the structure is confirmed. On top of that, each candle is split into bullish and bearish volume. If you choose a lower timeframe volume input, the tool aggregates lower timeframe candles into your chart timeframe, giving a more granular bull-versus-bear breakdown for each bar. The result is
an order block that not only shows where price moved but also which side pushed it, how aggressively, and how that balance shifted over time.
ORDER BLOCKS VOLUME DELTA 3D FEATURES:
The Order Blocks Volume Delta 3D indicator includes 4 main features:
1. Order Blocks
2. Volume Delta
3. 3D Visualization
4. Alerts
ORDER BLOCKS:
🔹What is an Order Block
An order block is a price zone where a clear displacement move began after liquidity was taken. It usually forms around the last consolidation or cluster of candles before price breaks structure with a strong move.
In this indicator, order blocks are defined as structured zones that:
Begin at the earliest unmitigated candle that interacted with the most-touched price level (POC) between swing and BOS.
Extend through the full wick range of that anchor candle.
Stretch forward in time, tracking how price continues to trade through, respect, retest, or invalidate the zone.
Are only printed once the BOS is fully confirmed on closed candles (confirmed order blocks only).
Example of bullish and bearish order blocks anchored at the earliest unmitigated candle in the POC zone:
🔹How are Order Blocks detected
The indicator uses a step-by-step, rules-based process to detect bullish and bearish order blocks. The logic is designed to match discretionary Smart Money concepts but with strict, repeatable rules.
Step 1: Detect swing highs and swing lows
Swing High: a candle whose high is higher than the highs of surrounding candles.
Swing Low: a candle whose low is lower than the lows of surrounding candles.
The Swing Length input controls how many candles are checked to the left and right.
Example of swing high and swing low detection:
Step 2: Confirm Break of Structure (BOS)
Once a swing is confirmed, the indicator waits for price to break past that swing:
Bullish BOS: price closes above a previous swing high.
Bearish BOS: price closes below a previous swing low.
To avoid “live” flicker, BOS logic is evaluated based on the previous closed candle. The order block is only confirmed once the BOS candle has fully closed and the next bar has opened. This is one of the reasons the script only shows confirmed, non-repainting order blocks.
Example of bullish BOS and bearish BOS:
Step 3: Build the POC range between swing and BOS
Between the swing candle and the BOS candle, the indicator:
Scans all candles in that range.
Tracks every price level touched using binning (POC bins).
Counts how many times each price band was touched by candle wicks.
The bin with the highest touch count becomes the POC band. This is where price traded most often, not necessarily where volume was highest.
Example of the POC band between swing and BOS.
Step 4 – Anchor the order block to the earliest valid POC candle
From all candles in the swing-to-BOS range, the indicator finds the earliest candle whose high/low overlaps the POC band and whose zone is not already mitigated. That candle becomes the anchor candle for the order block:
For a bearish OB, the block spans the anchor candle’s full wick range, with its top at the high.
For a bullish OB, the block spans the anchor candle’s full wick range, with its bottom at the low.
By requiring the anchor to be the earliest unmitigated interaction with POC, the script avoids building blocks from price action that has already been fully traded through and is less relevant.
Step 5: Extend and manage the order block
Once created, the block:
Extends to the right by a configurable number of candles (Extend Zones).
Continues until it is invalidated by wick or close, depending on the chosen method.
Can show retest labels when price revisits the zone after creation.
Is included or excluded from display depending on the Show Nearest and Hide Invalidated Zones settings.
Example of active and invalidated OB.
🔹Order Block Settings
◇ Swing Length
Swing Length controls how sensitive swing highs and lows are.
Lower Swing Length: Swings form more frequently, which leads to more frequent BOS events and order block formations.
Higher Swing Length: Only larger, more meaningful swings are detected, which leads to less frequent BOS events and less order block formations.
◇ Invalidation
Invalidation determines how an order block is considered “mitigated” or no longer valid.
Wick: For bullish OBs, if price wicks completely through the bottom of the zone, the order block is invalidated. For bearish OBs, if price wicks completely through the top, the order block is invalidated.
Close: For bullish OBs, the block is invalidated only when a candle closes below the bottom. For bearish OBs, it is invalidated only when a candle closes above the top.
Example of wick invalidation:
Example of close invalidation:
◇ Show Nearest
Show Nearest limits how many active order blocks are displayed based on proximity to current price. For example, a value of 2 will display only the two nearest bullish order blocks and two nearest bearish order blocks.
Chart with Show Nearest set to 3:
◇ Extend Zones
Extend Zones define how many candles forward each order block should project beyond the right most candle on the chart.
Chart with Extend Zones set to 10:
◇ Retest Labels
When enabled, the indicator prints labels on every clean retest of an active order block, as long as that block remains valid. Key points:
A retest label is only printed once the retest candle has fully closed – you always see confirmed retests, not intrabar tests.
Retest labels are positioned on the actual retest candle so you can visually see which bar interacted with the zone.
In addition, if multiple retests occur in quick succession, the indicator applies a built-in three-candle buffer between retests. That means only the first valid retest within each three-bar window is labeled (and can trigger an alert), helping to reduce clutter while still highlighting meaningful interactions with the zone.
Example of retest labels on bullish and bearish order blocks.
◇ Hide Invalidated Zones
Hide Invalidated Zones controls whether mitigated/invalidated blocks stay drawn.
Enabled: Only currently valid, unmitigated order blocks are shown (subject to Show Nearest)
Disabled: Both active and invalidated order blocks are displayed.
VOLUME DELTA:
🔹What is Volume Delta
Volume delta measures the difference between buying and selling volume. Instead of only showing “how much volume traded”, it separates volume into bullish and bearish components.
In this indicator:
Bullish volume = volume from candles (or lower timeframe candles) that closed higher.
Bearish volume = volume from candles that closed lower.
Delta % shows how dominant one side was compared to the total.
Example of bullish and bearish order blocks with volume delta and total volume.
🔹How is Volume Delta calculated?
The indicator uses a flexible, timeframe-aware volume engine.
1. Choose a Volume Delta Timeframe.
If the selected timeframe is equal to or higher than the chart timeframe, the indicator simply uses chart-volume per candle.
If the selected timeframe is lower than the chart timeframe (for example, 1‑minute volume on a 5‑minute chart), the indicator pulls all lower timeframe candles for each chart bar and sums them.
2. Split each bar into bull and bear volume.
For each contributing candle:
If close > open → its volume is added to bullish volume.
If close < open → its volume is added to bearish volume.
If close == open → its volume is split evenly between bullish and bearish.
3. Aggregate for each order block.
For each order block:
The indicator loops once from the swing candle to the BOS candle.
It records every candle that touches the POC band.
For each touching candle, it adds its bull and bear volumes (either directly from chart candles or from aggregated lower timeframe candles).
Total volume = bullish volume + bearish volume
Delta % = (bullish volume or bearish volume / total volume ) * 100, depending on which side is dominant.
🔹Volume Delta Settings:
◇ Display Style
Display Style controls how the volume delta is drawn inside each order block:
Horizontal:
Bullish and bearish fills extend horizontally from left to right.
The filled strip sits along the base of the block, with a bull vs bear gradient.
Vertical:
Bullish and bearish fills stretch vertically inside the zone.
The bullish percentage controls how much of the block is filled with the “dominant” color.
Example of Horizontal display style.
Example of Vertical display style.
◇ Volume Delta Timeframe
Volume Delta Timeframe tells the indicator whether to use chart volume or lower timeframe volume. When set to a lower timeframe, the indicator aggregates all lower timeframe candles that fall inside each chart bar, splitting their volume into bullish and bearish components before summing.
Using a lower timeframe:
Increases precision for how volume truly behaved inside each bar.
Helps reveal hidden absorption and aggressive flows that a higher timeframe candle might hide.
Example of volume delta based on chart timeframe.
Example of volume delta based on lower timeframe than chart(same OB as above)
◇ Display Total Volume
When enabled, the indicator prints the total volume for each order block as a label positioned inside the zone, near the bottom-right corner. This total is the sum of bullish and bearish volume used in the delta calculation and gives you a quick sense of how “heavy” the trading was in that block compared to others.
Example of total volume label inside multiple order blocks.
◇ Show Delta %
Show Delta % draws a small text label on the strip of the block that displays the dominant side’s percentage. For example, a bullish block might show “72%” if 72% of all volume inside that POC band came from bullish volume.
Example of Delta %:
3D VISUALIZATION:
The 3D Visualization feature turns each order block into a 3D plot.
🔹What the 3D Visualization does:
Wraps the order block with side faces and a top face to create a 3D bar effect.
Uses delta percentages to tilt the top face toward the dominant side.
Projects blocks into the future using Extend Zones, making the 3D blocks visually stand out.
🔹How it works:
The front face of the OB shows the standard 2D zone.
The side face extends forward in time based on the 3D depth setting.
The top face is angled depending on the Display Style and bull vs bear delta, making strong bullish blocks “rise” and strong bearish blocks “sink”.
🔹How the 3D depth setting affects visuals
Lower 3D depth:
Shorter side faces.
Subtle 3D effect.
Higher 3D depth:
Longer side faces projecting further into the future.
Stronger 3D effect that visually highlights key zones.
Example of lower 3D depth:
Example of higher 3D depth:
ALERTS:
The indicator supports alert conditions through TradingView’s AnyAlert() engine, allowing you to set alerts for the following:
New Bullish Order Block formed
New Bearish Order Block formed
Bullish OB Retest
Bearish OB Retest
Important alert behavior:
Order block alerts only fire when a new block is confirmed (after BOS closes and the next bar opens).
Retest alerts only fire when a retest candle has completely finished, matching the behavior of the visual retest labels.
IMPORTANT NOTES:
3D faces for order blocks are built using polylines. In some situations, especially when an order block’s starting point (its left edge) is beyond the chart’s left-most visible bar, the top 3D face may appear slightly irregular, skewed, or incomplete. This is purely a drawing limitation related to how the chart engine handles off-screen polyline points. Once the starting point of that order block comes into view (by zooming out or scrolling back), the 3D top face corrects itself and the visual becomes fully consistent. This issue affects only the 3D top face drawing, not the actual order-block box itself. The underlying zone, prices, and volume calculations remain accurate at all times.
If all conditions are met to create a new order block but the resulting zone would overlap an existing active order block, the new block is intentionally not created. A built-in guard prevents overlapping active zones to keep the structure clean and easier to interpret.
3D face drawing is implemented using an adaptive polyline method, which can be relatively calculation-heavy on certain symbols, timeframes, or chart histories. In some cases this may lead to calculation timeout error from TradingView.
UNIQUENESS:
This indicator is unique because it:
Anchors each order block to the earliest unmitigated candle that traded through the most-touched POC band between swing and BOS, rather than a generic “last up/down candle” or a random volume spike.
Builds a dedicated volume engine that can pull either chart timeframe volume or aggregated lower timeframe volume, then splits it into bull and bear components.
Adds 3D visualization on top of standard zones, turning each OB into a visually weighted slab rather than a flat rectangle.
Provides clean toggles (Show Nearest, Hide Invalidated Zones, Extend Zones, Display Style, Delta %, and total volume labels) so you can dial the indicator from extremely minimal to fully detailed, depending on your trading workflow.
Combined, these features make the indicator not just an order block plotter, but a complete volume‑informed structure tool tailored for traders who want to see where price actually traded and whether bulls or bears truly controlled the move inside each order block.

RSI Fibonacci Flow [JOAT]RSI Fibonacci Flow - Advanced Fibonacci Retracement with RSI Confluence
Introduction
RSI Fibonacci Flow is an open-source overlay indicator that combines automatic Fibonacci retracement levels with RSI momentum analysis to identify high-probability trading zones. The indicator automatically detects swing highs and lows, draws Fibonacci levels, and generates confluence signals when RSI conditions align with key Fibonacci zones.
This indicator is designed for traders who use Fibonacci retracements but want additional confirmation from momentum analysis before entering trades.
Originality and Purpose
This indicator is NOT a simple mashup of RSI and Fibonacci tools. It is an original implementation that creates a synergistic relationship between two complementary analysis methods:
Why Combine RSI with Fibonacci? Fibonacci retracements identify WHERE price might reverse, but they don't tell you WHEN. RSI provides the timing component by showing momentum exhaustion. When price reaches the Golden Zone (50%-61.8%) AND RSI shows oversold conditions, the probability of a successful bounce increases significantly.
Original Confluence Scoring System: The indicator calculates a 0-5 confluence score that weights multiple factors: Golden Zone presence (+2), entry zone presence (+1), RSI extreme alignment (+1), RSI divergence (+1), and strong RSI momentum (+1). This scoring system is original to this indicator.
Automatic Pivot Detection: Unlike manual Fibonacci tools, this indicator automatically detects swing highs and lows using a configurable pivot algorithm, then draws Fibonacci levels accordingly. The pivot detection uses a center-bar comparison method that checks if a bar's high/low is the highest/lowest within the specified depth on both sides.
Dynamic Trend Awareness: The indicator determines trend direction based on pivot sequence (last pivot was high or low) and adjusts Fibonacci orientation accordingly. In uptrends, 0% is at swing low; in downtrends, 0% is at swing high.
Each component serves a specific purpose:
Fibonacci levels identify potential reversal zones based on natural price ratios
RSI provides momentum context to filter out low-probability setups
Confluence scoring quantifies setup quality for position sizing decisions
Automatic pivot detection removes subjectivity from level placement
Core Concept: RSI-Fibonacci Confluence
The most powerful trading setups occur when multiple factors align. RSI Fibonacci Flow identifies these moments by:
Automatically detecting price pivots and drawing Fibonacci levels
Tracking which Fibonacci zone the current price occupies
Monitoring RSI for overbought/oversold conditions
Generating signals when RSI extremes coincide with key Fibonacci levels
Scoring confluence strength on a 0-5 scale
When price reaches the Golden Zone (50%-61.8%) while RSI shows oversold conditions in an uptrend, the probability of a bounce increases significantly.
Fibonacci Levels Explained
The indicator draws nine Fibonacci levels based on the most recent swing:
0% (Swing Low/High): The starting point of the move
23.6%: Shallow retracement - often seen in strong trends
38.2%: First significant support/resistance level
50%: Psychological midpoint of the move
61.8% (Golden Ratio): The most important Fibonacci level
78.6%: Deep retracement - last defense before trend failure
100% (Swing High/Low): The end point of the move
127.2% (TP1): First extension target for take profit
161.8% (TP2): Second extension target for take profit
The Golden Zone
The area between 50% and 61.8% is highlighted as the "Golden Zone" because:
It represents the optimal retracement depth for trend continuation
Institutional traders often place orders in this zone
It offers favorable risk-to-reward ratios
Price frequently bounces from this area in healthy trends
When price enters the Golden Zone, the indicator highlights it with a semi-transparent box and optional background coloring.
Pivot Detection System
The indicator uses a configurable pivot detection algorithm:
pivotDetect(float src, int len, bool isHigh) =>
int halfLen = len / 2
float centerVal = nz(src , src)
bool isPivot = true
for i = 0 to len - 1
if isHigh
if nz(src , src) > centerVal
isPivot := false
break
else
if nz(src , src) < centerVal
isPivot := false
break
isPivot ? centerVal : float(na)
This identifies swing highs and lows by checking if a bar's high/low is the highest/lowest within the specified depth on both sides.
Visual Components
1. Fibonacci Lines
Horizontal lines at each Fibonacci level:
Solid lines for major levels (0%, 50%, 61.8%, 100%)
Dashed lines for secondary levels (23.6%, 38.2%, 78.6%)
Dotted lines for extension levels (127.2%, 161.8%)
Color-coded for easy identification
Configurable line width
2. Fibonacci Labels
Price labels at each level showing:
Fibonacci percentage
Actual price at that level
Golden Zone label highlighted
TP1 and TP2 labels for targets
3. Golden Zone Box
A semi-transparent box highlighting the 50%-61.8% zone:
Gold colored border and fill
Extends from swing start to current bar (or beyond if extended)
Provides clear visual of the optimal entry zone
4. ZigZag Lines
Connecting lines between detected pivots:
Cyan for moves from low to high
Orange for moves from high to low
Helps visualize market structure
Configurable line width
5. Pivot Markers
Small labels at detected swing points:
"HH" (Higher High) at swing highs
"LL" (Lower Low) at swing lows
Helps track market structure
6. Entry Signals
BUY and SELL labels when confluence conditions are met:
BUY: RSI oversold + price in entry zone + uptrend + positive momentum
SELL: RSI overbought + price in entry zone + downtrend + negative momentum
Labels include "RSI+FIB" to indicate confluence
Confluence Scoring System
The indicator calculates a confluence score from 0 to 5:
+2 points: Price is in the Golden Zone (50%-61.8%)
+1 point: Price is in the entry zone (38.2%-61.8%)
+1 point: RSI is oversold in uptrend OR overbought in downtrend
+1 point: RSI divergence detected (bullish or bearish)
+1 point: Strong RSI momentum (change > 2 points)
Confluence ratings:
STRONG (4-5): Multiple factors align - high probability setup
MODERATE (2-3): Some factors align - proceed with caution
WEAK (0-1): Few factors align - wait for better setup
Dashboard Panel
The 10-row dashboard provides comprehensive analysis:
RSI Value: Current RSI reading (large text)
RSI State: OVERBOUGHT, OVERSOLD, BULLISH, BEARISH, or NEUTRAL
Fib Trend: UPTREND or DOWNTREND based on last pivot sequence
Price Zone: Current Fibonacci zone (e.g., "GOLDEN ZONE", "38.2% - 50%")
Price: Current close price (large text)
Confluence: Score rating with numeric value (e.g., "STRONG (4/5)")
Nearest Fib: Closest key Fibonacci level with price
TP1 (127.2%): First take profit target price
TP2 (161.8%): Second take profit target price
Input Parameters
Pivot Detection:
Pivot Depth: Bars to look back for swing detection (default: 10)
Min Deviation %: Minimum price move to confirm pivot (default: 1.0)
RSI Settings:
RSI Length: Period for RSI calculation (default: 14)
Source: Price source (default: close)
Overbought: Upper threshold (default: 70)
Oversold: Lower threshold (default: 30)
Fibonacci Display:
Show Fib Lines: Toggle Fibonacci lines (default: enabled)
Show Fib Labels: Toggle price labels (default: enabled)
Show Golden Zone Box: Toggle zone highlight (default: enabled)
Line Width: Thickness of Fibonacci lines (default: 2)
Extend Fib Lines: Extend lines into future (default: enabled)
ZigZag:
Show ZigZag: Toggle connecting lines (default: enabled)
ZigZag Width: Line thickness (default: 2)
Signals:
Show Entry Signals: Toggle BUY/SELL labels (default: enabled)
Show TP Levels: Toggle take profit in dashboard (default: enabled)
Show RSI-Fib Confluence: Toggle confluence analysis (default: enabled)
Dashboard:
Show Dashboard: Toggle information panel (default: enabled)
Position: Choose corner placement
Colors:
Bullish: Color for bullish elements (default: cyan)
Bearish: Color for bearish elements (default: orange)
Neutral: Color for neutral elements (default: gray)
Golden Zone: Color for Golden Zone highlight (default: gold)
How to Use RSI Fibonacci Flow
Identifying Entry Zones:
Wait for price to retrace to the 38.2%-61.8% zone
Check if RSI is approaching oversold (for longs) or overbought (for shorts)
Look for STRONG confluence rating in the dashboard
Enter when BUY or SELL signal appears
Setting Take Profit Targets:
TP1 at 127.2% extension for conservative target
TP2 at 161.8% extension for aggressive target
Consider scaling out at each level
Using the Price Zone:
"BELOW 23.6%" - Price hasn't retraced much; wait for deeper pullback
"23.6% - 38.2%" - Shallow retracement; strong trend continuation possible
"38.2% - 50%" - Good entry zone for trend trades
"GOLDEN ZONE" - Optimal entry zone; highest probability
"61.8% - 78.6%" - Deep retracement; trend may be weakening
"78.6% - 100%" - Very deep; trend reversal possible
"ABOVE/BELOW 100%" - Trend has likely reversed
Confluence Trading Strategy:
Only take trades with confluence score of 3 or higher
STRONG confluence (4-5) warrants larger position size
MODERATE confluence (2-3) warrants smaller position size
WEAK confluence (0-1) - wait for better setup
Alert Conditions
Ten alert conditions are available:
RSI-Fib BUY Signal: Strong bullish confluence detected
RSI-Fib SELL Signal: Strong bearish confluence detected
Price in Golden Zone: Price enters 50%-61.8% zone
New Pivot High: Swing high detected
New Pivot Low: Swing low detected
RSI Overbought: RSI crosses above overbought threshold
RSI Oversold: RSI crosses below oversold threshold
Bullish Divergence: Potential bullish RSI divergence
Bearish Divergence: Potential bearish RSI divergence
Strong Confluence: Confluence score reaches 4 or higher
Understanding Trend Direction
The indicator determines trend based on pivot sequence:
UPTREND: Last pivot was a low after a high (expecting move up)
DOWNTREND: Last pivot was a high after a low (expecting move down)
Fibonacci levels are drawn accordingly:
In uptrend: 0% at swing low, 100% at swing high
In downtrend: 0% at swing high, 100% at swing low
Bar Coloring
When confluence features are enabled:
Cyan bars on strong bullish signals
Orange bars on strong bearish signals
Gold-tinted bars when price is in Golden Zone
Best Practices
Use on 1H timeframe or higher for more reliable pivots
Adjust Pivot Depth based on timeframe (higher for longer timeframes)
Wait for price to enter Golden Zone before considering entries
Confirm RSI is in favorable territory before trading
Use extension levels (127.2%, 161.8%) for realistic profit targets
Combine with support/resistance and candlestick patterns
Higher confluence scores indicate higher probability setups
Limitations
Pivot detection has inherent lag (must wait for confirmation)
Fibonacci levels are subjective - different swings produce different levels
Works best in trending markets with clear swings
RSI can remain overbought/oversold in strong trends
Not all Golden Zone entries will be successful
The source code is open and available for review and modification.
Disclaimer
This indicator is provided for educational and informational purposes only. It is not financial advice. Trading involves substantial risk of loss. Past performance does not guarantee future results. Fibonacci levels are not guaranteed support/resistance - they are probability zones based on historical price behavior. Always conduct your own analysis and use proper risk management.
- Made with passion by officialjackofalltrades :D

Harmonic Patterns [kingthies]Harmonic Patterns
This indicator scans price swings for classic X-A-B-C-D harmonic patterns and plots the structure plus a PRZ (Potential Reversal Zone) to help you frame areas where reactions are statistically more likely. It supports both bullish and bearish setups and can trigger alerts when a new D pivot confirms a pattern.
What it does
Builds a pivot-based swing map (ZigZag-style) using a configurable Pivot Length .
Evaluates the most recent 5 swing points (X, A, B, C, D) against harmonic ratio rules with a user-defined tolerance .
Detects: Gartley, Bat, Butterfly, Crab, Deep Crab, Cypher, Shark (loose) .
Draws the pattern legs (X-A-B-C-D), labels the detection with ratio readouts, and projects a PRZ using 3 target levels (derived from XA/BC logic per pattern).
Offers two rendering modes:
Best only : picks the closest match (lowest score) to reduce clutter.
Show all : plots every valid match (uses filled PRZ boxes to keep object usage under control).
PRZ (Potential Reversal Zone)
PRZ is built from three target levels and expanded into a zone.
Optional padding uses ATR (ATR multiplier) to widen/narrow the zone for volatility.
Display modes: Off, Box, Lines, Both .
Zones can be extended forward by a configurable number of bars to keep the area visible as price develops.
How to use
Start with Confirm only when D pivot forms enabled (recommended) to reduce false positives while patterns are still forming.
Adjust Pivot Length based on timeframe:
Lower values = more swings, more signals, more noise.
Higher values = cleaner structures, fewer signals.
Use Ratio Tolerance to control strictness:
Lower tolerance = fewer, higher-confidence matches.
Higher tolerance = more matches, potentially lower quality.
Treat harmonics as context , not a standalone entry system:
Look for confluence (HTF levels, structure, volume, momentum/RSI divergence, etc.).
Use your own confirmation and risk plan (invalidations beyond PRZ / beyond D).
Settings overview
Swings (Pivot ZigZag)
Pivot Length: pivot sensitivity.
Use Wicks: uses High/Low; if off, uses Close.
Max Stored Swings: limits stored pivots for performance/object control.
Harmonic Detection
Ratio Tolerance (%): allowed deviation around ideal ratios.
Confirm only when D pivot forms: reduces repaint-like behavior.
When multiple match: Best only vs Show all.
Pattern Filters enable/disable each pattern type.
PRZ
PRZ Display: Off / Box / Lines / Both.
PRZ Padding (ATR multiplier): volatility-adjusted zone padding.
PRZ Extend (bars): how far to project the zone.
Visuals
Draw Legs: draws X-A-B-C-D.
Show Pattern Label: prints pattern name, direction, ratios, and score.
Label Offset: shift label forward if you want more space.
Alerts
“Bullish/Bearish Harmonic (Any)” triggers on any detected pattern.
Per-pattern alerts are included for each supported pattern type.
Notes
This indicator is educational and intended to assist with pattern recognition and confluence mapping.
Harmonic patterns do not guarantee reversals—always manage risk and confirm with your own process.

Multi-Timeframe Trend Analysis [BigBeluga]Multi-Timeframe Trend Analysis
A powerful trend-following dashboard designed to help traders monitor and compare trend direction across multiple higher timeframes. By analyzing EMA conditions from five customizable timeframes, this tool gives a clear visual breakdown of short- to long-term trend alignment.
🔵Key Features:
Multi-Timeframe EMA Dashboard:
➣ Displays a table in the top-right corner showing trend direction across 5 user-defined timeframes.
➣ Each row shows whether ema is rising or falling its corresponding EMA for that timeframe.
➣ Green arrows (🢁) indicate uptrends, purple arrows (🢃) signal downtrends.
Custom Timeframe Selection:
➣ Traders can input any 5 timeframes (e.g., 1h, 2h, 3h, etc.) with individual EMA lengths for flexible trend mapping.
➣ The tool auto-adjusts to match and align external timeframe EMAs to the current chart for seamless overlay.
Dynamic Chart Arrows:
➣ On-chart arrows mark when EMA rising or falling EMAs from the current chart timeframe.
➣ Each EMA arrows has a unique transparency level—shorter EMA arrows are more transparent, longer EMA arrows are more vivid. (Hover Mouse over the arrow to see which EMAs it is)
Gradient EMA Plotting:
➣ All five EMAs are plotted with gradually increasing opacity.
➣ Gradient fills between EMAs enhance visual structure, making it easier to track convergence/divergence.
🔵Usage:
Trend Confirmation: Use the dashboard to confirm multi-timeframe trend alignment before entering trades.
Entry Filtering: Avoid countertrend trades by spotting when higher timeframes disagree with the current one.
Momentum Insight: Track the transition of arrows from lighter to stronger opacity to visualize trend shifts over time.
Scalping or Swinging: Customize timeframes depending on your strategy—from intraday scalps to longer-term swings.
Multi-Timeframe Trend Analysis is the ultimate visual companion for traders who want clarity on how price behaves across multiple time horizons. With its smart EMA mapping and dashboard feedback, it keeps you aligned with dominant trend directions and transition zones at all times.

MÈGAS ALGO : ZIG-ZAG CYCLE INSIGTH [INDICATOR]Overview
The Zig-Zag Cycle Insigth is a revisited version of the classic Zig Zag indicator, designed to provide traders with a more comprehensive and actionable view of price movements.
This advanced tool not only highlights significant price swings but also incorporates additional features such as cycle analysis, real-time data tracking, and Fibonacci retracement levels. These enhancements make it an invaluable resource for identifying trends, potential reversal points, and market structure.
This indicator adheres to TradingView's guidelines and is optimized for both technical analysts and active traders who seek deeper insights into market dynamics.
Key Features:
1. Customizable Thresholds for Price Movements:
- Users can set personalized thresholds for price movement percentages and time periods.
This ensures that only significant price swings are plotted, reducing noise and increasing
clarity.
- Straight lines connect swing highs and lows, providing a cleaner visual representation of
the trend.
2. Cycle Analysis Table:
- A dynamic table is included to analyze price cycles based on three key factors:
- Price Change: Measures the magnitude of each swing (high-to-low or low-to-high).
- Time Duration (Bar Count): Tracks the number of bars elapsed between consecutive swings,
offering precise timing insights.
- Volume: Analyzes trading volume during each segment of the cycle.
- The indicator calculates the **maximum**, **minimum**, and **mean** values for each
parameter across all completed cycles, providing deeper statistical insights into market
behavior.
- This table updates in real-time, offering traders a quantitative understanding of how price
behaves over different cycles.
3. Real-Time Data Integration:
- The indicator displays live updates of current price action relative to the last identified
swing high/low. This includes:
- Current distance from the last pivot point.
- Percentage change since the last pivot.
- Volume traded since the last pivot.
4. Fibonacci Retracement Levels:
- Integrated Fibonacci retracement levels are dynamically calculated based on the most
recent significant swing high and low.
- Key retracement levels (23.6%, 38.2%, 50%, 61.8%, and 78.6%) are plotted alongside the Zig
Zag lines, helping traders identify potential support/resistance zones.
- Extension levels (100%, 161.8%, etc.) are also included to anticipate possible breakout
targets.
5. Customizable Alerts:
- Users can configure alerts for specific real-time conditions, such as:
- Price Change
- Duration
- Volume
- Fibonacci Retracement Levels
How It Works:
1. Zig Zag Identification:
- The indicator scans historical price data to identify significant turning points where the
price moves by at least the user-defined percentage threshold.
- These turning points are connected by straight lines to form the Zig Zag pattern.
2. Cycle Analysis:
For each completed cycle (from one swing high/low to the next), the indicator calculates:
- Price Change: Difference between the start and end prices of the cycle.
- Maximum Price Change: The largest price difference observed across all cycles.
- Minimum Price Change: The smallest price difference observed across all cycles.
- Mean Price Change: The average price difference across all cycles.
- Time Duration (Bar Count): Number of bars elapsed between consecutive swings.
- Maximum Duration: The longest cycle in terms of bar count.
- Minimum Duration: The shortest cycle in terms of bar count.
- Mean Duration: The average cycle length in terms of bar count.
- Volume: Total volume traded during the cycle.
- Maximum Volume: The highest volume traded during any single cycle.
- Minimum Volume: The lowest volume traded during any single cycle.
- Mean Volume: The average volume traded across all cycles.
- These calculations provide traders with a statistical overview of market behavior, enabling
them to identify patterns and anomalies in price, time, and volume.
3. Fibonacci Integration:
- Once a new swing high or low is identified, the indicator automatically calculates Fibonacci
retracement and extension levels.
- These levels serve as reference points for potential entry/exit opportunities.
4. Real-Time Updates:
- As the market evolves, the indicator continuously monitors the relationship between the
current price and the last identified swing point.
- Real-time metrics, such as percentage change and volume, are updated dynamically.
5. Alerts Based on Real-Time Parameters:
- The indicator allows users to set customizable alerts based on real-time conditions:
- Price Change Alert: Triggered when the real-time price change is less or greater than a
predefined percentage threshold (e.g., > or < fixed value).
- Duration Alert: Triggered when the cycle duration (in bars) is less or greater than a
predefined
bar count threshold (e.g., > or < fixed value).
- Volume Alert: Triggered when the trading volume during the current cycle is less or greater
than a predefined volume threshold (e.g., > or < fixed value).
Advantages of Zig-Zag Cycle Insigth
- Comprehensive Insights: Combining cycle analysis, Fibonacci retracements, and real-time data
provides a holistic view of market conditions.
- Statistical Analysis: The inclusion of maximum, minimum, and mean values for price change,
duration, and volume offers deeper insights into market behavior.
- Actionable Signals: Customizable alerts ensure traders never miss critical market events based
on real-time price, duration, and volume parameters.
- User-Friendly Design: Clear visuals and intuitive controls make it accessible for traders of all
skill levels.
Reference:
TradingView/ZigZag
TradingView/AutofibRetracement
Please Note:
This indicator is provided for informational and educational purposes only. It is not financial advice, and it should not be considered a recommendation to buy, sell, or trade any financial instrument. Trading involves significant risks, including the potential loss of your entire investment. Always conduct your own research and consult with a licensed financial advisor before making any trading decisions.
The results and images provided are based on algorithms and historical/paid real-time market data but do not guarantee future results or accuracy. Use this tool at your own risk, and understand that past performance is not indicative of future outcomes.
