Money Risk Management with Trade Tracking
Overview
The Money Risk Management with Trade Tracking indicator is a powerful tool designed for traders on TradingView to simplify trade simulation and risk management. Unlike the TradingView Strategy Tester, which can be complex for beginners, this indicator provides an intuitive, beginner-friendly interface to evaluate trading strategies in a realistic manner, mirroring real-world trading conditions.
Built on the foundation of open-source contributions from LuxAlgo and TCP, this indicator integrates external indicator signals, overlays take-profit (TP) and stop-loss (SL) levels, and provides detailed money management analytics. It empowers traders to visualize potential profits, losses, and risk-reward ratios, making it easier to understand the financial outcomes of their strategies.
Key Features
Signal Integration: Seamlessly integrates with external long and short signals from other indicators, allowing traders to overlay TP/SL levels based on their preferred strategies.
Realistic Trade Simulation: Simulates trades as they would occur in real-world scenarios, accounting for initial capital, risk percentage, leverage, and compounding effects.
Money Management Dashboard: Displays critical metrics such as current capital, unrealized P&L, risk amount, potential profit, risk-reward ratio, and trade status in a customizable, beginner-friendly table.
TP/SL Visualization: Plots TP and SL levels on the chart with customizable styles (solid, dashed, dotted) and colors, along with optional labels for clarity.
Performance Tracking: Tracks total trades, win/loss counts, win rate, and profit factor, providing a clear overview of strategy performance.
Liquidation Risk Alerts: Warns traders if stop-loss levels risk liquidation based on leverage settings, enhancing risk awareness.
Benefits for Traders
Beginner-Friendly: Simplifies the complexities of the TradingView Strategy Tester, offering an intuitive interface for new traders to simulate and evaluate trades without confusion.
Real-World Insights: Helps traders understand the actual profit or loss potential of their strategies by factoring in capital, risk, and leverage, bridging the gap between theoretical backtesting and real-world execution.
Enhanced Decision-Making: Provides clear, real-time analytics on risk-reward ratios, unrealized P&L, and trade performance, enabling informed trading decisions.
Customizable and Flexible: Allows customization of TP/SL settings, table positions, colors, and sizes, catering to individual trader preferences.
Risk Management Focus: Encourages disciplined trading by highlighting risk amounts, potential profits, and liquidation risks, fostering better financial planning.
Why This Indicator Stands Out
Many traders struggle to translate backtested strategy results into real-world outcomes due to the abstract nature of percentage-based profitability metrics. This indicator addresses that challenge by providing a practical, user-friendly tool that simulates trades with real-world parameters like capital, leverage, and compounding. Its open-source nature ensures accessibility, while its integration with other indicators makes it versatile for various trading styles.
How to Use
Add to TradingView: Copy the Pine Script code into TradingView’s Pine Editor and add it to your chart.
Configure Inputs: Set your initial capital, risk percentage, leverage, and TP/SL values in the indicator settings. Select external long/short signal sources if integrating with other indicators.
Monitor Dashboards: Use the Money Management and Target Dashboard tables to track trade performance and risk metrics in real time.
Analyze Results: Review win rates, profit factors, and P&L to refine your trading strategy.
Credits
This indicator builds upon the open-source contributions of LuxAlgo and TCP , whose efforts in sharing their code have made this tool possible. Their dedication to the trading community is deeply appreciated.
Search in scripts for "take profit"

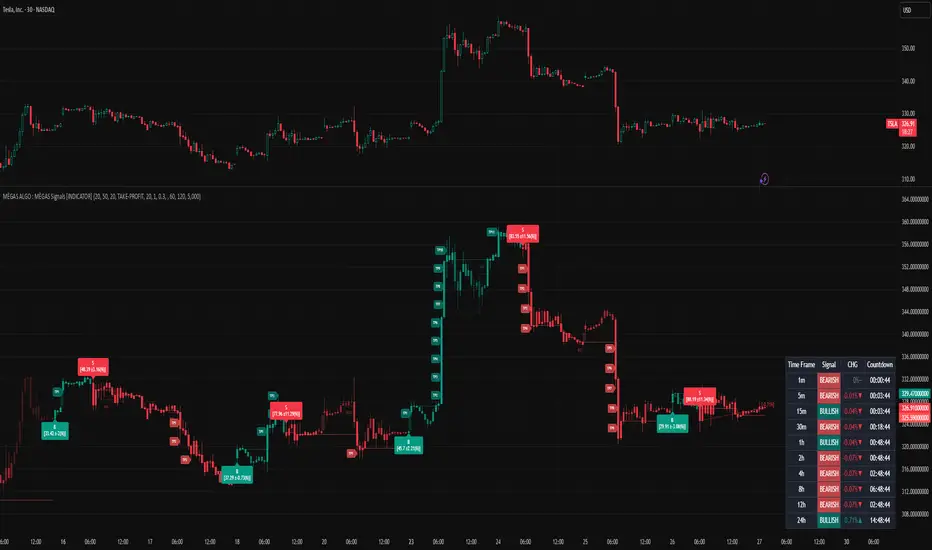
MÈGAS ALGO : MÈGAS Signals [INDICATOR]Overview
The MÈGAS Signals is a cutting-edge, multi-functional trading tool designed for advanced traders seeking to identify high-probability trade setups. This script combines price action analysis, machine learning techniques, and real-time signal generation across multiple timeframes to provide actionable insights. The indicator is optimized for both bullish and bearish market conditions and includes features like backtesting metrics, take-profit tools, and customizable alerts.
Key Features
1. Machine Learning and Statistical Clustering
The script implements the K-Means clustering algorithm , a widely used unsupervised machine learning technique, to segment historical price movements into distinct clusters based on magnitude and distribution characteristics. These clusters represent quantized levels of bullish and bearish momentum, enabling the system to adaptively model market behavior across varying volatility regimes.
By applying this statistical clustering approach to real-time price data, the algorithm dynamically identifies meaningful thresholds for key Smart Money Concepts (SMC) such as Break of Structure (BOS) and Change of Character (CHOCH) . This integration enhances classical SMC logic with a data-driven, self-adjusting mechanism that responds to evolving market conditions, effectively bridging traditional price action analysis with modern machine learning methodologies.
2.Multi-Timeframe Table:
A dynamic, real-time multi-timeframe table displayed on the chart that provides at-a-glance insight into:
-Current trend or signal status per timeframe
-Percentage price change relative to the previous bar
-Countdown to the next bar open , updated every second
This table empowers traders with cross-timeframe context , helping them identify confluence, reversals, or divergences across multiple horizons — from scalping (1m) to long-term trends (1D).
3.Dynamic Trailing Stops with Enhanced Visualization
The dynamic trailing stop mechanism adjusts based on volatility clusters, ensuring tighter risk
management during low-volatility periods and wider stops during high-volatility phases.
The feed speed feature enhances visualization by adjusting the transparency of candle
coloring relative to the trailing stop. This makes it easier to interpret trend strength and
momentum, allowing traders to stay ahead of price action.
4.Customizable Alerts for Seamless Execution
Sublimia Signals offers highly customizable alerts that can be tailored to specific timeframes
and trading preferences.
With the intra-bar calculation feature, alerts can be triggered on every tick rather than just
on bar close, empowering traders to act swiftly in fast-moving markets.
Personalized alert messages allow you to create clear and concise notifications for entry and
exit points, streamlining your trading workflow.
5.Comprehensive Backtesting Metrics
The built-in performance metrics table provides detailed backtesting results, including total
trades, win rates, cumulative profit/loss, profit factor, best profit, and worst loss for both
long and short positions.
These metrics enable traders to evaluate the effectiveness of their strategies and optimize
input parameters for better performance.
6.Non-Standard Candle Integration for Smoother Price Action Analysis
The optional Non-Standard Candle toggle allows users to switch between "Traditional", "Heikin-Ashi", "Volume-Weighted" and "Hybrid" candles.
This feature is particularly useful for identifying trends and filtering out market noise, while
backtesting remains based on normal candles to ensure accuracy.
7.Intra-Bar Calculation for Granular Insights
When enabled, the intra-bar calculation feature provides granular insights into price
movements within each bar, offering traders a deeper understanding of market dynamics.
This feature also modifies the algorithm's logic, triggering alerts on every tick rather than just
on bar close, making it ideal for scalpers and day traders who need ultra-responsive tools.
8.Take-Profit/Trailing-Profit Tools: Precision and Flexibility
This feature allows you to set multiple profit levels with customizable percentage
distances, giving you unparalleled control over your trades.
Selectable Type of exit mode : Take-Profit or Trailing-Profit.
Selectable Number of Profit Levels: Define as many profit targets as you need,
ensuring you can capture profits at different stages of price movement.
Percentage-Based Distance: Set each profit level based on a percentage distance from
your entry point. This ensures precise positioning tailored to your risk-reward preferences.
Integrated Alerts: Never miss an opportunity! The tool includes built-in alerts that notify you
when each take-profit level is reached, keeping you informed in real-time.
9.Optimized Visualization
The script ensures optimized visualization of trend strength through smooth transitions in
candle transparency, making it easier to interpret market momentum.
The feed speed parameter calculates how quickly the candle coloring adjusts relative to the
trailing stop, enhancing clarity and decision-making.
How it work
Identify the Primary Trend Using Multi-Timeframe Analysis :
Focus on Higher Timeframes : Start by analyzing the 4h, 8h, or 24h timeframes to determine the primary trend. These higher timeframes provide a clearer picture of long-term momentum.
The built-in table provides real-time updates across all primarly timeframes. Look for confluence—when multiple timeframes align in the same direction.
Confirm Entry Points Using Lower Timeframes :
Fine-Tune Entries with Shorter Timeframes : Once you’ve identified the primary trend, use lower timeframes (e.g., 1m, 5m, or 15m ) to confirm entry points.
Set Take-Profit Levels Based on Percentage Distances :
Customizable Take-Profit Tools : Use the take-profit feature to set multiple levels based on percentage distances from your entry point.
Use Customizable Alerts for Real-Time Updates :
Enable alerts for specific timeframes (e.g., 4h, 8h, 15m) to stay informed about changes in the primary trend or short-term opportunities.
For fast-moving markets, enable the intra-bar calculation feature to receive alerts on every tick, ensuring you don’t miss critical entries or exits.
Backtesting for Strategy Optimization :
Performance Metrics : Use the backtesting metrics table to evaluate how well your trend-following strategy performs over time. Analyze win rates, profit factor, and best/worst trades to refine your approach.
Adjust Inputs : Fine-tune settings like slippage and commission(%) to optimize the indicator for your prefer pair.
Please Note:
This indicator is provided for informational and educational purposes only. It is not financial advice, and it should not be considered a recommendation to buy, sell, or trade any financial instrument. Trading involves significant risks, including the potential loss of your entire investment. Always conduct your own research and consult with a licensed financial advisor before making any trading decisions.
The results and images provided are based on algorithms and historical/paid real-time market data but do not guarantee future results or accuracy. Use this tool at your own risk, and understand that past performance is not indicative of future outcomes.
BTC/ETH Lot Size for Dexin - V1.0
█ Overview - This tool is specifically tailored for Delta Exchange India’s users.
I use this interactive tool before taking a position in the BTC’s futures perpetual market . With only 3 mouse clicks, I see all the necessary information, whether a Long or Short position.
A visual of Liquidation Price Level, Stop Loss Price Level, Entry Price Level, Break-even Price Level, and Take Profit Price Level can be immediately seen.
On the top right corner of the chart, which Leverage is to be used, No. of Lots to be taken, expected Profit amount, Loss amount, Brokerage Fees, Risk to Reward Ratios, and Return on Investment are shown, excluding brokerage travel. To get the correct answer in the table that suits your account and risk-taking appetite, the user needs to enter the account balance and Risk per trade.
It also does live tracking of the position, and alerts can be configured too.
█ How to Use
Load the indicator on an active chart.
In the Trading View, ensure that the Magnets is enabled (on the left panel). This will precisely select the price levels you want to choose from OHLC for a candle.
When you first load the tool on the bottom of the chart, you will see a blue box with text in white color guiding you on what you need to do.
Before the first click, the box shall prompt “On the signal candle, set the entry level, where the position would be executed”.
Once the entry price level is selected, the next prompt in the blue box shall be “Set the stop loss level where the position would be exited”. Thus, you need to click the stop loss price level.
Now that the two clicks of Entry and Stop Loss are already done, the last remaining is for the take profit. The last prompt shall be “Set the profit level where the position would be exited”. Therefore, you need to select your take-profit level
Finally, when all three points are selected, the tool shall draw trade zones.
The tool automatically determines whether it is a Long Position or Short Position from the Stop loss and take-profit price levels concerning the entry price level
If the take profit level is above the entry price, the stop must be below, and vice versa; otherwise, an error occurs.
You can change levels by dragging the handles that appear when you select the indicator, or by entering new values in the settings.
Once the position tool is on a chart, it will appear at the same levels on all symbols you use.
If you select the position tool on your chart and delete it, this will also delete the indicator from the chart. You will need to re-add it if you want to draw another position tool. You can add multiple instances of the indicator if you need a position tool on more than one of your charts.
█ Features
Display
The tool displays the following information as graphical visuals
The Liquidation to Stop Loss, Stop Loss to Entry, Entry to Break-even, and Entry to Take Profit zones shall be initiated from the entry candle point.
If you want to be from the candle that crossed the level at a different time from the entry candle, you may go to the settings and adjust the time accordingly. Please note that the time interval is 15 minutes, so at times you may not be able to see the graphical display; however, once the 15-minute time interval is over, you will see the graphical display on the chart.
The tool displays the following information in a tabulated manner
The first row indicates the Leverage that is best suited. The leverage selection by default is greater than or equal to the risk distance.
The second row indicates the number of lots that is computed in relation to the account balance, Risk appetite, Entry price, and Stop Loss price.
The third row indicates estimated profit considering taker's fees and is computed in relation to the number of Lots, Entry price, and Take-Profit price.
The fourth row indicates estimated loss considering taker's fees and is computed in relation to the number of Lots, Entry price, and Stop Loss price.
The fifth row indicates the actual Risk to Reward Ratio, ignoring the travel that pertains to fees.
The sixth row indicates actual Return on Investment, ignoring the travel that pertains to fees.
The intent is to allow the user to make an informed decision prior to taking a position by seeing “$/Rs.” or “% of R O I” or “R : R”.
In case the user wants to know beforehand what the expected charges are that need to be borne before taking a position, that too is made available in the seventh and eighth rows. Both sides' charges are made available for ready reference, irrespective of the outcome of the trade, the user knows the consequences beforehand.
█ Settings
'Trade Sizing'
The tool's input menu is divided into various parts. The first part is 'Trade Sizing'. The user needs to key in the exact number that appears in the Delta Exchange India account against 'Account Balance ($)'. The second thing the user needs to do is key in the 'Risk per Trade'. By default,t it is set to 0.25 and has a default stop change of 0.25. Alternatively, the user can key in any number (Whole number or Rational number) within 100 if that suits their risk management criterion.
'Trade Levels'
Allows users to manually set the Entry, Time, Stop Loss, and Take Profit Price Levels.
'Aggressive Mode Selection'
As the Liquidation zone is shown on the chart, if the user feels that the liquidation price level is too far from the stop loss, this option of 'Use Aggressive Leverage?' allows to increase the leverage, thus reducing the investment amount and in return increasing the Return on Investment %.
The second option in this category is 'Compute Lots based on invested Margin?' itself is self-explanatory, and thus the tabulated data shall be populating the data based on the number entered by the user against 'Margin to be invested ($)'. It is for the user to ensure that the estimated outcomes are within their risk management criterion.
'Conversion & Charges'
If the user wants to see the Profit, Loss, and Fees amount in 'Rs.', all that needs to be done is simply enable the 'Show P&L in Rs.?' The conversion shall take place considering 1 USD = 85 Rs. Same as that carried out by Delta Exchange India.
If the user wants to see the Brokerage Fees, all that needs to be done is simply enable the 'Show Brokerage Fees?'. On enabling this, the table shall show Profitable Trade's (PT) Fees and Lost Trade's (LT) Fees irrespective of the outcome of the trade. The intent is to allow the user to make informed decisions to avoid regrets or surprises at the end of the trade.
'Table'
The division of the input section is related to table position, font size and colors for text and background.
█ Alerts
Alerts can be configured by clicking 'More' (the three dots that appear when you place the cursor on the indicator title that appears on the top left corner of the chart). Alternatively, one can configure alerts by right-clicking on either of the two price levels - Stop Loss price level or Take Profit Price level. Upon right clicking, a window shall appear and the topmost line on that window shall display 'Add alert on ……….' The user can thus put alerts on either of the key levels, such as Stop Loss, Take Profit, and Break Even, or on all of them one by one.

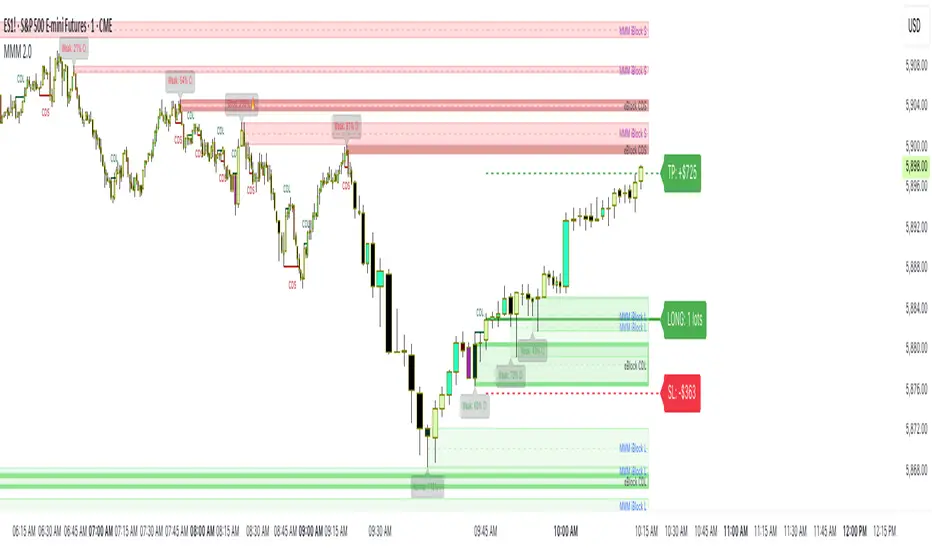
MMM @MaxMaserati 2.0MMM @MaxMaserati 2.0 - TradingView Indicator
The Backbone of the Max Maserati Method
The MMM @MaxMaserati 2.0 indicator is the core of the proprietary Max Maserati Method (MMM), a trading system designed to decode institutional price action. It integrates candle bias analysis, market structure identification, volume-based signals, and precise entry zones to align traders with smart money.
Core Components of the MMM System
1. Six Core Candle Classifications
Master these patterns to reveal institutional behavior:
Bullish Body Close: Closes above previous high, signaling strong buying.
Bearish Body Close: Closes below previous low, indicating intense selling.
Bullish Affinity: High tests previous low, closes within range, showing hidden bullish strength.
Bearish Affinity: Low tests previous high, closes within range, reflecting bearish pressure.
Seek & Destroy: Breaks both previous high/low, closes inside, direction depends on close.
Close Inside: High/low within previous range, bias based on close.
2. Plus/Minus Strength System
Quantifies candle conviction:
Bullish Strength: Low to close distance.
Bearish Strength: High to close distance.
Plus (+): Dominant strength signals strong follow-through.
Minus (-): Balanced strengths suggest caution.
3. PO4 Candles (Power of OHLC (4))
Analyzes OHLC for body-closed candles after swing high/low fractals:
C2: Body close above high/below low post fractal with strength conditions.
C3: Stronger body close with pronounced low/high breakouts.
C4: Body close which show strength and might trigger a BeB/BuB
Visualization: Green (bullish), purple (bearish) bars; triangle markers for fractals.
4. MC2 (High Volume Reversal Candles)
High buy/sell volume candles reversed by opposing volume:
Bullish MC2: Buy volume flipped by sell volume, signaling exhaustion.
Bearish MC2: Sell volume flipped by buy volume, indicating reversal.
Visualization: Dark green (bullish), dark red (bearish) bars.
5. MMM Blocks (eBlocks and iBlocks)
Marks institutional order blocks:
External Blocks (eBlocks): At market structure changes (MSC), labeled BuB/BeB.
Internal Blocks (iBlocks): Within trends, labeled L/S.
Volume: Normalized with indicators (🔥 high, ↑ above average, ↓ low).
Filters: Discount (0-50), premium (50-100), extreme (0-20, 80-100), mid-range (20-50, 50-80).
6. Entry Blocks - Specific Entry Areas
Entry Blocks are precise zones for framing trades based on the MMM system, triggered post-MSC to capitalize on institutional momentum:
Purpose: Pinpoint high-probability entry areas following a Market Structure Change (MSC), aligning with smart money direction.
Formation:
MMM Entry Block Long: Forms after a bullish MSC (BuB), typically at the swing low (e.g., lowerValueMSC) of the fractal pattern, marking a long entry zone.
MMM Entry Block Short: Forms after a bearish MSC (BeB), typically at the swing high (e.g., upperValueMSC), marking a short entry zone.
Styles :
Close-to-Swing High/Low: Box drawn from the candle’s close to the swing high/low level, emphasizing the fractal pivot.
High/Low-to-Close: Box drawn from the candle’s high/low to its close, capturing the full price action range.
Visualization:
Labeled “MMM Entry Block Long” (cyan background/border) or “Short” (pink background/border).
Includes a dashed midline for reference.
Volume displayed if enabled, normalized with markers (🔥 >150%, ⚡ >120%, ❄️ <70%).
Behavior:
Deletes when price touches the level (On Level Touch) or closes beyond it (On Candle Close)
Limited to a configurable number ( default 5) to avoid clutter.
Trade Framing:
Entry: Enter within the eBreak box, ideally on a pullback or confirmation candle aligning with MMM bias (e.g., Bullish Body Close or Affinity).
Stop-Loss: Placed below the eBreak low (bullish) or above the high (bearish), leveraging the swing level as support/resistance.
Take-Profit: Targets higher timeframe high (bullish) or low (bearish), with ratio (default 2.0) for risk-reward.
MMM Integration: Use candle bias (Plus/Minus), PO4 signals, and MMPD consensus to confirm entry direction and strength.
Significance: eBreaks frame trades by isolating institutional entry points post-MSC, reducing noise and enhancing precision.
7. Market Structure Change (MSC)
Tracks structure shifts:
Detection: Fractal highs/lows with adjustable candle count.
Visualization: Green (BuB), red (BeB) lines/labels; numbered breaks (Bub1/Beb1).
Counter: Tracks consecutive MSCs for trend strength.
8. MMPD (Market Momentum Price Delivery)
Analyzes momentum/trend:
Conditions: Red (bearish), Green (bullish), Pink (modifying bearish), Pale Green (modifying bullish).
Traps: Flags bullish/bearish traps when MMPD conflicts with body close.
Metrics: SuperMaxTrend, momentum (K/D), MMPD level.
Consensus: Rated signals (e.g., “Very Strong Buy ★★★★★”).
9. Trade and Risk Management
Disciplined trading:
Entry Visualization: Entry, stop-loss, take-profit lines/labels with customizable risk (riskAmount, default $50) and reward (ratio).
Behavior: Shows last/all entries, removes on MSC shift or breach.
Text Size: Tiny, Small, Normal.
NB: The Trade and risk management is to use with caution, it is not fully implemented yet.
10. Stats Table
Real-time dashboard:
Elements: Timeframe, symbol, candle bias, strength, MMPD, momentum, SuperMaxTrend, MMPD level, volume, consensus, divergence, delta MA, price delivery, note (“Analyze | Wait | Repeat”).
Customization: Position, size, element visibility.
Colors: Green (bullish), red (bearish), orange (warnings), gray (neutral).
11. Delta MA and Divergence
Monitors volume delta:
Delta MA: Smoothed delta with direction arrows (↗↘→).
Divergence: Flags MMPD-momentum divergences (⚠️).
Key Features
Automated Analysis: Detects PO4, MSC, blocks, MC2, Entry Block via OHLC.
Color-Coded Visualization: Bars, lines, table cells reflect bias/strength.
Dynamic Bias Lines: Higher timeframe high/low lines with labels.
Volume Analysis: Normalized volume across blocks, entries, MC2.
Flexible Filters: Tailors block/entry Block display to strategies.
Real-Time Metrics: Tracks strength, delta, trend points.
Trading Advantages
Institutional Insight: Decodes manipulation via OHLC and volume.
Early Reversals: Spots shifts via PO4, MC2, MSC, Entry Blocks.
Precise Entries: entry block frame high-probability trades.
Robust Risk Management: Stop-loss, take-profit, risk-reward.
Simplified Complexity: Actionable signals from complex action.
Profit Target Framework
Bullish: Higher timeframe high.
Bearish: Higher timeframe low.
Plus Strength: Direct move.
Minus Strength: Pullbacks expected.
Entry Blocks/MSC-Driven: Entry anchor entries to MSC targets.
Trader’s Mantra
“Analyze | Wait | Repeat” - Discipline drives profits.
The MMM @MaxMaserati 2.0 indicator, with Entry Blocks as specific trade-framing zones, offers a professional-grade framework for precise, institutional-aligned trading.
Note: Based on the proprietary Max Maserati Method for educational and analytical use.
Risk Calculator Manual Only### Indicator Name: Risk Calculator Manual Only
Description:
This indicator is designed for manual risk and position size calculation. It helps traders manage risk per trade by clearly displaying key trade parameters on the chart in an easy-to-read table format. The indicator does not auto-calculate entry, stop, or target prices—all values must be entered manually, giving full control to the trader.
Key Features:
- Manual input only: Users manually enter the entry price, stop-loss, and take-profit levels.
- On-chart data table: Displays all calculated metrics in a compact, color-coded table:
- Trade Type: Long or Short, selectable in settings.
- Entry Price, Stop-Loss, Take-Profit: Entered by the user.
- Position Size ($): Automatically calculated based on your risk amount and stop-loss distance.
- Profit ($): Potential profit based on take-profit level.
- Loss ($): Potential loss based on stop-loss level.
- Color coding:
- Profit row is highlighted in green.
- Loss row is highlighted in red.
- Alerts: Optional alerts when price hits the stop-loss or take-profit levels.
How to Use:
1. Enter your planned entry price, stop-loss, and take-profit in the indicator settings.
2. Set your risk amount per trade (in USD).
3. The indicator will calculate the appropriate position size, potential profit, and loss, and display them in a visual table.
4. Enable alerts if you want to be notified when price reaches your stop-loss or take-profit.
Benefits:
- Helps enforce disciplined risk management.
- Visual feedback on key trade metrics, directly on the chart.
- Fast, manual trade planning with no automation—ideal for discretionary traders.
- Supports both long and short trade types.
Notes:
- This tool assumes accurate manual input. It does not auto-detect price levels.
- Best used by traders who prefer full control over their risk setup and calculations.
---------------------------------------------------------

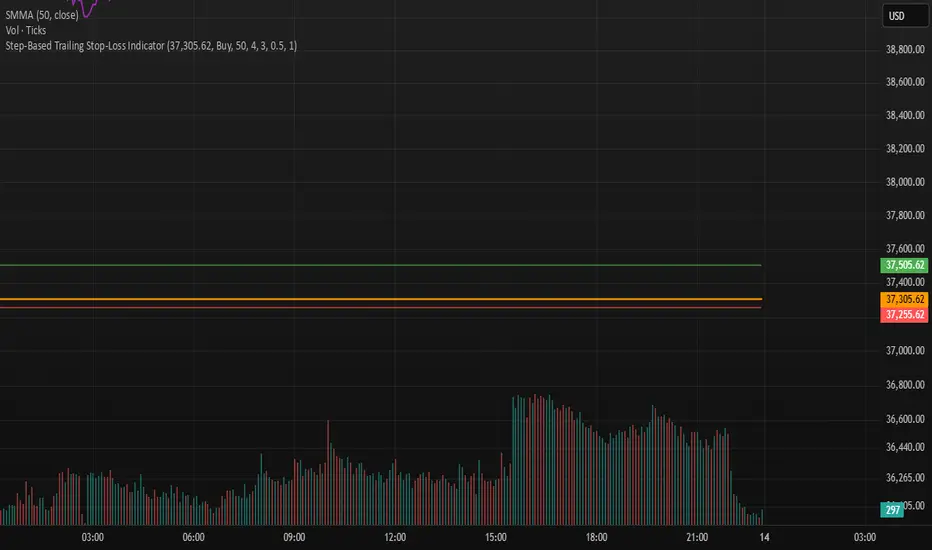
Step-Based Trailing Stop-Loss IndicatorThis indicator is built for momentum traders who want to maximize winning trades and minimize losses through a smart, step-based trailing stop-loss system. Instead of using a fixed Take Profit, this tool dynamically protects profits once the trade reaches a favorable RR (Risk-to-Reward) level.
How It Works:
Manual Entry Input
You enter your Entry Price and select Buy/Sell in the settings.
This flexibility allows backtesting or live trade tracking.
Initial Setup
Default SL: 50 ticks(Tested on us30,but works on any pair you just need to adjust SL)
TP for reference: 4R — can be used for benchmarking, but we don't limit profits with a hard TP.
Trailing Logic
Once price reaches 3R in profit:
The SL begins trailing.
It starts at 2R, keeping a 1R cushion behind the max profit.
For every 0.5R gain, SL also moves up by 0.5R:
Example: At 3.5R → SL is at 2.5R
At 5.0R → SL is at 4.0R
This trailing continues until the SL is hit or the trend exhausts.
Chart Features
🟧 Entry Line
🔴 Initial SL
🟢 Reference TP (4R, optional)
🟣 Dynamic Trailing SL
🏷️ Labels for Entry & SL levels
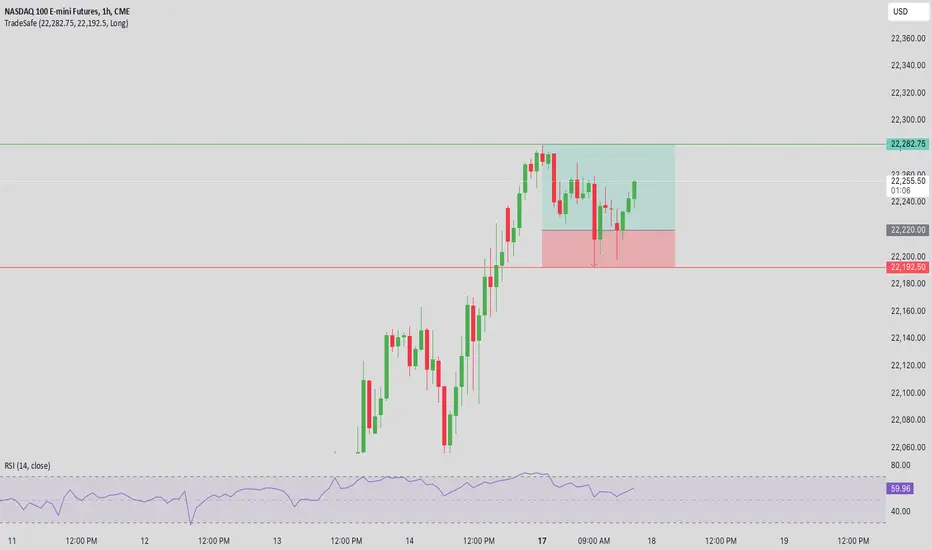
Trade SafeTrade Safe: The Ultimate Discipline Tool for Traders
Are you tired of overtrading, revenge trading, or letting emotions ruin your trading plan? Trade Safe is here to transform your trading psychology and help you achieve consistent profitability. Unlike traditional indicators that focus solely on market analysis, Trade Safe addresses the number one reason traders fail: lack of discipline.
With its innovative features, Trade Safe enforces strict trading rules, prevents emotional decision-making, and helps you stick to your plan—no matter how volatile the markets get. If you're serious about becoming a disciplined and profitable trader, this is the tool you've been waiting for.
Enforces Trading Discipline:
Trade Safe ensures you stick to your daily trading plan by visually blocking your charts after a predetermined number of trades or a stop-loss, Take profit event.
No more overtrading or deviating from your strategy—Trade Safe keeps you in check.
Eliminates Emotional Trading:
The screen block feature prevents you from seeing the candles after a loss, helping you avoid the emotional spiral of "tilt" and revenge trading.
This unique approach focuses on the psychological side of trading, which is often overlooked by other tools.
Simple and Intuitive Interface:
Easily set your stop-loss and take-profit level with the red line marker for stop-loss and green for take-profit and choose between long or short positions with just a few clicks.
Trade Safe is designed to be user-friendly, so you can focus on trading without distractions.
Customizable for All Trading Styles:
Whether you're a scalper, swing trader, or long-term investor, Trade Safe can be tailored to fit your strategy.
Set your stop-loss and take-profit, and let Trade Safe handle the rest.
Prevents Revenge Trading:
By locking your screen after a stop-loss, Trade Safe eliminates the temptation to "make back" losses through impulsive trades.
This helps you break the cycle of emotional trading and stay focused on your long-term goals.
Builds Healthy Trading Habits:
Trade Safe encourages you to walk away after a loss, reinforcing the importance of patience and discipline.
SL Hunting Detector📌 Step 1: Identify Liquidity Zones
The script plots high-liquidity zones (red) and low-liquidity zones (green).
These are areas where big players target stop-losses before reversing the price.
Example:
If price is near a red liquidity zone, expect a potential stop-loss hunt & reversal downward.
If price is near a green liquidity zone, expect a potential stop-loss hunt & reversal upward.
📌 Step 2: Watch for Stop-Loss Hunts (Fakeouts)
The indicator marks stop-loss hunts with red (bearish) or green (bullish) arrows.
When do stop-loss hunts occur?
✅ A long wick below support (with high volume) = Stop hunt before reversal upward.
✅ A long wick above resistance (with high volume) = Stop hunt before reversal downward.
Confirmation:
Volume must spike (volume > 1.5x the average volume).
ATR-based wicks must be longer than usual (showing a stop-hunt trap).
📌 Step 3: Enter a Trade After a Stop-Hunt
🔹 Bullish Trade (Buying a Dip)
If a green arrow appears (stop-hunt below support):
✅ Enter a long (buy) trade at or just above the wick’s recovery level.
✅ Stop-loss: Below the wick’s low (avoid getting hunted again).
✅ Take-profit: Next resistance level or mid-range of the liquidity zone.
🔹 Bearish Trade (Shorting a Fakeout)
If a red arrow appears (stop-hunt above resistance):
✅ Enter a short (sell) trade at or just below the wick’s rejection level.
✅ Stop-loss: Above the wick’s high (avoid getting stopped out).
✅ Take-profit: Next support level or mid-range of the liquidity zone.
📌 Step 4: Set Alerts & Automate
✅ The indicator triggers alerts when a stop-hunt is detected.
✅ You can set TradingView to notify you instantly when:
A bullish stop-hunt occurs → Look for long entry.
A bearish stop-hunt occurs → Look for short entry.
📌 Example Trade Setup
Example (BTC Long Trade on Stop-Hunt)
BTC is near $40,000 support (green liquidity zone).
A long wick drops to $39,800 with a green arrow (bullish stop-hunt signal).
Volume spikes, and price recovers quickly back above $40,000.
Trade entry: Buy at $40,050.
Stop-loss: Below wick ($39,700).
Take-profit: $41,500 (next resistance).
Result: BTC pumps, stop-loss remains safe, and trade profits.
🔥 Final Tips
Always wait for confirmation (don’t enter blindly on signals).
Use higher timeframes (15m, 1H, 4H) for better accuracy.
Combine with Order Flow tools (like Bookmap) to see real liquidity zones.
🚀 Now try it on TradingView! Let me know if you need adjustments. 📈🔥

High-Probability IndicatorExplanation of the Code
Trend Filter (EMA):
A 50-period Exponential Moving Average (EMA) is used to determine the overall trend.
trendUp is true when the price is above the EMA.
trendDown is true when the price is below the EMA.
Momentum Filter (RSI):
A 14-period RSI is used to identify overbought and oversold conditions.
oversold is true when RSI ≤ 30.
overbought is true when RSI ≥ 70.
Volatility Filter (ATR):
A 14-period Average True Range (ATR) is used to measure volatility.
ATR is multiplied by a user-defined multiplier (default: 2.0) to set a volatility threshold.
Ensures trades are only taken during periods of sufficient volatility.
Entry Conditions:
Long Entry: Price is above the EMA (uptrend), RSI is oversold, and the candle range exceeds the ATR threshold.
Short Entry: Price is below the EMA (downtrend), RSI is overbought, and the candle range exceeds the ATR threshold.
Exit Conditions:
Take Profit: A fixed percentage above/below the entry price.
Stop Loss: A fixed percentage below/above the entry price.
Visualization:
The EMA is plotted on the chart.
Background colors highlight uptrends and downtrends.
Buy and sell signals are displayed as labels on the chart.
Alerts:
Alerts are triggered for buy and sell signals.
How to Use the Indicator
Trend Filter:
Only take trades in the direction of the trend (e.g., long in an uptrend, short in a downtrend).
Momentum Filter:
Look for oversold conditions in an uptrend for long entries.
Look for overbought conditions in a downtrend for short entries.
Volatility Filter:
Ensure the candle range exceeds the ATR threshold to avoid low-volatility trades.
Risk Management:
Use the built-in take profit and stop loss levels to manage risk.
Optimization Tips
Backtesting:
Test the indicator on multiple timeframes and assets to evaluate its performance.
Adjust the input parameters (e.g., EMA length, RSI length, ATR multiplier) to optimize for specific markets.
Combination with Other Strategies:
Add additional filters, such as volume analysis or support/resistance levels, to improve accuracy.
Risk Management:
Use proper position sizing and risk-reward ratios to maximize profitability.
Disclaimer
No indicator can guarantee an 85% win ratio due to the inherent unpredictability of financial markets. This script is provided for educational purposes only. Always conduct thorough backtesting and paper trading before using any strategy in live trading.
Let me know if you need further assistance or enhancements!

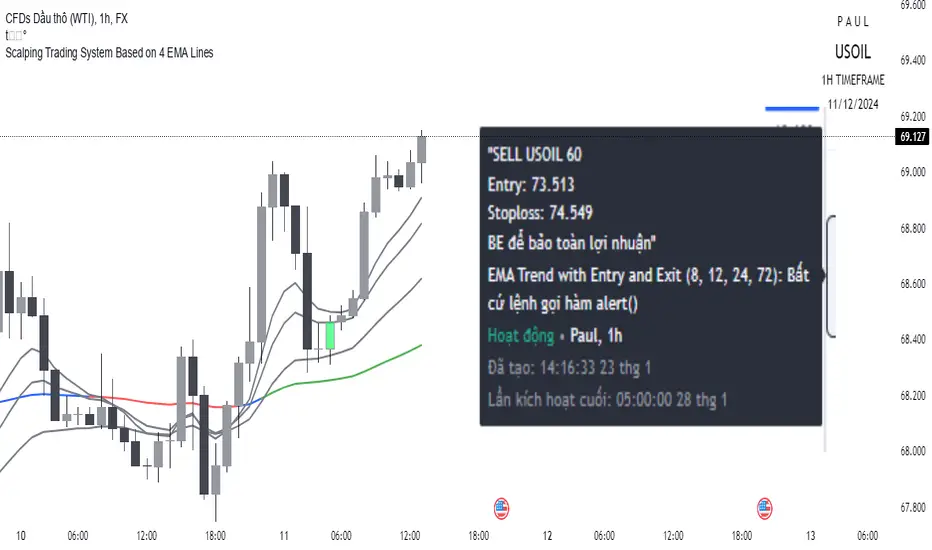
Scalping trading system based on 4 ema linesScalping Trading System Based on 4 EMA Lines
Overview:
This is a scalping trading strategy built on signals from 4 EMA moving averages: EMA(8), EMA(12), EMA(24) and EMA(72).
Conditions:
- Time frame: H1 (1 hour).
- Trading assets: Applicable to major currency pairs with high volatility
- Risk management: Use a maximum of 1-2% of capital for each transaction. The order holding time can be from a few hours to a few days, depending on the price fluctuation amplitude.
Trading rules:
Determine the main trend:
Uptrend: EMA(8), EMA(12) and EMA(24) are above EMA(72).
Downtrend: EMA(8), EMA(12) and EMA(24) are below EMA(72).
Trade in the direction of the main trend** (buy in an uptrend and sell in a downtrend).
Entry conditions:
- Only trade in a clearly trending market.
Uptrend:
- Wait for the price to correct to the EMA(24).
- Enter a buy order when the price closes above the EMA(24).
- Place a stop loss below the bottom of the EMA(24) candle that has just been swept.
Downtrend:
- Wait for the price to correct to the EMA(24).
- Enter a sell order when the price closes below the EMA(24).
- Place a stop loss above the top of the EMA(24) candle that has just been swept.
Take profit and order management:
- Take profit when the price moves 20 to 40 pips in the direction of the trade.
Use Trailing Stop to optimize profits instead of setting a fixed Take Profit.
Note:
- Do not trade within 30 minutes before and after the announcement of important economic news, as the price may fluctuate abnormally.
Additional filters:
To increase the success rate and reduce noise, this strategy uses additional conditions:
1. The price is calculated only when the candle closes (no repaint).
2. When sweeping through EMA(24), the price needs to close above EMA(24).
3. The closing price must be higher than 50% of the candle's length.
4. **The bottom of the candle sweeping through EMA(24) must be lower than the bottom of the previous candle (liquidity sweep).
---
Alert function:
When the EMA(24) sweep conditions are met, the system will trigger an alert if you have set it up.
- Entry point: The closing price of the candle sweeping through EMA(24).
- Stop Loss:
- Buy Order: Place at the bottom of the sweep candle.
- Sell Order: Place at the top of the sweep candle.
---
Note:
This strategy is designed to help traders identify profitable trading opportunities based on trends. However, no strategy is 100% guaranteed to be successful. Please test it thoroughly on a demo account before using it.
CHAKRA RISS ENGULFING CANDLESTICK STRATEGYChakra RISS Engulfing Candlestick Strategy
Type: Technical Indicator & Strategy
Platform: TradingView
Script Version: Pine Script v6
Overview:
The Chakra RISS Engulfing Candlestick Strategy combines a momentum-based approach using the Relative Strength Index (RSI) with Engulfing Candlestick Patterns to generate buy and sell signals. The strategy filters trades based on price movement relative to a 50-period Simple Moving Average (SMA), making it a trend-following strategy.
The indicator uses color-coded bars to visually represent market conditions, helping traders easily identify bullish and bearish trends. The strategy is designed to be dynamic, adapting to changing market conditions and filtering out noise using key technical indicators.
How It Works:
RSI-Based Color Conditions:
Green Bars: When the RSI crosses above a specified UpLevel (default: 50), indicating a bullish momentum and signaling potential buy conditions.
Red Bars: When the RSI crosses below a specified DownLevel (default: 50), indicating a bearish momentum and signaling potential sell conditions.
Buy Signal:
Triggered when the following conditions are met:
RSI crosses from below the UpLevel (default: 50) to above it, signaling increasing bullish momentum.
The close price is above the 50-period Simple Moving Average (SMA), confirming an uptrend.
The Buy Signal is plotted below the bar with a green arrow and a "BUY" label.
Sell Signal:
Triggered when the following conditions are met:
RSI crosses from above the DownLevel (default: 50) to below it, signaling increasing bearish momentum.
The close price is below the 50-period Simple Moving Average (SMA), confirming a downtrend.
The Sell Signal is plotted above the bar with a red arrow and a "SELL" label.
Stop Loss and Take Profit:
For long trades (buy signals), the stop loss is placed below the previous bar's low, and the take profit is set at 3% above the entry price.
For short trades (sell signals), the stop loss is placed above the previous bar's high, and the take profit is set at 3% below the entry price.
Dynamic Bar Coloring:
The bar colors change dynamically based on RSI levels:
Green Bars: Indicating a potential uptrend (bullish).
Red Bars: Indicating a potential downtrend (bearish).
These visual cues help traders quickly identify market trends and potential reversals.
Trend Filtering:
The 50-period Simple Moving Average (SMA) is used to filter trades based on the overall market trend:
Buy signals are only considered when the price is above the moving average, indicating an uptrend.
Sell signals are only considered when the price is below the moving average, indicating a downtrend.
Alerting System:
Alerts can be set for both buy and sell signals. These alerts notify traders in real-time when potential trades are generated, allowing them to act promptly.
Alerts can be configured to send notifications through email, SMS, or a webhook for integration with other services like IFTTT or Zapier.
Key Features:
RSI and Moving Average-Based Signals: Combines RSI with a moving average for more accurate trade signals.
Stop Loss and Take Profit: Dynamic risk management with custom stop loss and take profit levels based on previous high and low prices.
Buy and Sell Alerts: Provides real-time alerts when a buy or sell signal is triggered.
Trend Confirmation: Uses the 50-period Simple Moving Average to filter signals and confirm the direction of the trend.
Visual Bar Color Changes: Makes it easy to identify bullish or bearish trends with color-coded bars.
Usage:
This strategy is suitable for traders who prefer a trend-following approach and want to combine momentum indicators (RSI) with price action (Engulfing Candlestick patterns). It is particularly useful in volatile markets where quick identification of trend changes can lead to profitable trades.
Best Used For: Day trading, swing trading, and trend-following strategies.
Timeframes: Works well on various timeframes, from 1-minute charts for scalping to daily charts for swing trading.
Markets: Can be applied to any market with sufficient liquidity (stocks, forex, crypto, etc.).
Settings:
UpLevel: The RSI level above which the market is considered bullish (default: 50).
DownLevel: The RSI level below which the market is considered bearish (default: 50).
SMA Length: The period of the Simple Moving Average used to filter trades (default: 50).
Risk Management: Customizable stop loss and take profit settings based on price action (default: 3% above/below the entry price).

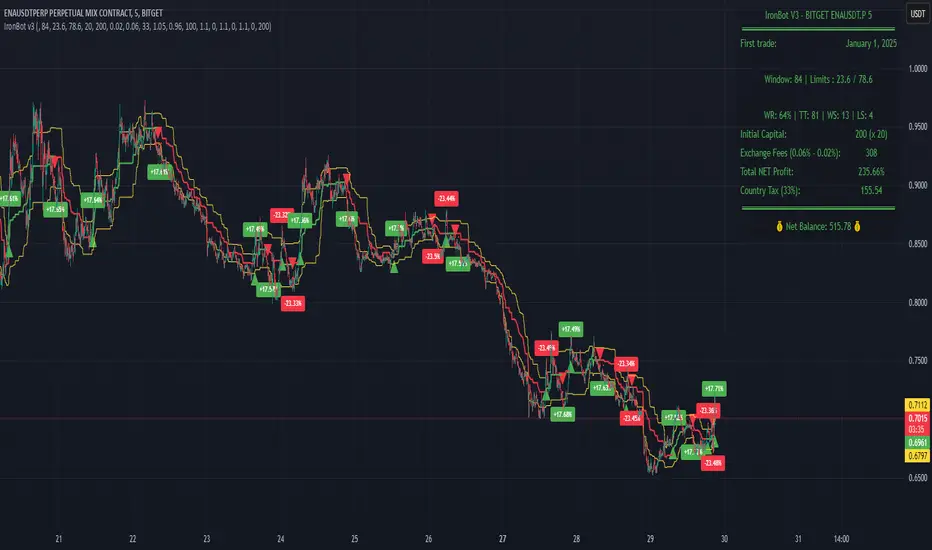
IronBot v3Introduction
IronBot V3 is a TradingView indicator that analyzes market trends, identifies potential trading opportunities, and helps manage trades by visualizing entry points, stop-loss levels, and take-profit targets.
How It Works
The indicator evaluates price action within a specified analysis window to determine market trends. It uses Fibonacci retracement levels to identify key price levels for trend detection and trading signals. Based on user-defined inputs, it calculates and displays trade levels, including entry points, stop-loss, and multiple take-profit levels.
Trend Definition:
The highest high and lowest low are calculated over a specified number of candles.
The price range is determined as the difference between the highest high and lowest low.
Three Fibonacci levels are calculated within this range:
- Fib Level 0.236
- Trend Line (0.5 level)
- Fib Level 0.786
Determining Long and Short Conditions:
Long Conditions (Buy):
The closing price must be above both the trend line (0.5 level) and the Fib Level 0.236.
Additionally, the market must not currently be in a bearish trend.
Short Conditions (Sell):
The closing price must be below both the trend line and the Fib Level 0.786.
The market must not currently be in a bullish trend.
Trend State Updates:
When a condition is met, the indicator sets the trend to bullish or bearish and turns off bearish or bullish trend conditions.
If neither buy nor sell conditions are met, the trend remains unchanged, and no new trade signals are generated.
Inputs and Their Role in the Algorithm
General Settings
Analysis Window: Specifies the number of historical candles to analyze. This influences the calculation of key levels such as highs and lows, which are critical for determining Fibonacci retracement levels.
First Trade: Defines the start date for generating trading signals.
Trade Configuration
Display TP/SL: Enables or disables the visualization of take-profit and stop-loss levels on the chart.
Leverage: Defines the leverage applied to trades for risk and position size calculations.
Initial Capital: Specifies the starting capital, which is used for calculating position sizes and profits.
Exchange Fees (%): Sets the percentage of fees applied by the exchange, which is factored into profit calculations.
Country Tax (%): Allows users to define applicable taxes, which are subtracted from net profits.
Stop-Loss Configuration
Break Even: Toggles the break-even functionality. When enabled, the stop-loss level adjusts dynamically as take-profit levels are reached.
Stop Loss (%): Defines the percentage distance from the entry price to the stop-loss level.
Take-Profit Settings
The indicator supports up to four take-profit levels:
- TP1 through TP4 Ratios: Specify the price levels for each take-profit target as a percentage of the entry price.
- Profit Percentages: Allocate a percentage of the position size to each take-profit level.
Visualization Elements
Trend Indicators: Displays Fibonacci-based trend lines and markers for bullish or bearish conditions.
Trade Levels: Entry, stop-loss, and take-profit levels are visualized on the chart by dotted lines for clarity. Additionally, a semi-transparent background is applied when a portion of the trade is closed to enhance visualization. Positive profits from a closed trade are green; otherwise, they are red.
Trade Profit Indicator: On each trade, every time a part of the trade is closed (e.g., take profit is reached), the profit indicator will be updated.
Performance Panel: Summarizes key account statistics, including net balance, profit/loss, and trading performance metrics.
Usage Guidelines
Add the indicator to your TradingView chart.
Configure the input settings based on your trading strategy.
Use the displayed levels and trend signals to make informed trading decisions.
Contact
For further assistance, including automation inquiries, feel free to contact me through TradingView’s messaging system.
Purpose and Disclaimer
IronBot V3 is designed for educational purposes and to assist in analyzing market trends. It is not financial advice, and users should perform their own due diligence before making any trading decisions.
Trading involves significant risk, and past performance is not indicative of future results. Use this indicator responsibly.
AlphaEdge Crypto Tracker [CHE]AlphaEdge Crypto Tracker
Efficiently Identify Top Performers and Underperformers Among 40 Crypto Assets at a Glance
In the fast-paced world of cryptocurrency trading, staying ahead requires the ability to quickly assess the performance of multiple assets simultaneously. AlphaEdge Crypto Tracker is an advanced Pine Script™ indicator designed for TradingView that empowers traders to effortlessly monitor and evaluate 40 different crypto assets in real-time.
This tool is my Christmas gift to all traders. I wish you all a Merry Christmas and successful trades in the coming year!
Why It’s Important to Identify Winners and Losers Among 40 Assets at a Glance:
1. Time Efficiency: Managing a diverse portfolio can be overwhelming. With AlphaEdge Crypto Tracker, traders can swiftly identify which assets are performing exceptionally well (winners) and which are underperforming (losers) without the need to analyze each asset individually.
2. Informed Decision-Making: By having a clear overview of top gainers and losers, traders can make strategic decisions such as reallocating investments, taking profits, or cutting losses, thereby optimizing their trading strategies.
3. Risk Management: Quickly spotting underperforming assets helps in mitigating potential losses and adjusting positions to maintain a balanced and profitable portfolio.
4. Opportunity Identification: Recognizing top-performing assets allows traders to capitalize on emerging trends and maximize their returns by focusing on the most promising opportunities.
Key Features of AlphaEdge Crypto Tracker :
- Comprehensive Asset Tracking: Monitors 40 crypto assets simultaneously, providing a broad view of the market landscape.
- Max Gain and Adjusted Max Loss Calculations: Utilizes a 14-bar (configurable) period to calculate the highest gains and the adjusted maximum losses for each asset, offering insights into potential profitability and risk.
- Dynamic Ranking: Automatically sorts and ranks assets based on their performance, highlighting the top 10 gainers and top 10 losers for easy comparison.
- Customizable Display:
- Table Settings: Adjust the size, position, and colors of the performance table to fit your chart layout.
- Interactive Tooltips: Hover over asset names to view detailed tooltips, enhancing usability and information accessibility.
- Visual Alerts: Changes in asset performance are visually indicated through background color updates, allowing for immediate recognition of significant shifts.
- User-Friendly Interface: Intuitive table layout with clear headers and organized data presentation, making it easy for traders of all levels to interpret the information.
How It Works:
1. Data Calculation: For each of the 40 tracked assets, AlphaEdge Crypto Tracker calculates the maximum gain and adjusted maximum loss over the defined trading period.
2. Sorting and Ranking: The assets are sorted based on their maximum gains and adjusted maximum losses, automatically updating to reflect the latest market movements.
3. Real-Time Display: The top 10 gainers and losers are displayed in a neatly organized table directly on your TradingView chart, providing immediate visual insights.
4. Customization: Users can tailor the tracking period, select specific assets to monitor, and adjust the table’s appearance to match their trading style and preferences.
Conclusion:
AlphaEdge Crypto Tracker is an essential tool for cryptocurrency traders seeking to enhance their market analysis and decision-making processes. By providing a comprehensive and customizable overview of multiple assets, it enables traders to efficiently identify profitable opportunities and manage risks effectively. Whether you’re a seasoned trader or just starting, AlphaEdge Crypto Tracker equips you with the insights needed to navigate the dynamic crypto market with confidence.
Get Started Today:
Integrate AlphaEdge Crypto Tracker into your TradingView setup and take control of your crypto trading strategy with unparalleled clarity and precision.
Disclaimer:
The content provided, including all code and materials, is strictly for educational and informational purposes only. It is not intended as, and should not be interpreted as, financial advice, a recommendation to buy or sell any financial instrument, or an offer of any financial product or service. All strategies, tools, and examples discussed are provided for illustrative purposes to demonstrate coding techniques and the functionality of Pine Script within a trading context.
Any results from strategies or tools provided are hypothetical, and past performance is not indicative of future results. Trading and investing involve high risk, including the potential loss of principal, and may not be suitable for all individuals. Before making any trading decisions, please consult with a qualified financial professional to understand the risks involved.
By using this script, you acknowledge and agree that any trading decisions are made solely at your discretion and risk.
License Information:
This Pine Script™ code is subject to the terms of the Mozilla Public License 2.0. You can view the full license (mozilla.org).
© chervolino

Ultra Trade JournalThe Ultra Trade Journal is a powerful TradingView indicator designed to help traders meticulously document and analyze their trades. Whether you're a novice or an experienced trader, this tool offers a clear and organized way to visualize your trading strategy, monitor performance, and make informed decisions based on detailed trade metrics.
Detailed Description
The Ultra Trade Journal indicator allows users to input and visualize critical trade information directly on their TradingView charts.
.........
User Inputs
Traders can specify entry and exit prices , stop loss levels, and up to four take profit targets.
.....
Dynamic Plotting
Once the input values are set, the indicator automatically plots horizontal lines for entry, exit, stop loss, and each take profit level on the chart. These lines are visually distinct, using different colors and styles (solid, dashed, dotted) to represent each element clearly.
.....
Live Position Tracking
If enabled, the indicator can adjust the exit price in real-time based on the current market price, allowing traders to monitor live positions effectively.
.....
Tick Calculations
The script calculates the number of ticks between the entry price and each exit point (stop loss and take profits). This helps in understanding the movement required for each target and assessing the potential risk and reward.
.....
Risk-Reward Ratios
For each take profit level, the indicator computes the risk-reward (RR) ratio by comparing the ticks at each target against the stop loss ticks. This provides a quick view of the potential profitability versus the risk taken.
.....
Comprehensive Table Display
A customizable table is displayed on the chart, summarizing all key trade details. This includes the entry and exit prices, stop loss and take profit levels, tick counts, and their respective RR ratios.
Users can adjust the table's Position and text color to suit their preferences.
.....
Visual Enhancements
The indicator uses adjustable background shading between entry and stop loss/take profit lines to visually represent potential trade outcomes. This shading adjusts based on whether the trade is long or short, providing an intuitive understanding of trade performance.
.........
Overall, the Ultra Trade Journal combines visual clarity with detailed analytics, enabling traders to keep a well-organized record of their trades and enhance their trading strategies through insightful data.

Marcel's Dynamic Profit / Loss Calculator for GoldOverview
This Dynamic Risk / Reward Tool for Gold is designed to help traders efficiently plan and manage their trades in the volatile gold market. This script provides a clear visualisation of trade levels (Entry, Stop Loss, Take Profit) while dynamically calculating potential profit and loss. It ensures gold traders can assess their positions with precision, saving time and improving risk management.
Key Features
1. Trade Level Visualisation:
Plots Entry (Blue), Stop Loss (Red), and Take Profit (Green) lines directly on the chart.
Helps you visualise and confirm trade setups quickly which is good for scalping and day trades.
2. Dynamic Risk and Reward Calculations:
Calculates potential profit and loss in real time based on user-defined inputs such as position size, leverage, and account equity.
Displays a summary panel showing risk/reward metrics directly on the chart.
3. Customisable Settings:
Allows you to adjust key parameters like account equity, position size, leverage, and specific price levels for Entry, Stop Loss, and Take Profit.
Defaults are dynamically generated for convenience but remain fully adjustable for flexibility.
How It Works
The script uses gold-specific conventions (e.g., 1 lot = 100 ounces, 1 pip = 0.01 price change) to calculate accurate risk and reward metrics.
It dynamically positions Stop Loss and Take Profit levels relative to the entry price, based on user-defined or default offsets.
A real-time summary panel is displayed in the bottom-right corner of the chart, showing:
Potential Profit: The monetary value if the Take Profit is hit.
Potential Lo
ss: The monetary value if the Stop Loss is hit.
How to Use It
1. Add the script to your chart on a gold trading pair (e.g., XAUUSD).
2. Input your:
Account equity.
Leverage.
Position size (in lots).
Desired En
try Price (default: current close price).
3. Adjust the Stop Loss and Take Profit levels to your strategy, or let the script use default offsets of:
500 pips below the Entry for Stop Loss.
1000 pips above the Entry for Take Profit.
4. Review the plotted levels and the summary panel to confirm your trade aligns with your risk/reward goals.
Why Use This Tool?
Clarity and Precision:
Provides clear trade visuals and financial metrics for confident decision-making.
Time-Saving:
Automates the calculations needed to evaluate trade risk and reward.
Improved Risk Management:
Ensures you never trade without knowing your exact potential loss and gain.
This script is particularly useful for both novice and experienced traders looking to enhance their risk management and trading discipline in the Gold market. Enjoy clearer trades at speed.

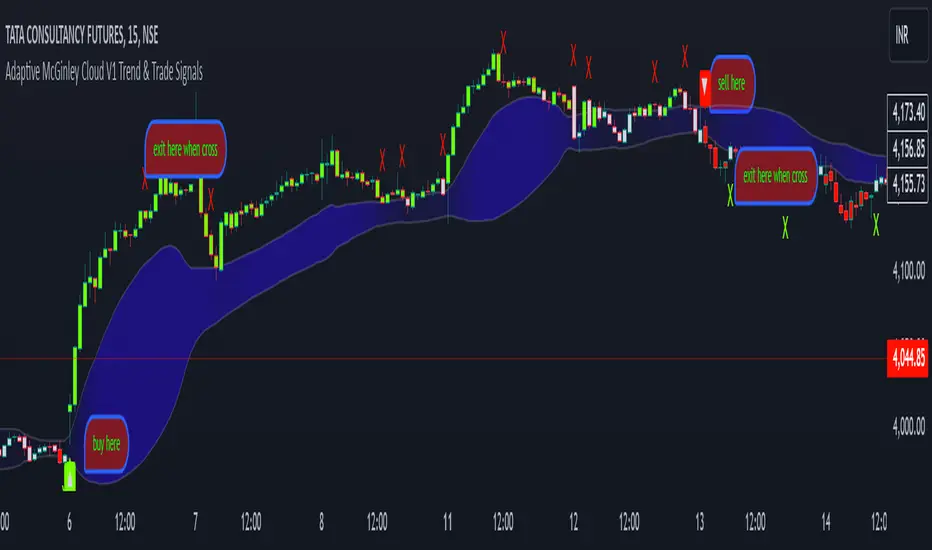
Adaptive McGinley Cloud V1 Trend & Trade SignalsAdaptive McGinley Cloud V1 Trend & Trade Signals is a dynamic trend-following indicator designed to help traders identify market trends, trade opportunities, and manage risk. The script is built on the McGinley Dynamic, which adjusts the moving average based on the price and its volatility, providing a smoother and more adaptive trend-following tool. Here's a breakdown of its key features:
McGinley Dynamic: The core of the indicator, the McGinley Dynamic, is calculated to track price movements more closely than traditional moving averages. It reacts more quickly to price changes in volatile markets, making it more adaptive.
Upper and Lower Bands: The indicator uses standard deviation to calculate upper and lower bands around the McGinley Dynamic, which represent potential levels of market volatility and trend strength. These bands help define whether the price is trending strongly or consolidating.
Cloud Visualization: A cloud fills the area between the upper and lower bands. The cloud's color changes based on the strength of the trend, with the opacity reflecting how far the price is from the McGinley Dynamic. When the trend is bullish, the cloud color shifts to purple, and when the trend is bearish, the cloud becomes more transparent.
Trend Indicators: The script detects trend changes by comparing the price with the McGinley Dynamic and the bands. A bullish trend is signaled when the price is above the McGinley Dynamic and upper band, while a bearish trend is signaled when the price is below the lower band.
Buy and Sell Signals: The indicator generates buy (long) and sell (short) signals when the trend crosses from bearish to bullish (or vice versa). These signals are marked with upward and downward arrows on the chart.
Take Profit (TP) and Stop Loss (SL) Levels: The script calculates potential take profit and stop loss levels based on the distance between the price and the upper and lower bands. These levels adjust dynamically as the price moves, helping traders manage risk.
Alerts: Alerts are built into the script for key events such as trend changes, take profit conditions, and stop loss conditions. Traders can set alerts to be notified when these events occur.
This indicator is designed to provide traders with a comprehensive tool for identifying trends, spotting potential entry and exit points, and managing trades effectively. By using adaptive calculations and providing visual cues such as the cloud and arrows, it offers an intuitive way to follow market movements and make informed decisions.
1drv.ms
Dynamic Cloud and Trend Identification
Original McGinley Dynamic Indicator: The original McGinley Dynamic (MD) was essentially a smoothed moving average designed to adapt to changing market speeds. It is typically used to indicate the direction of the trend based on its relationship with the price.
Modified Indicator: The modified version of the McGinley Dynamic is enhanced by the addition of a cloud that visually represents the price volatility using standard deviation bands around the MD line. The cloud is filled based on the gradient, with colors indicating the trend’s strength and direction. The script adds:
Upper and Lower Bands: These are plotted based on the standard deviation, which dynamically adjusts with market volatility. These bands help to assess the range within which the price should move.
Cloud Fill: The area between the upper and lower bands is filled with color, making it easier to visually identify periods of strong trends and consolidations. The cloud color changes based on the gradient, indicating whether the market is moving in a bullish or bearish direction.
Why This Helps Traders:
The cloud visually highlights the strength of the trend, making it easier for traders to identify trend reversals and potential breakout points.
The gradient fill within the cloud allows traders to spot trends before they become obvious from just the price action, giving them an early warning of trend strength.
Trend Reversal and Signal Indicators
Original McGinley Dynamic Indicator: The original MD only provided the smoothed average to indicate the trend direction. It didn't offer specific buy/sell signals or a way to easily spot trend changes.
Modified Indicator: The modified version introduces trend reversal signals:
Up Arrows (▲): These are plotted when the price crosses above the McGinley Dynamic, signaling a potential bullish trend.
Down Arrows (▼): These are plotted when the price crosses below the McGinley Dynamic, signaling a potential bearish trend.
Why This Helps Traders:
The inclusion of clear trend reversal signals gives traders a visual cue for when a potential trend change is occurring, which they can use to time their entries.
The arrows provide an additional layer of confirmation when combined with the cloud, giving traders more confidence in making trading decisions.
Dynamic Take Profit (TP) and Stop Loss (SL) Levels
Original McGinley Dynamic Indicator: The original MD indicator does not include any functionality for setting or calculating take profit or stop loss levels. It’s primarily used to identify the trend.
Modified Indicator: The modified version uses the upper and lower bands to define levels for take profit (TP) and stop loss (SL). These levels are dynamically calculated based on the McGinley Dynamic and its surrounding bands.
Take Profit (TP): If the price moves beyond the upper band, it might indicate an overbought condition or a trend continuation point where a trader could take profits.
Stop Loss (SL): If the price moves below the lower band, it could indicate an oversold condition, and traders may consider stopping out of a position.
Why This Helps Traders:
Dynamic TP and SL levels based on market volatility (standard deviation) help to manage risk better than static levels, adjusting to market conditions as they change.
Traders can use these levels to protect profits and minimize losses automatically, making the indicator more useful for those who require risk management tools alongside trend identification.
Trend Strength and Gradient Visualization
Original McGinley Dynamic Indicator: The original MD smooths the price data and shows the direction of the trend but does not offer a visual measure of the strength of that trend.
Modified Indicator: The modified version calculates the gradient of the McGinley Dynamic relative to the price. This gradient value is used to assess the strength of the trend, which is then visualized in the form of a color gradient for the cloud.
The gradient is measured by calculating the difference between the McGinley Dynamic and the price, and then normalizing it to a 0-100 scale. This gives traders a clearer view of how strong the current trend is and whether it's likely to continue or reverse.
The cloud color also dynamically changes based on this gradient, so traders can visually gauge trend strength.
Why This Helps Traders:
By visualizing trend strength, the trader gets a better sense of whether the market is in a strong, sustained move or just a weak pullback. This helps them avoid false signals and stick to the more powerful trends.
The gradient-based cloud provides a more intuitive view of market conditions than just the price line alone.
Visual Trade and Trend Indicators
Original McGinley Dynamic Indicator: It would simply show the MD line without providing visual indicators of trends, reversals, or other key levels.
Modified Indicator: In addition to the cloud, arrows, and gradient, the modified version adds visual signals for potential trade actions:
Trend Change Indicators: The indicator plots up and down arrows to indicate trend changes, making it easier for traders to know when to enter or exit trades based on the McGinley Dynamic.
Bullish and Bearish Signals: Visual cues like arrows and shapes give more context and actionable data for trading decisions.
Why This Helps Traders:
The arrows and other visual signals allow traders to quickly recognize trend changes without needing to interpret complex data, making it easier to trade actively.
The clarity in trend shifts ensures that traders can time their entries and exits more effectively.
Summary: How the Modified Indicator Helps Traders
Enhanced Trend Detection: The modified indicator provides a clear visual representation of trends through the cloud and McGinley Dynamic, helping traders identify trends and reversals more easily.
Dynamic Risk Management: The automatic calculation of TP and SL levels based on market volatility and the McGinley Dynamic helps traders manage risk more effectively.
Visual Confirmation: With trend reversal arrows and a gradient-based cloud, traders get multiple confirmations for when to enter or exit trades, improving the accuracy of their decisions.
Trend Strength: The indicator not only shows the direction of the trend but also its strength, allowing traders to assess the sustainability of the current market conditions.
In conclusion, the modified McGinley Dynamic indicator is a powerful tool that not only tracks trends but also provides dynamic risk management, trend strength visualization, and clear entry/exit signals. It improves on the original by adding these features, making it a more comprehensive tool for traders looking for an automated way to assess market conditions and manage trades.
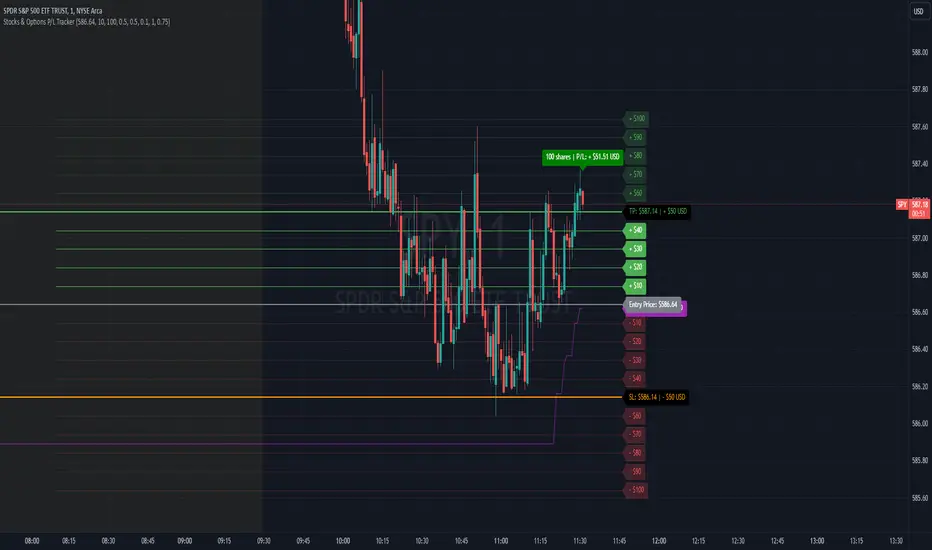
Stocks & Options P/L TrackerOverview:
The Stocks & Options P/L Tracker is a custom TradingView indicator developed to offer traders precise tracking of stocks & options trades’ profit and loss in real-time. It features a detailed display of P/L intervals, stop-loss and take-profit levels, and an adaptable trailing stop mechanism to help traders manage risk and optimize their trading strategies. This tool is particularly useful for active traders who seek immediate visual feedback on their trades’ performance.
Key Features:
Real-Time P/L Display: Computes and displays the P/L per contract/share and total P/L dynamically on the chart based on the specified entry price, relative to the current market price, and number of contracts or shares.
Configurable Take Profit and Stop Loss: Users can set take-profit and stop-loss amounts, and the indicator will visually mark these levels with corresponding dollar amounts for easy reference.
Trailing Stop Functionality: Offers an option to enable a trailing stop that automatically adjusts based on price movements.
Interval-Based P/L Tracking: Uses customizable intervals to display projected P/L levels above and below the entry price, helping users understand potential profit or loss scenarios at a glance.
Dynamic Labeling and Alerts: Visual labels are used to mark P/L, take-profit, stop-loss, trailing stop, and entry levels. These labels update dynamically on each new price bar to provide immediate insights into trade performance. NOTE: Due to TradingView's limitations with server-side alerts on fixed prices, dynamic alerts (for Take Profit, Stop Loss, and Trailing Stop) that adjust with price changes are not yet available. Alerts must be manually reset to your desired price each time.
Clean and Responsive Design: Utilizes color-coded labels and lines for P/L intervals, making it easy to distinguish profit, loss, stop, and take-profit zones. Colors adjust automatically to the current price to maintain clarity.
User Input Validation: Ensures appropriate input values for items like entry price, contract/share size, and profit/loss intervals to prevent errors and optimize performance.
Efficient Object Management: Implements object reusability for lines and labels to stay within Pine Script's object limits, ensuring smooth operation and maximum accuracy in real-time tracking.
Automatic Adjustments Based on Market Changes: Calculates and adjusts trailing stop levels dynamically based on highest price movement, which provides traders flexibility while maintaining risk controls.
Trader Benefits:
This indicator empowers traders with a robust tool to manage their trades visually and strategically on TradingView. The real-time feedback and customization options help traders make informed decisions, minimize risks, and maximize potential profits.
Happy Trading! :)
Trend Trader-RemasteredThe script was originally coded in 2018 with Pine Script version 3, and it was in invite only status. It has been updated and optimised for Pine Script v5 and made completely open source.
Overview
The Trend Trader-Remastered is a refined and highly sophisticated implementation of the Parabolic SAR designed to create strategic buy and sell entry signals, alongside precision take profit and re-entry signals based on marked Bill Williams (BW) fractals. Built with a deep emphasis on clarity and accuracy, this indicator ensures that only relevant and meaningful signals are generated, eliminating any unnecessary entries or exits.
Key Features
1) Parabolic SAR-Based Entry Signals:
This indicator leverages an advanced implementation of the Parabolic SAR to create clear buy and sell position entry signals.
The Parabolic SAR detects potential trend shifts, helping traders make timely entries in trending markets.
These entries are strategically aligned to maximise trend-following opportunities and minimise whipsaw trades, providing an effective approach for trend traders.
2) Take Profit and Re-Entry Signals with BW Fractals:
The indicator goes beyond simple entry and exit signals by integrating BW Fractal-based take profit and re-entry signals.
Relevant Signal Generation: The indicator maintains strict criteria for signal relevance, ensuring that a re-entry signal is only generated if there has been a preceding take profit signal in the respective position. This prevents any misleading or premature re-entry signals.
Progressive Take Profit Signals: The script generates multiple take profit signals sequentially in alignment with prior take profit levels. For instance, in a buy position initiated at a price of 100, the first take profit might occur at 110. Any subsequent take profit signals will then occur at prices greater than 110, ensuring they are "in favour" of the original position's trajectory and previous take profits.
3) Consistent Trend-Following Structure:
This design allows the Trend Trader-Remastered to continue signaling take profit opportunities as the trend advances. The indicator only generates take profit signals in alignment with previous ones, supporting a systematic and profit-maximising strategy.
This structure helps traders maintain positions effectively, securing incremental profits as the trend progresses.
4) Customisability and Usability:
Adjustable Parameters: Users can configure key settings, including sensitivity to the Parabolic SAR and fractal identification. This allows flexibility to fine-tune the indicator according to different market conditions or trading styles.
User-Friendly Alerts: The indicator provides clear visual signals on the chart, along with optional alerts to notify traders of new buy, sell, take profit, or re-entry opportunities in real-time.

ATT Model with Buy/Sell SignalsIndicator Summary
This indicator is based on the ATT (Arithmetic Time Theory) model, using specific turning points derived from the ATT sequence (3, 11, 17, 29, 41, 47, 53, 59) to identify potential market reversals. It also integrates the RSI (Relative Strength Index) to confirm overbought and oversold conditions, triggering buy and sell signals when conditions align with the ATT sequence and RSI level.
Turning Points: Detected based on the ATT sequence applied to bar count. This suggests high-probability areas where the market could turn.
RSI Filter: Adds strength to the signals by ensuring buy signals occur when RSI is oversold (<30) and sell signals when RSI is overbought (>70).
Max Signals Per Session: Limits signals to two per session to reduce over-trading.
Entry Criteria
Buy Signal: Enter a buy trade if:
The indicator displays a green "BUY" marker.
RSI is below the oversold level (default <30), suggesting a potential upward reversal.
Sell Signal: Enter a sell trade if:
The indicator displays a red "SELL" marker.
RSI is above the overbought level (default >70), indicating a potential downward reversal.
Exit Criteria
Take Profit (TP):
Define TP as a fixed percentage or point value based on the asset's volatility. For example, set TP at 1.5-2x the risk, or a predefined point target (like 50-100 points).
Alternatively, exit the position when price approaches a key support/resistance level or the next significant swing high/low.
Stop Loss (SL):
Place the SL below the recent low (for buys) or above the recent high (for sells).
Set a fixed SL in points or percentage based on the asset’s average movement range, like an ATR-based stop, or limit it to a specific risk amount per trade (1-2% of account).
Trailing into Profit
Use a trailing strategy to lock in profits and let winning trades run further. Two main options:
ATR Trailing Stop:
Set the trailing stop based on the ATR (Average True Range), adjusting every time a new candle closes. This can help in volatile markets by keeping the stop at a consistent distance based on recent price movement.
Break-Even and Partial Profits:
When the price moves in your favor by a set amount (e.g., 1:1 risk/reward), move SL to the entry (break-even).
Take partial profit at intermediate levels (e.g., 50% at 1:1 RR) and trail the remainder.
Risk Management for Prop Firm Evaluation
Prop firms often have strict rules on daily loss limits, max drawdowns, and minimum profit targets. Here’s how to align your strategy with these:
Limit Risk per Trade:
Keep risk per trade to a conservative level (e.g., 1% or lower of your account balance). This allows for more room in case of a drawdown and aligns with most prop firm requirements.
Daily Loss Limits:
Set a daily stop-loss that ensures you don’t exceed the firm’s rules. For example, if the daily limit is 5%, stop trading once you reach a 3-4% drawdown.
Avoid Over-Trading:
Stick to the max signals per session rule (one or two trades). Taking only high-probability setups reduces emotional and reactive trades, preserving capital.
Stick to a Profit Target:
Aim to meet the evaluation’s profit goal efficiently but avoid risky or oversized trades to reach it faster.
Avoid Major Economic Events:
News events can disrupt technical setups. Avoid trading around significant releases (like FOMC or NFP) to reduce the chance of sudden losses due to high volatility.
Summary
Using this strategy with discipline, a structured entry/exit approach, and tight risk management can maximize your chances of passing a prop firm evaluation. The ATT model’s turning points, combined with the RSI, provide an edge by highlighting reversal zones, while limiting trades to 1-2 per session helps maintain controlled risk.

Dynamic Trading Strategy with Key Levels, Entry/Exit ManagementThis indicator provides a complete rule-based trading system, combining key levels, entry conditions, stop loss (SL), and take profit (TP) management. It’s designed to dynamically adapt to market conditions by identifying crucial support and resistance zones, determining entry points based on price action and volume, and calculating risk-based exit targets.
Key Features
Key Level Identification:
The indicator automatically identifies support and resistance levels based on recent price highs and lows within a customizable lookback period.
It adds a dynamic buffer around these levels using the Average True Range (ATR) to account for market volatility, ensuring the zones adjust to changing conditions.
Entry Conditions:
Bullish Entry: Triggers near the support zone when there’s upward price action, confirmed by volume spikes and bullish candlestick patterns (e.g., hammers, engulfing candles).
Bearish Entry: Triggers near the resistance zone when signs of rejection appear, confirmed by volume spikes and bearish candlestick patterns (e.g., shooting stars, bearish engulfing).
Entry zones are highlighted visually on the chart using green (bullish) and red (bearish) shaded boxes.
Stop Loss (SL) and Take Profit (TP):
Stop Loss: Calculated based on ATR multipliers, allowing you to set a volatility-adjusted risk level beyond the entry range.
Take Profit: Includes two profit-taking levels (TP1 and TP2), allowing for partial position exits. TP levels are calculated based on a reward-to-risk ratio, ensuring consistent profitability targets.
SL and TP levels are clearly marked with horizontal lines and labeled as SL, TP1, and TP2, helping you manage trade exits effectively.
Market Context Adaptability:
The indicator adapts to both trending and ranging market conditions. In trending markets, it favors trades that follow the trend, while in ranging markets, it focuses on reversals within the range boundaries.
Visual Aids:
Entry zones are highlighted with shaded boxes to indicate potential buy/sell regions.
SL, TP1, and TP2 levels are clearly drawn with labels, allowing for easy identification of exit points.
How to Use
Identify Key Levels: Look for support and resistance zones highlighted by the indicator on your chart.
Wait for Entry Conditions: When the price enters the entry range (marked by green or red boxes), wait for confirmation signals—such as volume spikes and candlestick patterns.
Manage Exits: Use the SL, TP1, and TP2 levels for structured trade management. Consider scaling out partially at TP1 and exiting fully at TP2.
Ideal For:
This indicator is suitable for traders who prefer a systematic approach to trading, with clear entry and exit rules. It is particularly helpful for those looking to balance risk and reward with well-defined take profit and stop loss levels.

5-0 Harmonic Pattern [TradingFinder] 0XABCD 50 Harmonic Detector🔵 Introduction
Harmonic patterns are a powerful tool in technical analysis, widely used to detect reversal points and trend changes. Among these, the 5-0 Harmonic Pattern stands out due to its reliance on specific Fibonacci ratios—1.13, 1.618, 2.24, and 0.45 to 0.55—anchored at points 0, X, A, B, C, and D. This pattern provides a structured approach for identifying critical buy and sell points, helping traders achieve optimal entry and exit levels in volatile markets.
This 5-0 Harmonic Pattern indicator automatically detects and marks bullish and bearish formations on the chart, offering precise trading signals based on established harmonic ratios. With its dynamic signals, the 5-0 pattern enables traders to anticipate market movements and capitalize on favorable price trends.
Especially in fast-moving markets, harmonic patterns, particularly the 5-0 Harmonic Pattern, equip traders with an essential framework for identifying reversal opportunities and refining their trading strategies.
Bullish 5-0 Pattern :
Bearish 5-0 Pattern :
🔵 How to Use
The 5-0 Harmonic Pattern indicator is designed to automatically mark the key levels of the harmonic structure: 0, X, A, B, C, and D. By doing so, it detects both bullish and bearish patterns and helps traders recognize optimal entry and exit points.
Formed through specific Fibonacci levels, this pattern signals potential shifts in trend direction, giving traders critical insights for managing entries and exits effectively. The tool proves valuable in high-volatility settings, enabling traders to leverage these signals for refined decision-making.
🟣 Bullish 5-0 Pattern
A bullish 5-0 pattern materializes when Fibonacci levels indicate a potential price reversal to the upside. With points 0, X, A, B, C, and D in alignment, the indicator highlights this upward momentum by displaying a green arrow as a buy signal on the chart. This marking provides a clear entry point, indicating that prices are likely to rise, making it a prime moment for traders to enter long positions.
Additionally, the bullish 5-0 pattern is equipped with tools for traders to set stop-loss and take-profit points based on harmonic lines within the pattern, which represent support and resistance levels. Using these dynamic points, traders can create a more effective risk-reward setup while following the bullish signals in a standalone harmonic strategy.
🟣 Bearish 5-0 Pattern
The bearish 5-0 pattern functions similarly but signals a likely downturn. This pattern emerges when Fibonacci ratios align at points 0, X, A, B, C, and D, predicting a reversal downward. The indicator generates a sell signal, marked by a red arrow, prompting traders to exit long positions or initiate short trades to capitalize on falling prices.
Traders can utilize this bearish pattern for defining exit strategies and setting key levels for stop-loss and take-profit orders. The bearish 5-0 pattern enhances traders’ abilities to gauge critical price levels and manage trade risk effectively, especially in volatile markets. For traders focused on profiting from downward trends, this indicator serves as a powerful tool for timely entries and exits.
🔵 Setting
🟣 Logical Setting
ZigZag Pivot Period : You can adjust the period so that the harmonic patterns are adjusted according to the pivot period you want. This factor is the most important parameter in pattern recognition.
Show Valid Forma t: If this parameter is on "On" mode, only patterns will be displayed that they have exact format and no noise can be seen in them. If "Off" is, the patterns displayed that maybe are noisy and do not exactly correspond to the original pattern.
Show Formation Last Pivot Confirm : if Turned on, you can see this ability of patterns when their last pivot is formed. If this feature is off, it will see the patterns as soon as they are formed. The advantage of this option being clear is less formation of fielded patterns, and it is accompanied by the latest pattern seeing and a sharp reduction in reward to risk.
Period of Formation Last Pivot : Using this parameter you can determine that the last pivot is based on Pivot period.
🟣 Genaral Setting
Show : Enter "On" to display the template and "Off" to not display the template.
Color : Enter the desired color to draw the pattern in this parameter.
LineWidth : You can enter the number 1 or numbers higher than one to adjust the thickness of the drawing lines. This number must be an integer and increases with increasing thickness.
LabelSize : You can adjust the size of the labels by using the "size.auto", "size.tiny", "size.smal", "size.normal", "size.large" or "size.huge" entries.
🟣 Alert Setting
Alert : On / Off
Message Frequency : This string parameter defines the announcement frequency. Choices include: "All" (activates the alert every time the function is called), "Once Per Bar" (activates the alert only on the first call within the bar), and "Once Per Bar Close" (the alert is activated only by a call at the last script execution of the real-time bar upon closing). The default setting is "Once per Bar".
Show Alert Time by Time Zone : The date, hour, and minute you receive in alert messages can be based on any time zone you choose. For example, if you want New York time, you should enter "UTC-4". This input is set to the time zone "UTC" by default.
Conclusion
The 5-0 Harmonic Pattern indicator serves as a robust solution for technical analysts and traders looking to pinpoint market reversal points. By automatically recognizing 5-0 patterns and generating buy and sell signals based on Fibonacci ratios, this tool supports precise trend analysis and entry/exit timing. The indicator’s adjustable alerts, color themes, and pattern toggles allow for comprehensive customization, ensuring alignment with individual trading strategies.
Harmonic patterns, especially the 5-0 Harmonic Pattern, guide traders in identifying high-accuracy entry and exit points, thus aiding in more informed trading decisions. By combining Fibonacci ratio analysis with real-time signal updates, this indicator provides a well-rounded approach for risk management and capitalizing on trading opportunities. Professional traders can harness this tool to enhance technical analysis precision and capitalize on price trends effectively, maximizing profitability in both bullish and bearish markets.

Intraday ReversalReversal Indicator
This Reversal Indicator is designed to capture high-probability reversal trades by analyzing price action at the day’s high or low. It identifies key levels, confirms breaks, and provides clear trade entry parameters based on trader margin, offering a simple yet effective approach for managing risk and potential profit. Best timeframe for trading is 1m.
Key Features:
1. Marks the Day's High and Low Candle:
- Automatically identifies and marks the high and low of the current trading day, acting as potential reversal zones.
2. Entry Trigger:
- A trade signal is generated when the price breaks below the high/low candle.
3. Trade Entry Parameters Display:
- Before the trade entry, the indicator presents a trade entry label on the chart, displaying essential information such as Stop Loss, Take Profit, and Shares Quantity, calculated according to the trader's available margin.
4. Stop Loss:
- The Stop Loss is automatically set a specified number of ticks above the day's high (for shorts) or below the day's low (for longs), ensuring tight risk management.
5. Take Profit:
- The Take Profit level is calculated as a percentage of the Stop Loss distance, providing proportional reward-to-risk ratios based on customizable preferences.
6. Visual Take Profit Line:
- Once a trade is entered, the indicator draws a visible Take Profit line on the chart. This line is initially red, signaling an active trade. If the market hits the Take Profit target, the line turns green, indicating a successful exit.
7. Setup Reset:
- The indicator resets itself with new high / low of the day
This Reversal Indicator simplifies trade execution by automating key decisions, allowing traders to focus on managing the trade rather than constantly monitoring price action. Perfect for traders looking to capitalize on daily reversal patterns with clear risk/reward parameters.
FibLevel Size CalculatorThis skript calculates position sizes and new take profits for sizing into an long or short position with 3 entrys defined at custom fibonacci retracement levels.
TP: -0,272
Entry1: 0.382
Entry2: 0.618
Entry3: 0.83
SL: 1.05
Expected RR per trade is 0.2 with a High Win rate definitly profitable.
Search for an established trend on the higher timeframe, drop to the smaller ones and look for correction waves. Once they break to the trenddirection of the higher timeframe take the fib from lowest to highes point. Draw a fib level on the chart and use the Indicator to define these Levels above. The calculator gives you the Margin to use in each position, and will check that you will not get liquidated an that you have enough margin. It tells you the new TP for Limit2 and Limit3 if they get hit so you can get out of the trade full TP with a small bounce.
Inputs:
Account Balance, Risk Percentage, and Leverage: These inputs are used to calculate the position size and risk.
Entry 1, Entry 2, Entry 3, Take Profit (TP), and Stop Loss (SL): These prices are used for calculating position sizes, risk, and profit for up to three entry points.
Calculations:
Risk Amount: Calculated based on the account balance and risk percentage.
Position Sizes (Qty): For each entry point, the position size is determined. The second and third entries have a multiplier (3x for Entry 2, 5x for Entry 3) compared to the first.
Stop Loss and Profit Calculation: The script calculates the potential profit and adjusts the TP levels based on the average entries for Limit 2 and Limit 3.
Margin Calculation: Margin requirements for each position are calculated based on leverage.
Output:
Table Display: A table shows key values like entry prices, position sizes, TP levels, potential profit, and margin requirements for each limit.
Warnings: It includes a liquidation warning and a check for whether the account is at risk of liquidation based on leverage.
Position Type: It automatically detects if the trade is a long or short based on the relationship between TP and SL.
Visualization:
Lines: It draws horizontal lines on the chart to visually represent the entry, TP, and SL levels.
Overall, this script is designed to help traders manage risk and calculate position sizes for multi-level entries using leverage.
Pls drop feedback in the comments.
