NIFTY_2MIN_CVD_short_StrategySummary
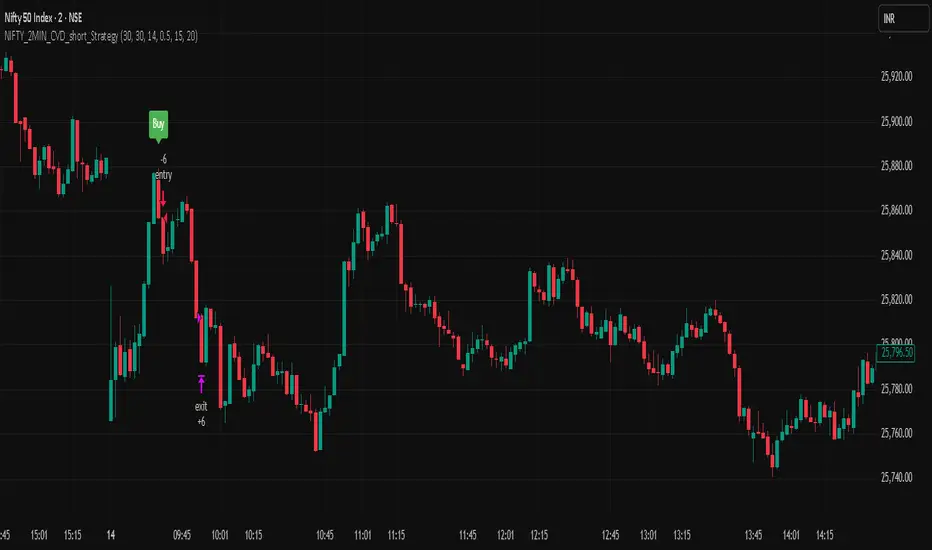
This strategy is an intraday system designed for the Nifty index on a 2-minute timeframe, focusing exclusively on identifying high-probability short (sell) entries. It utilizes a combination of rapid price action and Cumulative Volume Delta (CVD) to detect "Buying Absorption" at local peaks.
Concept & Core Logic
The strategy is engineered to identify "Inverted V-shaped" reversals where aggressive buying pressure is exhausted and absorbed by large-scale limit orders from sellers.
Price Action Trigger: The strategy looks for a specific two-part sequence:
Sudden Bullish Movement: A rapid upward move that often traps late buyers or triggers short-covering.
Sudden Reversal: Immediately followed by a strong, high-momentum bearish (red) candle, signaling a swift rejection of the higher prices.
CVD Absorption Filter: To confirm the validity of the reversal, the strategy analyzes the Cumulative Volume Delta (CVD). It identifies instances where the relative movement of the CVD is significantly higher than the corresponding price movement. This specific divergence highlights "Buying Absorption"—a market condition where aggressive market buy orders are being filled by passive limit sell orders, preventing further price appreciation and creating a heavy ceiling for the reversal.
Risk Management
To maintain a disciplined approach, the strategy employs fixed exit parameters based on the underlying Nifty price:
Take Profit: 25 points.
Stop Loss: 30 points.
Intended Use
This tool is intended for traders who study mechanical, rule-based systems and order flow dynamics. It provides a structured framework for observing how volume delta divergence (CVD) and rapid price rejections interact at potential market turning points.
Disclaimer: This script is for educational and informational purposes only. It is not financial advice. All trading involves risk, and past performance is not indicative of future results. Please conduct your own research and backtesting before making any trading decisions.
Search in scripts for "take profit"
NIFTY_2MIN_CVD_Absorption_long_StrategySummary
This strategy is an intraday system designed for the Nifty index on a 2-minute timeframe, focusing on high-probability reversal entries. It utilizes price action patterns and Cumulative Volume Delta (CVD) to identify market turning points.
Long Strategy: Concept & Core Logic
The long strategy is engineered to identify "V-shaped" recoveries where selling pressure is exhausted and absorbed by aggressive buyers.
Price Action Trigger: The strategy looks for a specific two-part sequence:
Sudden Bearish Movement: A rapid downward move representing a final flush of sellers.
Sudden Reversal: Immediately followed by a strong, high-momentum bullish (green) candle, indicating a swift change in market sentiment.
CVD Absorption Filter: To confirm the validity of the reversal, the strategy analyzes the Cumulative Volume Delta (CVD). It specifically looks for instances where the relative movement of CVD is significantly higher than the corresponding price movement. This divergence suggests "selling absorption"—where large buy orders are soaking up sell-side liquidity, creating a floor for the reversal.
Risk Management (Long)
The strategy utilizes fixed exit parameters based on the underlying Nifty price points:
Take Profit: 25 points.
Stop Loss: 30 points.
Intended Use
This tool is intended for traders who study mechanical, rule-based systems. It demonstrates how price action, volume delta divergence (CVD), and trend filters can be combined to time entries in both trending and reversal market conditions.
Disclaimer: This script is for educational and informational purposes only. It is not financial advice. All trading involves risk, and past performance is not indicative of future results. Please conduct your own research and backtesting before making any trading decisions.

Nifty_2MIN_Rangereversal_Short_StrategySummary
This strategy is an intraday trend-following system designed for the Nifty index on a 2-minute timeframe, focusing exclusively on short (sell) entries. It is engineered to identify failed bounces within established bearish trends.
Concept & Core Logic
The strategy uses a multi-layered approach to confirm downward momentum before triggering an entry:
Trend Confirmation: The script analyzes the slope and positioning of the 20-period and 200-period Exponential Moving Averages (EMA). Short signals are only valid when the EMA configuration confirms a prevailing bearish trend.
Retracement Zone Filtering: To optimize entry pricing, the strategy monitors the daily price range. It looks for the market to be within the 35% to 75% range of the day's movement, specifically identifying a temporary upward "relief rally" or bounce after a significant fall.
Candlestick Trigger: The execution occurs when a specific bearish reversal pattern appears during the relief rally:
Two consecutive bullish candles (representing the temporary bounce).
Followed by a strong, high-momentum bearish candle (signaling the resumption of the primary downtrend).
Risk Management
The strategy utilizes fixed exit parameters based on the underlying Nifty price points:
Take Profit: 28 points.
Stop Loss: 30 points.
Intended Use
This tool is intended for traders who study mechanical, rule-based systems. It demonstrates how moving average trends can be combined with range analysis and price action sequences to time entries during market retracements.
Disclaimer: This script is for educational and informational purposes only. It is not financial advice. All trading involves risk, and past performance is not indicative of future results. Please conduct your own research and backtesting before making any trading decisions.

Nifty_2MIN_ Rangereversal_Long _StrategySummary
This strategy is an intraday trend-following system designed for the Nifty index on a 2-minute timeframe. It focuses exclusively on long entries, seeking to identify high-probability recovery points within an established uptrend.
Concept & Core Logic
The strategy identifies entries based on a confluence of trend direction, price recovery levels, and specific candlestick patterns:
Trend Confirmation: The script utilizes the slope and positioning of the 20-period and 200-period Exponential Moving Averages (EMA). A long signal is only considered when the trend is determined to be positive, ensuring trades align with the broader market momentum.
Recovery Zone Filtering: To avoid buying at local peaks, the strategy filters for entries that occur when the market has retraced but is showing signs of recovery. Specifically, it looks for price to be within the 35% to 75% recovery range relative to the day's high.
Candlestick Trigger: The actual entry trigger is a "Bullish Reversal" sequence:
Two consecutive bearish candles (representing a minor pullback).
Followed immediately by a strong bullish candle (representing the resumption of strength).
Risk Management
The strategy uses fixed point-based exits to maintain a disciplined approach:
Take Profit: 30 points (underlying Nifty price).
Stop Loss: 35 points (underlying Nifty price).
Intended Use
This script is designed for traders interested in mechanical trend-following systems. It provides a structured way to observe how moving average slopes and specific price action sequences interact during intraday recoveries.
Disclaimer: This script is for educational and informational purposes only. It is not financial advice. All trading involves risk, and past performance is not indicative of future results. Please conduct your own research and backtesting before making any trading decisions.

ML Adaptive SuperTrend Strategy [trade_crush]# ML Adaptive SuperTrend Strategy - User Guide
## Introduction
The **ML Adaptive SuperTrend Strategy** is a sophisticated trading tool that combines traditional trend-following logic with **Machine Learning (K-Means Clustering)** to dynamically adapt to market volatility. Unlike standard SuperTrend indicators that use a fixed ATR, this strategy analyzes historical volatility to categorize the current market into distinct clusters, providing more precise entries and exits.
>
> **Special Thanks:** This strategy is based on the innovative work of **AlgoAlpha**. You can explore their extensive library of high-quality indicators and strategies on TradingView: (www.tradingview.com).
---
## Machine Learning Engine (K-Means)
The core of this strategy is its ability to "learn" from recent market behavior.
- **K-Means Clustering**: The script takes the last $N$ bars of ATR data and runs an iterative clustering algorithm to find three "centroids" representing **High**, **Medium**, and **Low** volatility.
- **Adaptive ATR**: Based on the current volatility, the strategy selects the nearest centroid to use as the ATR value for the SuperTrend calculation. This ensures the trailing stop tightens during low volatility and widens during high volatility to avoid "noise".
---
## Key Features
### 1. Non-Repainting Signals
- **Confirm Signals**: When enabled, signals are only triggered after a bar closes. This ensures that the arrows and entries you see on the chart are permanent and reliable for backtesting.
### 2. Intelligent Risk Management
- **Multiple SL/TP Types**: Choose between **Percentage** based stops or **ATR** based stops for both Stop Loss and Take Profit.
- **Trailing Stop Loss (TSL)**:
- Supports both Percentage and ATR modes.
- **Activation Offset**: Only activates the trailing mechanism after the price has moved a certain percentage in your favor, protecting early-stage trades.
### 3. Risk-Based Position Sizing
- **Dynamic Quantity**: If enabled, the strategy automatically calculates the trade size based on your **Risk % Per Trade** and the distance to your **Stop Loss**. This ensures you never lose more than your defined risk on a single trade.
---
## User Input Guide
### SuperTrend & ML Settings
- **ATR Length**: The window used to calculate market volatility.
- **SuperTrend Factor**: The multiplier that determines the distance of the trailing stop from the price.
- **Use ML Adaptive ATR**: Toggle between the ML-enhanced logic and standard ATR.
- **Training Data Length**: How many historical bars the ML engine analyzes to find clusters.
### Risk Management
- **Stop Loss Type**: Set to Percentage, ATR, or None.
- **TS Activation Offset**: The profit buffer required before the trailing stop starts following the price.
- **Use Risk-Based Sizing**: Toggle this to let the script manage your position size automatically.
---
## How to Trade with This Strategy
1. **Monitor the Dashboard**: Check the top-right table to see which volatility cluster the market is currently in.
2. **Observe the Fills**: The adaptive fills (green/red) visualize the "breathing room" the strategy is giving the price.
3. **Execution**: The strategy enters on "ML Bullish" (Triangle Up) and "ML Bearish" (Triangle Down) signals.
4. **Exits**: The script will automatically exit based on your SL, TP, or Trailing Stop settings.
---
## Credits
Original Concept: **AlgoAlpha**
Strategy Conversion & Enhancements: **Antigravity AI**

New Rate - PREMIUM v2New Rate - PREMIUM v2
New Rate - PREMIUM v2 is an intraday Opening Range Breakout (ORB) strategy built around a strict one-trade-per-day execution model.
The strategy defines a price range using the first N candles of a user-defined session, freezes the High/Low at the close of candle N, and places OCO stop orders exactly at those levels. The first breakout fills, the opposite order is canceled, and no further trades are allowed until the next trading day.
This script is published for educational and research purposes, with documented mechanics and backtest settings to support transparency and reproducibility.
How the strategy works
Session range construction
The user selects a minutes-based timeframe, a session start time, and the number of candles N. During the session window, the strategy tracks the highest High and lowest Low formed by the first N candles. These candles are visually highlighted on the chart.
Range freeze
When candle N closes, the range is locked. Horizontal High/Low lines are drawn and extended forward. An optional 50% midpoint can be displayed for reference.
OCO breakout execution
Immediately after the range is frozen, the strategy places:
A buy stop at the frozen High
A sell stop at the frozen Low
Orders are linked using OCO (One-Cancels-Other) logic. When one side fills, the opposite order is automatically canceled.
Exit management
Two exit frameworks are available:
Tick-based exits: stop-loss and take-profit are fixed distances in ticks from entry.
Risk/Reward exits: optional stop at the opposite side of the range, with TP calculated as RR × risk.
Both modes can display SL/TP boxes projected forward for visual review.
Daily execution lock
After the first filled trade of the day, the strategy blocks any new entries until the next daily reset. This enforces strict discipline and prevents over-trading.
Visual features
Configurable High/Low lines and labels (color, style, width, alignment)
Optional midpoint (50%) line
Session background highlight with adjustable opacity
Optional SL/TP boxes with configurable colors, borders, and projection length
Weekday filter (trade only selected days)
Settings used for the published backtest (replication)
The performance screenshots included with this publication were generated using the following configuration:
Market & chart
Symbol: FX:XAUUSD
Timeframe: 15 minutes
Session & range
Session start: as configured on chart (exchange time)
Range candles (N): 1
Auto range end: enabled (TF × N)
Line extension: 20 bars
Exits
Exit mode: SL/TP by ticks
Stop-loss: 1500 ticks
Take-profit: 2000 ticks
Weekdays
Monday to Friday enabled
Strategy Properties (TradingView settings)
Initial capital: 1,000 USD
Commission: 0.1 (as set in Strategy Properties)
Slippage: 1 tick
Users should adjust commission, slippage, and position sizing to match their own broker and execution conditions.
Backtest context and limitations
This strategy uses stop orders that may fill intrabar depending on TradingView’s execution model.
Results vary by symbol, timeframe, session selection, and trading costs.
Past performance does not guarantee future results.
This script is not financial advice.
Originality and usefulness
While opening-range breakouts are a known concept, this strategy’s implementation focuses on:
Exact range-freeze timing: orders are armed precisely at the close of the N-th candle.
True OCO + hard daily lock: one-and-done execution enforced at the engine level.
Dual exit framework: fixed-tick and RR exits analyzed with the same SL/TP visual logic.
Operational safeguards: weekday filters and drawing limits designed for stable long-term backtesting.

Tether Dynamics - Statistical Exhaustion EngineOverview
This strategy detects statistical exhaustion in price movement by modeling price as a particle tethered to a dynamic anchor. When price stretches too far from equilibrium and multiple independent statistical detectors confirm anomalous behavior, the strategy identifies high-probability mean-reversion opportunities.
Unlike simple oversold/overbought indicators, this system fuses concepts from classical mechanics , stochastic filtering , multivariate statistics , and statistical process control into a unified detection framework.
━━━━━━━━━━━━━━━━━━━━━━━━━━━━━━━━━━━━━━━━
THEORETICAL FOUNDATION
1. The Tethered Particle Model
The framework draws inspiration from Polyak's heavy ball method in optimization theory, where a particle with momentum navigates a loss landscape. Here, price is modeled as a particle connected to a moving anchor (adaptive EMA) by an elastic "chain" whose length scales with volatility (ATR). This creates a natural physics framework:
Displacement (x) : Distance from anchor, normalized by chain length
Velocity (v) : Rate of change of displacement
Acceleration (a) : Rate of change of velocity
This state vector defines the system's "phase space" — a complete description of price dynamics relative to equilibrium.
2. Adaptive Anchor (Kaufman Efficiency)
The anchor uses an adaptive smoothing approach inspired by Perry Kaufman's Adaptive Moving Average. The Efficiency Ratio measures trend strength:
ER = |Direction| / Volatility = |Price - Price | / Σ|ΔPrice|
High efficiency (trending) → faster adaptation
Low efficiency (choppy) → slower, more stable anchor
This prevents whipsaws in ranging markets while staying responsive in trends.
━━━━━━━━━━━━━━━━━━━━━━━━━━━━━━━━━━━━━━━━
DETECTION ARCHITECTURE
The strategy employs three independent statistical detectors , each grounded in distinct mathematical frameworks. A signal fires when price shows extended tension AND any detector confirms anomalous behavior AND momentum is decelerating (exhaustion).
Detector 1: Mahalanobis Distance (Multivariate Outlier Detection)
The Mahalanobis distance measures how "unusual" the current state vector is, accounting for correlations between displacement, velocity, and acceleration:
D² = (x - μ)ᵀ Σ⁻¹ (x - μ)
Where Σ is the full 3×3 covariance matrix. Under multivariate normality, D² follows a chi-squared distribution with 3 degrees of freedom:
χ²(3, 0.90) = 6.25 → 10% of observations exceed this
χ²(3, 0.95) = 7.81 → 5% of observations exceed this
This detector identifies states that are jointly extreme — even if no single variable looks unusual alone.
Why it matters: A price might have moderate displacement and moderate velocity, but the combination could be highly improbable. Mahalanobis captures this multivariate structure that univariate indicators miss.
Detector 2: CUSUM Change-Point Detection
Cumulative Sum (CUSUM) is a sequential analysis technique from statistical process control. It accumulates standardized deviations from the mean:
S⁺ₜ = max(0, S⁺ₜ₋₁ + zₜ - drift)
S⁻ₜ = min(0, S⁻ₜ₋₁ + zₜ + drift)
When either cumulative sum breaches a threshold, a "change point" is detected — the process has shifted from its baseline regime.
Why it matters: CUSUM detects subtle, persistent shifts that might not trigger on any single bar. It's sensitive to regime changes that precede reversals.
Detector 3: Kalman Innovation Filter (Ornstein-Uhlenbeck Model)
This detector models displacement as an Ornstein-Uhlenbeck process — the continuous-time analog of AR(1) mean-reversion:
dx = θ(μ - x)dt + σdW
A Kalman filter tracks the expected displacement and computes the innovation (prediction error):
νₜ = (yₜ - x̂ₜ|ₜ₋₁) / √Sₜ
Under correct model specification, normalized innovations should be ~N(0,1). Large innovations indicate the mean-reversion model is breaking down — price is behaving "unexpectedly" relative to equilibrium dynamics.
Adaptive Q Estimation: The filter continuously adjusts its process noise estimate based on innovation autocorrelation, maintaining calibration across different volatility regimes.
━━━━━━━━━━━━━━━━━━━━━━━━━━━━━━━━━━━━━━━━
SIGNAL LOGIC
Long Signal Requirements:
Z-Displacement < -σ threshold (price stretched below anchor)
ANY detector fires (Mahalanobis outlier OR CUSUM change OR Kalman innovation < -2σ)
Z-Acceleration > 0 (downward momentum decelerating)
Short Signal Requirements:
Z-Displacement > +σ threshold (price stretched above anchor)
ANY detector fires
Z-Acceleration < 0 (upward momentum decelerating)
The deceleration requirement ensures we're catching exhaustion rather than fighting momentum.
━━━━━━━━━━━━━━━━━━━━━━━━━━━━━━━━━━━━━━━━
RISK MANAGEMENT
Scale-Out Exit Strategy
Rather than all-or-nothing exits, the strategy takes profits at multiple R-levels:
Scale 1: 20% at 0.5R
Scale 2: 20% at 1.0R
Scale 3: 10% at 1.5R (optional)
Remainder: Trailing stop
This locks in gains while allowing winners to run.
Adaptive Trailing Stop
After reaching the activation threshold (default 1R), the stop trails from the highest high (longs) or lowest low (shorts) at a configurable ATR multiple.
Reversal Logic
When an opposite signal fires while in position, the strategy can close and flip direction rather than waiting for a stop-out.
━━━━━━━━━━━━━━━━━━━━━━━━━━━━━━━━━━━━━━━━
PARAMETER GUIDANCE
Anchor Period (24) : Base period for adaptive anchor
ATR Period (14) : Volatility measurement
Chain Length Mult (2.5) : Tether elasticity — higher = more stretch allowed
Long Tension σ (1.5) : Lower = more signals
Short Tension σ (2.0) : Higher threshold for shorts (trend asymmetry)
Mahalanobis Threshold (6.25) : χ²(3, 0.90) — adjust for signal frequency
CUSUM Threshold (3.0) : Lower = more sensitive to regime shifts
Lookback Window (100) : Statistical estimation window
━━━━━━━━━━━━━━━━━━━━━━━━━━━━━━━━━━━━━━━━
BACKTEST NOTES
Historical testing on NQ (2020-2025) suggests:
Long signals show stronger edge than shorts in equity indices
1H and 30-min timeframes balance signal quality vs. frequency
"Long Only" mode recommended for equity index futures
Important: Past performance does not guarantee future results. This strategy involves significant risk of loss.
━━━━━━━━━━━━━━━━━━━━━━━━━━━━━━━━━━━━━━━━
MATHEMATICAL REFERENCES
Polyak, B.T. (1964). "Some methods of speeding up the convergence of iteration methods" (Heavy ball method)
Bertsekas, D.P. (1999). "Nonlinear Programming" (Heavy ball method / momentum dynamics)
Mahalanobis, P.C. (1936). "On the generalized distance in statistics"
Page, E.S. (1954). "Continuous inspection schemes" (CUSUM)
Kalman, R.E. (1960). "A new approach to linear filtering and prediction problems"
Uhlenbeck, G.E. & Ornstein, L.S. (1930). "On the theory of Brownian motion"
Kaufman, P. (1995). "Smarter Trading" (Adaptive Moving Average)
━━━━━━━━━━━━━━━━━━━━━━━━━━━━━━━━━━━━━━━━
DISCLAIMER
This strategy is provided for educational and research purposes. Trading futures involves substantial risk of loss. The statistical methods employed do not guarantee profitable outcomes. Always use appropriate position sizing and risk management.

Improved Candle Strategy (without daily squared)# Candle Pattern Trading Strategy
## Core Logic
Analyzes the last 5 candlesticks to identify "close at high" and "close at low" patterns, generating long/short signals.
## Trading Conditions
- **Long**: ≥2 bars closed at high in past 5 bars + current bar closes at high → Open long
- **Short**: ≥2 bars closed at low in past 5 bars + current bar closes at low → Open short
- **Filter**: If ≥3 doji patterns detected, skip trading
## Risk Management
- Stop Loss: Based on entry bar's high/low
- Take Profit: Risk × 2x multiplier
- Cooldown: No trading for 2 bars after entry
- Session Filter: No trading for first 5 bars after market open
## Configurable Parameters
- Lookback period, doji threshold, close proximity ratio, TP/SL ratio, cooldown bars, etc.
**Use Cases**: 1-minute and higher timeframes on stocks/futures

Daily Open Shift The "Daily Open Shift" System (V2.0)
1. The Setup (Indicators & Timeframe)
• Timeframe: 15-Minute Chart (Execution).
• Key Levels: Daily Open (DO) or New York Open (NYO).
• Trend Indicators:
o 24 & 42 EMA Ribbon (Exponential Moving Averages).
o 30-Minute Supertrend.
________________________________________
2. Phase 1: Establish The Bias (The Filter)
This is the V2 upgrade. We do not trade against the day's opening momentum.
1. Mark the Open: Draw a horizontal line at the Daily Open (00:00) or Session Open.
2. The "First 2H" Rule: Observe the price action for the first 2 hours after the open.
o First 2H are Green/Bullish? → You are LONG BIAS only for the rest of the session. (Ignore all sell signals).
o First 2H are Red/Bearish? → You are SHORT BIAS only for the rest of the session. (Ignore all buy signals).
________________________________________
3. Phase 2: The Signal (The Switch)
Wait for the chart to confirm your bias technically.
1. The Switch: Price must cross and close a 15M candle on the correct side of the Daily Open.
o Longs: Price switches from below to above DO.
o Shorts: Price switches from above to below DO.
2. Indicator Confluence:
o EMAs: Must be crossed in your direction (Green for Long, Red for Short).
o 30M Supertrend: Must match your direction.
________________________________________
4. Phase 3: The Entry (The Trigger)
We never chase the breakdown. We wait for the price to come to us.
1. The Pullback: Wait for the price to retrace and touch/wick into the 24/42 EMA Ribbon.
2. The Confirmation: Watch the candle that touches the EMA.
o It must reject the EMA (wick off it) and close respecting the trend.
o Do not enter if the candle closes forcefully through the EMA, breaking structure.
3. Execution: Enter Market Order immediately on that candle close.
________________________________________
5. Phase 4: Risk Management (The Math)
This is the V2 upgrade. We aim for higher profitability.
1. Stop Loss (SL):
o Longs: Placed strictly below the lowest EMA band.
o Shorts: Placed strictly above the highest EMA band.
o Logic: If price crosses the EMA band completely, the trend is dead. Get out.
2. Take Profit (TP):
o FIXED 3R (Reward = 3x Risk).
o Example: If Risk is $100, TP is set to make $300.
o Rule: Do not move the TP. Do not close early. Let the math play out.
________________________________________
Summary Checklist (Print This)
Time: Is the First 2H bias clear? (Green=Buy / Red=Sell)
Switch: Did price close above/below the Daily Open?
Trend: Are EMAs crossed and Supertrend agreeing?
Patience: Did I wait for the price to pull back to the EMA band?
Trigger: Did the candle close respecting the EMA?
Execution: Market Entry + Stop Loss behind EMA + Fixed 3R Target.
Mindset: Am I at "2/10" emotion? Set the trade and walk away.

Optimized BTC Mean Reversion (RSI 20/65)📈 Optimized BTC Mean Reversion (RSI 20/65)
Optimized BTC Mean Reversion (RSI 20/65) is a rule-based trading strategy designed to capture mean-reversion moves in strong market structures, primarily optimized for Bitcoin, but adaptable to other liquid cryptocurrencies.
The strategy combines RSI extremes, Stochastic momentum, and EMA trend filtering to identify high-probability reversal zones while maintaining strict risk management.
🔍 Strategy Logic
This system focuses on entering trades when price temporarily deviates from equilibrium, while still respecting the broader trend.
✅ Long Conditions
RSI below 20 (oversold)
Stochastic below 25
Price trading above the 200 EMA (or within a controlled deviation)
Designed to buy sharp pullbacks in bullish conditions
❌ Short Conditions
RSI above 65 (overbought)
Stochastic above 75
Price trading below the 200 EMA
Designed to sell relief rallies in bearish conditions
🛡 Risk Management
Fixed Stop Loss: 4%
Fixed Take Profit: 6%
Risk/Reward: 1 : 1.5
No pyramiding (single position at a time)
Full equity position sizing (adjustable)
All exits are predefined at entry, ensuring consistency and emotional discipline.
📊 Indicators Used
200 EMA – Trend direction filter
RSI (14) – Mean-reversion trigger (20 / 65 levels)
Stochastic Oscillator – Momentum confirmation
👁 Visual Features
EMA plotted directly on chart
Real-time Stop Loss, Take Profit, and Entry Price lines
Clear long/short entry markers
Works on all timeframes (optimized for intraday and swing trading)
🔔 Alerts
Long entry alerts
Short entry alerts
(Perfect for automation or discretionary execution)
⚠️ Disclaimer
This strategy is intended for educational and research purposes only. Past performance does not guarantee future results. Always test on a demo account and adjust risk parameters to your own trading plan.

[SM-021] Gaussian Trend System [Optimized]This script is a comprehensive trend-following strategy centered around a Gaussian Channel. It is designed to capture significant market movements while filtering out noise during consolidation phases. This version (v2) introduces code optimizations using Pine Script v6 Arrays and a new Intraday Time Control feature.
1. Core Methodology & Math
The foundation of this strategy is the Gaussian Filter, originally conceptualized by @DonovanWall.
Gaussian Poles: Unlike standard moving averages (SMA/EMA), this filter uses "poles" (referencing signal processing logic) to reduce lag while maintaining smoothness.
Array Optimization: In this specific iteration, the f_pole function has been refactored to utilize Pine Script Arrays. This improves calculation efficiency and rendering speed compared to recursive variable calls, especially when calculating deep historical data.
Channel Logic: The strategy calculates a "Filtered True Range" to create High and Low bands around the main Gaussian line.
Long Entry: Price closes above the High Band.
Short Entry: Price closes below the Low Band.
2. Signal Filtering (Confluence)
To reduce false signals common in trend-following systems, the strategy employs a "confluence" approach using three additional layers:
Baseline Filter: A 200-period (customizable) EMA or SMA acts as a regime filter. Longs are only taken above the baseline; Shorts only below.
ADX Filter (Volatility): The Average Directional Index (ADX) is used to measure trend strength. If the ADX is below a user-defined threshold (default: 20), the market is considered "choppy," and new entries are blocked.
Momentum Check: A Stochastic RSI check ensures that momentum aligns with the breakout direction.
3. NEW: Intraday Session Filter
Per user requests, a time-based filter has been added to restrict trading activity to specific market sessions (e.g., the New York Open).
How it works: Users can toggle a checkbox to enable/disable the filter.
Configuration: You can define a specific time range (Default: 09:30 - 16:00) and a specific Timezone (Default: New York).
Logic: The strategy longCondition and shortCondition now check if the current bar's timestamp falls within this window. If outside the window, no new entries are generated, though existing trades are managed normally.
4. Risk Management
The strategy relies on volatility-based exits rather than fixed percentage stops:
ATR Stop Loss: A multiple of the Average True Range (ATR) is calculated at the moment of entry to set a dynamic Stop Loss.
ATR Take Profit: An optional Reward-to-Risk (RR) ratio can be set to place a Take Profit target relative to the Stop Loss distance.
Band Exit: If the trend reverses and price crosses the opposite band, the trade is closed immediately to prevent large drawdowns.
Credits & Attribution
Original Gaussian Logic: Developed by @DonovanWalll. This script utilizes his mathematical formula for the pole filters.
Strategy Wrapper & Array Refactor: Developed by @sebamarghella.
Community Request: The Intraday Session Filter was added to assist traders focusing on specific liquidity windows.
Disclaimer: This strategy is for educational purposes. Past performance is not indicative of future results. Please use the settings menu to adjust the Session Time and Risk parameters to fit your specific asset class.

Strong Candle Probability Levels Tester [SYNC & TRADE]### Strategy Description: Strong Candle Probability Levels Tester
This strategy is a powerful tool for testing and visualizing probability levels based on strong candles, incorporating Volume Delta, Supertrend, and dynamic Fibonacci grids. Designed as a tester/trainer for traders analyzing price behavior around key support/resistance levels formed by strong impulse candles. It combines indicator elements for signal visualization with backtesting of trading scenarios, allowing evaluation of entry and exit effectiveness in real market conditions.
The main goal is to help traders understand how strong candles (with high volume and delta) influence subsequent price movement and test strategies based on Fibonacci extensions. It's not just an indicator but a full tester that simulates orders, stop-losses, take-profits, and advanced position management rules. Useful for beginners and experienced traders: enables practicing risk management, analyzing historical data, and optimizing approaches without real losses. Ultimately, you get visual feedback on level achievement probabilities, PNL statistics, and insights into market manipulations.
#### How the Strategy Works
The strategy identifies "strong candles" — impulse bars with elevated volume and significant delta (difference between buys and sells). Based on them, it builds a Fibonacci grid for potential entries (retracements) and exits (extensions). Additionally integrated are ATR filters for candle strength confirmation and Supertrend for trend context. The tester simulates pyramiding (adding positions), trailing stops, partial closes, and other rules to model real trading.
- **Volume Delta Analysis**: Visualizes volume deltas across timeframes to detect manipulations and impulse strength. Helpful for spotting when a candle is "strong" (high delta in the direction of movement) or "manipulative" (delta opposite to candle color).
- **Supertrend Filter**: Adds a trend indicator with an adaptive multiplier considering delta. Helps filter signals in trends, avoiding false entries.
- **Fibonacci Grid**: Automatically plots entry levels (retracements from 0% to 78.6%) and take-profits (extensions from 127.2% to 462%). The grid is "smart" — with advanced rules for profit protection and market adaptation.
The strategy does not reveal internal algorithms for strong candle detection but focuses on practical application: the tester shows how price reacts to these levels, aiding in assessing goal achievement probabilities.
#### How to Use
1. **Add to Chart**: In TradingView, select the tool, specify symbol (stocks, crypto, forex), and timeframe (recommended M5 to D1 for Volume Delta accuracy).
2. **Configure Settings**:
- **Volume Delta Section**: Enable strong candles and manipulations display. Set ATR period for filter (default 3) and minimum body size (ATR multiplier, default 0.5). This ignores weak impulses.
*(Add photo here: example chart with strong candle marked by circle and delta as colored layers on bar.)*
- **Supertrend Section**: Enable for trend filtering. Set ATR length (default 5) and multiplier (default 2.62). Delta or strong candle filter options enhance signals.
*(Photo: chart with Supertrend line colored by z-score strength and trend background.)*
- **Fibonacci Basics**: Choose direction (long/short/both), stop-loss mode (crossover or body close). Specify lot per level (default 0.1) and max active grids (default 7).
*(Photo: grid with entry and TP levels on real chart, with orders.)*
- **Advanced Rules**: Activate options like protection at 161.8%/261.8%, grid lock after 127.2%, trailing after TP1, partial close on pullback, pyramiding, time/momentum exits, or "news". This simulates complex scenarios.
- **Risk Management**: Enable exposure limit (max entry amount in USD) for safe testing.
*(Photo: PNL and risk stats in strategy table.)*
- **Entry/TP Levels**: Enable desired Fibonacci levels (retracements for entries, extensions for TP).
*(Photo: full grid with filled orders and partial TP.)*
- **Visualization**: Enable grid level display for clarity.
*(Photo: multiple grids on chart with base price and SL lines.)*
3. **Interpret Signals**:
- **Strong Candle**: Marked by circle (blue for long, red for short). Z-label in circle shows strength (2+ for significant).
- **Manipulation**: Cross (X) indicates potential trap (delta opposite to candle).
- **Grid**: Forms on strong candle. Entries — limit orders on retracements, TP on extensions. Monitor fills and closes in strategy report.
- **Supertrend**: Trend line with color gradation by strength (darker = stronger). Background highlights direction.
4. **Testing**:
- Run backtest in TradingView (select period, capital). Analyze metrics: PNL, drawdown, win-rate.
- Train: Change settings, observe rule impacts (e.g., trailing reduces risks but may miss profits).
- For live chart: Use as indicator for manual entries, ignoring orders.
#### Purpose and Benefits
This strategy is an ideal trainer for mastering probability trading based on strong candles and Fibonacci. It provides:
- **Probability Visualization**: Shows how often price hits levels (127.2%, 161.8%, etc.), helping assess risk/reward.
- **Risk Management Training**: Simulates real scenarios with pyramiding, trailing, partial closes, and exposure limits, reducing emotional errors.
- **Manipulation Analysis**: Volume Delta reveals hidden signals (weak/strong delta), useful for avoiding traps in volatile markets.
- **Trend Filter**: Supertrend with delta adaptation improves entry accuracy in trends.
- **Stats and Insights**: Report includes unrealized/realized PNL, average entry price, risk to SL. Aids in optimizing strategies for different assets.
Useful for: idea testing without risk, beginner education (visually intuitive), pro discipline improvement. Recommended to combine with other tools for signal confirmation. Remember: this is a tester, not financial advice — always demo test!

Reversal WaveThis is the type of quantitative system that can get you hated on investment forums, now that the Random Walk Theory is back in fashion. The strategy has simple price action rules, zero over-optimization, and is validated by a historical record of nearly a century on both Gold and the S&P 500 index.
Recommended Markets
SPX (Weekly, Monthly)
SPY (Monthly)
Tesla (Weekly)
XAUUSD (Weekly, Monthly)
NVDA (Weekly, Monthly)
Meta (Weekly, Monthly)
GOOG (Weekly, Monthly)
MSFT (Weekly, Monthly)
AAPL (Weekly, Monthly)
System Rules and Parameters
Total capital: $10,000
We will use 10% of the total capital per trade
Commissions will be 0.1% per trade
Condition 1: Previous Bearish Candle (isPrevBearish) (the closing price was lower than the opening price).
Condition 2: Midpoint of the Body The script calculates the exact midpoint of the body of that previous bearish candle.
• Formula: (Previous Open + Previous Close) / 2.
Condition 3: 50% Recovery (longCondition) The current candle must be bullish (green) and, most importantly, its closing price must be above the midpoint calculated in the previous step.
Once these parameters are met, the system executes a long entry and calculates the exit parameters:
Stop Loss (SL): Placed at the low of the candle that generated the entry signal.
Take Profit (TP): Calculated by projecting the risk distance upward.
• Calculation: Entry Price + (Risk * 1).
Risk:Reward Ratio of 1:1.
About the Profit Factor
In my experience, TradingView calculates profits and losses based on the percentage of movement, which can cause returns to not match expectations. This doesn’t significantly affect trending systems, but it can impact systems with a high win rate and a well-defined risk-reward ratio. It only takes one large entry candle that triggers the SL to translate into a major drop in performance.
For example, you might see a system with a 60% win rate and a 1:1 risk-reward ratio generating losses, even though commissions are under control relative to the number of trades.
My recommendation is to manually calculate the performance of systems with a well-defined risk-reward ratio, assuming you will trade using a fixed amount per trade and limit losses to a fixed percentage.
Remember that, even if candles are larger or smaller in size, we can maintain a fixed loss percentage by using leverage (in cases of low volatility) or reducing the capital at risk (when volatility is high).
Implementing leverage or capital reduction based on volatility is something I haven’t been able to incorporate into the code, but it would undoubtedly improve the system’s performance dramatically, as it would fix a consistent loss percentage per trade, preventing losses from fluctuating with volatility swings.
For example, we can maintain a fixed loss percentage when volatility is low by using the following formula:
Leverage = % of SL you’re willing to risk / % volatility from entry point to exit or SL
And if volatility is high and exceeds the fixed percentage we want to expose per trade (if SL is hit), we could reduce the position size.
For example, imagine we only want to risk 15% per SL on Tesla, where volatility is high and would cause a 23.57% loss. In this case, we subtract 23.57% from 15% (the loss percentage we’re willing to accept per trade), then subtract the result from our usual position size.
23.57% - 15% = 8.57%
Suppose I use $200 per trade.
To calculate 8.57% of $200, simply multiply 200 by 8.57/100. This simple calculation shows that 8.57% equals about $17.14 of the $200. Then subtract that value from $200:
$200 - $17.14 = $182.86
In summary, if we reduced the position size to $182.86 (from the usual $200, where we’re willing to lose 15%), no matter whether Tesla moves up or down 23.57%, we would still only gain or lose 15% of the $200, thus respecting our risk management.
Final Notes
The code is extremely simple, and every step of its development is detailed within it.
If you liked this strategy, which complements very well with others I’ve already published, stay tuned. Best regards.

1-Hour Trend Breakout Strategy (Scaled Entry Version)This strategy is a trend-following system on the Bitcoin 1-hour chart.
It enters in the direction of the market when price breaks an upward or downward trendline, using scaled (partial) entries.
Entry Rules
Go long when price breaks an upward trendline.
Go short when price breaks a downward trendline.
Position size is split into several parts and entered gradually.
Trade Management
When the first take-profit level (TP1) is reached, a portion of the position is closed.
The stop-loss on the remaining position is moved to break-even (entry price) to lock in profits and manage risk.
Performance
Period: 2019-12-16 to 2025-12-07
Total P&L: +2,385%
Maximum Drawdown (MDD): 28%
Win Rate: 79%
Profit Factor: 3.1

YCGH Ultimate Stocks Breakout Sniper📈 YCGH Ultimate Stocks Breakout Sniper
Overview
A sophisticated momentum-based breakout strategy designed to capture high-probability directional moves during volatility expansion phases. This system identifies breakout opportunities when price decisively breaks through established ranges, combining multiple technical filters to enhance signal quality and minimize false breakouts.
🎯 Strategy Features
Core Methodology:
Proprietary breakout detection algorithm
Multi-layered confirmation filters for signal validation
Adaptive trailing stops for profit protection
Systematic risk management with daily drawdown controls
Key Components:
✅ Volatility Expansion Filter - Only trades during periods of elevated market volatility to avoid choppy, range-bound conditions
✅ Optional Trend Alignment - Configurable trend filter (EMA/SMA/RMA/WMA) to align entries with broader market direction
✅ ROC Momentum Filter - Daily rate-of-change filter to capture strong momentum days (optional)
✅ Comprehensive Exit Strategy:
Fixed stop-loss (default 2%)
Take-profit targets (default 9%)
Dynamic trailing stops (2% activation, 0.5% offset)
✅ Flexible Direction Trading:
Auto-detect mode: Long+Short for perpetuals, Long-only for spot/equities
Manual override options available
Suitable for both crypto and stock markets
📊 Market Applicability
Optimized for: Cryptocurrency perpetual contracts and equity markets (1H-4H timeframes)
Also effective on: Futures and high-liquidity spot markets
The strategy adapts to different market regimes through configurable volatility and trend filters, making it versatile across various trading instruments and timeframes.
⚙️ Risk Management
Position Sizing: Percentage-based allocation with leverage support
Intraday Loss Limit: Maximum 10% drawdown protection (configurable)
Realistic Cost Modeling: 0.025% commission + 1 tick slippage
No Pyramiding: Single position management for controlled risk exposure
📈 Performance Visualization
Includes a comprehensive monthly returns table displaying:
Year-by-year performance breakdown
Monthly profit/loss percentages
Visual color-coding (green for profits, red for losses)
Clean, modern design with transparent styling
🔐 Access & Pricing
This is a PROTECTED, invite-only strategy.
The source code is not open-source and requires paid access for usage.
How to Get Access:
📧 Email: brijamohanjha@gmail.com
Include in your email:
Your TradingView username
Markets/assets you plan to trade
Preferred timeframe
What You'll Receive:
Full strategy access with invite-only permissions
Complete parameter documentation
Setup and optimization guidance
Implementation support
⚠️ Important Disclosures
Backtesting Parameters:
Commission: 0.025% per trade
Slippage: 1 tick
Results reflect realistic trading conditions
Risk Warning:
Past performance does not guarantee future results. This strategy involves substantial risk and may not be suitable for all investors. Users should thoroughly understand the risks and customize parameters based on their risk tolerance and market conditions.
📞 Contact for Access
Email: brijamohanjha@gmail.com
For questions about functionality, pricing, optimization, or market-specific settings, please reach out via email.
Note: This is a premium, paid strategy. Access is granted manually after consultation and payment confirmation.

BTC Fear & Greed Incremental StrategyIMPORTANT: READ SETUP GUIDE BELOW OR IT WON'T WORK
# BTC Fear & Greed Incremental Strategy — TradeMaster AI (Pure BTC Stack)
## Strategy Overview
This advanced Bitcoin accumulation strategy is designed for long-term hodlers who want to systematically take profits during greed cycles and accumulate during fear periods, while preserving their core BTC position. Unlike traditional strategies that start with cash, this approach begins with a specified BTC allocation, making it perfect for existing Bitcoin holders who want to optimize their stack management.
## Key Features
### 🎯 **Pure BTC Stack Mode**
- Start with any amount of BTC (configurable)
- Strategy manages your existing stack, not new purchases
- Perfect for hodlers who want to optimize without timing markets
### 📊 **Fear & Greed Integration**
- Uses market sentiment data to drive buy/sell decisions
- Configurable thresholds for greed (selling) and fear (buying) triggers
- Automatic validation to ensure proper 0-100 scale data source
### 🐂 **Bull Year Optimization**
- Smart quarterly selling during bull market years (2017, 2021, 2025)
- Q1: 1% sells, Q2: 2% sells, Q3/Q4: 5% sells (configurable)
- **NO SELLING** during non-bull years - pure accumulation mode
- Preserves BTC during early bull phases, maximizes profits at peaks
### 🐻 **Bear Market Intelligence**
- Multi-regime detection: Bull, Early Bear, Deep Bear, Early Bull
- Different buying strategies based on market conditions
- Enhanced buying during deep bear markets with configurable multipliers
- Visual regime backgrounds for easy market condition identification
### 🛡️ **Risk Management**
- Minimum BTC allocation floor (prevents selling entire stack)
- Configurable position sizing for all trades
- Multiple safety checks and validation
### 📈 **Advanced Visualization**
- Clean 0-100 scale with 2 decimal precision
- Three main indicators: BTC Allocation %, Fear & Greed Index, BTC Holdings
- Real-time portfolio tracking with cash position display
- Enhanced info table showing all key metrics
## How to Use
### **Step 1: Setup**
1. Add the strategy to your BTC/USD chart (daily timeframe recommended)
2. **CRITICAL**: In settings, change the "Fear & Greed Source" from "close" to a proper 0-100 Fear & Greed indicator
---------------
I recommend Crypto Fear & Greed Index by TIA_Technology indicator
When selecting source with this indicator, look for "Crypto Fear and Greed Index:Index"
---------------
3. Set your "Starting BTC Quantity" to match your actual holdings
4. Configure your preferred "Start Date" (when you want the strategy to begin)
### **Step 2: Configure Bull Year Logic**
- Enable "Bull Year Logic" (default: enabled)
- Adjust quarterly sell percentages:
- Q1 (Jan-Mar): 1% (conservative early bull)
- Q2 (Apr-Jun): 2% (moderate mid bull)
- Q3/Q4 (Jul-Dec): 5% (aggressive peak targeting)
- Add future bull years to the list as needed
### **Step 3: Fine-tune Thresholds**
- **Greed Threshold**: 80 (sell when F&G > 80)
- **Fear Threshold**: 20 (buy when F&G < 20 in bull markets)
- **Deep Bear Fear Threshold**: 25 (enhanced buying in bear markets)
- Adjust based on your risk tolerance
### **Step 4: Risk Management**
- Set "Minimum BTC Allocation %" (default 20%) - prevents selling entire stack
- Configure sell/buy percentages based on your position size
- Enable bear market filters for enhanced timing
### **Step 5: Monitor Performance**
- **Orange Line**: Your BTC allocation percentage (target: fluctuate between 20-100%)
- **Blue Line**: Actual BTC holdings (should preserve core position)
- **Pink Line**: Fear & Greed Index (drives all decisions)
- **Table**: Real-time portfolio metrics including cash position
## Reading the Indicators
### **BTC Allocation Percentage (Orange Line)**
- **100%**: All portfolio in BTC, no cash available for buying
- **80%**: 80% BTC, 20% cash ready for fear buying
- **20%**: Minimum allocation, maximum cash position
### **Trading Signals**
- **Green Buy Signals**: Appear during fear periods with available cash
- **Red Sell Signals**: Appear during greed periods in bull years only
- **No Signals**: Either allocation limits reached or non-bull year
## Strategy Logic
### **Bull Years (2017, 2021, 2025)**
- Q1: Conservative 1% sells (preserve stack for later)
- Q2: Moderate 2% sells (gradual profit taking)
- Q3/Q4: Aggressive 5% sells (peak targeting)
- Fear buying active (accumulate on dips)
### **Non-Bull Years**
- **Zero selling** - pure accumulation mode
- Enhanced fear buying during bear markets
- Focus on rebuilding stack for next bull cycle
## Important Notes
- **This is not financial advice** - backtest thoroughly before use
- Designed for **long-term holders** (4+ year cycles)
- **Requires proper Fear & Greed data source** - validate in settings
- Best used on **daily timeframe** for major trend following
- **Cash calculations**: Use allocation % and BTC holdings to calculate available cash: `Cash = (Total Portfolio × (1 - Allocation%/100))`
## Risk Disclaimer
This strategy involves active trading and position management. Past performance does not guarantee future results. Always do your own research and never invest more than you can afford to lose. The strategy is designed for educational purposes and long-term Bitcoin accumulation thesis.
---
*Developed by Sol_Crypto for the Bitcoin community. Happy stacking! 🚀*

RSI Risk | AlgoFy TraderRSI Risk | AlgoFy Trader
Overview
The RSI Risk | AlgoFy Trader is a trading system that combines RSI-based entry signals with automated capital management. This strategy identifies potential momentum shifts while controlling risk through calculated position sizing.
Key Features
Dynamic Risk Management:
Fixed Risk Per Trade: Users set maximum risk percentage per trade.
Automatic Position Sizing: Calculates position size based on stop-loss distance.
Capital Protection: Limits each trade's risk to user-defined percentage.
RSI Entry System:
Momentum Detection: Uses RSI crossovers above/below defined thresholds.
Clear Signals: Provides long/short entries on momentum transitions.
Multiple Exit Layers:
Dynamic Stop Loss: Stop based on recent price structure.
Fixed Safety Stop: Optional percentage-based stop loss.
Partial Take Profit: Optional early profit-taking.
Trailing Stop: Optional dynamic profit protection.
Performance Tracking:
Trade Statistics: Tracks win/loss streaks and performance metrics.
Monthly Dashboard: Shows monthly/yearly P&L with equity views.
Trade Details: Displays risk percentage and position size.
How It Works
Signal Detection: Monitors RSI for crossover events.
Risk Calculation: Determines stop-loss based on recent volatility.
Position Sizing: Calculates exact position to match risk percentage.
Example:
Account: $10,000 | Risk: 2% ($200 max)
Stop loss at 4% distance
Position size: $5,000
Result: 4% loss on $5,000 = $200 (2% of account)
Recommended Settings
Risk: 1-2% per trade
Enable fixed stop at 3-4%
Consider trailing stop activation
This script provides disciplined RSI trading with automated risk control, adjusting exposure while maintaining strict risk limits.

DOGE Stochastic RSI Pro System📌 Strategy Overview
The DOGE Stochastic RSI Pro System is a high-precision algorithm designed specifically for DOGEUSDT on the 1-hour timeframe.
It combines the power of Stochastic RSI momentum, EMA trend direction, and VWAP price positioning to generate high-probability long and short entries.
This system was optimized through multi-year backtesting and short-term adaptive tuning, showing strong performance during trending and volatility-rich periods.
📌 Technical Logic
✔ 1. Stochastic RSI Core
Entry when %K crosses %D
Detects momentum reversals early
Works effectively on DOGE volatility cycles
✔ 2. EMA Trend Filter
EMA50 above EMA150 → long-bias signals allowed
EMA50 below EMA150 → short-bias signals allowed
Prevents trading against the dominant trend
Improves signal accuracy
✔ 3. VWAP Institutional Filter
Price above VWAP → only long entries
Price below VWAP → only short entries
Avoids low-quality trades in mean-reversion zones
📌 Money Management
✔ Starting Amount: 5 USDT
✔ Take Profit: 3%
✔ Stop Loss: 3%
✔ Both Long & Short
✔ No Martingale — Clean, stable system
The strategy opens one position at a time to avoid overexposure.
📌 Recommended Settings
Pair: DOGEUSDT
Timeframe: 1H
Leverage (Bybit): 5–10× (optional, system does not enforce leverage)
Broker Execution: Bybit derivatives or spot with position sizing
📌 Backtesting Results (User Verified)
1 Year Backtest: ~57–58% win rate
2 Year Backtest: ~56% win rate
Last 3 Months: ~61% win rate
Last 30 Days: ~64% win rate
Profit Factor Range: 1.32 – 1.70
This system performs best in moderate trending + volatility expansion cycles.
📌 Notes for Users
Strategy does not repaint.
Behavior may vary depending on exchange price feeds.
Use proper risk management and test before going live.
Performance may change over time as markets shift.
📌 Access
This is an Invite-Only script.
Access is granted only to approved users.
If you'd like access, send a private request.
📌 Disclaimer
This script is for educational and research purposes only.
Not financial advice. Trading involves risk.
Past performance does not guarantee future results.

--0-- Base Estrategias 4.0Universal Strategy Builder is an advanced multi-purpose trading engine designed for traders who want to build, test, and automate complete systems without writing Pine Script.
This tool combines multiple entry logics, dynamic filters, risk-management modules, and configurable exit conditions into a single framework.
It is not a “signal indicator.”
It is an infrastructure layer for creating strategies on any market and timeframe.
Key Features
• Entry Modules
Moving Average Cross
RSI-based setups
MACD setups
Chandelier Exit logic
Custom filters for trend, momentum and volatility
Multi-filter stacking (MA, RSI, MACD, AO, custom conditions)
• Risk Management
Percentage-based Stop Loss
ATR-based Stop Loss
Swing High/Low stop logic
Candle-based cancellation rules
Close-on-reversal option
• Take Profit System
Multiple TP levels
Percentage or ATR-derived targets
Multi-stage position scaling
Optional trailing stop with custom activation and distance
• Full MA Suite
6 independent moving averages
EMA/SMA/WMA/RMA
Flexible period and source selection
• Oscillator Suite
RSI (with OB/OS triggers and cross filters)
MACD with adjustable smoothing
Awesome Oscillator
Multi-timeframe filter options
• Bot-Ready
Designed to work seamlessly with:
Webhooks
External automation platforms
Copy-trading engines
Strategy replicators
Who Is This For?
This tool is intended for traders who want to:
Develop systematic strategies
Optimize entry/exit conditions
Combine multiple confirmation layers
Backtest ideas without coding
Build bot-ready setups quickly and consistently
Important Notes
This is a professional toolkit.
It does not predict the market or guarantee profitable results.
Performance depends entirely on how the user configures the system, market conditions, risk parameters, and execution quality.
Access
This script is provided as invite-only.
Please contact the author if you would like to request access.

Mean Reversion — BB + Z-Score + RSI + EMA200 (TP at Opposite Z)This is a systematic mean-reversion framework for index futures and other liquid assets.
This strategy combines Bollinger Bands, Z-Score dislocation, RSI extremes, and a trend-filtering EMA200 to capture short-term mean-reversion inefficiencies in NQ1!. It is designed for high-volatility conditions and uses a precise exit model based on opposite-side Z-Score targets and dynamic mid-band failure detection.
🔍 Entry Logic (Mean Reversion) :
The strategy enters trades only when multiple confluence signals align:
Long Setup
Price at or below the lower Bollinger Band
Z-Score ≤ –Threshold (deep statistical deviation)
RSI ≤ oversold level
Price below the EMA-200 (countertrend mean-reversion only)
Cooldown must be completed
No open position
Short Setup
Price at or above the upper Bollinger Band
Z-Score ≥ Threshold
RSI ≥ overbought level
Price above the EMA-200
Cooldown complete
No open position
This multi-signal gate filters out weak reversions and focuses on mature dislocations.
🎯 Take-Profit Model: Opposite-Side Z-Score Target :
Once in a trade, take-profit is set by solving for the price where the Z-Score reaches the opposite side:
Long TP = Z = +Threshold
Short TP = Z = –Threshold
This creates a symmetric statistical exit based on reverting to equilibrium plus overshoot.
🛡️ Stop-Loss System (Volatility-Aware) :
Stop losses combine:
A fixed base stop (points)
A standard-deviation volatility component
This adapts the SL to regime changes and avoids being shaken out during rare volatility spikes.
⏳ Half-Life Exit :
If a trade has not reverted within a fixed number of bars, it automatically closes.
This prevents “mean-reversion traps” during trending periods.
📉 Advanced Mid-Band Exit Logic (BB Basis Failure) :
This is the unique feature of the system.
After entry:
Wait for price to cross the Bollinger Basis (middle band) in the direction of the mean.
Start a 5-bar delay timer.
After 5 bars, the strategy becomes “armed.”
Once armed:
If price fails back through the mean, exit immediately.
Intrabar exits trigger precisely (with tick-level precision if Bar Magnifier is enabled).
This protects profits and exits trades at the first sign of mean-failure.
⏱️ Cooldown System :
After each closed trade, a cooldown period prevents immediate re-entry.
This avoids clustering and improves statistical independence of trades.
🖥️ What This Strategy Is Best For :
High-volatility intraday NQ conditions
Statistical mean reversion with structured confluence
Traders who want clean, rule-based entries
Avoiding trend-day traps using EMA and half-life logic
📊 Included Visual Elements :
Bollinger Bands (Upper, Basis, Lower)
BUY/SELL markers at signal generation
Optional alerts for automated monitoring
🚀 Summary :
This is a precision mean-reversion system built around volatility bands, statistical dislocation, and price-behavior confirmation. By combining Z-Score, RSI, EMA200 filtering, and a sophisticated mid-band failure exit, this model captures high-probability reversions while avoiding the common pitfalls of naive band-touch systems.

Mean-Reversion with CooldownThis strategy requires no indicators or fundamental analysis. It is designed for longer-term positions and works especially well on unleveraged instruments with strong long-term upward trends, such as precious metals. Feel free to experiment with different timeframes — I’ve found that 1-hour charts work particularly well for cryptocurrencies.
The idea is to filter out ongoing bear phases as effectively as possible and capitalize on long-term bull runs.
The script implements an idea that came to me in a state of complete sleep deprivation: open a random long position with a fixed take-profit (TP) and a tight stop-loss (SL).
If the TP is hit — great, we simply try again.
If the SL is triggered — too bad, we pause for a while and then try again.
## Cooldown (Waiting) Mechanism
The waiting mechanism is simple: the more consecutive SL hits we get, the longer we wait before opening the next trade. The waiting time is measured in closed candles, and thus depends on the timeframe you are using.
## Two cooldown calculation modes are currently supported:
### 1. FIBONACCI
The cooldown follows the Fibonacci sequence, based on the number of consecutive losses:
1st loss → wait 1 bar
2nd loss → wait 1 bar
3rd loss → wait 2 or 3 bars (depending on definition)
4th loss → wait 3 or 5 bars
etc.
### 2. POWER OF TWO
The cooldown increases exponentially:
1st loss → wait 2 bars
2nd loss → wait 4 bars
3rd loss → wait 8 bars
4th loss → wait 16 bars
and so on, using the formula 2ⁿ.
## Configurable Parameters
### Cooldown Pause Calculation
The settings allow you to define the SL and TP as percentages of the position value.
The "Cooldown Pause Calculation" option determines how the next cooldown duration is computed after a losing trade.
The system keeps track of how many consecutive losses have occurred since the last profitable trade. That counter is then used to compute how many bars we must wait before opening the next position.
### Maximum Cooldown
The "Max Cooldown Candles" setting defines the maximum number of bars we are allowed to wait before placing a new trade. This prevents the strategy from “locking itself out” for too long and mitigates the fear of missing out (FOMO).
Once the cooldown duration reaches this maximum, the system essentially wraps around and starts the progression again. In the script, this is handled using a simple modulo operation based on the chosen maximum.

KAMA Flip strategyI built this strategy because I wanted something that doesn’t overcomplicate trading.
No 20 indicators, no guessing, no “maybe I should close here.”
Just a clear momentum flip, a defined stop, and a defined take profit. (for me on 1D BTC chart it works best with 6% stoploss and 3% takeprofit, lookback should be 40, everything else standard)
The idea is simple: when momentum shifts, I want to be on the right side of it.
KAMA is good for this because it speeds up when the market moves and slows down when it doesn’t.
I normalize it so it becomes a clean zero-line oscillator.
Above zero means momentum is turning up. Below zero means it’s turning down.
That’s the entire entry logic. A flip is a flip.
The exit logic is just as simple: one stop loss, one take profit, both fixed percentages from the entry.
The position closes 100% at the target or the stop. No scaling in, no scaling out, no trailing.
It’s straightforward and easy to analyze because every trade has the exact same structure.
I originally made this for BTC on the daily chart, but nothing stops you from trying it on other charts.
If you want it only to go long, only to go short, or take both sides, you can set that.
All the KAMA parameters are open so you can play with how reactive the signal is.
The visuals and SL/TP lines can be turned on or off depending on how clean you want your chart.
This isn’t financial advice. It’s just a system I like because it’s simple, objective, and does exactly what it’s supposed to do.
Test it, adjust it, break it, rebuild it — do whatever fits your own approach.

RUSSFEST SMC Strategy V1.4RUSSFEST SMC Strategy V1.4 is a multi-timeframe Smart Money Concepts framework that builds a clean, rule-based view of market structure and then trades directly off that structure. It’s designed for traders who want to systematize SMC logic, keep their charts readable, and automate their trading.
Instead of relying on lagging oscillators, the strategy continuously tracks the active price leg, labels strong/weak highs and lows, and reacts to structural shifts in real time. The current timeframe leg is always drawn on your chart with a clear high, low, and midpoint, so you can instantly see whether price is trading in a discount or premium relative to the leg. Trade entries are driven by confirmed events aligned with directional bias, not by single-candle patterns.
A higher-timeframe (HTF) structure engine runs in the background and can be overlaid on your execution timeframe (e.g., 4H structure on a 15m chart). This HTF leg provides the primary bias and defines HTF discount/premium zones so that longs can be constrained to discounted areas of a bullish leg and shorts to premium areas of a bearish leg. An optional additional HTF bias can be turned on for traders who want an extra top-down filter before any position is allowed.
Risk management is fully structure-based. Stops are always placed beyond the current structure high/low with an optional buffer, so every trade is anchored to a meaningful swing point instead of arbitrary points. Take-profit logic is configurable:
Fixed RR – simple R-multiple targeting off the structure-based stop.
HTF Weak High/Low – targets the opposing side of the active HTF leg.
Opposite CHoCH – dynamically exits when structure flips against the position, effectively using the next structural shift as an exit rule.
Key Features:
Full SMC-style price leg tracking with strong/weak highs & lows and midpoint.
Multi-timeframe structure: overlay HTF leg on your LTF execution chart.
Primary and optional secondary HTF bias filters.
Discount/premium gating relative to the HTF leg (no “chasing” in the wrong zone).
Structure-anchored stop loss with three exit modes (Fixed RR, HTF target, Opposite CHoCH).
Day-of-week filters for filtering out any days that don't prove to be profitable.
This script is a structured SMC framework, not financial advice. Markets are risky; always forward-test, adjust parameters for your instrument and timeframe, and use position sizing that fits your own risk tolerance.
