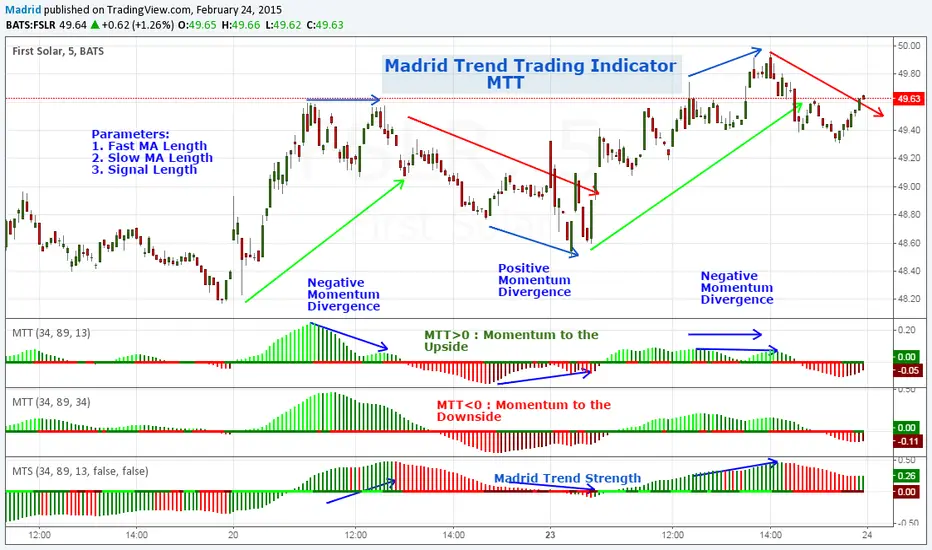
Madrid Trend TradingMadrid Trend Trading is an indicator that shows Momentum direction and strength based on a given trend (pair of MA's). It is useful to detect the direction of the trend, Momentum divergences with the trend and possible trend reversals.
Parameters
1. Fast MA Length
2. Slow MA Length
3. Signal Length
Trading with MTT
1. MTT > 0 and increasing (Lime) : Long position
2. MTT > 0 and decreasing (Green) : entry/exit long position, take profits or plan an entry
3. MTT < 0 and decreasing (Red) : Short position
4. MTT <0 and increasing (Maroon) : entry/exit short position, take profits or plan entry
This shows the market waves, it's a good indicator for swing trading since it shows the change of direction of the trend, signals profit areas and entry/exit regions. Change in the direction of the trend can be spotted by the cross over the zero line or by trend divergences, H-H in the trend and L-H in the MTT indicator means a downtrend is close. L-L in the trend and H-L in the indicator means an uptrend is forming.
There is a bar in the zero line that shows the momentum direction, simple, green it's increasing, red, it's decreasing.
This indicator is meant to be a companion of the MTS indicator. When combined MTS shows the direction and strength of the trend, meanwhile MTT shows if the trend is weakening, gaining strength, confirms continuation or warns a reversal.
What I look from my indicators is to create a tool that filters out as much noise as possible without losing much sensitivity, they have to be easy to tune and simple to analyze, so I normally use contrasting colors, using cold colors for long positions and warm colors for short positions. I try to use the least possible number of parameters and the defaults have been set after several months of testing in Beta mode against hundreds of charts before publishing them.
I hope this effort can help you to have a simpler point of view of the market.
Search in scripts for "take profit"
Fractal Fade Pro IndicatorA revolutionary contrarian trading indicator that applies chaos theory, fractal mathematics, and market entropy to generate high-probability reverse signals. This indicator fades traditional technical signals, providing BUY signals when conventional indicators say SELL, and SELL signals when they say BUY.
Full Description:
Most traders follow the herd. QFCI does the opposite. It identifies when conventional technical analysis is about to fail by detecting mathematical patterns of exhaustion in market structure.
How It Works (Technical Overview):
The indicator combines three sophisticated mathematical approaches:
Fractal Dimension Analysis: Measures the "roughness" of price movements using fractal mathematics
Market Entropy Calculation: Quantifies the randomness and disorder in price returns using information theory
Phase Space Reconstruction: Analyzes price evolution in multi-dimensional state space from chaos theory
Signal Generation Process:
Step 1: Market Regime Detection
Chaotic Regime: High fractal complexity + rising entropy (avoid trading)
Trending Regime: Low fractal complexity + high phase space distance (fade breakouts)
Mean-Reverting Regime: Very low fractal complexity (fade extremes)
Step 2: Reverse Signal Logic
When traditional indicators would give:
BUY signal (breakout, oversold bounce, volatility spike) → QFCI shows SELL
SELL signal (breakdown, overbought rejection, volatility crash) → QFCI shows BUY
Step 3: Smart Signal Filtering
No consecutive same-direction signals
Adjustable minimum bars between signals
Multiple confirmation layers required
Unique Features:
1. Mathematical Innovation:
Original fractal dimension algorithm (not standard indicators)
Market entropy calculation from information theory
Phase space reconstruction from chaos theory
Multi-regime adaptive logic
2. Trading Psychology Advantage:
Contrarian by design - profits from market overreactions
Fades retail trader mistakes - enters when others are exiting
Reduces overtrading - strict signal frequency controls
3. Clean Visual Interface:
Only BUY/SELL labels - no chart clutter
Clear directional arrows - immediate signal recognition
Built-in alerts - never miss a trade
Recommended Settings:
Default (Balanced Approach):
Fractal Depth: 20
Entropy Period: 200
Min Bars Between Signals: 100
Aggressive Trading:
Fractal Depth: 10-15
Entropy Period: 100-150
Min Bars Between Signals: 50-75
Conservative Trading:
Fractal Depth: 30-40
Entropy Period: 300-400
Min Bars Between Signals: 150-200
Optimal Timeframes:
Primary: Daily, Weekly (best performance)
Secondary: 4-Hour, 12-Hour
Can work on: 1-Hour (with adjusted parameters)
How to Use:
For Beginners:
Apply indicator to chart
Use default settings
Wait for BUY/SELL labels
Enter on next candle open
Use 2:1 risk/reward ratio
Always use stop losses
For Advanced Traders:
Adjust parameters for your trading style
Combine with support/resistance levels
Use volume confirmation
Scale in/out of positions
Track performance by regime
Risk Management Guidelines:
Position Sizing:
Conservative: 1-2% risk per trade
Moderate: 2-3% risk per trade
Aggressive: 3-5% risk per trade (not recommended)
Stop Loss Placement:
BUY signals: Below recent swing low or -2x ATR
SELL signals: Above recent swing high or +2x ATR
Take Profit Targets:
Primary: 2x risk (minimum)
Secondary: Previous support/resistance
Tertiary: Trailing stops after 1.5x risk
IMPORTANT RISK DISCLOSURE
This indicator is for educational and informational purposes only. It is not financial advice. Past performance does not guarantee future results. Trading involves substantial risk of loss and is not suitable for every investor. The risk of loss in trading can be substantial. You should therefore carefully consider whether such trading is suitable for you in light of your financial condition.

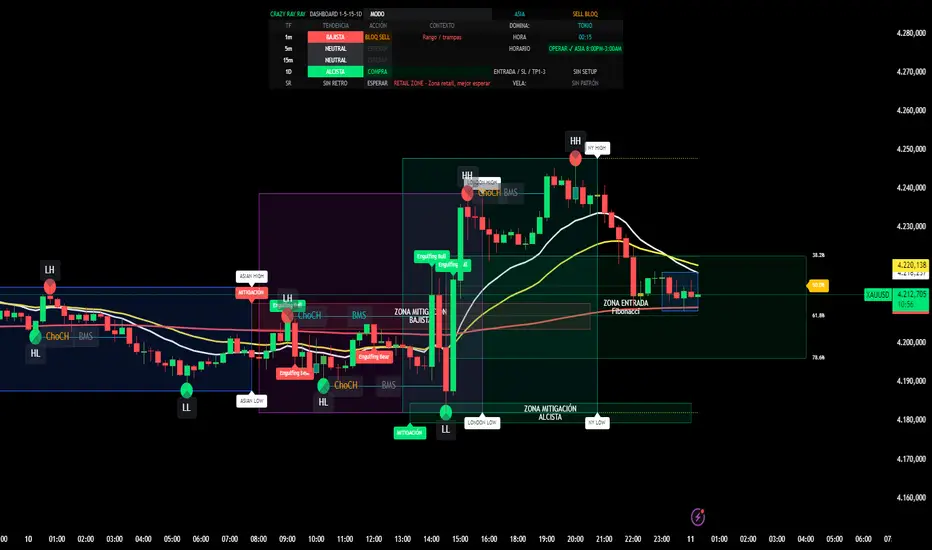
CRR Dashboard 1-5-15-1D1. What this indicator does (simple)
It’s a multi-timeframe institutional dashboard for XAU (or any pair) that tells you:
Trend & action on 1m / 5m / 15m / 1D
Best sessions & hours to trade (Asia, London, NY)
If the market is Institutional ON or just Retail zone
Smart Money structure (HH/HL/LL/LH, BOS, ChoCH, Fibo zones, mitigation boxes)
No-pullback entries (SIN RETRO) with automatic TP1–TP3
Extra BUY/SELL filters to block stupid trades (anti-stupid buy/sell)
You don’t need to understand every line of code. You just need to read the HUD + labels.
2. When NOT to trade
Before thinking BUY/SELL, look at the HUD (top center):
Time advice row (HORARIO)
If it says things like:
“NO OPERAR (ROLLOVER)”
“NO OPERAR (HORAS MUERTAS)”
“NO OPERAR (DESPUÉS 3:30 PM)”
👉 Do not trade.
Global status (top right of HUD)
If it shows:
“BUY BLOQ”, “SELL BLOQ”, or “BUY/SELL BLOQ”
👉 Market is dangerous for that side. Avoid entries in that direction.
Institutional status text (SR row, column “INST”)
If it says “RETAIL ZONE”, the move is weak / choppy.
👉 Only A+ setups, or better: skip.
3. BUY – how to use it (step-by-step)
A) Time & session
In the HUD, check:
Session name: LONDON or NEW YORK (or strong Asia scalp).
Time advice:
✅ “OPERAR ✔ LONDRES 3:00–5:00”
✅ “OPERAR ✔ NY OPEN 8:30–10:30”
✅ “OPERAR ✔ NY PM 1:30–3:30”
Institutional text:
✅ “INSTITUTIONAL ON – Momento pro…”
👉 If sessionStrong + Institutional ON = good environment to BUY.
B) Trend & bias
Look at the TF rows in the HUD:
1m / 5m / 15m / 1D:
TENDENCIA: should be mostly ALCISTA (green background).
ACCIÓN: should say “COMPRA” (not “VENTA” and not “BLOQ BUY”).
Mode box:
If MODO says:
“ALCISTA – SOLO COMPRAS” → you only look for BUY.
Global status (top right):
Best BUY statuses:
“BUY PRO ✅”
“BUY REV LL ✅”
or at least “BIAS BUY”
If you see “BUY TRAP ❌”, do NOT buy.
C) Entry types for BUY
You basically have 3 BUY styles:
1️⃣ BUY SIN RETRO (pure momentum)
Internal condition: entryBuyNoRetro
On chart:
You will see “BUY SIN RETRO” in the SR row (HUD)
And alert: “CRR BUY INSTITUCIONAL 1M”
Use it like this:
Trend up on 1m EMAs (15 > 30 > 200)
MACD gives bullish shift
Price crosses above EMA200
Session strong + Institutional ON
👉 You take the BUY with no pullback, pure breakout.
2️⃣ BUY PRO INSTITUCIONAL (full checklist)
Internal: fullBuySetup
You’ll see label “BUY PRO” below the candle.
Global status often shows: “BUY PRO ✅”
This is a mega-filtered BUY:
Institutional context OK (allowBuyInst = true)
Candle is bullish institutional pattern (engulfing, strong body, hammer, etc.)
Multi-TF bias bullish
Session strong
No blockers (not buyBlockerOn, not sellBlockerOn)
👉 This is your A+ professional BUY.
3️⃣ BUY REVERSAL LL (from discount & LL)
Internal: buyReversalLL
You’ll see label: “BUY REV LL” under the candle.
Global status may show: “BUY REV LL ✅”
Logic:
Market had bearish SMC (LLs)
You are near discount Fibo zone (38–61–78%)
Recent LL (support)
Price now above EMA200
Bullish candle pattern + strong session
👉 Reversal BUY from discount zone after taking liquidity.
D) Stop loss & take profits for BUY
When a valid Buy SIN RETRO signal appears:
Script automatically sets:
Entry price
SL (below swing low)
TP1 / TP2 / TP3 using your RR settings (tp1RR, tp2RR, tp3RR)
You see them in HUD:
Row: “ENTRADA / SL / TP1–3”
Text like:
BUY E: 2420.00 SL: 2415.00 T1: 2425.00 T2: 2427.50 T3: 2430.00
Basic management idea:
At TP1: close part, move SL to breakeven.
At TP2 / TP3: trail or close more.
4. SELL – how to use it (mirror of BUY)
Same idea but opposite side.
A) Time & session
Same rules: only when timeAdvice says OPERAR ✔ and Institutional ON.
Avoid rollover / dead hours / after 3:30 PM.
B) Trend & bias for SELL
TF rows (1m/5m/15m/1D):
TENDENCIA: mostly BAJISTA (red).
ACCIÓN: “VENTA”, not “COMPRA”, and not “BLOQ SELL”.
MODO: ideally “BAJISTA – SOLO VENTAS”.
Global status:
Best: “SELL PRO ✅”, “SELL REV HH ✅”, or “BIAS SELL”.
If you see “BUY BLOQ” it’s fine for sells; if “SELL BLOQ”, don’t sell.
C) Entry types for SELL
1️⃣ SELL SIN RETRO
Momentum no-pullback sell
MACD shift bearish + EMA200 break down
Strong session + institutional ON
👉 Use when entrySellNoRetro is true and “SELL SIN RETRO” appears.
2️⃣ SELL PRO INSTITUCIONAL
Label: “SELL PRO” above candle.
Global: “SELL PRO ✅”.
Full SMC + Fibo + multi-TF + candle + session confirmation.
3️⃣ SELL REVERSAL HH
Label: “SELL REV HH” above candle.
From premium zone (Fibo 61–78%) near a recent HH.
Bearish institutional candle from liquidity sweep high.
D) SL & TP for SELL
On Sell SIN RETRO, script sets:
Entry = close
SL = above swing high
TP1/TP2/TP3 below
Managed exactly like BUY but inverted.
5. Ultra-short “How to use” checklist (English)
For BUY:
Trade only when HUD time says “OPERAR ✔ …” and INSTITUTIONAL ON.
Mode near “ALCISTA – SOLO COMPRAS”, most TF rows show COMPRA.
Global status is BUY PRO ✅, BUY REV LL ✅ or BIAS BUY (not BUY BLOQ, not BUY TRAP ❌).
Take entries on:
BUY SIN RETRO,
BUY PRO,
or BUY REV LL,
with clear candle pattern + SL/TP line in HUD.
For SELL:
Same hours & Institutional ON.
Mode near “BAJISTA – SOLO VENTAS”, TF rows mostly VENTA.
Global status SELL PRO ✅, SELL REV HH ✅ or BIAS SELL (not SELL BLOQ).
Take SELL SIN RETRO, SELL PRO, or SELL REV HH with SL/TP from HUD.
TJR Bogdan Pro (V20)TJR Bogdan Pro (V20) - The "Cheat Code"
Trading is hard. This tool makes it simple.
Most new traders lose money because they guess. They buy when it "feels" low and sell when it "feels" high.
The TJR Bogdan Pro removes the guessing. It waits for the market to make a specific mistake (The Trap), and then tells you exactly when to enter (The Entry).
🎮 How to Play (The 3 Rules)
You are playing a game of "Red Light, Green Light." You do not touch the mouse until the indicator tells you to.
1. Wait for the Big Label
* Ignore the small lines and X's.
* Wait until a massive label pops up on your screen:
* 🔵 "BUY SETUP (STRONG)"
* 🟠 "SELL SETUP (STRONG)"
2. Set Your Trap (The Colored Box)
* When the label appears, a Colored Box will appear next to it.
* The market is like a rubber band; it usually snaps back to this box before going where it wants to go.
* The Move: Place a Limit Order inside the Darker Shaded Area of that box.
* If it's a Buy Setup: Place order in the Dark Blue Box.
* If it's a Sell Setup: Place order in the Dark Orange Box.
3. Set Your Safety (The Bread)
* Every trade needs a top and a bottom. The indicator marks these for you:
* 🛑 Red "STOP" Label: This is your Stop Loss. If price hits this, you were wrong. The system gets you out automatically to save your money.
* 🎯 Green "TARGET" Label: This is your Profit Target. This is where the bus is going. Set your "Take Profit" here.
🚀 The "First Trade" Checklist
1. Open the chart. (Works best on a 5-minute timeframe).
2. Sit on your hands. Do not click anything.
3. ALARM! You see the "SELL SETUP" label appear.
4. Look for the Orange Box.
5. Right-Click inside the dark part of the Orange Box $\to$ Sell Limit.
6. Drag your Stop Loss to the Red "STOP" label.
7. Drag your Take Profit to the Green "TARGET" label.
8. Walk away. The computer handles the rest.
That’s it. No guessing. No predicting. Just following orders.

Volume Profile VisionVolume Profile Vision - Complete Description
Overview
Volume Profile Vision (VPV) is an advanced volume profile indicator that visualizes where trading activity has occurred at different price levels over a specified time period. Unlike traditional volume indicators that show volume over time, this indicator displays volume distribution across price levels, helping traders identify key support/resistance zones, fair value areas, and potential reversal points.
What Makes This Indicator Original
Volume Profile Vision introduces several unique features not found in standard volume profile tools:
Dual-Direction Histogram Display:
Unlike conventional volume profiles that only show bars extending in one direction, VPV displays volume bars extending both left (into historical candles) and right (as a traditional histogram). This bi-directional approach allows traders to see exactly where historical price action intersected with high-volume nodes.
Real-Time Candle Highlighting: The indicator dynamically highlights volume bars that intersect with the current candle's price range, making it immediately obvious which volume levels are currently in play.
Four Professional Color Schemes: Each color scheme uses distinct gradient algorithms and visual encoding systems:
Traffic Light: Uses red (POC), green (VA boundaries), yellow (HVN), with grayscale gradients outside the value area
Aurora Glass: Modern cyan-to-magenta gradient with hot magenta POC highlighting
Obsidian Precision: Professional dark theme with white POC and electric cyan accents
Black Ice: Monochromatic cyan family with graduated intensity
Adaptive Transparency System: Automatically adjusts bar transparency based on position relative to value area, with special handling for each color scheme to maintain visual clarity.
Core Concepts & Calculations
Volume Distribution Analysis
The indicator divides the visible price range into user-defined price levels (default: 80 levels) and calculates the total volume traded at each level by:
Scanning back through the specified lookback period (customizable or visible range)
For each historical bar, determining which price levels the bar's high/low range intersects
Accumulating volume for each intersected price level
Optionally filtering by bullish/bearish volume only
Point of Control (POC)
The POC is the price level with the highest traded volume during the analyzed period. This represents the "fairest" price where most traders agreed on value. The indicator marks this with distinct coloring (red in Traffic Light, magenta in Aurora Glass, white in Obsidian Precision, cyan in Black Ice).
Trading Significance: POC acts as a strong magnet for price - markets tend to return to fair value. When price is away from POC, traders watch for:
Mean reversion opportunities when price is far from POC
Rejection signals when price tests POC from above/below
Breakout confirmation when price breaks through and holds beyond POC
Value Area (VA)
The Value Area encompasses the price range where a specified percentage (default: 68%) of all volume traded. This represents the range of "accepted value" by market participants.
Calculation Method:
Start at the POC (highest volume level)
Expand upward and downward, adding adjacent price levels
Always add the level with higher volume next
Continue until accumulated volume reaches the VA percentage threshold
Value Area High (VAH): Upper boundary of accepted value - acts as resistance
Value Area Low (VAL): Lower boundary of accepted value - acts as support
Trading Significance:
Price spending time inside VA indicates market equilibrium
Breakouts above VAH suggest bullish momentum shift
Breakdowns below VAL suggest bearish momentum shift
Returns to VA boundaries often provide high-probability entry zones
High Volume Nodes (HVN)
Price levels with volume exceeding a threshold percentage (default: 80%) of POC volume. These represent areas of strong agreement and consolidation.
Trading Significance:
HVNs act as strong support/resistance zones
Price tends to consolidate at HVNs before making directional moves
Breaking through an HVN often signals strong momentum
Low Volume Nodes (LVN)
Price levels within the Value Area with volume ≤30% of POC volume. These are zones price moved through quickly with minimal consolidation.
Trading Significance:
LVNs represent areas of rejection - price finds little acceptance
Price tends to move rapidly through LVN zones
Useful for setting stop-losses (below LVN for longs, above for shorts)
Can identify potential gaps or "air pockets" in the market structure
Grayscale POC Detection
A secondary POC detection system identifies the highest volume level outside the Value Area (with a 2-level buffer to avoid confusion). This helps identify significant volume accumulation zones that exist beyond the main value area.
How to Use This Indicator
Setup
Choose Lookback Period:
Enable "Use Visible Range" to analyze only what's on your chart
Or set "Fixed Range Lookback Depth" (default: 200 bars) for consistent analysis
Adjust Profile Resolution:
"Number of Price Levels" (default: 80) - higher = more granular analysis, lower = broader zones
Select Color Scheme:
Traffic Light: Best for clear POC/VA/HVN identification
Aurora Glass: Modern aesthetic for dark charts
Obsidian Precision: Professional trader preference
Black Ice: Minimalist single-color family
Visual Customization
Left Extension: How far back the left-side histogram extends into historical candles (default: 490 bars)
Right Extension: Width of the traditional histogram bars on the right (default: 50 bars)
Right Margin: Space between current price bar and histogram (default: 0 for flush alignment)
Left Profile Gap: Space between left-side histogram and candles (default: 0)
Trading Strategies
Strategy 1: Value Area Mean Reversion
Wait for price to move outside the Value Area (above VAH or below VAL)
Look for rejection signals (wicks, bearish/bullish candles)
Enter trades toward the POC
Take profits as price returns to POC or opposite VA boundary
Strategy 2: Breakout Confirmation
Identify when price is consolidating within the Value Area
Wait for a strong close above VAH (bullish) or below VAL (bearish)
Enter on the breakout or on first pullback to the VA boundary
Target previous HVNs or swing highs/lows outside the VA
Strategy 3: POC Support/Resistance
Watch for price approaching the POC level
If approaching from below, look for bullish reversal patterns at POC (support)
If approaching from above, look for bearish reversal patterns at POC (resistance)
Trade in the direction of the bounce with stops beyond the POC
Strategy 4: LVN Fast Movement Zones
Identify LVN zones within the Value Area (marked with "LVN" label)
When price enters an LVN, expect rapid movement through the zone
Avoid entering trades within LVNs
Use LVNs as confirmation of directional momentum
Alert System
The indicator includes 7 customizable alert conditions:
POC Touch: Alerts when price comes within 0.5 ATR of POC
VAH/VAL Touch: Alerts at Value Area boundaries
VA Breakout: Alerts on breakouts above VAH or below VAL
HVN Touch: Alerts when price contacts High Volume Nodes
LVN Entry: Alerts when entering Low Volume zones
POC Shift: Alerts when POC moves to a new price level
Reading the Profile
Price Labels (shown on the right side):
POC: Point of Control - highest volume price level
VAH: Value Area High - upper boundary of accepted value
VAL: Value Area Low - lower boundary of accepted value
LVN: Low Volume Node - expect fast movement through this zone
Color Intensity Interpretation:
Brighter colors = higher volume concentration
Dimmer colors = lower volume
Abrupt color changes = transition between volume zones
Gaps in the histogram = price levels with no trading activity
Technical Details
Volume Accumulation Logic:
For each bar in lookback period:
For each price level:
If bar's high/low range intersects price level:
Add bar's volume to that price level's total
Gradient Algorithm:
Traffic Light: Dual-range piecewise gradient (0-50% and 50-100% volume intensity)
Aurora Glass: Linear cyan-to-magenta interpolation
Obsidian Precision: Dark blue gradient with cyan highlights
Black Ice: Three-stage cyan intensity progression
Real-Time Updates:
The profile recalculates on every bar, including real-time tick data, ensuring the volume distribution always reflects current market structure.
Best Practices
Timeframe Selection: Use higher timeframes (4H, Daily) for swing trading, lower timeframes (5min, 15min) for day trading
Combine with Price Action: Volume profile shows WHERE, price action shows WHEN
Multiple Timeframe Analysis: Check daily VP for major levels, then drill down to intraday for entries
Volume Type Selection: Use "Bullish" volume in uptrends, "Bearish" in downtrends, or "Both" for complete picture
Adjust VA Percentage: 68% (default) captures one standard deviation; try 70% for tighter or 60% for broader value areas
Performance Notes
Maximum bars back: 5000 (handles deep historical analysis)
Maximum boxes: 500 (handles complex profiles)
Optimized calculation: Only recalculates on last bar for efficiency
Real-time capable: Updates as new ticks arrive

On Balance Volume [BrightSideTrading]
# On Balance Volume - Complete User Guide
## Overview
This enhanced OBV indicator provides clean, actionable volume analysis with intelligent signal filtering. It combines On-Balance Volume (OBV) with a smoothed signal line to identify shifts in buying and selling pressure without chart clutter.
**Key Features:**
- Real-time OBV and signal line visualization
- Smart crossover detection with confirmation filtering
- Z-Score momentum analysis
- Customizable signal alerts with V-shaped markers
- Window-normalized option for detrended analysis
---
## What is On-Balance Volume (OBV)?
OBV is a volume-based momentum indicator that accumulates volume on up days and subtracts volume on down days. It answers a fundamental question: **Is volume flowing in (buying) or out (selling)?**
**Formula:**
- If Close > Previous Close: OBV = Previous OBV + Volume
- If Close < Previous Close: OBV = Previous OBV - Volume
- If Close = Previous Close: OBV = Previous OBV (unchanged)
**What it tells you:**
- **Rising OBV** = Accumulation (smart money buying)
- **Falling OBV** = Distribution (smart money selling)
- **OBV above zero line** = Net positive buying pressure
- **OBV below zero line** = Net negative selling pressure
---
## Interface & Settings
### **MAIN VISUALIZATION**
**OBV Line (Green/Red Ribbon)**
- Green when OBV is above the signal line (bullish trend)
- Red when OBV is below the signal line (bearish trend)
- Toggles between window-normalized (detrended) and raw values
**Signal Line (Orange)**
- Smoothed average of OBV
- Crossovers with OBV generate buy/sell signals
- Default: 21-period SMA
**V-Shaped Markers**
- Green upward V = Bullish crossover (buy signal)
- Red downward V = Bearish crossover (sell signal)
- Appears at the OBV value when signal is triggered
**Zero Line (Yellow)**
- Center equilibrium point for volume balance
- Acts as support/resistance for OBV
- Separates buying pressure (above) from selling pressure (below)
---
### **SOURCE GROUP**
**Source**
- **Default:** Close
- **Options:** Open, High, Low, or any custom value
- Controls which price value triggers OBV direction changes
- Most traders use Close for standard OBV calculation
---
### **SIGNAL SMOOTHING GROUP**
**Show Signal?**
- **Default:** ON
- Toggle visibility of the signal line
- Disable if you prefer to see raw OBV only
**Smoothing Type**
- **SMA (Simple Moving Average)** - Default, standard smoothing
- **EMA (Exponential Moving Average)** - Faster response, weights recent bars more heavily
- **Choose SMA** for consistent, traditional OBV signals
- **Choose EMA** for faster trend identification (more whipsaws possible)
**Smoothing Length**
- **Default:** 21 bars
- **Range:** 1-200 bars
- **Lower values** (5-14): Faster signals, more noise
- **Higher values** (30-50): Slower signals, fewer false alarms
- **Recommendation:** Use 21-25 for most timeframes
---
### **SIGNAL FILTERING GROUP**
This is your primary control for signal quality and frequency.
**Show Signal Markers?**
- **Default:** ON
- Toggle the V-shaped buy/sell markers on/off
- Disable if markers distract from your analysis
**Signal Filter Type**
- **None** - Shows every single crossover (noisy, best for skilled traders)
- **Confirmation Bars** - Waits N bars before confirming signal (recommended)
- **Strength-Based** - Only signals during strong momentum (filters weakest moves)
#### **CONFIRMATION BARS MODE** (Recommended)
Best for reducing false signals while staying responsive to real moves.
**Confirmation Bars**
- **Default:** 2 bars
- **Range:** 1-10 bars
- Waits for the signal to hold for N consecutive bars after crossover
- **Setting 1:** Every crossover (same as "None")
- **Setting 2:** Wait 1 bar confirmation (good balance)
- **Setting 3:** Wait 2 bars confirmation (filters 50% of noise)
- **Setting 4+:** Very selective, misses quick reversals
**How it works:**
1. OBV crosses signal line → Confirmation counter starts
2. If OBV stays on correct side for 2 bars → V-marker appears
3. If OBV crosses back → Counter resets, no signal
#### **STRENGTH-BASED MODE**
Only signals when momentum is statistically significant.
**Min Z-Score Strength**
- **Default:** 0.3
- **Range:** 0.0-3.0
- Requires OBV deviation from its mean to reach this threshold
- **Setting 0.1-0.3:** More signals, lower quality
- **Setting 0.5-0.8:** Moderate signals, good quality
- **Setting 1.0+:** Only the strongest momentum shifts
**How it works:**
- Calculates how far OBV is from its 50-bar average (Z-score)
- Only shows signals when this distance is meaningful
- Automatically avoids weak, choppy market conditions
---
### **VISUALS & COLORS GROUP**
**Highlight Crossovers?**
- **Default:** ON
- Master toggle for all signal markers
- Turn OFF to see only the OBV/signal lines
**Apply Ribbon Filling?**
- **Default:** ON
- Colors the space between OBV and signal line
- Green fill = OBV above signal (bullish)
- Red fill = OBV below signal (bearish)
- Provides clear visual trend confirmation
- Turn OFF for minimal chart clutter
---
### **STATS & ZONES GROUP**
**Use Window-Normalized OBV (visual only)?**
- **Default:** ON
- Removes long-term trend from OBV for clearer short-term signals
- Detrends the indicator to highlight recent momentum changes
- **ON:** Better for swing trading and identifying reversals
- **OFF:** Better for trend-following strategies
- Note: Z-Score always uses raw OBV for statistical accuracy
**OBV Normalize Window**
- **Default:** 200 bars
- Lookback period for detrending calculation
- Larger values = more aggressive detrending
- Adjust if you want OBV to oscillate more/less around zero
**Show Z-Score (OBV)?**
- **Default:** ON
- Displays statistical momentum indicator below main chart
- Ranges from -3 to +3 (most data within -2 to +2)
- High Z-Score = Strong buying momentum
- Low Z-Score = Strong selling momentum
**Z-Score Lookback**
- **Default:** 50 bars
- Period for calculating Z-Score mean and standard deviation
- Larger = smoother Z-Score, slower response
- Smaller = noisier Z-Score, faster response
**Show ROC (OBV Momentum)?**
- **Default:** OFF
- Rate of Change indicator for OBV velocity
- Useful for identifying momentum turning points
- Enable if you want to see speed of volume changes
**ROC Lookback**
- **Default:** 14 bars
- Period for ROC calculation
**Show Z-Score StdDev Zones?**
- **Default:** ON
- Shaded regions around zero line showing statistical boundaries
- Inner Zone (±1 Z) = Normal variation
- Outer Zone (±2 Z) = Extreme moves, potential reversals
- Helps identify overbought/oversold volume conditions
**Inner Zone (±Z)**
- **Default:** 1.0
- First boundary for standard deviation zones
- Most normal trading occurs within ±1
**Outer Zone (±Z)**
- **Default:** 2.0
- Second boundary for extreme conditions
- Crossing these zones indicates significant momentum shift
---
## Trading Strategy Examples
### **Strategy 1: Signal Line Crossovers (Beginner)**
**Setup:**
- Signal Filter Type: **Confirmation Bars**
- Confirmation Bars: **2-3**
- Show Signal Markers: **ON**
**Rules:**
1. **BUY signal** (green V): When OBV crosses above signal line and holds for 2-3 bars
- Confirms buying pressure is building
- Look for price to follow within 1-3 bars
2. **SELL signal** (red V): When OBV crosses below signal line and holds for 2-3 bars
- Confirms selling pressure is increasing
- Expect price decline
3. **Exit:** Take profits at next signal or use price support/resistance
**Best For:** Swing trading, intraday reversals, timeframes 5m-1h
---
### **Strategy 2: Zero Line Bounce (Intermediate)**
**Setup:**
- Signal Filter Type: **Strength-Based**
- Min Z-Score Strength: **0.5**
- Show Z-Score StdDev Zones: **ON**
**Rules:**
1. **Watch OBV approach zero line** during established trends
- OBV bouncing repeatedly off zero = trend is healthy
- OBV breaking through zero = trend reversal imminent
2. **Enter on bounce:** Buy when OBV bounces from zero line in uptrend
3. **Exit on break:** Close position when OBV breaks below zero line
4. **Confirm with Z-Score:** Only take trades when Z-Score shows momentum (|Z| > 0.5)
**Best For:** Trend traders, identifying trend strength, medium timeframes 15m-4h
---
### **Strategy 3: Momentum Extremes (Advanced)**
**Setup:**
- Signal Filter Type: **None**
- Show Z-Score StdDev Zones: **ON**
- Outer Zone: **2.0**
**Rules:**
1. **Identify extremes:** When Z-Score breaks outer zone (±2.0)
- Indicator is in extreme territory
- Likely overextended
2. **Fade extremes:** Take opposite position when Z-Score hits extreme
- High Z (>2.0) = OBV overbought, expect pullback
- Low Z (<-2.0) = OBV oversold, expect bounce
3. **Confirm:** Wait for crossover signal to enter
4. **Target:** Outer zone of opposite side or zero line
**Best For:** Range trading, mean reversion, experienced traders only
---
## Reading the Indicator in Different Markets
### **Strong Uptrend**
- OBV consistently above signal line (green)
- OBV well above zero line, rising higher lows
- Z-Score positive, trending upward
- **Action:** Buy dips to signal line, sell at resistance
### **Strong Downtrend**
- OBV consistently below signal line (red)
- OBV well below zero line, making lower highs
- Z-Score negative, trending downward
- **Action:** Sell rallies to signal line, cover at support
### **Consolidation/Choppy Market**
- OBV whipsaws around signal line frequently
- Crossovers occur every few bars
- Z-Score oscillating between -1 and +1
- **Action:** Increase confirmation bars to 3-4, or switch to strength-based filter
### **Accumulation (Bottom Formation)**
- OBV rising while price is flat or falling
- Volume flowing in despite downtrend (bullish divergence)
- Z-Score climbing while price lows hold
- **Action:** Expect breakout up; prepare buy near support
### **Distribution (Top Formation)**
- OBV falling while price is flat or rising
- Volume flowing out despite uptrend (bearish divergence)
- Z-Score falling while price continues higher
- **Action:** Expect breakdown down; prepare short near resistance
---
## Parameter Tuning Guide
### **Aggressive Settings (More Signals)**
- Smoothing Length: 14
- Signal Filter: None or Confirmation Bars: 1
- Min Z-Score: 0.1
- Best for: Day trading, high volatility stocks
- Risk: More false signals
### **Balanced Settings (Recommended)**
- Smoothing Length: 21
- Signal Filter: Confirmation Bars: 2
- Min Z-Score: 0.3
- Best for: Swing trading, most market conditions
- Risk/Reward: Moderate
### **Conservative Settings (Fewer Signals)**
- Smoothing Length: 30-40
- Signal Filter: Confirmation Bars: 3-4 or Strength-Based: 0.7+
- Min Z-Score: 0.8
- Best for: Position trading, high-conviction trades only
- Risk: May miss some moves
---
## Common Questions & Troubleshooting
**Q: Why are there more sell signals than buy signals?**
A: This reflects the actual market action. Markets often decline faster than they rise (fear > greed). Confirm signals with price action and support/resistance.
**Q: The indicator keeps whipsawing, should I hide it?**
A: Increase Confirmation Bars to 3-4 or switch to Strength-Based filter. Market conditions matter—choppy markets require stricter filters.
**Q: What's the difference between normalized and raw OBV?**
A: Normalized (detrended) shows shorter-term momentum by removing long-term trends. Raw OBV shows absolute accumulation/distribution over the full period. Use normalized for swing signals, raw for trend confirmation.
**Q: My signals come too late. How do I get faster entry?**
A: Reduce Smoothing Length (try 14 instead of 21), use EMA instead of SMA, or set Confirmation Bars to 1. Trade-off: More false signals.
**Q: Can I use this for day trading?**
A: Yes, on 1m-5m charts with aggressive settings. Use Confirmation Bars: 1 and focus on Z-Score > 0.5 entries only.
**Q: Should I trade every signal?**
A: No. Filter signals using: price near support/resistance, multiple indicators confirming, and Z-Score showing momentum. Best signals occur at key levels.
---
## Best Practices
1. **Always confirm with price action:** OBV signals work best when price is near support, resistance, or moving average. Don't trade signals in a vacuum.
2. **Use volume context:** Check if volume is increasing or decreasing on the signal. Strong signals have volume confirmation (increasing volume on OBV spikes).
3. **Adjust settings per timeframe:**
- 1m-5m: Smoothing 12, Confirmation 1, Z-Score 0.2
- 15m-1h: Smoothing 20, Confirmation 2, Z-Score 0.3
- 4h-1d: Smoothing 25, Confirmation 3, Z-Score 0.5
4. **Watch the zero line:** It's your friend. OBV behavior at the zero line reveals trend strength. Bounces = healthy trend. Breaks = reversal.
5. **Risk management:** No indicator is perfect. Use proper position sizing and stop losses. OBV should confirm your thesis, not be the only reason to trade.
6. **Combine with other indicators:**
- Price moving averages for trend confirmation
- RSI or Stochastic for overbought/oversold levels
- Support/resistance for entry/exit zones
- MACD for momentum divergences
---
## Disclaimer
This indicator is for educational and informational purposes only. It is not financial advice. Past performance does not guarantee future results. Always conduct your own research and consult with a financial advisor before making trading decisions. Trading carries risk, including potential loss of principal.
---
## Version History
**Version 1.0** - Initial release with enhanced signal filtering, Z-Score analysis, and customizable parameters.

仓位计算器# 仓位计算器
通过开仓、止损、止盈计算固定盈亏比适合的开仓数量,根据开仓和止损判断开仓方向。
首次使用需要手动设置开仓、止盈、止损,之后可以手动拖拽价格线设置值然后自动计算仓位信息。
---
# Position Calculator
Calculates the optimal position size with a fixed profit/loss ratio based on opening, stop-loss, and take-profit levels. Determines the direction of the position based on the opening and stop-loss settings.
Initial use requires manual setting of opening, take-profit, and stop-loss. Afterward, you can manually drag the price line to set values and the system will automatically calculate position information.

Trend Gazer: Unified ICT Trading System with Signals# Trend Gazer User Guide (English)
## 📖 Table of Contents
1. (#about-this-indicator)
2. (#quick-start-guide-3-steps)
3. (#detailed-usage)
4. (#settings-customization)
5. (#why-combine-multiple-features)
6. (#faq)
---
## About This Indicator
**Trend Gazer** is an integrated trading system designed to read institutional order flow like professional traders.
### 🎯 3 Problems This Indicator Solves
#### ❌ Problem 1: Too Many Indicators = Information Overload
```
Normal: RSI + MACD + Moving Average + Bollinger Bands... → Cluttered chart
Solution: All integrated into ONE indicator → Clean & Clear
```
#### ❌ Problem 2: Single Indicators Give False Signals
```
Normal: Enter based on RSI alone → Frequent stop-outs
Solution: Structure × Zone × Momentum multi-angle confirmation → Higher win rate
```
#### ❌ Problem 3: Unclear Entry Timing
```
Normal: Know the trend but don't know WHERE to enter
Solution: LS Bounce Signal shows EXACT entry points
```
---
## Quick Start Guide (3 Steps)
### 🚀 STEP 1: Confirm Trend Direction
**Look for CHoCH (Change of Character)**
```
📍 (1.CHoCH) label = Uptrend starting
📍 (a.CHoCH) label = Downtrend starting
```
**Important**: Wait for CHoCH! No direction without it.
---
### 🎯 STEP 2: Find Entry Points
**Wait for LS Bounce Signal (green/red labels)**
```
🟢 "Long@ HL only" label → LONG (buy) candidate
🔴 "Short@ LH only" label → SHORT (sell) candidate
```
**Label text color meaning**:
- **White text**: Clean trend (high confidence)
- **Yellow text**: Trend transition (moderate caution)
---
### 🛡️ STEP 3: Final Confirmation with Bar Color
**Bar color shows market state**
```
🔴 Red bar: BUY zone (buying is favored)
🟢 Green bar: SELL zone (selling is favored)
⚪ White bar: Neutral (wait and see)
```
---
## Detailed Usage
### 📊 Understanding the Chart
#### 1. Labels (Market Structure Changes)
```
(1.CHoCH) / (a.CHoCH) : Trend reversal
(2.SiMS) / (b.SiMS) : Momentum confirmation
(3.BoMS) / (c.BoMS) : Trend continuation
```
#### 2. Boxes (Institutional Order Zones)
```
📦 Blue boxes: Bullish OB (buy orders accumulated)
📦 Red boxes: Bearish OB (sell orders accumulated)
📦 Black transparent boxes: Liquidity Sweep
```
**How to use Order Blocks**:
- Function as support/resistance
- Signals within OB have higher reliability
- Use for stop-loss placement
#### 3. Lines (Trends and Support/Resistance)
```
━━━ Red lines: EMA20, EMA50, EMA100 (short to mid-term trends)
━━━ Blue lines: 60min NPR/BB bands (support/resistance)
```
#### 4. Bar Colors (Filter 6)
```
Bar color = Real-time market state
🔴 Red: Buying is favored
🟢 Green: Selling is favored
⚪ White: Neutral
```
---
### 🎯 Practical Trading Flow
#### 📍 Preparation Phase
```
1. Open chart (recommended: 5min or 15min)
2. Add Trend Gazer to chart
3. Start in observation mode (don't enter yet)
```
#### 📍 Entry Decision
```
✅ CHoCH confirms direction → Uptrend starting
✅ LS Bounce Signal "Long@ HL only" appears
→ Entry point candidate
✅ Bar turns red → Market supports buying
→ Entry decision 🎯
✅ Place stop below nearest Order Block (blue box)
```
#### 📍 Exit Decision
```
🔴 Opposite LS Bounce Signal "Short@ LH only" appears
→ Consider taking profit
🔴 Bar turns green
→ Potential trend reversal, review position
🔴 Stop loss hit
→ Exit with loss
```
---
### 💡 Tips for Higher Win Rate
#### ✅ DO's
```
1. Enter AFTER CHoCH appears
2. Prioritize white-text LS Bounce Signals
3. Check higher timeframe (1H or Daily) trend
4. Emphasize signals within Order Blocks
5. Use bar color as final confirmation
```
#### ❌ DON'Ts
```
1. Enter before CHoCH → No clear direction
2. Enter only on yellow text → Unstable transition period
3. Ignore bar color → Trading against market state
4. Don't check Order Blocks → Unclear support/resistance
5. Enter same direction consecutively → Overtrading
```
---
## Settings Customization
### 🔧 How to Open Settings
```
1. Right-click on indicator name on chart
2. Select "Settings..."
3. Settings panel opens
```
---
### 📋 Recommended Setting Profiles
#### 🔰 Beginner Settings (Simple)
**Goal**: Reduce noise, show only important signals
```
【FILTERS】
✅ Bonus Filter: ON
✅ Filter 6 (OB/BB/NPR Zone Filter): ON
❌ Direction Filter: OFF
❌ Liquidation Reversal Filter: OFF
❌ ICT Market Structure Filter: OFF
❌ EMA Trend Filter: OFF
❌ OB/FVG Filter 1: OFF
❌ OB/FVG Filter 2: OFF
【SIGNALS】
✅ Signal 0 (Bonus): ON
✅ Signal 1 (VWC Change): ON
✅ Signal 2 (Liq Rev): ON
❌ Signal 3 (LS): OFF (complex alone)
❌ Signal 4 (LS Break): OFF
❌ Signal 5 (OB+LS NPR): OFF
❌ Signal 6 (OB+LS EMA): OFF
【LS BOUNCE SIGNAL】
✅ Exclude EMA50 from touch detection: OFF
❌ Only show when EMA fills are mixed: OFF
```
**What happens with this setup**:
- Only Bonus (black background) signals display
- LS Bounce Signals clearly visible
- Noisy signals filtered out
---
#### 💪 Intermediate Settings (Balanced)
**Goal**: Enable key filters for better accuracy
```
【FILTERS】
✅ Bonus Filter: ON
✅ Filter 6 (OB/BB/NPR Zone Filter): ON
✅ ICT Market Structure Filter: ON
❌ Direction Filter: OFF
❌ Liquidation Reversal Filter: OFF
❌ EMA Trend Filter: OFF
❌ OB/FVG Filter 1: OFF
❌ OB/FVG Filter 2: OFF
【SIGNALS】
✅ Signal 0 (Bonus): ON
✅ Signal 1 (VWC Change): ON
✅ Signal 2 (Liq Rev): ON
✅ Signal 3 (LS): ON
❌ Signal 4 (LS Break): OFF
❌ Signal 5 (OB+LS NPR): OFF
❌ Signal 6 (OB+LS EMA): OFF
【LS BOUNCE SIGNAL】
✅ Exclude EMA50 from touch detection: OFF
❌ Only show when EMA fills are mixed: OFF
```
**What happens with this setup**:
- Signals only after CHoCH (trend confirmed)
- Filter 6 changes bar colors
- Liquidity Sweeps also displayed
---
#### 🚀 Advanced Settings (Full Utilization)
**Goal**: Master all features
```
【FILTERS】
✅ Bonus Filter: ON
✅ Filter 6 (OB/BB/NPR Zone Filter): ON
✅ ICT Market Structure Filter: ON
✅ Direction Filter: ON
✅ EMA Trend Filter: ON
❌ Liquidation Reversal Filter: OFF (optional)
✅ OB/FVG Filter 1: ON
✅ OB/FVG Filter 2: ON
【SIGNALS】
✅ All ON
【LS BOUNCE SIGNAL】
✅ Exclude EMA50 from touch detection: ON (reduce EMA50 noise)
✅ Only show when EMA fills are mixed: ON (show only transition zones)
```
**What happens with this setup**:
- Fewer signals (precision-focused)
- Multiple confirmations greatly reduce false signals
- Only signals confirmed by trend, momentum, and zones
---
### 🎨 Display Customization
#### Change Label Size
```
【BUY/SELL SIGNAL APPEARANCE】
→ "BUY/SELL Label Size"
→ Choose from: tiny / small / normal / large / huge
Recommended: small (default)
```
#### Order Block Display Settings
```
【ORDER BLOCK (OB) SETTINGS】
✅ Show Current TF OB: Current timeframe OB
✅ Show 1min OB: 1-minute OB
✅ Show 5min OB: 5-minute OB
✅ Show 15min OB: 15-minute OB
Recommended: Only 15min OB ON (simple)
```
#### Liquidity Sweep Display
```
【LIQUIDITY SWEEPS SETTINGS】
→ "Sweep Length": Sensitivity (small=frequent, large=selective)
→ "Sweep Option": Standard / Maximum
Recommended: Length=40, Option=Standard
```
#### NPR/BB Bands Display
```
【NPR (NON-REPAINT STDEV) SETTINGS】
✅ Display 60min NPR Bands: 60-minute support/resistance
❌ Display Current TF NPR Bands: Current timeframe (optional)
Recommended: Only 60min ON
```
---
### ⚙️ Advanced Settings
#### Fine-tune Filter 6
```
【FINAL FILTERS】
→ "Enable Filter 6 (OB/BB/NPR Zone Filter)"
When ON:
- Bars color-coded red/green/white
- Behavior at OB, NPR/BB touches controlled
```
#### LS Bounce Signal Adjustments
```
【LS BOUNCE SIGNAL】
→ "Exclude EMA50 from touch detection"
OFF: Detect NPR/BB/EMA50 (all 3)
ON: Detect NPR/BB only (exclude EMA50)
→ "Only show when EMA fills are mixed"
OFF: Show all LS Bounce Signals
ON: Show only transition zone signals (yellow text)
```
#### MTF (Multi-Timeframe) Control
```
【ORDER BLOCK (OB) SETTINGS】
→ "Disable MTF on 1hr+ Charts"
ON: Disable MTF on 1H+ (save memory)
OFF: MTF enabled on all timeframes
Recommended: ON (unnecessary on larger timeframes)
```
---
### 🎯 Purpose-Based Configuration Guide
#### 🔍 Goal 1: Reduce Signal Count
```
✅ Bonus Filter: ON
✅ ICT Market Structure Filter: ON
✅ Filter 6: ON
✅ All Signals OFF, only Signal 0 ON
```
#### 🔍 Goal 2: Get More Signals
```
❌ All Filters OFF
✅ All Signals ON
```
#### 🔍 Goal 3: Trend Following Only
```
✅ ICT Market Structure Filter: ON
✅ Direction Filter: ON
✅ EMA Trend Filter: ON
```
#### 🔍 Goal 4: Counter-Trend Trading
```
✅ LS Bounce Signal: ON
✅ Filter 6: ON
❌ ICT Market Structure Filter: OFF
```
#### 🔍 Goal 5: Day Trading (5-15min charts)
```
✅ Show 15min OB: ON
✅ Display 60min NPR Bands: ON
✅ LS Bounce Signal: ON
❌ Show 1min/5min OB: OFF
```
#### 🔍 Goal 6: Scalping (1-5min charts)
```
✅ Show 5min OB: ON
✅ Show 15min OB: ON
✅ Display 60min NPR Bands: ON
✅ All Signals: ON
```
---
### 💾 Saving and Loading Settings
#### Save Settings
```
1. Click "..." in top-right of Settings screen
2. Select "Save as default"
→ Same settings auto-applied next time
```
#### Reset Settings
```
1. Click "..." in top-right of Settings screen
2. Select "Reset settings"
→ Return to default settings
```
---
## Why Combine Multiple Features?
### 🎯 Problem: Single Indicator Limitations
Common trader problems:
```
❌ RSI alone → Trade against trend, lose
❌ Moving Average alone → Late entry timing
❌ Support/Resistance alone → Caught by false breakouts
```
**Markets are complex**. One angle isn't enough.
---
### 💡 Solution: Multi-Angle Integrated Approach
#### 1️⃣ Structure × Zone × Momentum
```
📐 Structure (ICT CHoCH)
→ "Which direction is likely?"
📦 Zone (OB/NPR/BB)
→ "Where will price react?"
💨 Momentum (EMA/VWC)
→ "Is there momentum now?"
```
**When all 3 align = Highest win-rate timing**
---
#### 2️⃣ Multi-Timeframe Analysis
```
Big picture: Confirm Daily direction
Medium-term: Check 1H Order Blocks
Short-term: Time entry on 5min
```
**Short-term entries aligned with higher timeframes = Better win rate**
---
#### 3️⃣ Understanding Liquidity
```
🎣 Institutional strategy:
1. Intentionally move price opposite to stop out retail
2. Then, move in real direction
💡 Liquidity Sweep = Visualize this "trap"
→ Read institutional order flow
```
---
### 🧠 Integration Examples
#### Case 1: RSI Alone vs Integrated System
**Scenario**: RSI at 30 (oversold)
```
❌ RSI-only decision:
→ "Buy!"
→ But downtrend continues, loss 😢
✅ Trend Gazer:
CHoCH check → Still downtrend ❌
Order Block → In Bearish OB ❌
LS Bounce → SHORT signal only ❌
→ Skip or SHORT
→ Avoid loss ✅
```
**Result**: Multiple filters block wrong entry
---
#### Case 2: LS Bounce Signal 2-Stage Logic
**Scenario**: Price touches 60min NPR lower band
```
🔍 Traditional method:
Touched → Buy!
→ But price continues down 😢
✅ Trend Gazer:
Stage 1: NPR touch + red bar → Flag ON
Stage 2: EMA20 crosses above EMA50 → Confirm bounce
→ Now "Long@ HL only" displays
→ Entry → Success ✅
```
**Result**: Not just "touch" but "touch + bounce confirmation" improves accuracy
---
### 🎓 Progressive Learning Design
This indicator is designed for **beginners to advanced**:
```
📖 Beginner (Month 1):
Use only CHoCH + LS Bounce Signal
→ Learn trend and entry points
📖 Intermediate (Months 2-3):
Add Order Block + Bar Color
→ Learn support/resistance and filtering
📖 Advanced (Month 6+):
Master all features
→ Read institutional order flow
```
**Ultimate goal**: Indicator becomes confirmation tool. Your market sense becomes primary.
---
### 🔬 Technical Advantages
#### 1. Non-Repaint STDEV (NPR)
```
Normal Bollinger Bands:
→ Past data changes (repaints)
→ Inaccurate backtesting
NPR:
→ Past data doesn't change (non-repaint)
→ Reliable verification possible
```
#### 2. 2-Stage Signal Logic
```
Traditional: Condition met → Immediate signal
→ Many false signals
Trend Gazer: Condition1 → Flag ON → Condition2 → Signal
→ Confirmation step improves accuracy
```
#### 3. Alternating Filter
```
Problem: Same-direction signals spam
→ Overtrading
Solution: LONG → SHORT → LONG alternating only
→ Prevent unnecessary entries
```
---
### 💎 Conclusion: Why Integration?
```
Single indicator = "Partial truth"
Integrated system = "3D market perspective"
```
**Markets are multifaceted**. One angle isn't enough.
Trend Gazer **integrates multiple screens pros watch simultaneously into ONE**,
allowing beginners to read charts with institutional perspective.
---
## FAQ
### ❓ Q1: Which timeframe is best?
**A**: Depends on trading style
```
Scalping: 1min ~ 5min
Day Trading: 5min ~ 15min
Swing: 1H ~ 4H
```
**Important**: LS Bounce Signal only works on 30min and below.
---
### ❓ Q2: Too many signals, confused
**A**: Enable filters
```
【Recommended Settings】
✅ Bonus Filter: ON
✅ Filter 6: ON
✅ ICT Market Structure Filter: ON
→ Show only Signal 0
```
This significantly reduces signal count.
---
### ❓ Q3: No CHoCH appearing, what to do?
**A**: Wait or check higher timeframe
```
Method 1: Wait for CHoCH (recommended)
Method 2: Check higher timeframe (e.g., Daily) for trend
Method 3: Disable ICT Filter (not recommended)
```
**When trend is unclear, sitting out is also strategy**.
---
### ❓ Q4: LS Bounce Signal not appearing
**A**: Checkpoints
```
1. Are you on 30min or below chart?
→ Doesn't show on 1H+
2. Are NPR/BB bands displayed?
→ Check Settings "Display 60min NPR Bands"
3. Is EMA50 excluded?
→ If "Exclude EMA50" is ON, EMA50 signals won't show
```
---
### ❓ Q5: Bar color not changing?
**A**: Check Filter 6
```
Settings → FINAL FILTERS
→ Confirm "Enable Filter 6 (OB/BB/NPR Zone Filter)" is ON
If ON but still not changing:
→ Current price may be outside OB/NPR/BB zones
```
---
### ❓ Q6: Too many Order Blocks, hard to see
**A**: Narrow down displayed OBs
```
Settings → ORDER BLOCK (OB) SETTINGS
Recommended:
❌ Show Current TF OB: OFF
❌ Show 1min OB: OFF
❌ Show 5min OB: OFF
✅ Show 15min OB: ON (only this)
```
---
### ❓ Q7: How to improve win rate?
**A**: Thorough multiple confirmations
```
Checklist:
✅ CHoCH appeared
✅ LS Bounce Signal (white text)
✅ Bar color matches (red bar=LONG, green bar=SHORT)
✅ Signal within Order Block
✅ Aligns with higher timeframe trend
Enter ONLY when all align
```
---
### ❓ Q8: Want to practice on demo
**A**: Recommended practice method
```
Week 1: Observation only
→ Watch signals and chart movement
→ Resist entering
Weeks 2-3: Keep records
→ Screenshot when signal appears
→ Record subsequent movement
Week 4+: Start demo trading
→ Start with small amounts
→ Continue keeping records
```
---
### ❓ Q9: Are there alert features?
**A**: Yes, multiple alerts available
```
Setup method:
1. Right-click indicator on chart
2. Select "Add Alert..."
3. Choose from:
- ANY ALERT: BUY/SELL Signals
- BUY ONLY ALERT
- SELL ONLY ALERT
- MS UP / MS DOWN
- BAR COLOR: RED / LIME
- LS BOUNCE: LONG / SHORT Signal
```
---
### ❓ Q10: Works on other markets?
**A**: Yes, works on all markets
```
✅ Cryptocurrency (BTC, ETH, etc.)
✅ Forex (EUR/USD, USD/JPY, etc.)
✅ Stocks (individual stocks, indices)
✅ Futures (oil, gold, etc.)
```
Works on any market with price and volume data.
---
## 📋 Disclaimer
### ⚠️ Important Notice
This indicator is for **educational and informational purposes only**.
```
❌ NOT investment advice
❌ Does NOT guarantee profits
❌ Past results do NOT guarantee future performance
```
### Risk Warning
```
⚠️ Trading involves substantial risk
⚠️ Only trade with funds you can afford to lose
⚠️ Practice extensively on demo account before live trading
⚠️ Make your own informed decisions and act at your own risk
```
---
## 📞 Support
### Feedback & Questions
Feel free to ask questions in TradingView comments section.
### Bug Reports
Please report with specific details (timeframe, symbol, screenshots).
---
**Author**: rasukaru666
**License**: Mozilla Public License 2.0
**Last Updated**: December 2025
**Version**: Latest
---
**Thank you for using Trend Gazer!**
**Happy Trading! 📈**
---------------

Options Scalper v2 - SPY/QQQHere's a comprehensive description of the Options Scalper v2 strategy:
---
## Options Scalper v2 - SPY/QQQ
### Overview
A multi-indicator confluence-based scalping strategy designed for trading SPY and QQQ options on short timeframes (1-5 minute charts). The strategy uses a scoring system to generate high-probability CALL and PUT signals by requiring alignment across multiple technical indicators before triggering entries.
---
### Core Logic
The strategy operates on a **scoring system (0-9 points)** where both bullish (CALL) and bearish (PUT) conditions are evaluated independently. A signal only fires when:
1. A recent EMA crossover occurred (within the last 3 bars)
2. The direction's score meets the minimum threshold (default: 4 points)
3. The signal's score is higher than the opposite direction
4. Enough bars have passed since the last signal (cooldown period)
5. Price action occurs during valid trading sessions
---
### Indicators Used
| Indicator | Purpose | CALL Condition | PUT Condition |
|-----------|---------|----------------|---------------|
| **9/21 EMA Cross** | Primary trigger | Fast EMA crosses above slow | Fast EMA crosses below slow |
| **200 EMA** | Trend filter | Price above 200 EMA | Price below 200 EMA |
| **RSI (14)** | Momentum filter | RSI between 45-65 | RSI between 35-55 |
| **VWAP** | Institutional level | Price above VWAP | Price below VWAP |
| **MACD (12,26,9)** | Momentum confirmation | MACD line > Signal line | MACD line < Signal line |
| **Stochastic (14,3)** | Overbought/Oversold | Oversold or K > D | Overbought or K < D |
| **Volume** | Participation confirmation | Spike on green candle | Spike on red candle |
| **Price Structure** | Breakout detection | Higher high formed | Lower low formed |
---
### Scoring Breakdown
**CALL Score (Max 9 points):**
- Recent EMA cross up: +2 pts
- EMA alignment (fast > slow): +1 pt
- RSI in bullish range: +1 pt
- Above VWAP: +1 pt
- MACD bullish: +1 pt
- Volume spike on green candle: +1 pt
- Stochastic setup: +1 pt
- Above 200 EMA: +1 pt
- Breaking higher high: +1 pt
**PUT Score (Max 9 points):**
- Recent EMA cross down: +2 pts
- EMA alignment (fast < slow): +1 pt
- RSI in bearish range: +1 pt
- Below VWAP: +1 pt
- MACD bearish: +1 pt
- Volume spike on red candle: +1 pt
- Stochastic setup: +1 pt
- Below 200 EMA: +1 pt
- Breaking lower low: +1 pt
---
### Risk Management
The strategy uses **ATR-based dynamic stops and targets**:
| Parameter | Default | Description |
|-----------|---------|-------------|
| Stop Loss | 1.5x ATR | Distance below entry for longs, above for shorts |
| Take Profit | 2.0x ATR | Creates a 1:1.33 risk-reward ratio |
Positions are also closed on:
- Opposite direction signal (flip trade)
- Take profit or stop loss hit
---
### Session Filtering
Trades are restricted to high-liquidity periods by default:
- **Morning Session:** 9:30 AM - 11:00 AM EST
- **Afternoon Session:** 2:30 PM - 3:55 PM EST
This avoids choppy midday price action and captures the highest volume periods.
---
### Input Parameters
| Parameter | Default | Description |
|-----------|---------|-------------|
| Fast EMA | 9 | Fast moving average period |
| Slow EMA | 21 | Slow moving average period |
| Trend EMA | 200 | Long-term trend filter |
| RSI Length | 14 | RSI calculation period |
| RSI Overbought | 65 | Upper RSI threshold |
| RSI Oversold | 35 | Lower RSI threshold |
| Volume Multiplier | 1.2x | Volume spike detection threshold |
| Min Signal Strength | 4 | Minimum score required to trigger |
| Crossover Lookback | 3 | Bars to consider crossover "recent" |
| Min Bars Between Signals | 5 | Cooldown period between signals |
---
### Visual Elements
**Chart Plots:**
- Green line: 9 EMA (fast)
- Red line: 21 EMA (slow)
- Gray line: 200 EMA (trend)
- Purple dots: VWAP
**Signal Markers:**
- Green triangle up + "CALL" label: Buy call signal
- Red triangle down + "PUT" label: Buy put signal
- Small circles: EMA crossover reference points
**Info Table (Top Right):**
- Real-time CALL and PUT scores
- RSI, MACD, Stochastic values
- VWAP and 200 EMA position
- Recent crossover status
- Current signal state
---
### Alerts
| Alert Name | Trigger |
|------------|---------|
| CALL Entry | Standard call signal fires |
| PUT Entry | Standard put signal fires |
| Strong CALL | Call signal with score ≥ 6 |
| Strong PUT | Put signal with score ≥ 6 |
---
### Recommended Usage
| Setting | 0DTE Scalping | Intraday Swings |
|---------|---------------|-----------------|
| Timeframe | 1-2 min | 5 min |
| Min Signal Strength | 5-6 | 4 |
| ATR Stop Mult | 1.0 | 1.5 |
| ATR TP Mult | 1.5 | 2.0 |
| Option Delta | 0.40-0.50 | 0.30-0.40 |
---
### Key Improvements Over v1
1. **Requires actual crossover** - Eliminates false signals from simple trend continuation
2. **Balanced scoring** - Both directions evaluated equally, highest score wins
3. **Signal cooldown** - Prevents overtrading with minimum bar spacing
4. **Multi-indicator confluence** - 8 factors must align for signal generation
5. **Volume-candle alignment** - Volume spikes only count when matching candle direction
---
### Disclaimer
This strategy is for educational purposes. Backtest thoroughly before live trading. Options trading involves significant risk of loss. Past performance does not guarantee future results.

TMT 1M HA Scalping INDICATOR - Hitesh Nimje📊 TMT 1 Minute HA Scalping Strategy - Hitesh Nimje
🎯 Strategy Overview
A 1-minute scalping strategy designed for high-frequency trading using Heikin Ashi-inspired crossover logic with multiple filters for precision entries.
🔧 Key Components
1. Moving Averages (Trend Detection)
LineTypePeriodColorPurposeFast SMASimple MA9🔵 BluePrimary signal lineSlow SMASimple MA21🔴 RedSecondary confirmationTrend SMASMA (1H)50⚫ BlackOverall market trend bias
2. Entry Signals (Crossover Logic)
🔥 BUY Signal: Fast SMA (9) crosses ABOVE Slow SMA (21)
🔥 SELL Signal: Fast SMA (9) crosses BELOW Slow SMA (21)
3. Entry Filters (4-Layer Confirmation)
✅ LONG Entry = Crossover + Trend Up + RSI Overbought + Bar Confirmed
✅ SHORT Entry = Crossunder + Trend Down + RSI Oversold + Bar Confirmed
longCond = sma_slope > 0 AND rsi >= 70 AND buySignal
shortCond = sma_slope < 0 AND rsi <= 30 AND sellSignal
FilterLongShortPurposeTrend Slopesma_slope > 0sma_slope < 0Market directionRSI FilterRSI >= 70RSI <= 30Momentum extremeCrossoverFast > SlowFast < SlowEntry triggerBar Statebarstate.isconfirmedbarstate.isconfirmedNo repaint
⚡ Risk Management
Stop Loss (Dynamic ATR-based)
Long SL = Lowest Low (7) - 1×ATR(14)
Short SL = Highest High (7) + 1×ATR(14)
Take Profit (1:1 Risk-Reward)
Long TP = Entry + (Entry - SL distance)
Short TP = Entry - (SL distance - Entry)
⏰ Trading Hours
📅 Active: 00:00 - 14:59 (3:00 PM cutoff)
🛑 Auto-close: All positions closed at 15:00
🎨 Visual Elements
📍 BUY Labels: 🟢 Green (below bar)
📍 SELL Labels: 🔴 Red (above bar)
📈 Fast SMA: 🔵 Blue line (9-period)
📉 Slow SMA: 🔴 Red line (21-period)
📊 Trend SMA: ⚫ Black line (50-period, 1H)
⚙️ Input Parameters
ParameterDefaultPurposeEnd of Day1500 (3 PM)Auto-close timeLot Size1Position size
🚀 How It Works (Step-by-Step)
1. Monitor Fast(9) vs Slow(21) SMA crossover
2. Check 1H Trend SMA slope (up/down bias)
3. Validate RSI extreme (70+/30-)
4. Wait for bar confirmation
5. Enter with ATR-based SL & 1:1 TP
6. Auto-exit at 3 PM or SL/TP hit
💡 Strategy Strengths
* ✅ Multi-timeframe trend filter
* ✅ RSI momentum confirmation
* ✅ Dynamic ATR stop losses
* ✅ No repaint signals
* ✅ End-of-day risk control
* ✅ 1:1 Risk-Reward consistency
Perfect for 1-minute scalping on volatile instruments! 🔥
© Hitesh Nimje | Thought Magic Trading
Contact: 8087192915
TRADING DISCLAIMER
RISK WARNING
Trading involves substantial risk of loss and is not suitable for all investors. Past performance is not indicative of future results. You should carefully consider whether trading is suitable for you in light of your circumstances, knowledge, and financial resources.
NO FINANCIAL ADVICE
This indicator is provided for educational and informational purposes only. It does not constitute:
* Financial advice or investment recommendations
* Buy/sell signals or trading signals
* Professional investment advice
* Legal, tax, or accounting guidance
LIMITATIONS AND DISCLAIMERS
Technical Analysis Limitations
* Pivot points are mathematical calculations based on historical price data
* No guarantee of accuracy of price levels or calculations
* Markets can and do behave irrationally for extended periods
* Past performance does not guarantee future results
* Technical analysis should be used in conjunction with fundamental analysis
Data and Calculation Disclaimers
* Calculations are based on available price data at the time of calculation
* Data quality and availability may affect accuracy
* Pivot levels may differ when calculated on different timeframes
* Gaps and irregular market conditions may cause level failures
* Extended hours trading may affect intraday pivot calculations
Market Risks
* Extreme market volatility can invalidate all technical levels
* News events, economic announcements, and market manipulation can cause gaps
* Liquidity issues may prevent execution at calculated levels
* Currency fluctuations, inflation, and interest rate changes affect all levels
* Black swan events and market crashes cannot be predicted by technical analysis
USER RESPONSIBILITIES
Due Diligence
* You are solely responsible for your trading decisions
* Conduct your own research before using this indicator
* Verify calculations with multiple sources before trading
* Consider multiple timeframes and confirm levels with other technical tools
* Never rely solely on one indicator for trading decisions
Risk Management
* Always use proper risk management and position sizing
* Set appropriate stop-losses for all positions
* Never risk more than you can afford to lose
* Consider the inherent risks of leverage and margin trading
* Diversify your portfolio and trading strategies
Professional Consultation
* Consult with qualified financial advisors before trading
* Consider your tax obligations and legal requirements
* Understand the regulations in your jurisdiction
* Seek professional advice for complex trading strategies
LIMITATION OF LIABILITY
Indemnification
The creator and distributor of this indicator shall not be liable for:
* Any trading losses, whether direct or indirect
* Inaccurate or delayed price data
* System failures or technical malfunctions
* Loss of data or profits
* Interruption of service or connectivity issues
No Warranty
This indicator is provided "as is" without warranties of any kind:
* No guarantee of accuracy or completeness
* No warranty of uninterrupted or error-free operation
* No warranty of merchantability or fitness for a particular purpose
* The software may contain bugs or errors
Maximum Liability
In no event shall the liability exceed the purchase price (if any) paid for this indicator. This limitation applies regardless of the theory of liability, whether contract, tort, negligence, or otherwise.
REGULATORY COMPLIANCE
Jurisdiction-Specific Risks
* Regulations vary by country and region
* Some jurisdictions prohibit or restrict certain trading strategies
* Tax implications differ based on your location and trading frequency
* Commodity futures and options trading may have additional requirements
* Currency trading may be regulated differently than stock trading
Professional Trading
* If you are a professional trader, ensure compliance with all applicable regulations
* Adhere to fiduciary duties and best execution requirements
* Maintain required records and reporting
* Follow market abuse regulations and insider trading laws
TECHNICAL SPECIFICATIONS
Data Sources
* Calculations based on TradingView data feeds
* Data accuracy depends on broker and exchange reporting
* Historical data may be subject to adjustments and corrections
* Real-time data may have delays depending on data providers
Software Limitations
* Internet connectivity required for proper operation
* Software updates may change calculations or functionality
* TradingView platform dependencies may affect performance
* Third-party integrations may introduce additional risks
MONEY MANAGEMENT RECOMMENDATIONS
Conservative Approach
* Risk only 1-2% of capital per trade
* Use position sizing based on volatility
* Maintain adequate cash reserves
* Avoid over-leveraging accounts
Portfolio Management
* Diversify across multiple strategies
* Don't put all capital into one approach
* Regularly review and adjust trading strategies
* Maintain detailed trading records
FINAL LEGAL NOTICES
Acceptance of Terms
* By using this indicator, you acknowledge that you have read and understood this disclaimer
* You agree to assume all risks associated with trading
* You confirm that you are legally permitted to trade in your jurisdiction
Updates and Changes
* This disclaimer may be updated without notice
* Continued use constitutes acceptance of any changes
* It is your responsibility to stay informed of updates
Governing Law
* This disclaimer shall be governed by the laws of the jurisdiction where the indicator was created
* Any disputes shall be resolved in the appropriate courts
* Severability clause: If any part of this disclaimer is invalid, the remainder remains enforceable
REMEMBER: THERE ARE NO GUARANTEES IN TRADING. THE MAJORITY OF RETAIL TRADERS LOSE MONEY. TRADE AT YOUR OWN RISK.
Contact Information:
* Creator: Hitesh_Nimje
* Phone: Contact@8087192915
* Source: Thought Magic Trading
© HiteshNimje - All Rights Reserved
This disclaimer should be prominently displayed whenever the indicator is shared, sold, or distributed to ensure users are fully aware of the risks and limitations involved in trading.

TMT ICT SMC - Hitesh NimjeTMT ICT SMC - Smart Money Concepts
Overview
T
he TMT ICT SMC indicator is a comprehensive, all-in-one toolkit designed for traders utilizing Smart Money Concepts (SMC) and Inner Circle Trader (ICT) methodologies. Developed by Hitesh Nimje (Thought Magic Trading), this script automates the complex task of market structure mapping, order block identification, and liquidity analysis, providing a clear, institutional-grade view of price action.
Whether you are a scalper looking for internal structure shifts or a swing trader analyzing major trend reversals, this tool adapts to your timeframe with precision.
Key Features
1. Market Structure Mapping (Internal & Swing)
* Real-Time Structure: Automatically detects and labels BOS (Break of Structure) and CHoCH (Change of Character).
* Dual-Layer Analysis:
I nternal Structure: Captures short-term momentum and minor shifts for entry refinement.
Swing Structure: Identifies the overarching trend and major pivot points.
* Strong vs. Weak Highs/Lows: visualizes significant swing points to help you identify safe invalidation levels.
* Trend Coloring: Optional feature to color candles based on the active market structure trend.
2. Advanced Order Blocks (OB)
* Auto-Detection: Plots both Internal and Swing Order Blocks automatically.
* Smart Filtering: Includes an ATR or Cumulative Mean Range filter to remove noise and only display significant institutional footprint zones.
* Mitigation Tracking: Choose how order blocks are mitigated (Close vs. High/Low) to keep your chart clean.
3. Liquidity & Gaps
* Fair Value Gaps (FVG): Automatically highlights bullish and bearish imbalances. Includes MTF (Multi-Timeframe) capabilities to see higher timeframe gaps on lower timeframe charts.
* Equal Highs/Lows (EQH/EQL): Marks potential liquidity pools where price often reverses or targets.
4. Multi-Timeframe Levels
* Plots Daily, Weekly, and Monthly High/Low levels directly on your chart to help identify macro support and resistance without switching timeframes.
5. Premium & Discount Zones
* Automatically plots the Fibonacci range of the current price leg to show Premium (expensive), Discount (cheap), and Equilibrium zones, aiding in high-probability entry placement.
Customization
* Style: Switch between a "Colored" vibrant theme or a "Monochrome" minimal theme.
* Control: Every feature can be toggled on/off. Adjust lookback periods, sensitivity thresholds, and colors to match your personal trading style.
* Modes: Choose between "Historical" (for backtesting) and "Present" (for optimized real-time performance).
How to Use
* Trend Confirmation: Use the Swing Structure labels to determine the higher timeframe bias.
* Entry Trigger: Wait for a CHoCH on the Internal Structure within a higher timeframe Order Block or FVG.
* Targeting: Use the Equal Highs/Lows (Liquidity) or opposing Order Blocks as take-profit zones.
Credits
* Author: Hitesh Nimje
* Source: Thought Magic Trading (TMT)
TRADING DISCLAIMER
RISK WARNING
Trading involves substantial risk of loss and is not suitable for all investors. Past performance is not indicative of future results. You should carefully consider whether trading is suitable for you in light of your circumstances, knowledge, and financial resources.
NO FINANCIAL ADVICE
This indicator is provided for educational and informational purposes only. It does not constitute:
* Financial advice or investment recommendations
* Buy/sell signals or trading signals
* Professional investment advice
* Legal, tax, or accounting guidance
LIMITATIONS AND DISCLAIMERS
Technical Analysis Limitations
* Pivot points are mathematical calculations based on historical price data
* No guarantee of accuracy of price levels or calculations
* Markets can and do behave irrationally for extended periods
* Past performance does not guarantee future results
* Technical analysis should be used in conjunction with fundamental analysis
Data and Calculation Disclaimers
* Calculations are based on available price data at the time of calculation
* Data quality and availability may affect accuracy
* Pivot levels may differ when calculated on different timeframes
* Gaps and irregular market conditions may cause level failures
* Extended hours trading may affect intraday pivot calculations
Market Risks
* Extreme market volatility can invalidate all technical levels
* News events, economic announcements, and market manipulation can cause gaps
* Liquidity issues may prevent execution at calculated levels
* Currency fluctuations, inflation, and interest rate changes affect all levels
* Black swan events and market crashes cannot be predicted by technical analysis
USER RESPONSIBILITIES
Due Diligence
* You are solely responsible for your trading decisions
* Conduct your own research before using this indicator
* Verify calculations with multiple sources before trading
* Consider multiple timeframes and confirm levels with other technical tools
* Never rely solely on one indicator for trading decisions
Risk Management
* Always use proper risk management and position sizing
* Set appropriate stop-losses for all positions
* Never risk more than you can afford to lose
* Consider the inherent risks of leverage and margin trading
* Diversify your portfolio and trading strategies
Professional Consultation
* Consult with qualified financial advisors before trading
* Consider your tax obligations and legal requirements
* Understand the regulations in your jurisdiction
* Seek professional advice for complex trading strategies
LIMITATION OF LIABILITY
Indemnification
The creator and distributor of this indicator shall not be liable for:
* Any trading losses, whether direct or indirect
* Inaccurate or delayed price data
* System failures or technical malfunctions
* Loss of data or profits
* Interruption of service or connectivity issues
No Warranty
This indicator is provided "as is" without warranties of any kind:
* No guarantee of accuracy or completeness
* No warranty of uninterrupted or error-free operation
* No warranty of merchantability or fitness for a particular purpose
* The software may contain bugs or errors
Maximum Liability
In no event shall the liability exceed the purchase price (if any) paid for this indicator. This limitation applies regardless of the theory of liability, whether contract, tort, negligence, or otherwise.
REGULATORY COMPLIANCE
Jurisdiction-Specific Risks
* Regulations vary by country and region
* Some jurisdictions prohibit or restrict certain trading strategies
* Tax implications differ based on your location and trading frequency
* Commodity futures and options trading may have additional requirements
* Currency trading may be regulated differently than stock trading
Professional Trading
* If you are a professional trader, ensure compliance with all applicable regulations
* Adhere to fiduciary duties and best execution requirements
* Maintain required records and reporting
* Follow market abuse regulations and insider trading laws
TECHNICAL SPECIFICATIONS
Data Sources
* Calculations based on TradingView data feeds
* Data accuracy depends on broker and exchange reporting
* Historical data may be subject to adjustments and corrections
* Real-time data may have delays depending on data providers
Software Limitations
* Internet connectivity required for proper operation
* Software updates may change calculations or functionality
* TradingView platform dependencies may affect performance
* Third-party integrations may introduce additional risks
MONEY MANAGEMENT RECOMMENDATIONS
Conservative Approach
* Risk only 1-2% of capital per trade
* Use position sizing based on volatility
* Maintain adequate cash reserves
* Avoid over-leveraging accounts
Portfolio Management
* Diversify across multiple strategies
* Don't put all capital into one approach
* Regularly review and adjust trading strategies
* Maintain detailed trading records
FINAL LEGAL NOTICES
Acceptance of Terms
* By using this indicator, you acknowledge that you have read and understood this disclaimer
* You agree to assume all risks associated with trading
* You confirm that you are legally permitted to trade in your jurisdiction
Updates and Changes
* This disclaimer may be updated without notice
* Continued use constitutes acceptance of any changes
* It is your responsibility to stay informed of updates
Governing Law
* This disclaimer shall be governed by the laws of the jurisdiction where the indicator was created
* Any disputes shall be resolved in the appropriate courts
* Severability clause: If any part of this disclaimer is invalid, the remainder remains enforceable
REMEMBER: THERE ARE NO GUARANTEES IN TRADING. THE MAJORITY OF RETAIL TRADERS LOSE MONEY. TRADE AT YOUR OWN RISK.
Contact Information:
* Creator: Hitesh_Nimje
* Phone: Contact@8087192915
* Source: Thought Magic Trading
© HiteshNimje - All Rights Reserved
This disclaimer should be prominently displayed whenever the indicator is shared, sold, or distributed to ensure users are fully aware of the risks and limitations involved in trading.

VWAP + EMA9/21/50 + Ichimoku + RSI (M5) - Strict + TPSL//@version=5
indicator("VWAP + EMA9/21/50 + Ichimoku + RSI (M5) - Strict + TPSL", overlay=true, shorttitle="VWAP_EMA_ICH_RSI_TPSL")
// === Inputs ===
emaFastLen = input.int(9, "EMA Fast (9)")
emaMidLen = input.int(21, "EMA Mid (21)")
emaSlowLen = input.int(50, "EMA Slow (50)")
// Ichimoku inputs
tenkanLen = input.int(9, "Tenkan Sen Length")
kijunLen = input.int(26, "Kijun Sen Length")
senkouBLen = input.int(52, "Senkou B Length")
displacement = input.int(26, "Displacement")
// RSI
rsiLen = input.int(14, "RSI Length")
rsiThreshold = input.int(50, "RSI Threshold")
// VWAP option
useSessionVWAP = input.bool(true, "Use Session VWAP (true) / Daily VWAP (false)")
// Volume filter
useVolumeFilter = input.bool(true, "Enable Volume Filter")
volAvgLen = input.int(20, "Volume Avg Length")
volMultiplier = input.float(1.2, "Min Volume > avg *", step=0.1)
// Higher timeframe trend check
useHTF = input.bool(true, "Enable Higher-Timeframe Trend Check")
htfTF = input.string("60", "HTF timeframe (e.g. 60, 240, D)")
// Alerts / webhook
alertOn = input.bool(true, "Enable Alerts")
useWebhook = input.bool(true, "Send webhook on alerts")
webhookURL = input.string("", "Webhook URL (leave blank to set in alert)")
// TP/SL & Trailing inputs
useTP = input.bool(true, "Enable Take Profit (TP)")
tpTypeRR = input.bool(true, "TP as Risk-Reward ratio (true) / Fixed points (false)")
tpRR = input.float(1.5, "TP RR (e.g. 1.5)", step=0.1)
fixedTPpts = input.float(40.0, "Fixed TP (ticks/pips) if not RR")
useSL = input.bool(true, "Enable Stop Loss (SL)")
slTypeATR = input.bool(true, "SL as ATR-based (true) / Fixed points (false)")
atrLen = input.int(14, "ATR Length")
atrMult = input.float(1.5, "ATR Multiplier for SL", step=0.1)
fixedSLpts = input.float(20.0, "Fixed SL (ticks/pips) if not ATR")
useTrailing = input.bool(true, "Enable Trailing Stop")
trailType = input.string("ATR", "Trailing type: ATR or EMA", options= ) // "ATR" or "EMA"
trailATRmult = input.float(1.0, "Trailing ATR Multiplier", step=0.1)
trailEMAlen = input.int(9, "Trailing EMA Length (if EMA chosen)")
trailLockInPts = input.float(5.0, "Trail lock-in (min profit before trail active, pts)")
// Other
showArrows = input.bool(true, "Show Entry Arrows")
// === Calculations ===
ema9 = ta.ema(close, emaFastLen)
ema21 = ta.ema(close, emaMidLen)
ema50 = ta.ema(close, emaSlowLen)
// VWAP
vwapVal = ta.vwap
// Ichimoku
highestHighTenkan = ta.highest(high, tenkanLen)
lowestLowTenkan = ta.lowest(low, tenkanLen)
tenkan = (highestHighTenkan + lowestLowTenkan) / 2
highestHighKijun = ta.highest(high, kijunLen)
lowestLowKijun = ta.lowest(low, kijunLen)
kijun = (highestHighKijun + lowestLowKijun) / 2
highestHighSenkouB = ta.highest(high, senkouBLen)
lowestLowSenkouB = ta.lowest(low, senkouBLen)
senkouB = (highestHighSenkouB + lowestLowSenkouB) / 2
senkouA = (tenkan + kijun) / 2
// RSI
rsi = ta.rsi(close, rsiLen)
// Volume
volAvg = ta.sma(volume, volAvgLen)
volOk = not useVolumeFilter or (volume > volAvg * volMultiplier)
// Higher timeframe trend values
htf_close = request.security(syminfo.tickerid, htfTF, close)
htf_ema50 = request.security(syminfo.tickerid, htfTF, ta.ema(close, emaSlowLen))
htf_rsi = request.security(syminfo.tickerid, htfTF, ta.rsi(close, rsiLen))
htf_bull = htf_close > htf_ema50
htf_bear = htf_close < htf_ema50
htf_ok = not useHTF or (htf_bull and close > ema50) or (htf_bear and close < ema50)
// Trend filters (on current timeframe)
priceAboveVWAP = close > vwapVal
priceAboveEMA50 = close > ema50
priceAboveCloud = close > senkouA and close > senkouB
bullTrend = priceAboveVWAP and priceAboveEMA50 and priceAboveCloud
bearTrend = not priceAboveVWAP and not priceAboveEMA50 and not priceAboveCloud
// Pullback detection (price near EMA21 within tolerance)
tolPerc = input.float(0.35, "Pullback tolerance (%)", step=0.05) / 100.0
nearEMA21 = math.abs(close - ema21) <= ema21 * tolPerc
// Entry conditions
emaCrossUp = ta.crossover(ema9, ema21)
emaCrossDown = ta.crossunder(ema9, ema21)
longConditionBasic = bullTrend and (nearEMA21 or close >= vwapVal) and emaCrossUp and rsi > rsiThreshold
shortConditionBasic = bearTrend and (nearEMA21 or close <= vwapVal) and emaCrossDown and rsi < rsiThreshold
longCondition = longConditionBasic and volOk and htf_ok and (not useHTF or htf_bull) and (rsi > rsiThreshold)
shortCondition = shortConditionBasic and volOk and htf_ok and (not useHTF or htf_bear) and (rsi < rsiThreshold)
// More strict: require Tenkan > Kijun for bull and Tenkan < Kijun for bear
ichimokuAlign = (tenkan > kijun) ? 1 : (tenkan < kijun ? -1 : 0)
longCondition := longCondition and (ichimokuAlign == 1)
shortCondition := shortCondition and (ichimokuAlign == -1)
// ATR for SL / trailing
atr = ta.atr(atrLen)
// --- Trade management state variables ---
var float activeLongEntry = na
var float activeShortEntry = na
var float activeLongSL = na
var float activeShortSL = na
var float activeLongTP = na
var float activeShortTP = na
var float activeLongTrail = na
var float activeShortTrail = na
// Function to convert fixed points to price (assumes chart in points as price units)
fixedToPriceLong(p) => p
fixedToPriceShort(p) => p
// On signal, set entry, SL and TP
if longCondition
activeLongEntry := close
// SL
if useSL
if slTypeATR
activeLongSL := close - atr * atrMult
else
activeLongSL := close - fixedToPriceLong(fixedSLpts)
else
activeLongSL := na
// TP
if useTP
if tpTypeRR and useSL and not na(activeLongSL)
risk = activeLongEntry - activeLongSL
activeLongTP := activeLongEntry + risk * tpRR
else
activeLongTP := activeLongEntry + fixedToPriceLong(fixedTPpts)
else
activeLongTP := na
// reset short
activeShortEntry := na
activeShortSL := na
activeShortTP := na
// init trailing
activeLongTrail := activeLongSL
if shortCondition
activeShortEntry := close
if useSL
if slTypeATR
activeShortSL := close + atr * atrMult
else
activeShortSL := close + fixedToPriceShort(fixedSLpts)
else
activeShortSL := na
if useTP
if tpTypeRR and useSL and not na(activeShortSL)
riskS = activeShortSL - activeShortEntry
activeShortTP := activeShortEntry - riskS * tpRR
else
activeShortTP := activeShortEntry - fixedToPriceShort(fixedTPpts)
else
activeShortTP := na
// reset long
activeLongEntry := na
activeLongSL := na
activeLongTP := na
// init trailing
activeShortTrail := activeShortSL
// Trailing logic (update only when in profit beyond 'lock-in')
if not na(activeLongEntry) and useTrailing
// current unrealized profit in points
currProfitPts = close - activeLongEntry
if currProfitPts >= trailLockInPts
// declare candidate before use to avoid undeclared identifier errors
float candidate = na
if trailType == "ATR"
candidate := close - atr * trailATRmult
else
candidate := close - ta.ema(close, trailEMAlen)
// move trail stop up but never below initial SL
activeLongTrail := math.max(nz(activeLongTrail, activeLongSL), candidate)
// ensure trail never goes below initial SL if SL exists
if useSL and not na(activeLongSL)
activeLongTrail := math.max(activeLongTrail, activeLongSL)
// update SL to trailing
activeLongSL := activeLongTrail
if not na(activeShortEntry) and useTrailing
currProfitPtsS = activeShortEntry - close
if currProfitPtsS >= trailLockInPts
// declare candidateS before use
float candidateS = na
if trailType == "ATR"
candidateS := close + atr * trailATRmult
else
candidateS := close + ta.ema(close, trailEMAlen)
activeShortTrail := math.min(nz(activeShortTrail, activeShortSL), candidateS)
if useSL and not na(activeShortSL)
activeShortTrail := math.min(activeShortTrail, activeShortSL)
activeShortSL := activeShortTrail
// Detect TP/SL hits (for plotting & alerts)
longTPHit = not na(activeLongTP) and close >= activeLongTP
longSLHit = not na(activeLongSL) and close <= activeLongSL
shortTPHit = not na(activeShortTP) and close <= activeShortTP
shortSLHit = not na(activeShortSL) and close >= activeShortSL
if longTPHit or longSLHit
// reset long state after hit
activeLongEntry := na
activeLongSL := na
activeLongTP := na
activeLongTrail := na
if shortTPHit or shortSLHit
activeShortEntry := na
activeShortSL := na
activeShortTP := na
activeShortTrail := na
// Plot EMAs
p_ema9 = plot(ema9, title="EMA9", linewidth=1)
plot(ema21, title="EMA21", linewidth=1)
plot(ema50, title="EMA50", linewidth=2)
// Plot VWAP
plot(vwapVal, title="VWAP", linewidth=2, style=plot.style_line)
// Plot Ichimoku lines (Tenkan & Kijun)
plot(tenkan, title="Tenkan", linewidth=1)
plot(kijun, title="Kijun", linewidth=1)
// Plot cloud (senkouA & senkouB shifted forward)
plot(senkouA, title="Senkou A", offset=displacement, transp=60)
plot(senkouB, title="Senkou B", offset=displacement, transp=60)
fill(plot(senkouA, offset=displacement), plot(senkouB, offset=displacement), color = senkouA > senkouB ? color.new(color.green, 80) : color.new(color.red, 80))
// Plot active trade lines
plotshape(not na(activeLongEntry), title="Active Long", location=location.belowbar, color=color.new(color.green, 0), style=shape.circle, size=size.tiny)
plotshape(not na(activeShortEntry), title="Active Short", location=location.abovebar, color=color.new(color.red, 0), style=shape.circle, size=size.tiny)
plot(activeLongSL, title="Long SL", color=color.red, linewidth=2)
plot(activeLongTP, title="Long TP", color=color.green, linewidth=2)
plot(activeShortSL, title="Short SL", color=color.red, linewidth=2)
plot(activeShortTP, title="Short TP", color=color.green, linewidth=2)
// Arrows / labels
if showArrows
if longCondition
label.new(bar_index, low, "BUY", style=label.style_label_up, color=color.green, textcolor=color.white, size=size.small)
if shortCondition
label.new(bar_index, high, "SELL", style=label.style_label_down, color=color.red, textcolor=color.white, size=size.small)
// Alerts
// alertcondition must be declared in global scope so TradingView can create alerts from them
alertcondition(longCondition, "VWAP+EMA+Ichimoku+RSI — BUY (STRICT)", "BUY signal from VWAP+EMA+Ichimoku+RSI (STRICT)")
alertcondition(shortCondition, "VWAP+EMA+Ichimoku+RSI — SELL (STRICT)", "SELL signal from VWAP+EMA+Ichimoku+RSI (STRICT)")
// Runtime alerts (still use alert() to trigger immediate alerts; webhook is added in TradingView Alert dialog)
if alertOn
if longCondition
alert("VWAP+EMA+Ichimoku+RSI — BUY (STRICT)", alert.freq_once_per_bar_close)
if shortCondition
alert("VWAP+EMA+Ichimoku+RSI — SELL (STRICT)", alert.freq_once_per_bar_close)
// Alerts for TP/SL hits
if longTPHit
alert("LONG TP HIT", alert.freq_once_per_bar_close)
if longSLHit
alert("LONG SL HIT", alert.freq_once_per_bar_close)
if shortTPHit
alert("SHORT TP HIT", alert.freq_once_per_bar_close)
if shortSLHit
alert("SHORT SL HIT", alert.freq_once_per_bar_close)
// Info table
var table info = table.new(position.top_right, 1, 8)
if barstate.islast
table.cell(info, 0, 0, text = 'Trend: ' + (bullTrend ? 'Bull' : bearTrend ? 'Bear' : 'Neutral'))
table.cell(info, 0, 1, text = 'EMA9/21/50: ' + str.tostring(ema9, format.mintick) + ' / ' + str.tostring(ema21, format.mintick) + ' / ' + str.tostring(ema50, format.mintick))
table.cell(info, 0, 2, text = 'VWAP: ' + str.tostring(vwapVal, format.mintick))
table.cell(info, 0, 3, text = 'RSI: ' + str.tostring(rsi, format.mintick))
table.cell(info, 0, 4, text = 'Vol OK: ' + (volOk ? 'Yes' : 'No'))
table.cell(info, 0, 5, text = 'HTF: ' + htfTF + ' ' + (htf_bull ? 'Bull' : htf_bear ? 'Bear' : 'Neutral'))
table.cell(info, 0, 6, text = 'ActiveLong: ' + (not na(activeLongEntry) ? 'Yes' : 'No'))
table.cell(info, 0, 7, text = 'ActiveShort: ' + (not na(activeShortEntry) ? 'Yes' : 'No'))
// End of script

Smart MACD Crossover█ OVERVIEW
Smart MACD Crossover is an indicator designed for traders who trade based on MACD line crossovers. It significantly reduces the number of false crossover signals by adding a breakout-box confirmation mechanism. Price must close outside the box created at the moment of the MACD crossover for a signal to trigger. The script also includes optional scaled MACD lines on the price chart, candle coloring, multi-layer “fog” visualization, fully customizable entry signals, automatic Take Profit / Stop Loss levels and a real-time table.
█ CONCEPTS
Standard MACD crossovers frequently produce noise, especially in ranging markets. Smart MACD Crossover attempts to solve this issue: a horizontal box is drawn at the exact bar where the crossover occurs, and a trade signal is generated only when price actually breaks out of that box. By default, the show_only_matching filter is enabled — signals are shown only when the breakout direction matches the original MACD crossover direction (bullish box → long only, bearish box → short only).
█ FEATURES
Fully configurable classic MACD (default 12/26/9)
Optional MACD & Signal lines scaled and plotted directly on the price chart (show_macd_overlay)
Trend-based candle coloring
One-Side Histogram Fog:
- 6 layers above and 6 layers below hl2
- layer height based on average candle size × offset_mult (default 0.7)
- increasing transparency (base 80 + increment 4) for depth effect
- fully customizable colors
Breakout Boxes:
- created on every MACD crossover
- default height = high-low of the signal candle
- optional extension using average candle size × box_multiplier
- semi-transparent fill (85) with colored borders, extended right until breakout
Signals:
- Triangles or “BUY” / “SELL” labels
- show_only_matching filter (enabled by default) — only direction-consistent breakouts generate signals
- when disabled, every box breakout generates a signal according to breakout direction
- Built-in alerts: BUY and SELL
Take Profit / Stop Loss:
- TP1, TP2, TP3 and SL levels drawn automatically after each confirmed signal
- two modes: Candle Multiplier (based on average candle size) or Percentage
- all multipliers/percentages fully adjustable in “Risk Management Settings”
- real-time table in the top-right corner showing current TP/SL prices
█ HOW TO USE
Add via Pine Editor → paste code → Add to Chart.
Settings overview:
- MACD Settings: lengths and source
- Risk Management Settings: TP/SL mode, multipliers/percentages, average candle period
- MACD Overlay Lines: toggle scaled MACD lines on price chart
- Fog: enable/disable, adjust height and transparency
- Visual Settings: candle coloring
- Boxes: optional size multiplier (use_box_multiplier)
- Signals: choose Triangles or Labels, enable/disable direction filter
Signal meaning:
- Triangle below bar / “BUY” label → upward breakout from a box created after bullish MACD crossover
- Triangle above bar / “SELL” label → downward breakout from a box created after bearish MACD crossover
- Open boxes = pending breakout zones
- Fog below price = bullish pressure, fog above price = bearish pressure
█ APPLICATIONS
The indicator reduces false signals coming from plain MACD crossovers. For additional trend confirmation, the scaled MACD lines can be enabled.
Entry into a position is triggered by the BUY/SELL signal generated after the breakout. The TP1–TP3 and SL levels are drawn automatically only for convenience and as a quick reference – they are fully optional and traders can (and usually should) use their own preferred exit strategies, trailing stops, partial closes, or other money-management methods.
█ NOTES
- Due to MACD line scaling onto the price chart, classic MACD divergences cannot be identified

Bassi MACD Pro + ADX Filter + Smart Histogram TP + RSIA professional-grade MACD indicator that dramatically reduces false signals by combining four powerful filters:
Key Features
Classic MACD (12,26,9) with clean, high-visibility histogram coloring
ADX + DI filter – only takes trades when ADX > user-defined threshold (default 25) ensuring you trade only in strong trending markets
Smart Histogram Take-Profit logic – automatically detects the exact moment bullish/bearish momentum starts to weaken after a strong move and marks a precise TP level (one TP per trade – no repainting, no multiple signals)
Zero-line crossover confirmation + histogram direction filter – eliminates many whipsaw signals common in regular MACD
Separate RSI pane with overbought/oversold levels and visual markers (for additional confluence – does not interfere with main logic)
Visual Signals
Green “MACD BUY” label + lime triangle = confirmed long entry in strong trend
Red “MACD SELL” label + red triangle = confirmed short entry in strong trend
Small lime/red “TP” triangles = Smart Histogram Take-Profit triggered (perfect exit timing based on momentum fade)
Alert Conditions Included
MACD BUY
MACD SELL
TP Long Hit
TP Short Hit
Combined “Any Signal” alert
Why this version outperforms standard MACD
Most MACD crossovers fail in ranging markets. This script solves that by:
Requiring strong trend (ADX filter)
Confirming histogram is actually growing in the new direction
Waiting for the true zero-line cross with momentum
Giving you an intelligent, non-fixed % take-profit based on real histogram exhaustion
Excellent for swing trading, day trading, crypto, forex, and stocks on any timeframe (works especially well on 1H–4H–Daily).
Clean, fast, no repainting, fully alert-ready.
Add to chart → set your alerts → trade only the highest-probability MACD signals.

TMT Support & Resistance - Hitesh NimjeTMT Support & Resistance - HiteshNimje Indicator
Overview
The TMT Support & Resistance indicator is a professional pivot point analysis tool that automatically calculates and displays key support and resistance levels across multiple timeframe perspectives. It offers various pivot point calculation methods and provides customizable visual elements for comprehensive technical analysis.
Key Features
Pivot Point Calculation Methods
1. Traditional Pivot Points
Standard pivot point calculation using Previous Period High, Low, and Close
Creates P, S1, S2, S3, R1, R2, R3 levels
Most widely used method for day trading and swing trading
2. Fibonacci Pivot Points
Incorporates Fibonacci retracement levels (38.2%, 61.8%)
Uses traditional pivot as base with Fibonacci extensions
Popular among traders following Fibonacci analysis
3. Woodie Pivot Points
Alternative calculation method with different weighting
Emphasizes opening price in calculations
Preferred by some intraday traders
4. Classic Pivot Points
Similar to traditional but with different level calculations
Balanced approach to support/resistance identification
Timeframe Options
* Auto: Automatically selects optimal timeframe based on chart timeframe
Intraday ≤15min → Daily
Intraday >15min → Weekly
Daily → Monthly
* Fixed Timeframes: Daily, Weekly, Monthly, Quarterly, Yearly
* Extended Periods: Biyearly, Triyearly, Quinquennially, Decennially
Level Management System
Support Levels (Blue Colored)
* TMT Support 1 (S1): First major support level
* TMT Support 2 (S2): Second support level
* TMT Support 3 (S3): Third support level
* TMT Support 4 (S4): Fourth support level (Traditional/Camarilla only)
* TMT Support 5 (S5): Fifth support level (Traditional/Camarilla only)
Resistance Levels (Black Colored)
* TMT Resistance 1 (R1): First major resistance level
* TMT Resistance 2 (R2): Second resistance level
* TMT Resistance 3 (R3): Third resistance level
* TMT Resistance 4 (R4): Fourth resistance level (Traditional/Camarilla only)
* TMT Resistance 5 (R5): Fifth resistance level (Traditional/Camarilla only)
Central Pivot (Orange Colored)
* Pivot Point (P): Central price level used for S/R calculations
Customization Options
Display Settings
* Show Labels: Toggle pivot level identification labels
* Show Prices: Display actual price values next to levels
* Labels Position: Choose between Left or Right positioning
* Line Width: Adjustable thickness (1-100 pixels) for all pivot lines
Data Source Options
* Use Daily-based Values:
ON: Uses official daily OHLC values for calculations
OFF: Uses intraday data with extended hours consideration
* Number of Pivots Back: Historical pivot display (1-200 levels)
Color Customization
* Individual color selection for each support/resistance level
* Default colors: Supports (Blue), Resistances (Black), Pivot (Orange)
* Full color picker integration for all levels
Technical Features
Smart Display Logic
* Intraday Charts: Automatically uses daily-based calculations when intraday data is insufficient
* Multi-timeframe Compatibility: Adapts to chart timeframe and pivot timeframe differences
* Extended Hours Handling: Incorporates extended trading hours when enabled on chart
Dynamic Level Management
* Real-time Updates: Levels update as new data becomes available
* Historical Tracking: Maintains configurable number of historical pivot periods
* Automatic Cleanup: Removes old pivot graphics when limit is exceeded
Visual Elements
* Time-based Lines: Lines extend across full time periods for clear visual reference
* Price Labels: Contextual information showing level names and prices
* Professional Styling: Clean, professional appearance suitable for any trading style
Use Cases
Day Trading Applications
* Session Management: Use daily pivots for intraday trading decisions
* Range Trading: Camarilla levels excellent for range-bound strategies
* Breakout Confirmation: Use pivot breaks as entry/exit signals
Swing Trading Applications
* Weekly/Monthly Pivots: Identify key levels for multi-day positions
* Trend Analysis: Track how price interacts with higher timeframe pivots
* Risk Management: Set stop-losses and take-profits at pivot levels
Long-term Trading Applications
* Quarterly/Yearly Pivots: Major institutional levels for position trading
* Support/Resistance Maps: Create comprehensive price level roadmap
* Market Structure Analysis: Understand price behavior around key levels
Benefits for Traders
Professional Analysis
* Multiple Methodologies: Choose pivot calculation that matches trading style
* Timeframe Flexibility: Analyze from multiple temporal perspectives
* Historical Context: See how price has historically responded to pivot levels
Risk Management
* Level Identification: Clear visual reference for stop-loss placement
* Position Sizing: Use pivot distances for risk/reward calculations
* Entry Timing: Identify optimal entry points near support/resistance
Market Understanding
* Psychological Levels: Understand where market participants react
* Volume Confirmation: Cross-reference pivot levels with volume data
* Trend Continuation: Identify pivot levels that may continue or reverse trends
Technical Specifications
* Pine Script Version: 6
* Overlay: True (displays on price chart)
* Performance: Optimized for up to 200 historical pivot periods
* Compatibility: All trading instruments and timeframes
* Data Source: OHLC-based pivot calculations with security function integration
Trading Strategy Integration
1. Support/Resistance Trading: Enter trades at S1/R1 with stops beyond S2/R2
2. Pivot Bounce Strategy: Trade bounces from established pivot levels
3. Range Trading: Use Camarilla pivots for tight range strategies
4. Breakout Strategy: Enter breakouts with confirmation from pivot breaks
5. Multiple Timeframe Analysis: Combine daily, weekly, and monthly pivots for comprehensive analysis
This indicator serves as a comprehensive support and resistance analysis tool, providing traders with institutional-quality pivot point analysis across multiple calculation methods and timeframes. It combines professional-grade pivot point calculations with intuitive customization options, making it suitable for traders of all experience levels and trading styles.
TRADING DISCLAIMER
RISK WARNING
Trading involves substantial risk of loss and is not suitable for all investors. Past performance is not indicative of future results. You should carefully consider whether trading is suitable for you in light of your circumstances, knowledge, and financial resources.
NO FINANCIAL ADVICE
This indicator is provided for educational and informational purposes only. It does not constitute:
* Financial advice or investment recommendations
* Buy/sell signals or trading signals
* Professional investment advice
* Legal, tax, or accounting guidance
LIMITATIONS AND DISCLAIMERS
Technical Analysis Limitations
* Pivot points are mathematical calculations based on historical price data
* No guarantee of accuracy of price levels or calculations
* Markets can and do behave irrationally for extended periods
* Past performance does not guarantee future results
* Technical analysis should be used in conjunction with fundamental analysis
Data and Calculation Disclaimers
* Calculations are based on available price data at the time of calculation
* Data quality and availability may affect accuracy
* Pivot levels may differ when calculated on different timeframes
* Gaps and irregular market conditions may cause level failures
* Extended hours trading may affect intraday pivot calculations
Market Risks
* Extreme market volatility can invalidate all technical levels
* News events, economic announcements, and market manipulation can cause gaps
* Liquidity issues may prevent execution at calculated levels
* Currency fluctuations, inflation, and interest rate changes affect all levels
* Black swan events and market crashes cannot be predicted by technical analysis
USER RESPONSIBILITIES
Due Diligence
* You are solely responsible for your trading decisions
* Conduct your own research before using this indicator
* Verify calculations with multiple sources before trading
* Consider multiple timeframes and confirm levels with other technical tools
* Never rely solely on one indicator for trading decisions
Risk Management
* Always use proper risk management and position sizing
* Set appropriate stop-losses for all positions
* Never risk more than you can afford to lose
* Consider the inherent risks of leverage and margin trading
* Diversify your portfolio and trading strategies
Professional Consultation
* Consult with qualified financial advisors before trading
* Consider your tax obligations and legal requirements
* Understand the regulations in your jurisdiction
* Seek professional advice for complex trading strategies
LIMITATION OF LIABILITY
Indemnification
The creator and distributor of this indicator shall not be liable for:
* Any trading losses, whether direct or indirect
* Inaccurate or delayed price data
* System failures or technical malfunctions
* Loss of data or profits
* Interruption of service or connectivity issues
No Warranty
This indicator is provided "as is" without warranties of any kind:
* No guarantee of accuracy or completeness
* No warranty of uninterrupted or error-free operation
* No warranty of merchantability or fitness for a particular purpose
* The software may contain bugs or errors
Maximum Liability
In no event shall the liability exceed the purchase price (if any) paid for this indicator. This limitation applies regardless of the theory of liability, whether contract, tort, negligence, or otherwise.
REGULATORY COMPLIANCE
Jurisdiction-Specific Risks
* Regulations vary by country and region
* Some jurisdictions prohibit or restrict certain trading strategies
* Tax implications differ based on your location and trading frequency
* Commodity futures and options trading may have additional requirements
* Currency trading may be regulated differently than stock trading
Professional Trading
* If you are a professional trader, ensure compliance with all applicable regulations
* Adhere to fiduciary duties and best execution requirements
* Maintain required records and reporting
* Follow market abuse regulations and insider trading laws
TECHNICAL SPECIFICATIONS
Data Sources
* Calculations based on TradingView data feeds
* Data accuracy depends on broker and exchange reporting
* Historical data may be subject to adjustments and corrections
* Real-time data may have delays depending on data providers
Software Limitations
* Internet connectivity required for proper operation
* Software updates may change calculations or functionality
* TradingView platform dependencies may affect performance
* Third-party integrations may introduce additional risks
MONEY MANAGEMENT RECOMMENDATIONS
Conservative Approach
* Risk only 1-2% of capital per trade
* Use position sizing based on volatility
* Maintain adequate cash reserves
* Avoid over-leveraging accounts
Portfolio Management
* Diversify across multiple strategies
* Don't put all capital into one approach
* Regularly review and adjust trading strategies
* Maintain detailed trading records
FINAL LEGAL NOTICES
Acceptance of Terms
* By using this indicator, you acknowledge that you have read and understood this disclaimer
* You agree to assume all risks associated with trading
* You confirm that you are legally permitted to trade in your jurisdiction
Updates and Changes
* This disclaimer may be updated without notice
* Continued use constitutes acceptance of any changes
* It is your responsibility to stay informed of updates
Governing Law
* This disclaimer shall be governed by the laws of the jurisdiction where the indicator was created
* Any disputes shall be resolved in the appropriate courts
* Severability clause: If any part of this disclaimer is invalid, the remainder remains enforceable
REMEMBER: THERE ARE NO GUARANTEES IN TRADING. THE MAJORITY OF RETAIL TRADERS LOSE MONEY. TRADE AT YOUR OWN RISK.
Contact Information:
* Creator: Hitesh_Nimje
* Phone: Contact@8087192915
* Source: Thought Magic Trading
© HiteshNimje - All Rights Reserved
This disclaimer should be prominently displayed whenever the indicator is shared, sold, or distributed to ensure users are fully aware of the risks and limitations involved in trading.

TMT Sessions - Hitesh NimjeTMT Sessions - Hitesh Nimje Indicator
Overview
The TMT Sessions indicator is a comprehensive trading tool designed to visualize and analyze the four major global trading sessions. It provides session-based technical analysis including ranges, trends, averages, and statistical metrics for each trading session.
Key Features
Four Global Trading Sessions
1. Session A - New York (13:00-22:00 UTC)
Color: Blue (#0000FF)
Default timeframe: US/Eastern market hours
2. Session B - London (07:00-16:00 UTC)
Color: Black (#000000)
Default timeframe: European market hours
3. Session C - Tokyo (00:00-09:00 UTC)
Color: Red (#FF0000)
Default timeframe: Asian market hours
4. Session D - Sydney (21:00-06:00 UTC)
Color: Orange (#FFA500)
Default timeframe: Australian market hours
Technical Analysis Tools
Range Analysis:
* Visual range boxes showing session high/low boundaries
* Transparent background areas with configurable transparency
* Range outline borders
* Session labels with customizable text display
Trend Analysis:
* Linear regression trendlines for each session
* Statistical metrics including:
R-squared values for trend strength
Standard deviation calculations
Correlation measurements
Statistical Indicators:
* Session Averages: Simple Moving Averages (SMA) calculated within each session
* VWAP: Volume Weighted Average Price for session-based intraday analysis
* Max/Min Lines: Highest and lowest prices recorded during each session
Visual Elements
Session Dividers:
* Visual markers showing session start/end points
* Session identification symbols (NYE, LDN, TYO, SYD)
* Configurable divider display options
Dashboard Features:
* Basic Dashboard: Session status (Active/Inactive) with color-coded indicators
* Advanced Dashboard: Additional metrics including:
Session trend strength (R-squared values)
Volume data
Standard deviation statistics
* Multiple dashboard positions (Top Right, Bottom Right, Bottom Left)
* Configurable text sizes (Tiny, Small, Normal)
Customization Options
Timezone Management:
* UTC offset adjustment (+/- hours)
* Exchange timezone option for automatic adjustment
* Session time customization
Display Settings:
* Individual session enable/disable
* Color customization for each session
* Range area transparency control
* Line description display toggle
* Session text label configuration
Use Cases
1. Session-Based Trading: Identify optimal trading times for each global session
2. Range Trading: Use session ranges as support/resistance levels
3. Trend Analysis: Track session-specific trends and momentum
4. Statistical Analysis: Monitor session volatility and trend strength
5. Market Structure: Understand how price moves across different trading sessions
Technical Specifications
* Pine Script Version: 6
* Overlays: True (displays on price chart)
* Performance: Optimized for up to 500 bars back
* Multi-element Support: Handles up to 500 lines, boxes, and labels
* Data Source: Compatible with all trading instruments and timeframes
Benefits for Traders
1. Global Market Awareness: Visual representation of all major trading sessions
2. Session Analysis: Automated calculation of key session statistics
3. Trading Strategy Development: Session-based entry and exit signals
4. Risk Management: Session ranges for stop-loss and take-profit levels
5. Market Timing: Optimal trading session identification
This indicator is particularly valuable for forex traders, day traders, and anyone who needs to understand price behavior across different global market sessions. It combines multiple technical analysis concepts into a unified, session-focused trading tool.
TRADING DISCLAIMER
RISK WARNING
Trading involves substantial risk of loss and is not suitable for all investors. Past performance is not indicative of future results. You should carefully consider whether trading is suitable for you in light of your circumstances, knowledge, and financial resources.
NO FINANCIAL ADVICE
This indicator is provided for educational and informational purposes only. It does not constitute:
* Financial advice or investment recommendations
* Buy/sell signals or trading signals
* Professional investment advice
* Legal, tax, or accounting guidance
LIMITATIONS AND DISCLAIMERS
Technical Analysis Limitations
* Pivot points are mathematical calculations based on historical price data
* No guarantee of accuracy of price levels or calculations
* Markets can and do behave irrationally for extended periods
* Past performance does not guarantee future results
* Technical analysis should be used in conjunction with fundamental analysis
Data and Calculation Disclaimers
* Calculations are based on available price data at the time of calculation
* Data quality and availability may affect accuracy
* Pivot levels may differ when calculated on different timeframes
* Gaps and irregular market conditions may cause level failures
* Extended hours trading may affect intraday pivot calculations
Market Risks
* Extreme market volatility can invalidate all technical levels
* News events, economic announcements, and market manipulation can cause gaps
* Liquidity issues may prevent execution at calculated levels
* Currency fluctuations, inflation, and interest rate changes affect all levels
* Black swan events and market crashes cannot be predicted by technical analysis
USER RESPONSIBILITIES
Due Diligence
* You are solely responsible for your trading decisions
* Conduct your own research before using this indicator
* Verify calculations with multiple sources before trading
* Consider multiple timeframes and confirm levels with other technical tools
* Never rely solely on one indicator for trading decisions
Risk Management
* Always use proper risk management and position sizing
* Set appropriate stop-losses for all positions
* Never risk more than you can afford to lose
* Consider the inherent risks of leverage and margin trading
* Diversify your portfolio and trading strategies
Professional Consultation
* Consult with qualified financial advisors before trading
* Consider your tax obligations and legal requirements
* Understand the regulations in your jurisdiction
* Seek professional advice for complex trading strategies
LIMITATION OF LIABILITY
Indemnification
The creator and distributor of this indicator shall not be liable for:
* Any trading losses, whether direct or indirect
* Inaccurate or delayed price data
* System failures or technical malfunctions
* Loss of data or profits
* Interruption of service or connectivity issues
No Warranty
This indicator is provided "as is" without warranties of any kind:
* No guarantee of accuracy or completeness
* No warranty of uninterrupted or error-free operation
* No warranty of merchantability or fitness for a particular purpose
* The software may contain bugs or errors
Maximum Liability
In no event shall the liability exceed the purchase price (if any) paid for this indicator. This limitation applies regardless of the theory of liability, whether contract, tort, negligence, or otherwise.
REGULATORY COMPLIANCE
Jurisdiction-Specific Risks
* Regulations vary by country and region
* Some jurisdictions prohibit or restrict certain trading strategies
* Tax implications differ based on your location and trading frequency
* Commodity futures and options trading may have additional requirements
* Currency trading may be regulated differently than stock trading
Professional Trading
* If you are a professional trader, ensure compliance with all applicable regulations
* Adhere to fiduciary duties and best execution requirements
* Maintain required records and reporting
* Follow market abuse regulations and insider trading laws
TECHNICAL SPECIFICATIONS
Data Sources
* Calculations based on TradingView data feeds
* Data accuracy depends on broker and exchange reporting
* Historical data may be subject to adjustments and corrections
* Real-time data may have delays depending on data providers
Software Limitations
* Internet connectivity required for proper operation
* Software updates may change calculations or functionality
* TradingView platform dependencies may affect performance
* Third-party integrations may introduce additional risks
MONEY MANAGEMENT RECOMMENDATIONS
Conservative Approach
* Risk only 1-2% of capital per trade
* Use position sizing based on volatility
* Maintain adequate cash reserves
* Avoid over-leveraging accounts
Portfolio Management
* Diversify across multiple strategies
* Don't put all capital into one approach
* Regularly review and adjust trading strategies
* Maintain detailed trading records
FINAL LEGAL NOTICES
Acceptance of Terms
* By using this indicator, you acknowledge that you have read and understood this disclaimer
* You agree to assume all risks associated with trading
* You confirm that you are legally permitted to trade in your jurisdiction
Updates and Changes
* This disclaimer may be updated without notice
* Continued use constitutes acceptance of any changes
* It is your responsibility to stay informed of updates
Governing Law
* This disclaimer shall be governed by the laws of the jurisdiction where the indicator was created
* Any disputes shall be resolved in the appropriate courts
* Severability clause: If any part of this disclaimer is invalid, the remainder remains enforceable
REMEMBER: THERE ARE NO GUARANTEES IN TRADING. THE MAJORITY OF RETAIL TRADERS LOSE MONEY. TRADE AT YOUR OWN RISK.
Contact Information:
* Creator: Hitesh_Nimje
* Phone: Contact@8087192915
* Source: Thought Magic Trading
© HiteshNimje - All Rights Reserved
This disclaimer should be prominently displayed whenever the indicator is shared, sold, or distributed to ensure users are fully aware of the risks and limitations involved in trading.

Daily Range Zones: PDH/PDL with SL/TPThis indicator automatically plots the previous day's High and Low levels and projects dynamic Stop Loss (SL) and Take Profit (TP) zones based on the daily range percentage.
It is designed for traders focusing on daily range breakouts or mean reversion strategies around the Previous Day High (PDH) and Previous Day Low (PDL).
Key Features:
Level 0 & 1: Visualizes the exact High and Low of the reference timeframe (Daily).
Inner Zone (Orange): Calculated inside the range. Acts as a buffer for Stop Loss placement or entry zones for mean reversion.
Outer Zone (Purple): Calculated outside the range (extension). Acts as a primary Take Profit target for breakout trades.
Settings:
Fully customizable percentages for inner and outer zones.
Option to toggle between current day or previous day data.
Works on any timeframe (intraday charts recommended).

Quantum Ribbon Lite📊 WHAT IS IT?
Quantum Ribbon Lite is a trend trading indicator built on a 5-layer exponential moving average ribbon system. It analyzes price momentum, volume, and ribbon alignment to generate entry signals with pre-calculated stop loss and take profit levels.
The indicator is designed for traders who want a straightforward approach to trend trading without managing complex configurations.
🔧 HOW IT WORKS
The Ribbon System
The indicator uses 5 pairs of EMAs (10 moving averages total) that create colored "clouds" on your chart:
Blue/Teal ribbons indicate bullish alignment
Red/Pink ribbons indicate bearish alignment
Mixed colors indicate neutral or transitional periods
The ribbon spacing automatically adjusts from a fast EMA (21) to a slow EMA (60), creating layers that show trend strength and direction.
Signal Generation
Signals appear when multiple conditions align:
For LONG signals:
Fast EMAs are above slow EMAs
Price momentum is positive and strong (> 0.5 ATR)
Volume is above average (> 1.1x average)
Ribbon confirms bullish state
Minimum confidence threshold met (filters weak setups)
For SHORT signals:
Fast EMAs are below slow EMAs
Price momentum is negative and strong
Volume is above average
Ribbon confirms bearish state
Minimum confidence threshold met
📈 VISUAL COMPONENTS
Entry Signals
Green "BUY" label = Long entry signal at candle close
Red "SELL" label = Short entry signal at candle close
Signals only trigger on confirmed candle closes (no repainting).
Risk Management Lines
Three lines appear when you have an active position:
White dotted line = Entry price
Red dotted line = Stop loss level
Green dotted line = Take profit target
Performance Dashboard
The stats table shows:
Current position status (In Long/Short or Waiting for signal)
Entry, stop, and target prices when in a trade
Win/loss record
Win rate percentage with color coding
⚙️ SETTINGS
1. Signal Sensitivity (1-10)
Controls the minimum time between signals (cooldown period):
1 = 2 bars between signals (most frequent)
5 = 10 bars between signals (balanced)
10 = 20 bars between signals (most selective)
Lower values generate more signals, higher values filter for better setups.
2. Stop Loss Distance
Determines how stops are calculated using ATR (Average True Range):
Tight = 1.5x ATR from entry
Normal = 2.0x ATR from entry
Wide = 2.5x ATR from entry
ATR adapts to market volatility, so stops are tighter in calm markets and wider in volatile markets.
3. Take Profit Target
Sets your risk-to-reward ratio:
1.5R = Target is 1.5 times your risk
2R = Target is 2 times your risk
3R = Target is 3 times your risk
Example: With a $100 stop distance and 2R setting, your take profit will be $200 away from entry.
4. Show Stats Table
Toggle to show/hide the performance dashboard in the top-right corner.
5. Show Risk Lines
Toggle to show/hide the entry/stop/target lines on the chart.
📋 HOW TO USE
Step 1: Apply to Chart
Add the indicator to your preferred instrument and timeframe (daily recommended).
Step 2: Wait for Signal
A BUY or SELL label will appear on the chart when conditions align.
Step 3: Enter Position
Enter at the close of the signal candle in the indicated direction.
Step 4: Set Risk Parameters Use the displayed lines:
Red line = Your stop loss
Green line = Your take profit
Step 5: Hold Position
Wait for the position to hit either the stop or target. No new signals will appear while you're in a position.
Step 6: Review Results
Check the stats table to track your win rate and adjust settings if needed.
🎯 RISK MANAGEMENT
Stop Loss Calculation
Stops are based on ATR (Average True Range) which measures recent price volatility:
In quiet markets: Stops are placed closer to entry
In volatile markets: Stops are placed further away
This adaptive approach helps prevent stop-hunting while maintaining appropriate risk levels.
Take Profit Calculation
Targets are calculated as a multiple of your stop distance:
If stop is 50 points away and you use 2R, target is 100 points away
Maintains consistent risk-reward ratios across all trades
Required Win Rates To break even after fees:
1.5R requires ~40% win rate
2R requires ~34% win rate
3R requires ~25% win rate
📊 RECOMMENDED USAGE
Timeframes:
Daily charts show strongest performance in testing
4H and 1H timeframes work but may have lower win rates
Lower timeframes generate more signals but reduced quality
Markets:
Works on all instruments: Stocks, Forex, Crypto, Futures, Indices
Best suited for trending markets
May generate false signals in tight ranges or choppy conditions

XRP Non-Stop Strategy (TP 25% / SL 15%)This strategy performs continuous automated trading exclusively on XRP. It opens long positions during favorable trend conditions, using a fixed Take Profit target of 25% above the entry price and a fixed Stop Loss of 15% below the entry. Once a trade is closed (either TP or SL), the strategy automatically re-enters on the next valid signal, enabling uninterrupted trading.
The script includes:
Dynamic Take Profit & Stop Loss lines
Optional EMA trend filter
Visual BUY and EXIT markers
TradingView alerts for automation or notifications
This strategy is built for traders who want a simple, price-action-driven system without fixed price levels, relying only on percentage-based movement from each entry.

Bifurcation Early WarningBifurcation Early Warning (BEW) — Chaos Theory Regime Detection
OVERVIEW
The Bifurcation Early Warning indicator applies principles from chaos theory and complex systems research to detect when markets are approaching critical transition points — moments where the current regime is likely to break down and shift to a new state.
Unlike momentum or trend indicators that tell you what is happening, BEW tells you when something is about to change. It provides early warning of regime shifts before they occur, giving traders time to prepare for increased volatility or trend reversals.
THE SCIENCE BEHIND IT
In complex systems (weather, ecosystems, financial markets), major transitions don't happen randomly. Research has identified three universal warning signals that precede critical transitions:
1. Critical Slowing Down
As a system approaches a tipping point, it becomes "sluggish" — small perturbations take longer to decay. In markets, this manifests as rising autocorrelation in returns.
2. Variance Amplification
Short-term volatility begins expanding relative to longer-term baselines as the system destabilizes.
3. Flickering
The system oscillates between two potential states before committing to one — visible as increased crossing of mean levels.
BEW combines all three signals into a single composite score.
COMPONENTS
AR(1) Coefficient — Critical Slowing Down (Blue)
Measures lag-1 autocorrelation of returns over a rolling window.
• Rising toward 1.0: Market becoming "sticky," slow to mean-revert — transition approaching
• Low values (<0.3): Normal mean-reverting behavior, stable regime
Variance Ratio (Purple)
Compares short-term variance to long-term variance.
• Above 1.5: Short-term volatility expanding — energy building before a move
• Near 1.0: Volatility stable, no unusual pressure
Flicker Count (Yellow/Teal)
Counts state changes (crossings of the dynamic mean) within the lookback period.
• High count: Market oscillating between states — indecision before commitment
• Low count: Price firmly in one regime
INTERPRETING THE BEW SCORE
0–50 (STABLE): Normal market conditions. Existing strategies should perform as expected.
50–70 (WARNING): Elevated instability detected. Consider reducing exposure or tightening risk parameters.
70–85 (DANGER): High probability of regime change. Avoid initiating new positions; widen stops on existing ones.
85+ (CRITICAL): Bifurcation likely imminent or in progress. Expect large, potentially unpredictable moves.
HOW TO USE
As a Regime Filter
• BEW < 50: Normal trading conditions — apply your standard strategies
• BEW > 60: Elevated caution — reduce position sizes, avoid mean-reversion plays
• BEW > 80: High alert — consider staying flat or hedging existing positions
As a Preparation Signal
BEW tells you when to pay attention, not which direction. When readings elevate:
• Watch for confirmation from volume, order flow, or other directional indicators
• Prepare for breakout scenarios in either direction
• Adjust take-profit and stop-loss distances for larger moves
For Volatility Adjustment
High BEW periods correlate with larger candles. Use this to:
• Widen stops during elevated readings
• Adjust position sizing inversely to BEW score
• Set more ambitious profit targets when entering during high-BEW breakouts
Divergence Analysis
• Price making new highs/lows while BEW stays low: Trend likely to continue smoothly
• Price consolidating while BEW rises: Breakout incoming — direction uncertain but move will be significant
SETTINGS GUIDE
Core Settings
• Lookback Period: General reference period (default: 50)
• Source: Price source for calculations (default: close)
Critical Slowing Down (AR1)
• AR(1) Calculation Period: Bars used for autocorrelation (default: 100). Higher = smoother, slower.
• AR(1) Warning Threshold: Level at which AR(1) is considered elevated (default: 0.85)
Variance Growth
• Variance Short Period: Fast variance window (default: 20)
• Variance Long Period: Slow variance window (default: 100)
• Variance Ratio Threshold: Level for maximum score contribution (default: 1.5)
Regime Flickering
• Flicker Detection Period: Window for counting state changes (default: 20)
• Flicker Bandwidth: ATR multiplier for state detection — lower = more sensitive (default: 0.5)
• Flicker Count Threshold: Number of crossings for maximum score (default: 4)
TIMEFRAME RECOMMENDATIONS
• 5m–15m: Use shorter periods (AR: 30–50, Var: 10/50). Expect more noise.
• 1H: Balanced performance with default or slightly extended settings (AR: 100, Var: 20/100).
• 4H–Daily: Extend periods further (AR: 100–150, Var: 30/150). Cleaner signals, less frequent.
ALERTS
Three alert conditions are included:
• BEW Warning: Score crosses above 50
• BEW Danger: Score crosses above 70
• BEW Critical: Score crosses above 85
LIMITATIONS
• No directional bias: BEW detects instability, not direction. Combine with trend or momentum indicators.
• Not a timing tool: Elevated readings may persist for several bars before the actual move.
• Parameter sensitive: Optimal settings vary by asset and timeframe. Backtest before live use.
• Leading indicator trade-off: Early warning means some false positives are inevitable.
CREDITS
Inspired by research on early warning signals in complex systems:
• Dakos et al. (2012) — "Methods for detecting early warnings of critical transitions"
DISCLAIMER
This indicator is for educational and informational purposes only. It does not constitute financial advice. Past performance is not indicative of future results. Always conduct your own analysis and risk management. Use at your own risk.

Long Only EMA Strategy (9/20 with 200 EMA Filter)Details:
This strategy is built around a very simple idea: follow the primary trend and enter only when momentum supports it.
It uses three EMAs on a standard candlestick chart:
1. 9‑period EMA – short‑term momentum
2. 20‑period EMA – medium‑term structure
3. 200‑period EMA – long‑term trend filter
The strategy is ** long‑only ** and is mainly designed for swing trading and positional trading.
It avoids counter‑trend trades by taking entries only when price is trading ** above the 200 EMA **, which is commonly used as a long‑term trend reference.
The rules are deliberately kept simple so that they are easy to understand, modify, and test on different markets and timeframes.
---
Key Features
1. **Trend‑Filtered Entries**
- Fresh long positions are considered only when:
- The 9 EMA crosses above the 20 EMA
- The closing price is **above** the 200 EMA
- This attempts to combine short‑term momentum with a higher‑timeframe trend filter.
2. **Clean Exit Logic**
- The long position is exited when the closing price crosses **below** the 20 EMA.
- This creates an objective, rule‑based way to trail the trade as long as the medium‑term structure remains intact.
3. **Long‑Only, No Short Selling**
- The script intentionally ignores short setups.
- This makes it suitable for markets or accounts where short selling is restricted, or for traders who prefer to participate only on the long side of the market.
4. **Simple Visuals**
- All three EMAs are plotted directly on the chart:
- 9 EMA (fast)
- 20 EMA (medium)
- 200 EMA (trend)
- Trade entries and exits are handled by TradingView’s strategy engine, so users can see results in the Strategy Tester as well as directly on the chart.
5. **Backtest‑Friendly Structure**
- Uses TradingView’s built‑in `strategy()` framework.
- Can be applied to different symbols, timeframes, and markets (equities, indices, crypto, etc.).
- Works on standard candlestick charts, which are supported by TradingView’s backtesting engine.
6. **Configurable in Code**
- The EMA periods are defined in the code and can be easily adjusted.
- Users can tailor the parameters to fit their own style (for example, faster EMAs for intraday trading, slower EMAs for positional trades).
---
How to Use
1. **Add the Strategy to Your Chart**
1. Open any symbol and select a **standard candlestick chart**.
2. Apply the strategy from your “My Scripts” section.
3. Make sure it is enabled so that the trades and results appear.
2. **Select Timeframe**
- The logic can be tested on various timeframes:
- Higher timeframes (1H, 4H, 1D) for swing and positional setups.
- Lower timeframes (5m, 15m) for more active trading, if desired.
- Users should experiment and see where the strategy behaves more consistently for their chosen market.
3. **Read the Signals**
- **Entry:**
- A long trade is opened when the 9 EMA crosses above the 20 EMA while the closing price is above the 200 EMA.
- **Exit:**
- The open long position is closed when the closing price crosses below the 20 EMA.
- All orders are generated automatically once the strategy is attached to the chart.
4. **Use the Strategy Tester**
- Go to the **Strategy Tester** tab in TradingView.
- Check:
- Net profit / drawdown
- Win rate and average trade
- List of trades and the equity curve
- Change the date range and timeframe to see how stable the results are over different periods.
5. **Adjust Parameters if Needed**
- Advanced users can open the code and experiment with:
- EMA lengths (for example 8/21 with 200, or 10/30 with 200)
- Risk sizing and capital settings within the `strategy()` call
- Any changes should be thoroughly re‑tested before considering real‑world application.
---
Practical Applications
1. **Swing Trading on Daily Charts**
- Can be applied to stocks, indices, or ETFs on the daily timeframe.
- The 200 EMA acts as a trend filter to stay aligned with the broad direction, while the 9/20 crossover helps catch medium‑term swings inside that trend.
2. **Positional Trades on Higher Timeframes**
- On 4H or 1D charts, this approach can help in holding trades for several days to weeks.
- The exit rule based on the 20 EMA crossing helps avoid emotional decisions and provides a rules‑based way to trail the trend.
3. **Trend‑Following Filter**
- Even if used purely as a filter, the 200 EMA condition can help traders:
- Avoid taking long trades when the market is in a clear downtrend.
- Focus only on instruments that are trading above their long‑term average.
4. **Educational Use**
- The script is intentionally kept straightforward so that newer users can:
- Learn how a moving average crossover strategy works.
- See how to combine a short‑term signal with a long‑term filter.
- Understand how TradingView’s strategy engine handles entries and exits.
5. **Basis for Further Development**
- This can serve as a starting point for more advanced systems.
- Traders can extend it by adding:
- Additional filters (RSI, volume, volatility filters, time‑of‑day filters, etc.)
- Risk management rules (fixed stop loss, take profit, trailing stops).
- The current version is kept minimal on purpose, so modifications are easy to implement and test.
---
Important Notes & Disclaimer
1. This strategy is provided **for testing, research, and educational purposes only**.
2. It is ** not ** a recommendation to buy or sell any financial instrument.
3. Past performance on historical data does not guarantee similar results in live markets.
4. Markets are risky and trading can lead to financial loss; users should always do their own research, manage risk appropriately, and consult a qualified financial professional if needed.
5. Before using any strategy with real capital, it is strongly advised to:
- Forward test it on a demo / paper trading account.
- Check how it behaves during different market phases (trending, sideways, high‑volatility conditions).
You are free to modify the parameters and logic to better align it with your own trading style and risk tolerance.

Trinity CCI Pro PlusWhat It Is
Trinity CCI Pro Plus is an innovative overlay indicator that reimagines the classic Commodity Channel Index (CCI) by plotting its levels directly on the price chart. No more separate oscillator panel—instead, you get dynamic price-based bands and lines for instant momentum insights.
What You See on the Chart
Orange line: The CCI zero line (20-period SMA of typical price, hlc3)—acts as the baseline.
Aqua line: Dynamic upper band at CCI = +100 (overbought threshold).
Purple line: Dynamic lower band at CCI = -100 (oversold threshold).
Optional thick purple line: The extra SMA of CCI (14-period smooth) scaled back to price—serves as a signal line for crossovers.
Optional outer zones: ±200 bands (aqua/purple extensions) for extreme momentum levels, often added as dotted or filled areas to spot blow-off tops/bottoms.
Key Differences from Regular CCI
Standard CCI lives in a lower pane with fixed horizontal lines at +100, 0, and -100, forcing you to split your focus. This version overlays everything on price: the bands curve with market volatility, the zero line becomes a moving average, and the extra SMA/signal line integrates seamlessly for price-action trading. Plus, it naturally supports outer ±200 zones without extra coding, making extremes visually pop.
How Traders Use It
Momentum breakouts: Buy when price closes above the +100 aqua band (or +200 for aggressive entries); sell below -100 purple (or -200).
Mean reversion: Fade touches on the bands—take profits if price rejects the +100/-100 levels, or watch for exhaustion at ±200.
Trend bias: Price above orange zero = bullish filter; below = bearish. Use the extra SMA for confirmation (e.g., price crossing above it signals upside).
Crossover signals: Price vs. the thick purple SMA line—bullish above, bearish below—pairs perfectly with band breaks.
Range trading: Treat ±100 bands as dynamic support/resistance; outer ±200 zones highlight potential breakout setups.
This setup shines in trending markets (e.g., stocks or forex on 1H/daily charts), turning CCI into a one-glance channel system. Start with the defaults, add the ±200 and extra SMA via simple code tweaks, and backtest for your style—it's versatile and reduces screen clutter dramatically.
More Info
The 20 period MA is the original and still the most common setting for CCI, and it is exactly what the creator of the CCI, Donald Lambert, published it in 1980 with these exact parameters:
Length: 20 periods
Constant: 0.015 (to make CCI fall between +100 and –100 about 70–80 % of the time)
Typical Price: hlc3 (or sometimes (high + low + close)/3)
Deviation measure: Mean Deviation (not standard deviation)
So the “Trinity CCI Pro Plus” you are using is 100 % faithful to Lambert’s original design when the length is set to 20.

Psychologische LevelPSYCHOLOGICAL LEVELS INDICATOR FOR FOREX
This professional indicator automatically visualizes all important psychological price levels on Forex charts. Psychological levels are price zones where traders frequently react, as humans tend to gravitate toward round numbers.
MAIN FEATURES:
Automatic Level Detection: The indicator calculates and draws all relevant psychological levels based on the current currency pair
Visual Zones: Each level is displayed with a solid center line and a colored zone
Forex-Optimized: Automatically accounts for JPY pairs (0.01 pip) and standard pairs (0.0001 pip)
Fully Customizable: Colors, zone width, and line thickness can be individually adjusted
LEVEL TYPES:
00/000 Levels (e.g., 1.1000, 1.1100, 1.2000)
The most important psychological barriers
Traders frequently place stop-loss and take-profit orders at these levels
Strong support and resistance zones
50 Levels (e.g., 1.1050, 1.1150, 1.2050)
Secondary psychological levels
Located exactly midway between 00-levels
Important intermediate zones for profit-taking
25/75 Levels (e.g., 1.1025, 1.1075, 1.2025)
Optional activation for more detailed analysis
Quartile levels for more precise zones
Useful for scalping and short-term strategies
CONFIGURATION OPTIONS:
Zone Width in Pips: Determines the width of the colored zone around the center line (Default: 5 pips)
Zone Color: Fill color of the psychological zones (adjustable transparency)
Line Color: Color of the solid center lines
Line Width: Thickness of the center lines (1-5 pixels)
Level Selection: Individual selection of which level types to display
TRADING APPLICATIONS:
✓ Identification of potential support and resistance zones
✓ Placement of stop-loss and take-profit orders
✓ Recognition of price rejection zones
✓ Support for breakout strategies
✓ Enhanced risk management
✓ Optimization of entry and exit points
SPECIAL FEATURES:
Levels extend across the entire chart (extend.both)
Automatic adjustment to all Forex pairs
Optimized performance through intelligent calculation
Clean design without cluttered chart display
Compatible with all timeframes
SUITABLE FOR:
This indicator is suitable for day traders, swing traders, scalpers, and long-term Forex investors who want to incorporate psychological price levels into their trading strategy.
