Bullish and Bearish Harami DetectorHere’s a description of the script I built for you, designed for a **TradingView public indicator**:
### **Custom Bullish and Bearish Harami Detector with Timeframe Selection**
This custom Pine Script detects **Bullish Harami** and **Bearish Harami** candlestick patterns on the selected timeframe, with configurable settings for how many prior candles to consider for pattern detection.
---
### **Features:**
1. **Timeframe Selection:**
- **Input Field for Timeframe**: The script allows users to choose the timeframe for detecting patterns. For instance, you can set it to 1 hour, 4 hours, or even daily candles, ensuring the detection works as per your chosen market view.
- This is controlled by the `input.timeframe` function, and the user is prompted to select the desired timeframe (e.g., "1h", "4h", "1d").
2. **Enable/Disable Pattern Detection:**
- The user has the flexibility to enable or disable the detection of **Bullish Harami** and **Bearish Harami** patterns.
- The two toggles `detectBullishHarami` and `detectBearishHarami` allow users to turn on/off the detection for each pattern type.
3. **Customizable Bearish Candle Count for Bullish Harami:**
- The user can define how many prior **bearish candles** should be present before a **Bullish Harami** can be detected.
- The input variable `bearishCandleCountBullish` lets you choose how many previous bearish candles to consider for detecting a **Bullish Harami** (for example, the last 3, 5, or 6 bearish candles).
4. **Customizable Bullish Candle Count for Bearish Harami:**
- Similar to the Bullish Harami, the script allows the user to define how many prior **bullish candles** should be present before a **Bearish Harami** pattern is detected.
- The input variable `bearishCandleCountBearish` lets you select how many previous bullish candles to check for **Bearish Harami**.
5. **Pattern Detection Logic:**
- **Bullish Harami**: Detected when a bearish candle (open > close) is followed by a smaller bullish candle (open < close) where the entire body of the second candle is contained within the body of the first candle.
- **Bearish Harami**: Detected when a bullish candle (open < close) is followed by a smaller bearish candle (open > close) where the entire body of the second candle is contained within the body of the first candle.
- Both patterns are subject to the user-defined conditions (number of previous bearish or bullish candles).
6. **Visual Indicators:**
- **Bullish Harami**: A green label is plotted **below the bar** to indicate a **Bullish Harami** pattern.
- **Bearish Harami**: A red label is plotted **above the bar** to indicate a **Bearish Harami** pattern.
- The labels are displayed using the `plotshape` function with custom colors and text.
7. **Additional Settings**:
- The script includes tooltips and descriptions for each input to make the settings clear for users, allowing even those unfamiliar with candlestick patterns to understand and use the indicator effectively.
---
### **How It Works:**
- The script first checks the specified timeframe and identifies the current and previous candlesticks.
- It then applies the user-defined conditions for detecting the **Bullish Harami** and **Bearish Harami** patterns by checking the relative positions and sizes of the candlesticks over the selected number of previous candles.
- Once a pattern is detected, it plots a label on the chart (green for **Bullish Harami** and red for **Bearish Harami**) at the appropriate location (below or above the candle).
- The script updates dynamically as the price action unfolds.
---
### **Use Cases:**
- **Traders**: This script is useful for traders who want to identify reversal patterns like **Bullish Harami** and **Bearish Harami** on their chosen timeframes and adjust the sensitivity by changing the number of prior candles for pattern detection.
- **Customization**: Users can fine-tune the script’s settings based on their specific trading strategy, adjusting both the timeframe and the number of candles for pattern detection.
---
### **Conclusion:**
This indicator is an effective tool for detecting candlestick patterns, specifically **Bullish Harami** and **Bearish Harami**, on **TradingView**. By allowing customization in terms of timeframe and the number of prior candles to consider, users can tailor the script to fit their trading strategy and market conditions.
Search in scripts for "text"

Session High/Low Average & Range [1CG]The Session High/Low Average & Range indicator independently measures the average price movement from the opening price in each direction. It also displays the maximum high and low distance, called Range. Separating the averages and range into highs and lows helps analyze the volatility of the market as well as the direction.
USE EXAMPLES
Session Open
Session Close
Customization
Minimal - 1x and 2x Averages are replaced with custom lines, in order to show distance to3x.
Calculations
Average High: (high price of session - session opening price) / (session period)
Average Low: (session opening price - low price of session) / (session period)
Range High: The highest price of the last (session period)
Range Low: The lowest price of the last (session period)
INPUTS
Session
Here you can choose the hours for your session and time zone. The default is London session in New York time. Next, the session period determines how many sessions to sample from for the average and range lines, the default is 20. Lastly, you can choose the number of sessions to appear on the chart not including the current session if you are in one, 5 by default.
Lines
All of the lines allow you to change the color, width, and style. They also have a label option to choose to display the price. The bottom of the section allows you to change the location and size of the label text.
**Open Line** -Displays the opening price for the length of the session.
**Average Lines** - Displays the 1x, 2x, and 3x the average distance from open in each direction. Additionally, you can toggle a background color to highlight the area.
**Custom Lines** - Displays a customizable multiple of either the average or range. By default the first custom line displays the Range at a 1x multiplier and the second line displays an Average at a 1.5x multiplier
Display Distance
Here you can choose to display the distance from the lines to the open. This data is marked with a “Δ”. For the three Average lines this will display in the area between the line and the open in the position and size of your choice. The custom lines will have the distance information displayed on the line itself. This helps keep the data organized.

Top-Down Analysis previous day Top-Down Analysis 2nd Candle with Enhanced Features
This powerful TradingView script is designed for traders looking for a comprehensive and customizable top-down analysis tool. The indicator plots horizontal lines based on significant price levels from multiple timeframes (Daily, 4-Hour, 1-Hour, and Weekly), offering clear reference points for technical analysis. Each timeframe is associated with high and low levels from the previous candle, and these levels are represented with customizable line styles, colors, and widths.
Key Features:
Multi-Timeframe Support: Displays high and low levels from the previous candle for the Daily, 4-Hour, 1-Hour, and Weekly timeframes. Customize which timeframes to show.
Customizable Line Appearance: Choose the line color, style (solid, dotted, dashed), and width for each timeframe. This allows for a personalized chart appearance to suit your trading strategy.
Text Labels: Add custom text labels to each line, and move them dynamically to the right, keeping them visible as the candles progress. The labels can be customized with user-defined text for each timeframe’s high and low levels.
Toggle Line Visibility: Easily control the visibility of the horizontal lines and their labels for each timeframe, allowing you to focus on the levels that matter most.
Price Alerts: Set price alerts when the price crosses any of the plotted levels, including the Daily, 4-Hour, 1-Hour, and Weekly levels. Receive notifications when significant price interactions occur.
User Control: With inputs for changing timeframes, colors, labels, and more, this indicator is fully customizable to fit your trading style.
This indicator is ideal for day traders, swing traders, and anyone utilizing multi-timeframe analysis for more informed decision-making.

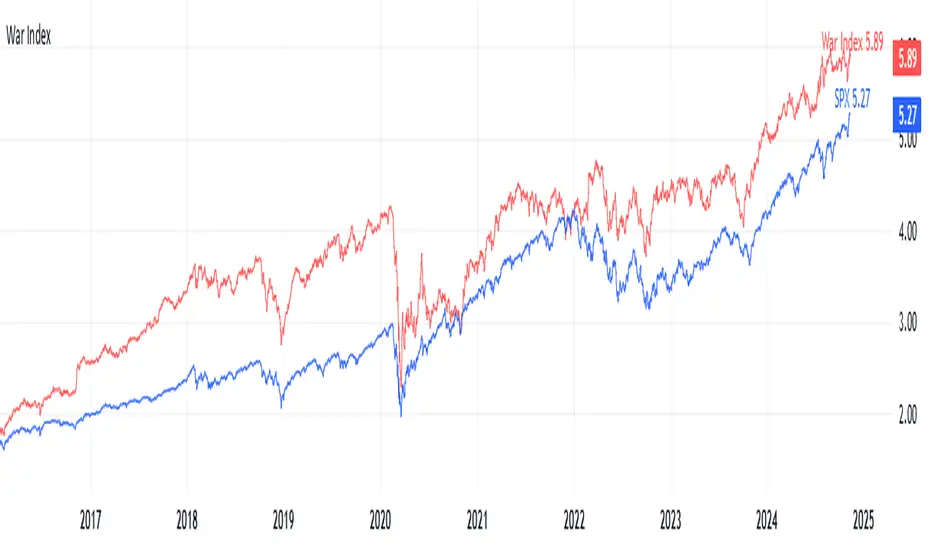
War IndexIntroduction
Welcome to the War Index! This project aims to provide traders, investors, and analysts with a specialized financial indicator that tracks the performance of key defense and aerospace companies. By aggregating the percentage changes of selected stocks, the War Index offers insights into the defense sector's dynamics and its relationship with the broader market.
What is the War Index?
The War Index is a custom financial indicator designed to approximate the collective performance of major defense and aerospace companies. It aggregates the daily percentage changes of selected stocks within the defense sector to provide a singular metric that reflects the overall health and trends of this industry. Additionally, the index is compared against the S&P 500 (SPX) to contextualize its performance relative to the broader market.
Index Components
The War Index comprises the following 16 stocks, each representing a significant player in the defense and aerospace industries:
Lockheed Martin Corporation ( NYSE:LMT )
Northrop Grumman Corporation ( NYSE:NOC )
Boeing Company ( NYSE:BA )
Raytheon Technologies Corporation ( NYSE:RTX )
General Dynamics Corporation ( NYSE:GD )
BAE Systems plc ( OTC:BAESY )
L3Harris Technologies, Inc. ( NYSE:LHX )
Textron Inc. ( NYSE:TXT )
Huntington Ingalls Industries, Inc. ( NYSE:HII )
Oshkosh Corporation ( NYSE:OSK )
Leidos Holdings, Inc. ( NYSE:LDOS )
Kratos Defense & Security Solutions, Inc. ( NASDAQ:KTOS )
Spirit AeroSystems Holdings, Inc. ( NYSE:SPR )
Parsons Corporation ( NYSE:PSN )
CACI International Inc ( NYSE:CACI )
ViaSat, Inc. ( NASDAQ:VSAT )
Purpose of the War Index
The War Index serves several key purposes:
Sector Performance Tracking : By aggregating the performance of major defense and aerospace companies, the index provides a clear picture of the sector's overall health.
Investment Analysis : Investors can use the index to identify trends, evaluate sector strength, and make informed decisions regarding their portfolios.
Comparative Benchmarking : Comparing the War Index with broader market indices like the S&P 500 helps in understanding how the defense sector performs relative to the general market.
Disclaimer: This War Index is an approximated indicator intended for informational purposes only. It should not be construed as investment advice. Always conduct your own research or consult with a financial advisor before making investment decisions.
ToStringMx█ OVERVIEW
Contains methods for conversion of matrices to string.
Supports matrices of int/float/bool/string/color/line/label/box/.
- toStringMx(matrix) - converts matrix to a string matrix converting each of its elements to string
- toS(matrix) - converts matrix to a string matrix (using toStringMx()) and outputs as string using str.tostring(matrix)
Conversion of each item to string is made using toS() function from moebius1977/ToS/1 library.
█ GENERAL DESCRIPTION OF FUNCTIONS
All toStringMx(matrix) and toS(matrix) methods have same parameters. The only difference will be in format parameter as explained below.
Parameters:
this (matrix) Matrix to be converted to a string matrix.
format (string) Format string.
nz (string) Placeholder for na items.
format parameter depends on the type:
For matrix format parameter works in the same way as `str.format()` (i.e. you can use same format strings as with `str.format()` with `{0}` as a placeholder for the value) with some shorthand "format" options available:
--- number ---
- "" => "{0}"
- "number" => "{0}"
- "0" => "{0, number, 0 }"
- "0.0" => "{0, number, 0.0 }"
- "0.00" => "{0, number, 0.00 }"
- "0.000" => "{0, number, 0.000 }"
- "0.0000" => "{0, number, 0.0000 }"
- "0.00000" => "{0, number, 0.00000 }"
- "0.000000" => "{0, number, 0.000000 }"
- "0.0000000" => "{0, number, 0.0000000}"
--- date ---
- "date" => "{0, date, dd.MM.YY}"
- "date : time" => "{0, date, dd.MM.YY} : {0, time, HH.mm.ss}"
- "dd.MM" => "{0, date, dd:MM}"
- "dd" => "{0, date, dd}"
- "... ... " in any place is substituted with "{0, date, dd.MM.YY}"
--- time ---
- "time" => "{0, time, HH:mm:ss}"
- "HH:mm" => "{0, time, HH:mm}"
- "mm:ss" => "{0, time, mm:ss}"
- "date time" => "{0, date, dd.MM.YY\} {0, time, HH.mm.ss}"
- "date, time" => "{0, date, dd.MM.YY\}, {0, time, HH.mm.ss}"
- "date,time" => "{0, date, dd.MM.YY\},{0, time, HH.mm.ss}"
- "date\ntime" => "{0, date, dd.MM.YY\}\n{0, time, HH.mm.ss}"
- "... ... " in any place is substituted with "{0, time, HH.mm.ss}"
For matrix :
format (string) : (string) (Optional) Use `x1` as placeholder for `x1` and so on. E.g. default format is `"(x1, y1) - (x2, y2)"`.
For matrix :
format (string) : (string) (Optional) Use `x1` as placeholder for `x`, `y1 - for `y` and `txt` for label's text. E.g. default format is `(x1, y1): "txt"` if ptint_text is true and `(x1, y1)` if false.
For matrix :
format (string) : (string) (Optional) Use `x1` as placeholder for `x`, `y1 - for `y` etc. E.g. default format is "(x1, y1) - (x2, y2)".
For matrix :
format (string) : (string) (Optional) Options are "HEX" (e.g. "#FFFFFF33") or "RGB" (e.g. "rgb(122,122,122,23)"). Default is "HEX".
█ FULL LIST OF FUNCTIONS AND PARAMETERS
method toStringMx(mx, format, nz)
Returns a string matrix made of original matrix items converted to string with toS().
Namespace types: matrix
Parameters:
mx (matrix)
format (string) : (string) Like in str.format()
nz (string) : (string) If val is na and nz is not na the value of nz param is returned instead.
method toStringMx(mx, format, nz)
Returns a string matrix made of original matrix items converted to string with toS().
Namespace types: matrix
Parameters:
mx (matrix)
format (string) : (string) Like in str.format() with some shorthand options:
```
--- number ---
- "" => "{0}"
- "number" => "{0}"
- "0" => "{0, number, 0 }"
- "0.0" => "{0, number, 0.0 }"
- "0.00" => "{0, number, 0.00 }"
- "0.000" => "{0, number, 0.000 }"
- "0.0000" => "{0, number, 0.0000 }"
- "0.00000" => "{0, number, 0.00000 }"
- "0.000000" => "{0, number, 0.000000 }"
- "0.0000000" => "{0, number, 0.0000000}"
--- date ---
- "date" => "{0, date, dd.MM.YY}"
- "date : time" => "{0, date, dd.MM.YY} : {0, time, HH.mm.ss}"
- "dd.MM" => "{0, date, dd:MM}"
- "dd" => "{0, date, dd}"
- "... ... " in any place is substituted with "{0, date, dd.MM.YY}"
--- time ---
- "time" => "{0, time, HH:mm:ss}"
- "HH:mm" => "{0, time, HH:mm}"
- "mm:ss" => "{0, time, mm:ss}"
- "date time" => "{0, date, dd.MM.YY\} {0, time, HH.mm.ss}"
- "date, time" => "{0, date, dd.MM.YY\}, {0, time, HH.mm.ss}"
- "date,time" => "{0, date, dd.MM.YY\},{0, time, HH.mm.ss}"
- "date\ntime" => "{0, date, dd.MM.YY\}\n{0, time, HH.mm.ss}"
- "... ... " in any place is substituted with "{0, time, HH.mm.ss}"
nz (string) : (string) If val is na and nz is not na the value of nz param is returned instead.
method toStringMx(mx, format, nz)
Returns a string matrix made of original matrix items converted to string with toS().
Namespace types: matrix
Parameters:
mx (matrix)
format (string) : (string) Like in str.format()
nz (string) : (string) If val is na and nz is not na the value of nz param is returned instead.
method toStringMx(mx, format, nz)
Returns a string matrix made of original matrix items converted to string with toS().
Namespace types: matrix
Parameters:
mx (matrix)
format (string) : (string) "HEX" (default) or "RGB"
nz (string) : (string) If val is na and nz is not na the value of nz param is returned instead.
method toStringMx(mx, format, nz)
Returns a string matrix made of original matrix items converted to string with toS().
Namespace types: matrix
Parameters:
mx (matrix)
format (string) : (string) (Optional) Format string. By default "{0}: {1}" if showIDs = true or "{1}" otherwise. (use "{0}" as a placeholder for id and "{1}" for item value)
nz (string) : (string) If val is na and nz is not na the value of nz param is returned instead.
method toS(this, format, nz)
Converts each element of the matrix to string outputs using str.tostring(matrix)
Namespace types: matrix
Parameters:
this (matrix) : (matrix) Matrix to be converted to string
format (string) : (string) Format string as in str.format()
nz (string) : (string) If val is na and nz is not na the value of nz param is returned instead.export method toS(matrix this, string format = "", string nz = na) => str.tostring(this.toStringMx(format, nz))
method toS(this, format, nz)
Converts each element of the matrix to string outputs using str.tostring(matrix)
Namespace types: matrix
Parameters:
this (matrix) : (matrix) Matrix to be converted to string
format (string) : (string) Like in str.format() with some shorthand options:
```
--- number ---
- "" => "{0}"
- "number" => "{0}"
- "0" => "{0, number, 0 }"
- "0.0" => "{0, number, 0.0 }"
- "0.00" => "{0, number, 0.00 }"
- "0.000" => "{0, number, 0.000 }"
- "0.0000" => "{0, number, 0.0000 }"
- "0.00000" => "{0, number, 0.00000 }"
- "0.000000" => "{0, number, 0.000000 }"
- "0.0000000" => "{0, number, 0.0000000}"
--- date ---
- "date" => "{0, date, dd.MM.YY}"
- "date : time" => "{0, date, dd.MM.YY} : {0, time, HH.mm.ss}"
- "dd.MM" => "{0, date, dd:MM}"
- "dd" => "{0, date, dd}"
- "... ... " in any place is substituted with "{0, date, dd.MM.YY}"
--- time ---
- "time" => "{0, time, HH:mm:ss}"
- "HH:mm" => "{0, time, HH:mm}"
- "mm:ss" => "{0, time, mm:ss}"
- "date time" => "{0, date, dd.MM.YY\} {0, time, HH.mm.ss}"
- "date, time" => "{0, date, dd.MM.YY\}, {0, time, HH.mm.ss}"
- "date,time" => "{0, date, dd.MM.YY\},{0, time, HH.mm.ss}"
- "date\ntime" => "{0, date, dd.MM.YY\}\n{0, time, HH.mm.ss}"
- "... ... " in any place is substituted with "{0, time, HH.mm.ss}"
nz (string) : (string) If val is na and nz is not na the value of nz param is returned instead.export method toS(matrix this, string format = "", string nz = na) => str.tostring(this.toStringMx(format, nz))
method toS(this, format, nz)
Converts each element of the matrix to string outputs using str.tostring(matrix)
Namespace types: matrix
Parameters:
this (matrix) : (matrix) Matrix to be converted to string
format (string) : (string) Format string as in str.format()
nz (string) : (string) If val is na and nz is not na the value of nz param is returned instead.export method toS(matrix this, string format = "", string nz = na) => str.tostring(this.toStringMx(format, nz))
method toS(this, format, nz)
Converts each element of the matrix to string outputs using str.tostring(matrix)
Namespace types: matrix
Parameters:
this (matrix) : (matrix) Matrix to be converted to string
format (string) : (string) "HEX" (default) or "RGB"
nz (string) : (string) If val is na and nz is not na the value of nz param is returned instead.export method toS(matrix this, string format = "", string nz = na) => str.tostring(this.toStringMx(format, nz))
method toS(this, format, nz)
Converts each element of the matrix to string outputs using str.tostring(matrix)
Namespace types: matrix
Parameters:
this (matrix) : (matrix) Matrix to be converted to string
format (string) : (string) (Optional) Format string. By default "{0}: {1}" if showIDs = true or "{1}" otherwise. (use "{0}" as a placeholder for id and "{1}" for item value)
nz (string) : (string) If val is na and nz is not na the value of nz param is returned instead.export method toS(matrix this, string format = "", string nz = na) => str.tostring(this.toStringMx(format, nz))
ToStringAr█ OVERVIEW
Contains to string conversion methods arrays of int/float/bool/string/line/label/box types
- toS() - method works like array.join() with more flexibility and
- toStringAr() - converts array to string on a per item basis and returns the resulting string array
Conversion of each item to string is made using toS() function from moebius1977/ToS/1 library.
█ GENERAL DESCRIPTION OF LIBRARY FUNCTIONS
All toS(array) methods have same parameters. The only difference will be in format parameter as explained below.
method toS(this, index_from, index_to, separator, showIDs, format, truncate_left, size_limit, nz)
Like array.join() but with string length limit. Joins elements into readable string (length capped at 4000, truncating the end or beg)
Parameters:
this (array) : array to be converted to string
index_from (int) : index_from (int) (Optional) Start from this id (starting from 0, in insertion order). If omitted - start from the first item.
index_to (int) : index_to (int) (Optional) End with this pair (inclusive, in insertion order). If omitted - to last item.
separator (string) : separator (string) (Optional) String to be inserted between pairs. Default: `", "`
showIDs (bool) : showIDs (bool) (Optional) If true item's id is added in the form `id: value`.
format (string) : format (string) (Optional) Format string fo toS(). If omitted default format is used depending in the type.
truncate_left (bool) : truncate_left (bool) (Optional) Truncate from left or right. Default: false.
size_limit (int) : size_limit (int) (Optional) Max output string length. Default: 4000.
nz (string) : nz (string) (Optional) A string used to represent na (na values are substituted with this string).
format parameter depends on the type:
For toS(bool/int/float ...) format parameter works in the same way as `str.format()` (i.e. you can use same format strings as with `str.format()` with `{0}` as a placeholder for the value) with some shorthand "format" options available:
--- number ---
- "" => "{0}"
- "number" => "{0}"
- "0" => "{0, number, 0 }"
- "0.0" => "{0, number, 0.0 }"
- "0.00" => "{0, number, 0.00 }"
- "0.000" => "{0, number, 0.000 }"
- "0.0000" => "{0, number, 0.0000 }"
- "0.00000" => "{0, number, 0.00000 }"
- "0.000000" => "{0, number, 0.000000 }"
- "0.0000000" => "{0, number, 0.0000000}"
--- date ---
- "... ... " in any place is substituted with "{0, date, dd.MM.YY}" (e.g. " " results in "{0, date, dd.MM.YY\} {0, time, HH.mm.ss}")
- "date" => "{0, date, dd.MM.YY}"
- "date : time" => "{0, date, dd.MM.YY} : {0, time, HH.mm.ss}"
- "dd.MM" => "{0, date, dd:MM}"
- "dd" => "{0, date, dd}"
--- time ---
- "... ... " in any place is substituted with "{0, time, HH.mm.ss}" (e.g. " " results in "{0, date, dd.MM.YY\} {0, time, HH.mm.ss}")
- "time" => "{0, time, HH:mm:ss}"
- "HH:mm" => "{0, time, HH:mm}"
- "mm:ss" => "{0, time, mm:ss}"
- "date time" => "{0, date, dd.MM.YY\} {0, time, HH.mm.ss}"
- "date, time" => "{0, date, dd.MM.YY\}, {0, time, HH.mm.ss}"
- "date,time" => "{0, date, dd.MM.YY\},{0, time, HH.mm.ss}"
- "date\ntime" => "{0, date, dd.MM.YY\}\n{0, time, HH.mm.ss}"
For toS(line ...):
format (string) : (string) (Optional) Use `x1` as placeholder for `x1` and so on. E.g. default format is `"(x1, y1) - (x2, y2)"`.
For toS(label ...) :
format (string) : (string) (Optional) Use `x1` as placeholder for `x`, `y1 - for `y` and `txt` for label's text. E.g. default format is `(x1, y1): "txt"` if ptint_text is true and `(x1, y1)` if false.
For toS(box ... ) :
format (string) : (string) (Optional) Use `x1` as placeholder for `x`, `y1 - for `y` etc. E.g. default format is "(x1, y1) - (x2, y2)".
For toS(color] ... ) :
format (string) : (string) (Optional) Options are "HEX" (e.g. "#FFFFFF33") or "RGB" (e.g. "rgb(122,122,122,23)"). Default is "HEX".
All toStringAr() methods just convert each item to string using toS with same format options as described above.
Parameters:
arr (array) : Array to be converted to a string array.
format (string) : Format string.
nz (string) : Placeholder for na items.
█ FULL OF FUNCTIONS AND PARAMETERS
Library "ToStringAr"
Contains toString/toS conversion methods for int/float/bool/string/line/label/box and arrays and matrices thereof. Also contains a string wraping function.
method toS(this, index_from, index_to, separator, showIDs, format, truncate_left, size_limit, nz)
Namespace types: array
Parameters:
this (array)
index_from (int)
index_to (int)
separator (string)
showIDs (bool)
format (string)
truncate_left (bool)
size_limit (int)
nz (string)
method toS(this, index_from, index_to, separator, showIDs, format, truncate_left, size_limit, nz)
Namespace types: array
Parameters:
this (array)
index_from (int)
index_to (int)
separator (string)
showIDs (bool)
format (string)
truncate_left (bool)
size_limit (int)
nz (string)
method toS(this, index_from, index_to, separator, showIDs, format, truncate_left, size_limit, nz)
Namespace types: array
Parameters:
this (array)
index_from (int)
index_to (int)
separator (string)
showIDs (bool)
format (string)
truncate_left (bool)
size_limit (int)
nz (string)
method toS(this, index_from, index_to, separator, showIDs, format, truncate_left, size_limit, nz)
Namespace types: array
Parameters:
this (array)
index_from (int)
index_to (int)
separator (string)
showIDs (bool)
format (string)
truncate_left (bool)
size_limit (int)
nz (string)
method toS(this, index_from, index_to, separator, showIDs, format, truncate_left, size_limit, nz)
Namespace types: array
Parameters:
this (array)
index_from (int)
index_to (int)
separator (string)
showIDs (bool)
format (string)
truncate_left (bool)
size_limit (int)
nz (string)
method toS(this, index_from, index_to, separator, showIDs, format, truncate_left, size_limit, nz)
Namespace types: array
Parameters:
this (array)
index_from (int)
index_to (int)
separator (string)
showIDs (bool)
format (string)
truncate_left (bool)
size_limit (int)
nz (string)
method toS(this, index_from, index_to, separator, showIDs, format, truncate_left, size_limit, nz)
Namespace types: array
Parameters:
this (array)
index_from (int)
index_to (int)
separator (string)
showIDs (bool)
format (string)
truncate_left (bool)
size_limit (int)
nz (string)
method toS(this, index_from, index_to, separator, showIDs, format, truncate_left, size_limit, nz)
Namespace types: array
Parameters:
this (array)
index_from (int)
index_to (int)
separator (string)
showIDs (bool)
format (string)
truncate_left (bool)
size_limit (int)
nz (string)
method toStringAr(arr, format, nz)
Namespace types: array
Parameters:
arr (array)
format (string)
nz (string)
method toStringAr(arr, format, nz)
Namespace types: array
Parameters:
arr (array)
format (string)
nz (string)
method toStringAr(arr, format, nz)
Namespace types: array
Parameters:
arr (array)
format (string)
nz (string)
method toStringAr(arr, format, nz)
Namespace types: array
Parameters:
arr (array)
format (string)
nz (string)
method toStringAr(arr, format, nz)
Namespace types: array
Parameters:
arr (array)
format (string)
nz (string)
method toStringAr(arr, format, nz)
Namespace types: array
Parameters:
arr (array)
format (string)
nz (string)
method toStringAr(arr, format, nz)
Namespace types: array
Parameters:
arr (array)
format (string)
nz (string)
method toStringAr(arr, format, nz)
Namespace types: array
Parameters:
arr (array)
format (string)
nz (string)
M & W Checklistindicator to Validate & Grade M & W Patterns.
Indicator Inputs
Table Color Palette
• Position Valid : Positions the Valid Trade table on the chart.
• Position Grade : Positions the Grade table on the chart, hover over the Column 1 Row 1 for a description of the bands.
• Size: Text size for all tables.
• Text Color : Sets text color.
• Border Color : Sets the table border color for all tables.
• Background Color : Sets table backgroud color for all tables.
Valid Trade Table
Checkboxes to indicate if the trade is valid. Fail is displayed if unchecked, Pass if checked.
Grade Table
• S/R Level 1: distance between neckline and 1st resistance area in % of the total distance between neckline and take profit. This is not for road blocks but pivot points etc before the initial run up/down in price. I have this set to 30% , this means that if there is a pivot point between the neckline and 30% of the TP level I weight it negatively.
• S/R Level 2: distance between neckline and 1st resistance area in % of the total distance between neckline and take profit. This is not for road blocks but pivot points etc before the initial run up/down in price. I have this set to 50% , this means that if there is a pivot point between the neckline and 50% of the TP level 2 weight it negatively but less so than level 1.
• S/R Level 3: distance between neckline and 1st resistance area in % of the total distance between neckline and take profit. This is not for road blocks but pivot points etc before the initial run up/down in price. I have this set to 70% , this means that if there is a pivot point between the neckline and 70% of the TP level 3 weight it negatively but less so than level 1 & level 2.
• Checkboxes are self explanatory, they are binary options, all are weighted negatively if checked and are weighted positively if unchecked. Divergence values for weighting are neutral if unckecked & weighted positively if checked.
• The select options are neutral weighting if set to neutral , if set to For its weighted positive and set to Against weighted negatively.
Technical Specification of the Scoring and Band System
Overview
The scoring system is designed to evaluate a set of technical trade conditions, assigning weights to various criteria that influence the quality of the trade. The system calculates a total score based on both positive and negative conditions. Based on the final score, the system assigns a grade or band (A, B, or C) for positive scores, and a "Negative" label for negative scores.
Scoring System
The system calculates the score by evaluating a set of 12 conditions (gradeCondition1 to gradeCondition12). These conditions are manually input by the user via checkboxes or dropdowns in a technical indicator (written in Pine Script for TradingView). The score weights vary according to the relative importance of each condition.
Condition Breakdown and Weighting:
1. Divergences (GradeCondition1 & GradeCondition2):
◦ 1H Divergence: +5 points if condition is true.
◦ 4H Divergence: +10 points if condition is true (stronger weight than 1H).
2. Support/Resistance at Neckline (GradeCondition3):
◦ Negative if present: -15 points if true (carries significant negative weight).
3. RB near Entry (GradeCondition4):
◦ Very Negative: -20 points if true (this is a critical negative condition).
4. RB can Manage (GradeCondition5):
◦ Slightly Negative: -5 points if true.
5. Institutional Value Zones (GradeCondition6 to GradeCondition8):
◦ For the trade: +5 points.
◦ Against the trade: -5 points.
◦ Neutral: 0 points.
6. S/R between Neckline & Targets (GradeCondition9 to GradeCondition11):
◦ Level 1: -10 points if true, +7 points if false.
◦ Level 2: -7 points if true, +7 points if false.
◦ Level 3: -5 points if true, +7 points if false.
◦ Use fib tool or Gann Box to measure any S/R levels setup according to your preferences.
7. News Timing (GradeCondition12):
◦ News within 3 hours: -20 points if true (strong negative factor).
◦ No upcoming news: +10 points if false.
Scoring Calculation Formula:
totalScore = score1 + score2 + score3 + score4 + score5 + score6 + score7 + score8 + score9 + score10 + score11 + score12
Where:
• score1 to score12 represent the points derived from the conditions described above.
Coloring and Visual Feedback:
• Positive Scores: Displayed in green.
• Negative Scores: Displayed in red.
Band System
The Band System classifies the total score into different grades, depending on the final value of totalScore. This classification provides an intuitive ranking for trades, helping users quickly assess trade quality.
Band Classification:
• Band A: If the totalScore is 41 or more.
◦ Represents a highly favorable trade setup.
• Band B: If the totalScore is between 21 and 40.
◦ Represents a favorable trade setup with good potential.
• Band C: If the totalScore is between 1 and 20.
◦ Represents a trade setup that is acceptable but may have risks.
• Negative: If the totalScore is 0 or less.
◦ Represents a poor trade setup with significant risks or unfavorable conditions.
Band Calculation Logic (in Pine Script):
var string grade = ""
if (totalScore >= 41)
grade := "Band A"
else if (totalScore >= 21)
grade := "Band B"
else if (totalScore >= 1)
grade := "Band C"
else
grade := "Negative"
Technical Key Points:
• Highly Negative Conditions:
◦ The system penalizes certain conditions more heavily, especially those that suggest significant risks (e.g., News in less than 3 hours, RB near Entry).
• Positive Trade Conditions:
◦ Divergences, Institutional Value Zones in favor of the trade, and lack of significant nearby resistance all contribute positively to the score.
• Flexible System:
◦ The system can be adapted or fine-tuned by adjusting the weights of individual conditions according to trading preferences.
Use Case Example:
• If a trade has 1H and 4H Divergence, RB near Entry (negative), and no upcoming news:
◦ 1H Divergence: +5 points.
◦ 4H Divergence: +10 points.
◦ RB near Entry: -20 points.
◦ No news: +10 points.
◦ Total Score: 5 + 10 - 20 + 10 = 5 → Band C.
This modular and flexible scoring system allows traders to systematically evaluate trades and quickly gauge the trade's potential based on technical indicators
Summary:
Maximum Score: 61
Minimum Score: -97
These are the bounds of the score range based on the current logic of the script.

MTF Squeeze Analyzer - [tradeviZion]MTF Squeeze Analyzer
Multi-Timeframe Squeeze Pro Analyzer Tool
Overview:
The MTF Squeeze Analyzer is a comprehensive tool designed to help traders monitor the TTM Squeeze indicator across multiple timeframes in a streamlined and efficient manner. Built with Pine Script™ version 5, this indicator enhances your market analysis by providing detailed insights into squeeze conditions and momentum shifts, enabling you to make more informed trading decisions.
Key Features:
1. Multi-Timeframe Monitoring:
Comprehensive Coverage: Track squeeze conditions across multiple timeframes, including 1-minute, 5-minute, 15-minute, 30-minute, 1-hour, 2-hour, 4-hour, and daily charts.
Squeeze Counts: Keep count of the number of consecutive bars the price has been within each squeeze level (low, mid, high), helping you assess the strength and duration of consolidation periods.
2. Dynamic Table Display:
Customizable Appearance: Adjust table position, text size, and colors to suit your preferences.
Color-Coded Indicators: Easily identify squeeze levels and momentum shifts with intuitive color schemes.
Message Integration: Features rotating messages to keep you engaged and informed.
3. Alerts for Key Market Events:
Squeeze Start and Fire Alerts: Receive notifications when a squeeze starts or fires on your selected timeframes.
Custom Squeeze Count Alerts: Set thresholds for squeeze counts and get alerted when these levels are reached, allowing you to anticipate potential breakouts.
Fully Customizable: Choose which alerts you want to receive and tailor them to your trading strategy.
4. Momentum Analysis:
Momentum Oscillator: Visualize momentum using a histogram that changes color based on momentum shifts.
Detailed Insights: Determine whether momentum is increasing or decreasing to make more strategic trading decisions.
How It Works:
The indicator is based on the TTM Squeeze concept, which identifies periods of low volatility where the market is "squeezing" before a potential breakout. It analyzes the relationship between Bollinger Bands and Keltner Channels to determine squeeze conditions and uses linear regression to calculate momentum.
1. Squeeze Levels:
No Squeeze (Green): Market is not in a squeeze.
Low Compression Squeeze (Gray): Mild consolidation, potential for a breakout.
Mid Compression Squeeze (Red): Moderate consolidation, higher breakout potential.
High Compression Squeeze (Orange): Strong consolidation, significant breakout potential.
2. Squeeze Counts:
Tracks the number of consecutive bars in each squeeze condition.
Helps identify how long the market has been consolidating, providing clues about potential breakout timing.
3. Momentum Histogram:
Upward Momentum: Shown in aqua or blue, indicating increasing or decreasing upward momentum.
Downward Momentum: Displayed in red or yellow, representing increasing or decreasing downward momentum.
Using Alerts:
Stay ahead of market movements with customizable alerts:
1. Enable Alerts in Settings:
Squeeze Start Alert: Get notified when a new squeeze begins.
Squeeze Fire Alert: Be alerted when a squeeze ends, signaling a potential breakout.
Squeeze Count Alert: Set a specific number of bars for a squeeze condition, and receive an alert when this count is reached.
2. Set Up Alerts on Your Chart:
Click on the indicator name and select " Add Alert on MTF Squeeze Analyzer ".
Choose your desired alert conditions and customize the notification settings.
Click " Create " to activate the alerts.
How to Set It Up:
1. Add the Indicator to Your Chart:
Search for " MTF Squeeze Analyzer " in the TradingView Indicators library.
Add it to your chart.
2. Customize Your Settings:
Table Display:
Choose whether to show the table and select its position on the chart.
Adjust text size and colors to enhance readability.
Timeframe Selection:
Select the timeframes you want to monitor.
Enable or disable specific timeframes based on your trading strategy.
Colors & Styles:
Customize colors for different squeeze levels and momentum shifts.
Adjust header and text colors to match your chart theme.
Alert Settings:
Enable alerts for squeeze start, squeeze fire, and squeeze counts.
Set your preferred squeeze type and count threshold for alerts.
3. Interpret the Data:
Table Information:
The table displays the squeeze status and counts for each selected timeframe.
Colors indicate the type of squeeze, making it easy to assess market conditions at a glance.
Momentum Histogram:
Use the histogram to gauge the strength and direction of market momentum.
Observe color changes to identify shifts in momentum.
Why Use MTF Squeeze Analyzer ?
Enhanced Market Insight:
Gain a deeper understanding of market dynamics by monitoring multiple timeframes simultaneously.
Identify potential breakout opportunities by analyzing squeeze durations and momentum shifts.
Customizable and User-Friendly:
Tailor the indicator to fit your trading style and preferences.
Easily adjust settings without needing to delve into the code.
Time-Efficient:
Save time by viewing all relevant squeeze information in one place.
Reduce the need to switch between different charts and timeframes.
Stay Informed with Alerts:
Never miss a critical market movement with fully customizable alerts.
Focus on other tasks while the indicator monitors the market for you.
Acknowledgment:
This tool builds upon the foundational work of John Carter , who developed the TTM Squeeze concept. It also incorporates enhancements from LazyBear and Makit0 , providing a more versatile and powerful indicator. MTF Squeeze Analyzer extends these concepts by adding multi-timeframe analysis, squeeze counting, and advanced alerting features, offering traders a comprehensive solution for market analysis.
Note: Always practice proper risk management and test the indicator thoroughly to ensure it aligns with your trading strategy. Past performance is not indicative of future results.
Trade smarter with TradeVizion—unlock your trading potential today!

Password Generator by Chervolino [CHE]Enhancing Password Security with Pine Script: A Deep Dive into Brute-Force Attack Prevention
1. Introduction: The Importance of Password Security
Why Password Security Matters:
In today’s digital age, protecting sensitive information through strong passwords is vital. Weak passwords are vulnerable to brute-force attacks, where attackers try every possible character combination until they guess the correct one.
What is Pine Script?
Pine Script is a scripting language developed by TradingView. While mainly used for financial analysis and strategy creation, its versatility allows us to explore other domains, such as password generation and security analysis.
2. Understanding Brute-Force Attacks
What is a Brute-Force Attack?
A brute-force attack systematically tries every possible combination of characters until the correct password is found. The longer and more complex the password, the more secure it is.
Types of Characters in Passwords:
Lowercase Letters (26 characters): Examples include 'a' to 'z'.
Uppercase Letters (26 characters): Examples include 'A' to 'Z'.
Digits (10 characters): Examples include '0' to '9'.
Special Characters: Characters such as '!@#$%^&*' add further complexity to a password.
3. The Role of Password Length in Security
Why Does Password Length Matter?
The number of possible combinations grows exponentially as the length of the password increases.
For example, a password made of only lowercase letters has 26 possible characters. A 7-character password in this case has 26 raised to the power of 7 possible combinations, which equals about 8 billion possibilities.
In comparison, if uppercase letters are included, the possible combinations jump to 52 raised to the power of 7, resulting in over 1 trillion combinations.
Time to Crack a Password:
Assuming a computer can test 2.15 billion passwords per second:
A 7-character password with only lowercase letters can be cracked in about 3.74 seconds.
If uppercase letters are added, it takes approximately 8 minutes.
Adding numbers and special characters makes the cracking time increase further to hours or even days.
4. Password Strength Analysis Using Pine Script
How Pine Script Helps in Password Analysis:
Pine Script can simulate password strength by generating random passwords and calculating how long it would take for a brute-force attack to crack them based on different character combinations and lengths.
We can experiment with using different types of characters (uppercase, lowercase, digits, special characters) and varying the length of the password to estimate the security.
For example:
A password consisting only of lowercase letters would take just a few seconds to crack.
By adding uppercase letters, the time increases to several minutes.
Including digits and special characters can make a password secure for many hours, or even days, depending on the length.
5. Results: Time to Crack Passwords
Here’s a textual summary of how different passwords can be cracked based on their composition and length:
Password with Lowercase Letters Only:
Length: 8 characters
Time to Crack: Less than 1 second.
Password with Uppercase and Lowercase Letters:
Length: 8 characters
Time to Crack: Approximately 24 hours.
Password with Uppercase, Lowercase, and Digits:
Length: 8 characters
Time to Crack: Around 27 minutes.
Password with Uppercase, Lowercase, Digits, and Special Characters:
Length: 12 characters
Time to Crack: Several hundred years.
From these examples, you can see that adding complexity to a password by using a variety of character types and increasing its length exponentially increases the time required to crack it.
6. Best Practices for Password Security
Use a mix of character types: Include lowercase and uppercase letters, digits, and special characters to increase complexity.
Increase the password length: The longer the password, the more difficult it is to crack.
Avoid predictable patterns: Refrain from using common words, dates, or sequential characters like "123456" or "password123".
Use a password manager: Tools like 1Password or LastPass can help store and manage complex passwords securely, so you only need to remember one master password.
7. Conclusion
Password length and complexity are the two most important factors in protecting against brute-force attacks.
Pine Script offers a powerful way to simulate password generation and security analysis, giving you insights into how secure your password is and how long it would take to crack it.
By applying these techniques, you can ensure that your passwords are strong and secure, making brute-force attacks infeasible.

Uptrick: TimeFrame Trends: Performance & Sentiment Indicator### **Uptrick: TimeFrame Trends: Performance & Sentiment Indicator (TFT) - In-Depth Explanation**
#### **Overview**
The **Uptrick: TimeFrame Trends: Performance & Sentiment Indicator (TFT)** is a sophisticated trading tool designed to provide traders with a comprehensive view of market trends across multiple timeframes, combined with a sentiment gauge through the Relative Strength Index (RSI). This indicator offers a unique blend of performance analysis, sentiment evaluation, and visual signal generation, making it an invaluable resource for traders who seek to understand both the macro and micro trends within a financial instrument.
#### **Purpose**
The primary purpose of the TFT indicator is to empower traders with the ability to assess the performance of an asset over various timeframes while simultaneously gauging market sentiment through the RSI. By analyzing price changes over periods ranging from one week to one year, and complementing this with sentiment signals, TFT enables traders to make informed decisions based on a well-rounded analysis of historical price performance and current market conditions.
#### **Key Components and Features**
1. **Multi-Timeframe Performance Analysis:**
- **Performance Lookback Periods:**
- The TFT indicator calculates the percentage price change over several predefined timeframes: 7 days (1 week), 14 days (2 weeks), 30 days (1 month), 180 days (6 months), and 365 days (1 year). These timeframes provide a layered view of how an asset has performed over short, medium, and long-term periods.
- **Percentage Change Calculation:**
- The indicator computes the percentage change for each timeframe by comparing the current closing price to the closing price at the start of each period. This gives traders insight into the strength and direction of the trend over different periods, helping them identify consistent trends or potential reversals.
2. **Sentiment Analysis Using RSI:**
- **Relative Strength Index (RSI):**
- RSI is a widely-used momentum oscillator that measures the speed and change of price movements. It oscillates between 0 and 100 and is typically used to identify overbought or oversold conditions. In TFT, the RSI is calculated using a 14-period lookback, which is standard for most RSI implementations.
- **RSI Smoothing with EMA:**
- To refine the RSI signal and reduce noise, TFT applies a 10-period Exponential Moving Average (EMA) to the RSI values. This smoothed RSI is then used to generate buy, sell, and neutral signals based on its position relative to the 50 level:
- **Buy Signal:** Triggered when the smoothed RSI crosses above 50, indicating bullish sentiment.
- **Sell Signal:** Triggered when the smoothed RSI crosses below 50, indicating bearish sentiment.
- **Neutral Signal:** Triggered when the smoothed RSI equals 50, suggesting indecision or a balanced market.
3. **Visual Signal Generation:**
- **Signal Plots:**
- TFT provides clear visual cues directly on the price chart by plotting shapes at the points where buy, sell, or neutral signals are generated. These shapes are color-coded (green for buy, red for sell, yellow for neutral) and are positioned below or above the price bars for easy identification.
- **First Occurrence Trigger:**
- To avoid clutter and focus on significant market shifts, TFT only triggers the first occurrence of each signal type. This feature helps traders concentrate on the most relevant signals without being overwhelmed by repeated alerts.
4. **Customizable Performance & Sentiment Table:**
- **Table Display:**
- The TFT indicator includes a customizable table that displays the calculated percentage changes for each timeframe. This table is positioned on the chart according to user preference (top-left, top-right, bottom-left, bottom-right) and provides a quick reference to the asset’s performance across multiple periods.
- **Dynamic Text Color:**
- To enhance readability and provide immediate visual feedback, the text color in the table changes based on the direction of the percentage change: green for positive (upward movement) and red for negative (downward movement). This color-coding helps traders quickly assess whether the asset is in an uptrend or downtrend for each period.
- **Customizable Font Size:**
- Traders can adjust the font size of the table to fit their chart layout and personal preferences, ensuring that the information is accessible without being intrusive.
5. **Flexibility and Customization:**
- **Lookback Period Customization:**
- While the default lookback periods are set for common trading intervals (7 days, 14 days, etc.), these can be adjusted to match different trading strategies or market conditions. This flexibility allows traders to tailor the indicator to focus on the timeframes most relevant to their analysis.
- **RSI and EMA Settings:**
- The length of the RSI calculation and the smoothing EMA can also be customized. This is particularly useful for traders who prefer shorter or longer periods for their momentum analysis, allowing them to fine-tune the sensitivity of the indicator.
- **Table Position and Appearance:**
- The table’s position on the chart, along with its font size and colors, is fully customizable. This ensures that the indicator can be integrated seamlessly into any chart setup without obstructing key price data.
#### **Use Cases and Applications**
1. **Trend Identification and Confirmation:**
- **Short-Term Traders:**
- Traders focused on short-term movements can use the 7-day and 14-day performance metrics to identify recent trends and momentum shifts. The RSI signals provide additional confirmation, helping traders enter or exit positions based on the latest market sentiment.
- **Swing Traders:**
- For those holding positions over days to weeks, the 30-day and 180-day performance data are particularly useful. These metrics highlight medium-term trends, and when combined with RSI signals, they provide a robust framework for swing trading strategies.
- **Long-Term Investors:**
- Long-term investors can benefit from the 1-year performance data to gauge the overall health and direction of an asset. The indicator’s ability to track performance across different periods helps in identifying long-term trends and potential reversal points.
2. **Sentiment Analysis and Market Timing:**
- **Market Sentiment Tracking:**
- By using RSI in conjunction with performance metrics, TFT provides a clear picture of market sentiment. Traders can use this information to time their entries and exits more effectively, aligning their trades with periods of strong bullish or bearish sentiment.
- **Avoiding False Signals:**
- The smoothing of RSI helps reduce noise and avoid false signals that are common in volatile markets. This makes the TFT indicator a reliable tool for identifying true market trends and avoiding whipsaws that can lead to losses.
3. **Comprehensive Market Analysis:**
- **Multi-Timeframe Analysis:**
- TFT’s ability to analyze multiple timeframes simultaneously makes it an excellent tool for comprehensive market analysis. Traders can compare short-term and long-term performance to understand the broader market context, making it easier to align their trading strategies with the overall trend.
- **Performance Benchmarking:**
- The percentage change metrics provide a clear benchmark for an asset’s performance over time. This information can be used to compare the asset against broader market indices or other assets, helping traders make more informed decisions about where to allocate their capital.
4. **Custom Strategy Development:**
- **Tailoring to Specific Markets:**
- TFT can be customized to suit different markets, whether it’s stocks, forex, commodities, or cryptocurrencies. For instance, traders in volatile markets may opt for shorter lookback periods and more sensitive RSI settings, while those in stable markets may prefer longer periods for a smoother analysis.
- **Integrating with Other Indicators:**
- TFT can be used alongside other technical indicators to create a more comprehensive trading strategy. For example, combining TFT with moving averages, Bollinger Bands, or MACD can provide additional layers of confirmation and reduce the likelihood of false signals.
#### **Best Practices for Using TFT**
- **Regularly Adjust Lookback Periods:**
- Depending on the market conditions and the asset being traded, it’s important to regularly review and adjust the lookback periods for the performance metrics. This ensures that the indicator remains relevant and responsive to current market trends.
- **Combine with Volume Analysis:**
- While TFT provides a solid foundation for trend and sentiment analysis, combining it with volume indicators can further enhance its effectiveness. Volume can confirm the strength of a trend or signal potential reversals when divergences occur.
- **Use RSI with Other Momentum Indicators:**
- Although RSI is a powerful tool on its own, using it alongside other momentum indicators like Stochastic Oscillator or MACD can provide additional confirmation and help refine entry and exit points.
- **Customize Table Settings for Clarity:**
- Ensure that the performance table is positioned and sized appropriately on the chart. It should be easily readable without obstructing important price data. Adjust the text size and colors as needed to maintain clarity.
- **Monitor Multiple Timeframes:**
- Utilize the multi-timeframe analysis feature of TFT to monitor trends across different periods. This helps in identifying the dominant trend and avoiding trades that go against the broader market direction.
#### **Conclusion**
The **Uptrick: TimeFrame Trends: Performance & Sentiment Indicator (TFT)** is a comprehensive and versatile tool that combines the power of multi-timeframe performance analysis with sentiment gauging through RSI. Its ability to customize and adapt to various trading strategies and markets makes it a valuable asset for traders at all levels. By offering a clear visual representation of trends and market sentiment, TFT empowers traders to make more informed and confident trading decisions, whether they are focusing on short-term price movements or long-term investment opportunities. With its deep integration of performance metrics and sentiment analysis, TFT stands out as a must-have indicator for any trader looking to gain a holistic understanding of market dynamics.

Smoothed SuperTrend with VWAP Confirmation [CHE] Smoothed SuperTrend with Automated Optimization and VWAP Confirmation
Overview
The "Smoothed SuperTrend with VWAP Confirmation" is an advanced technical analysis indicator designed for precise trend identification and trading signal generation. This script integrates a smoothed version of the popular SuperTrend indicator with an additional layer of confirmation using the Volume-Weighted Average Price (VWAP). The combination of these two elements offers traders a powerful tool for identifying optimal entry and exit points in the market.
Key Features
1. Smoothed SuperTrend
- Super Smoother Algorithm: The SuperTrend in this script is not just a regular one; it is enhanced by the Super Smoother filter, which reduces market noise and provides more reliable trend signals.
- Customizable Parameters: Traders can adjust three different sets of SuperTrend parameters (factor and ATR length), allowing them to tailor the indicator to their specific trading strategies.
- Automatic Optimization: The script automatically evaluates the performance of each SuperTrend parameter set and selects the one with the best cumulative performance. This selection process can be set to pick either the best or the worst performing parameter set, depending on the trader's preference.
2. VWAP Confirmation
- Precise Trend Confirmation: Once the best-performing SuperTrend is identified, the script further refines the signals by using VWAP as a confirmation tool. VWAP is a highly respected indicator in the trading community, often used to assess the true average price of an asset.
- Long and Short Signal Generation: The script generates Long and Short signals only when the price action is confirmed by both the SuperTrend and VWAP. For a Long signal, the price must be above the VWAP, and for a Short signal, it must be below the VWAP. This dual confirmation ensures higher accuracy and reduces the likelihood of false signals.
3. Visual and Informative Labels
- Signal Labels: Upon confirmation of a trend reversal by both the SuperTrend and VWAP, the script plots clear labels on the chart, indicating confirmed Long or Short signals. These labels are customizable in terms of color, text, and size, ensuring they fit seamlessly into any chart setup.
- Best Parameters Display: At the close of the most recent bar, the script displays a label that provides detailed information about the best-performing SuperTrend parameters and their cumulative performance. This feature keeps traders informed about which settings are currently most effective.
Input Customization Options
1. Super Smoother Length
- Traders can define the length of the Super Smoother filter, which is used to smooth both price data and ATR (Average True Range) values. This input allows traders to control the sensitivity of the indicator, with shorter lengths providing faster responses and longer lengths offering smoother trends.
2. SuperTrend Parameters
- Factor: For each of the three SuperTrends, traders can set a unique factor that determines the distance of the SuperTrend bands from the average price. A higher factor results in wider bands and fewer signals, while a lower factor results in narrower bands and more signals.
- ATR Length: Traders can also specify the length of the ATR used in each SuperTrend calculation. A longer ATR period captures broader market volatility, while a shorter period focuses on more immediate price movements.
3. Label Settings
- Label Colors: The script allows full customization of label colors for Long and Short signals, ensuring that they match the trader’s chart aesthetics.
- Label Text Colors and Sizes: Traders can adjust the text color and size of the labels for Long, Short, and information labels, allowing them to prioritize visibility and readability on their charts.
4. Performance Selection Mode
- Best or Worst Performer: This input allows traders to select whether the script should optimize for the best or worst performing SuperTrend parameter set. This flexibility is useful in different market conditions, where a trader might want to analyze either the strongest trend or focus on a contrarian strategy.
5. VWAP Calculation
- The script automatically recalculates the VWAP based on trend changes, ensuring that the confirmation signals are as accurate and relevant as possible to the current market context.
Important Note
This script is designed to provide more accurate trend signals and confirmations, but like all technical indicators, it should not be used in isolation. It is recommended to use this tool as part of a broader trading strategy, including proper risk management and consideration of fundamental market conditions.
Conclusion
The "Smoothed SuperTrend with VWAP Confirmation" script is an innovative trading tool that combines the strengths of the SuperTrend and VWAP indicators. By integrating smoothing techniques and automatic parameter optimization, this indicator provides traders with more accurate and reliable trend signals. The added confirmation by VWAP further enhances the precision of the entry and exit points, making it an excellent choice for traders looking to improve their technical analysis and trading outcomes. This tool is especially valuable for those who prefer customizable inputs and a systematic approach to trading, ensuring that the indicator adapts to various market conditions and individual trading styles.
Best regards
Chervolino

Anchored Auto Fibonacci Retracement with Alerts [ImaWrknMan]SYNOPSIS
Automatically generates a Fibonacci Retracement anchored to the candle of your choosing. As price moves further away from the anchor point, the fib levels automatically adjust to represent the entirety of the move.
BULLISH VS. BEARISH
It automatically detects if the Fibonacci Retracement should be drawn from the low or high of the anchored candle by considering the candles that follow (if they produce new highs, it will use the anchored candle low; if they produce new lows, it will use the anchored candle high).
MITIGATION
If the Fibonacci levels are fully retraced (i.e., price pulls back beyond the originating price), the levels will remain on the chart but it will no longer adjust as new candles form - it will become static.
OPTIONS
The following options are offered:
Extend Retracement Levels
The Fibonacci Retracement levels will extend beyond the last candle into the future. These extensions are visually represented using dashed lines.
Retracement Levels
Twelve levels are supported. The default levels mirror those used by the standard Fibonacci Retracement tool. Select only the levels you want to see on the chart. Line color can also be customized to your liking. You can optionally define an alert condition and alert message for each level (see "Alerts" below).
ALERTS
To receive an alert when price retraces into a level, check the "Alert" box to the right of that level. You can optionally define the text to display in the alert by entering it in the text box to the right of the alert checkbox. Levels with alerts will be marked on the chart with a "bell" symbol. Once you've selected the alerts you want to receive and (optionally) the text for each alert, create an Alert for the indicator.
NOTE: You do NOT need to create a separate Alert for each level.
Limitations
Alerts can only be defined for levels that fall between 0 and 1.
Once an alert is created, its settings are fixed. Any changes to the settings after the Alert is created will have no effect on the existing Alert. In this case, the Alert should be recreated.
Alert notifications will only be generated for visible levels.
Other Alerts
Alert on expansion - Use this alert option if you want to be notified when price moves further from the anchored price, causing the retracement levels to adjust. This is useful if you have Limit orders at current levels and you want to cancel or move them when the levels change.
"Alert on mitigation" - Use this alert option if you want to be notified when the Fibonacci Retracement has been fully retraced.
The code for this indicator was inspired by the Fibonacci Toolkit by LuxAlgo

Volume Insignts AnalyzerDescription:
The Volume Insight Analyzer is an advanced Pine Script designed for traders who want a comprehensive view of volume dynamics on their charts. This script combines multiple volume-based indicators to help identify key trading opportunities, including significant volume days, volume dry-ups, and pocket pivots.
Key Features:
VDU (Volume Dry-Up) Detection: Automatically identifies and marks days when the volume is significantly below its moving average, helping to spot potential breakout or breakdown points. Customizable volume thresholds allow for tailored analysis based on your trading strategy. The Volume Dry-Up label appears when the volume is substantially below its average level and the price is near a key moving average. This condition indicates a period of equilibrium between supply and demand, suggesting a potential low-risk entry point for traders.
Pocket Pivot Analysis using 5 and 10 Length Pocket Pivots: Highlights days with exceptionally high volume compared to recent history, indicating potential pocket pivots. Visual markers on the chart and volume bars color-coded for 5 and 10-day lengths. Pocket pivot points are identified when the volume on a given day exceeds the maximum volume observed over the past several days. Specifically, a 5-day pocket pivot point is marked when today's volume surpasses the highest selling volume of the last 5 days. A cluster of 5-day pocket pivot points within a base is a strong indicator of stock strength. Similarly, a 10-day pocket pivot point following a Volume Dry-Up (VDU) suggests a potential entry opportunity. Moreover, a pre-existing cluster of 5-day pocket pivot points before a 10-day pocket pivot point provides greater conviction in the trade.
Volume Moving Averages: Set different lengths for primary and secondary moving averages to track volume trends over daily, weekly, and monthly timeframes. Options to display moving average lines on the volume chart.
Volume Visualization:
a. Major and Minor Volume Bars: Option to display bars that are either above or below average volume levels. Adjustable settings to show or hide these bars based on user preference.
b. Volume Bar Coloring: Volume bars are color-coded based on significant volume thresholds, including green for bullish signals, red for bearish signals, and orange for volume dry-ups.
Volume Metrics Table: A customizable table that displays real-time volume metrics including Relative Volume (RVOL), Turnover, and the number of high volume days. The table can be oriented horizontally or vertically and styled according to your theme preferences.
Visual Indicators:
a) Volume Dry-Up (VDU) Labels: Clearly marked VDU events with textual annotations on the chart.
b) Bullish and Bearish Arrows: Arrows indicating potential bullish or bearish closes based on volume analysis, enhancing decision-making.
Customization Options:
a) Dark and Light Theme Support: Toggle between dark and light themes to match your chart settings.
b) Adjustable Parameters: Easily configure input settings such as volume thresholds, MA lengths, and table display options to fit your trading style.
How to Use:
Set Parameters: Adjust the script settings such as volume thresholds, moving average lengths, and display preferences according to your analysis needs.
Analyze Volume Patterns: Use the indicators and visual markers provided by the script to identify significant volume patterns and potential trading signals.
Monitor Metrics: Refer to the volume metrics table for a quick overview of key volume-related statistics and trends.
Make Informed Decisions: Utilize the visual cues and volume data provided by the script to enhance your trading strategy and make more informed decisions.
Disclaimer:
This script is for informational purposes only and should not be considered as trading advice. Use it in conjunction with other analysis tools and consult with a financial advisor if needed. Trading involves risk, and past performance does not guarantee future results.

Depth of Market (DOM) [LuxAlgo]The Depth Of Market (DOM) tool allows traders to look under the hood of any market, taking price and volume analysis to the next level. The following features are included: DOM, Time & Sales, Volume Profile, Depth of Market, Imbalances, Buying Pressure, and up to 24 key intraday levels (it really packs a punch).
As a disclaimer, this tool does not use tick data, it is a DOM reconstruction from the provided real-time time series data (price and volume). So the volume you see is from filled orders only, this tool does not show unfilled limit orders.
Traders can enable or disable any of the features at will to avoid being overwhelmed with too much information and to make the tool perform faster.
The features that have the biggest impact on performance are Historical Data Collection, Key Levels (POC & VWAP), Time & Sales, Profile, and Imbalances. Disable these features to improve the indicator computational performance.
🔶 DOM
This is the simplest form of the tool, a simple DOM or ladder that displays the following columns:
PRICE: Price level
BID: Total number of market sell orders filled or limit buy orders filled.
SELL: Sell market orders
BUY: Buy market orders
ASK: Total number of market buy orders filled or limit sell orders filled.
The DOM only collects historical data from the last 24 hours and real-time data.
Traders can select a reset period for the DOM with two options:
DAILY: Resets at the beginning of each trading day
SESSIONS: Resets twice, as DAILY and 15.5 hours later, to coincide with the start of the RTH session for US tickers.
The DOM has two main modes, it can display price levels as ticks or points. The default is automatic based on the current daily volatility, but traders can manually force one mode or the other if they wish.
For convenience, traders have the option to set the number of lines (price levels), and the size of the text and to display only real-time data.
By default, the top price is set to 0 so that the DOM automatically adjusts the price levels to be displayed, but traders can set the top price manually so that the tool displays only the desired price levels in a fixed manner.
🔹 Volume Profile
As additional features to the basic DOM, traders have access to the volume profile histogram and the total volume per price level.
This helps traders identify at a glance key price areas where volume is accumulating (high volume nodes) or areas where volume is lacking (low volume nodes) - these areas are important to some traders who base their decision-making process on them.
🔹 Imbalances
Other added features are imbalances and buying pressure:
Interlevel Imbalance: volume delta between two different price levels
Intralevel Imbalance: delta between buy and sell volume at the same price level
Buying Pressure Percent: percentage of buy volume compared to total volume
Imbalances can help traders identify areas of interest in the price for possible support or resistance.
🔹 Depth
Depth allows traders to see at a glance how much supply is above the current price level or how much demand is below the current price level.
Above the current price level shows the cumulative ask volume (filled sell limit orders) and below the current price level shows the cumulative bid volume (filled buy limit orders).
🔶 KEY LEVELS
The tool includes up to 24 different key intraday levels of particular relevance:
Previous Week Levels
PWH: Previous week high
PWL: Previous week low
PWM: Previous week middle
PWS: Previous week settlement (close)
Previous Day Levels
PDH: Previous day high
PDL: Previous day low
PDM: Previous day middle
PDS: Previous day settlement (close)
Current Day Levels
OPEN: Open of day (or session)
HOD: High of day (or session)
LOD: Low of day (or session)
MOD: Middle of day (or session)
Opening Range
ORH: Open range high
ORL: Open range low
Initial Balance
IBH: Initial balance high
IBL: Initial balance low
VWAP
+3SD: Volume weighted average price plus 3 standard deviations
+2SD: Volume weighted average price plus 2 standard deviations
+1SD: Volume weighted average price plus 1 standard deviation
VWAP: Volume weighted average price
-1SD: Volume weighted average price minus 1 standard deviation
-2SD: Volume weighted average price minus 2 standard deviations
-3SD: Volume weighted average price minus 3 standard deviations
POC: Point of control
Different traders look at different levels, the key levels shown here are objective and specific areas of interest that traders can act on, providing us with potential areas of support or resistance in the price.
🔶 TIME & SALES
The tool also features a full-time and sales panel with time, price, and size columns, a size filter, and the ability to set the timezone to display time in the trader's local time.
The information shown here is what feeds the DOM and it can be useful in several ways, for example in detecting absorption. If a large number of orders are coming into the market but the price is barely moving, this indicates that there is enough liquidity at these levels to absorb all these orders, so if these orders stop coming into the market, the price may turn around.
🔶 SETTINGS
Period: Select the anchoring period to start data collection, DAILY will anchor at the start of the trading day, and SESSIONS will start as DAILY and 15.5 hours later (RTH for US tickers).
Mode: Select between AUTO and MANUAL modes for displaying TICKS or POINTS, in AUTO mode the tool will automatically select TICKS for tickers with a daily average volatility below 5000 ticks and POINTS for the rest of the tickers.
Rows: Select the number of price levels to display
Text Size: Select the text size
🔹 DOM
DOM: Enable/Disable DOM display
Realtime only: Enable/Disable real-time data only, historical data will be collected if disabled
Top Price: Specify the price to be displayed on the top row, set to 0 to enable dynamic DOM
Max updates: Specify how many times the values on the SELL and BUY columns are accumulated until reset.
Profile/Depth size: Maximum size of the histograms on the PROFILE and DEPTH columns.
Profile: Enable/Disable Profile column. High impact on performance.
Volume: Enable/Disable Volume column. Total volume traded at price level.
Interlevel Imbalance: Enable/Disable Interlevel Imbalance column. Total volume delta between the current price level and the price level above. High impact on performance.
Depth: Enable/Disable Depth, showing the cumulative supply above the current price and the cumulative demand below. Impact on performance.
Intralevel Imbalance: Enable/Disable Intralevel Imbalance column. Delta between total buy volume and total sell volume. High impact on performance.
Buying Pressure Percent: Enable/Disable Buy Percent column. Percentage of total buy volume compared to total volume.
Imbalance Threshold %: Threshold for highlighting imbalances. Set to 90 to highlight the top 10% of interlevel imbalances and the top and bottom 10% of intra-level imbalances.
Crypto volume precision: Specify the number of decimals to display on the volume of crypto assets
🔹 Key Levels
Key Levels: Enable/Disable KEY column. Very high performance impact.
Previous Week: Enable/Disable High, Low, Middle, and Close of the previous trading week.
Previous Day: Enable/Disable High, Low, Middle, and Settlement of the previous trading day.
Current Day/Session: Enable/Disable Open, High, Low and Middle of the current period.
Open Range: Enable/Disable High and Low of the first candle of the period.
Initial Balance: Enable/Disable High and Low of the first hour of the period.
VWAP: Enable/Disable Volume-weighted average price of the period with 1, 2, and 3 standard deviations.
POC: Enable/Disable Point of Control (price level with the highest volume traded) of the period.
🔹 Time & Sales
Time & Sales: Enable/Disable time and sales panel.
Timezone offset (hours): Enter your time zone\'s offset (+ or −), including a decimal fraction if needed.
Order Size: Set order size filter. Orders smaller than the value are not displayed.
🔶 THANKS
Hi, I'm makit0 coder of this tool and proud member of the LuxAlgo Opensource team, it's an honor to be part of the LuxAlgo family doing something I love as it's writing opensource code and sharing it with the world. I'd like to thank all of you who use, comment on, and vote for all of our open-source tools, and all of you who give us your support.
And of course thanks to the PineCoders family for all the work in front of and behind the scenes that makes the PineScript community what it is, simply the best.
Peace, Love & PineScript!

MyLibraryLibrary "MyLibrary"
This library contains various trading strategies and utility functions for Pine Script.
simple_moving_average(src, length)
simple_moving_average
@description Calculates the Simple Moving Average (SMA) of a given series.
Parameters:
src (float) : (series float) The input series (e.g., close prices).
length (int) : (int) The number of periods to use for the SMA calculation.
Returns: (series float) The calculated SMA series.
exponential_moving_average(src, length)
exponential_moving_average
@description Calculates the Exponential Moving Average (EMA) of a given series.
Parameters:
src (float) : (series float) The input series (e.g., close prices).
length (simple int) : (int) The number of periods to use for the EMA calculation.
Returns: (series float) The calculated EMA series.
safe_division(numerator, denominator)
safe_division
@description Performs division with error handling for division by zero.
Parameters:
numerator (float) : (float) The numerator for the division.
denominator (float) : (float) The denominator for the division.
Returns: (float) The result of the division, or na if the denominator is zero.
strategy_moving_average_crossover(shortLength, longLength)
strategy_moving_average_crossover
@description Implements a Moving Average Crossover strategy.
Parameters:
shortLength (int) : (int) The length for the short period SMA.
longLength (int) : (int) The length for the long period SMA.
Returns: (series float, series float, series bool, series bool) The short SMA, long SMA, crossover signals, and crossunder signals.
strategy_rsi(rsiLength, overbought, oversold)
strategy_rsi
@description Implements an RSI-based trading strategy.
Parameters:
rsiLength (simple int) : (int) The length for the RSI calculation.
overbought (float) : (float) The overbought threshold.
oversold (float) : (float) The oversold threshold.
Returns: (series float, series bool, series bool) The RSI values, long signals, and short signals.
ichimoku_cloud(convPeriod, basePeriod, spanBPeriod, laggingSpanPeriod)
ichimoku_cloud
@description Computes Ichimoku Cloud components.
Parameters:
convPeriod (int) : (int) The conversion line period.
basePeriod (int) : (int) The base line period.
spanBPeriod (int)
laggingSpanPeriod (int)
Returns: (series float, series float, series float, series float, series float) The conversion line, base line, leading span A, leading span B, and lagging span.
strategy_ichimoku_conversion_baseline()
strategy_ichimoku_conversion_baseline
@description Implements an Ichimoku Conversion Line and Baseline strategy.
Returns: (series float, series float, series bool, series bool) The conversion line, baseline, crossover signals, and crossunder signals.
debug_print(labelText, value, barIndex)
debug_print
@description Prints values to the chart for debugging purposes.
Parameters:
labelText (string) : (string) The label text.
value (float) : (float) The value to display.
barIndex (int) : (int) The bar index where the label should be displayed.

ATR Price Range Prediction V.2### ATR Price Range Prediction V.2
This script calculates the expected high and low prices for the current day based on the Average True Range (ATR) and displays the proportion of days where the daily range (high - low) is greater than or equal to the ATR. Additionally, the script provides an option to adjust the size of the text displayed in the top-right corner of the chart.
#### How It Works
1. **ATR Calculation**: The script calculates the ATR for a specified period (`atrPeriod`). ATR is a measure of volatility that represents the average range between the high and low prices over a specified number of periods.
2. **Expected High and Low Calculation**:
- **Expected High**: Calculated by adding the ATR value to the low price of the current day.
- **Expected Low**: Calculated by subtracting the ATR value from the high price of the current day.
3. **Proportion Calculation**: The script calculates the proportion of days where the daily range (high - low) is greater than or equal to the ATR value. This proportion is updated in real-time as new data comes in.
4. **Table Display**: Instead of displaying labels on each candle, the script shows the expected high, expected low, and the calculated proportion in a table located at the top-right corner of the chart. The size of the text in this table can be adjusted using the `Table Size` input.
5. **Color Coding**: The script changes the color of the bars to yellow if the daily range is greater than or equal to the ATR value, making it easy to identify these bars visually.
#### How to Use
- **ATR Period (`atrPeriod`)**: Adjust the period for the ATR calculation using the input parameter. The default value is 14.
- **Table Size (`tableSizeOption`)**: Choose the size of the text displayed in the table. Options include `tiny`, `small`, `normal`, `large`, and `huge`.
- **Expected High and Low**: Use the green and red lines to identify potential target prices or stop-loss levels for your trades. The green line represents the expected high, and the red line represents the expected low.
- **Proportion**: The table in the top-right corner of the chart shows the proportion of days where the daily range is greater than or equal to the ATR value. This can provide insight into the volatility of the asset.
- **Color Coding**: Yellow bars indicate days where the daily range is greater than or equal to the ATR value.
---
### ภาษาไทย
### ATR คาดการณ์ราคาสูงสุดและต่ำสุด พร้อมสัดส่วน
สคริปต์นี้คำนวณราคาสูงสุดและต่ำสุดที่คาดการณ์สำหรับวันปัจจุบันโดยอิงจากค่าเฉลี่ยช่วงที่แท้จริง (ATR) และแสดงสัดส่วนของวันที่ช่วงราคาต่อวัน (สูง - ต่ำ) มากกว่าหรือเท่ากับค่า ATR นอกจากนี้ยังมีตัวเลือกในการปรับขนาดข้อความที่แสดงในกล่องข้อความมุมขวาบนของกราฟ
#### วิธีการทำงาน
1. **การคำนวณ ATR**: สคริปต์คำนวณค่า ATR สำหรับช่วงเวลาที่กำหนด (`atrPeriod`) ATR เป็นมาตรวัดความผันผวนที่แสดงช่วงเฉลี่ยระหว่างราคาสูงสุดและต่ำสุดในช่วงเวลาที่กำหนด
2. **การคำนวณราคาสูงสุดและต่ำสุดที่คาดการณ์**:
- **ราคาสูงสุดที่คาดการณ์**: คำนวณโดยการบวกค่า ATR กับราคาต่ำสุดของวันปัจจุบัน
- **ราคาต่ำสุดที่คาดการณ์**: คำนวณโดยการลบค่า ATR จากราคาสูงสุดของวันปัจจุบัน
3. **การคำนวณสัดส่วน**: สคริปต์คำนวณสัดส่วนของวันที่ช่วงราคาต่อวัน (สูง - ต่ำ) มากกว่าหรือเท่ากับค่า ATR สัดส่วนนี้จะอัปเดตแบบเรียลไทม์เมื่อมีข้อมูลใหม่เข้ามา
4. **การแสดงผลในตาราง**: แทนที่จะแสดงป้ายกำกับบนแท่งเทียนแต่ละแท่ง สคริปต์จะแสดงราคาสูงสุดที่คาดการณ์ ราคาต่ำสุดที่คาดการณ์ และสัดส่วนที่คำนวณในตารางที่มุมขวาบนของกราฟ โดยสามารถปรับขนาดข้อความในตารางได้
5. **การใช้สี**: สคริปต์จะเปลี่ยนสีของแท่งเทียนเป็นสีเหลืองหากช่วงราคาต่อวันมากกว่าหรือเท่ากับค่า ATR ทำให้สามารถระบุแท่งเทียนเหล่านี้ได้ง่ายขึ้น
#### วิธีการใช้งาน
- **ATR Period (`atrPeriod`)**: ปรับช่วงเวลาสำหรับการคำนวณ ATR โดยใช้พารามิเตอร์การป้อนค่า ค่าเริ่มต้นคือ 14
- **Table Size (`tableSizeOption`)**: เลือกขนาดข้อความที่แสดงในตาราง ตัวเลือกได้แก่ `tiny`, `small`, `normal`, `large`, และ `huge`
- **ราคาสูงสุดและต่ำสุดที่คาดการณ์**: ใช้เส้นสีเขียวและสีแดงเพื่อระบุราคาที่เป็นเป้าหมายหรือระดับการหยุดขาดทุนสำหรับการซื้อขายของคุณ เส้นสีเขียวแสดงถึงราคาสูงสุดที่คาดการณ์และเส้นสีแดงแสดงถึงราคาต่ำสุดที่คาดการณ์
- **สัดส่วน**: ตารางที่มุมขวาบนของกราฟแสดงสัดส่วนของวันที่ช่วงราคาต่อวันมากกว่าหรือเท่ากับค่า ATR ซึ่งสามารถให้ข้อมูลเชิงลึกเกี่ยวกับความผันผวนของสินทรัพย์
- **การใช้สี**: แท่งเทียนสีเหลืองบ่งบอกถึงวันที่ช่วงราคาต่อวันมากกว่าหรือเท่ากับค่า ATR
_____

EC_2025_Q4_ENLibrary "EC_2025_Q4_EN"
output2025()
Returns the list of events during the period.
Returns: array: (week1,week2, ... week_n)
week_n= ;;; ...
Where: is expressed as date + characteristics: YYYY,MM,DD,hh,mm,ss,x,y,z
x impact in numbers
y event name in numbers
z currency in numbers
name2025()
Returns the list of event names during the period.
Returns: array: (week1,week2, ... week_n)
week_n= ;; ...
Where: is expressed as: index, name
index: related to event name y
name event: event name related to y text
impact2025()
Returns the list of impact names during the period.
Returns: array: (week1,week2, ... week_n)
week_n= ;; ...
Where: is expressed as: index, impact
index: related to impact name x
impact: impact name related to x text
currency2025()
Returns the list of currencies during the period.
Returns: array: (week1,week2, ... week_n)
week_n= ;; ...
Where: is expressed as: index, currency
index: related to currency name z
currency: currency name related to z text

EC_2025_Q3_ENLibrary "EC_2025_Q3_EN"
output2025()
Returns the list of events during the period.
Returns: array: (week1,week2, ... week_n)
week_n= ;;; ...
Where: is expressed as date + characteristics: YYYY,MM,DD,hh,mm,ss,x,y,z
x impact in numbers
y event name in numbers
z currency in numbers
name2025()
Returns the list of event names during the period.
Returns: array: (week1,week2, ... week_n)
week_n= ;; ...
Where: is expressed as: index, name
index: related to event name y
name event: event name related to y text
impact2025()
Returns the list of impact names during the period.
Returns: array: (week1,week2, ... week_n)
week_n= ;; ...
Where: is expressed as: index, impact
index: related to impact name x
impact: impact name related to x text
currency2025()
Returns the list of currencies during the period.
Returns: array: (week1,week2, ... week_n)
week_n= ;; ...
Where: is expressed as: index, currency
index: related to currency name z
currency: currency name related to z text

EC_2025_Q2_ENLibrary "EC_2025_Q2_EN"
output2025()
Returns the list of events during the period.
Returns: array: (week1,week2, ... week_n)
week_n= ;;; ...
Where: is expressed as date + characteristics: YYYY,MM,DD,hh,mm,ss,x,y,z
x impact in numbers
y event name in numbers
z currency in numbers
name2025()
Returns the list of event names during the period.
Returns: array: (week1,week2, ... week_n)
week_n= ;; ...
Where: is expressed as: index, name
index: related to event name y
name event: event name related to y text
impact2025()
Returns the list of impact names during the period.
Returns: array: (week1,week2, ... week_n)
week_n= ;; ...
Where: is expressed as: index, impact
index: related to impact name x
impact: impact name related to x text
currency2025()
Returns the list of currencies during the period.
Returns: array: (week1,week2, ... week_n)
week_n= ;; ...
Where: is expressed as: index, currency
index: related to currency name z
currency: currency name related to z text

EC_2025_Q1_ENLibrary "EC_2025_Q1_EN"
output2025()
Returns the list of events during the period.
Returns: array: (week1,week2, ... week_n)
week_n= ;;; ...
Where: is expressed as date + characteristics: YYYY,MM,DD,hh,mm,ss,x,y,z
x impact in numbers
y event name in numbers
z currency in numbers
name2025()
Returns the list of event names during the period.
Returns: array: (week1,week2, ... week_n)
week_n= ;; ...
Where: is expressed as: index, name
index: related to event name y
name event: event name related to y text
impact2025()
Returns the list of impact names during the period.
Returns: array: (week1,week2, ... week_n)
week_n= ;; ...
Where: is expressed as: index, impact
index: related to impact name x
impact: impact name related to x text
currency2025()
Returns the list of currencies during the period.
Returns: array: (week1,week2, ... week_n)
week_n= ;; ...
Where: is expressed as: index, currency
index: related to currency name z
currency: currency name related to z text

EC_2025_Q4_SPLibrary "EC_2025_Q4_SP"
output2025()
Returns the list of events during the period.
Returns: array: (week1,week2, ... week_n)
week_n= ;;; ...
Where: is expressed as date + characteristics: YYYY,MM,DD,hh,mm,ss,x,y,z
x impact in numbers
y event name in numbers
z currency in numbers
name2025()
Returns the list of event names during the period.
Returns: array: (week1,week2, ... week_n)
week_n= ;; ...
Where: is expressed as: index, name
index: related to event name y
name event: event name related to y text
impact2025()
Returns the list of impact names during the period.
Returns: array: (week1,week2, ... week_n)
week_n= ;; ...
Where: is expressed as: index, impact
index: related to impact name x
impact: impact name related to x text
currency2025()
Returns the list of currencies during the period.
Returns: array: (week1,week2, ... week_n)
week_n= ;; ...
Where: is expressed as: index, currency
index: related to currency name z
currency: currency name related to z text
EC_2025_Q3_SPLibrary "EC_2025_Q3_SP"
output2025()
Returns the list of events during the period.
Returns: array: (week1,week2, ... week_n)
week_n= ;;; ...
Where: is expressed as date + characteristics: YYYY,MM,DD,hh,mm,ss,x,y,z
x impact in numbers
y event name in numbers
z currency in numbers
name2025()
Returns the list of event names during the period.
Returns: array: (week1,week2, ... week_n)
week_n= ;; ...
Where: is expressed as: index, name
index: related to event name y
name event: event name related to y text
impact2025()
Returns the list of impact names during the period.
Returns: array: (week1,week2, ... week_n)
week_n= ;; ...
Where: is expressed as: index, impact
index: related to impact name x
impact: impact name related to x text
currency2025()
Returns the list of currencies during the period.
Returns: array: (week1,week2, ... week_n)
week_n= ;; ...
Where: is expressed as: index, currency
index: related to currency name z
currency: currency name related to z text

EC_2025_Q2_SPLibrary "EC_2025_Q2_SP"
output2025()
Returns the list of events during the period.
Returns: array: (week1,week2, ... week_n)
week_n= ;;; ...
Where: is expressed as date + characteristics: YYYY,MM,DD,hh,mm,ss,x,y,z
x impact in numbers
y event name in numbers
z currency in numbers
name2025()
Returns the list of event names during the period.
Returns: array: (week1,week2, ... week_n)
week_n= ;; ...
Where: is expressed as: index, name
index: related to event name y
name event: event name related to y text
impact2025()
Returns the list of impact names during the period.
Returns: array: (week1,week2, ... week_n)
week_n= ;; ...
Where: is expressed as: index, impact
index: related to impact name x
impact: impact name related to x text
currency2025()
Returns the list of currencies during the period.
Returns: array: (week1,week2, ... week_n)
week_n= ;; ...
Where: is expressed as: index, currency
index: related to currency name z
currency: currency name related to z text
