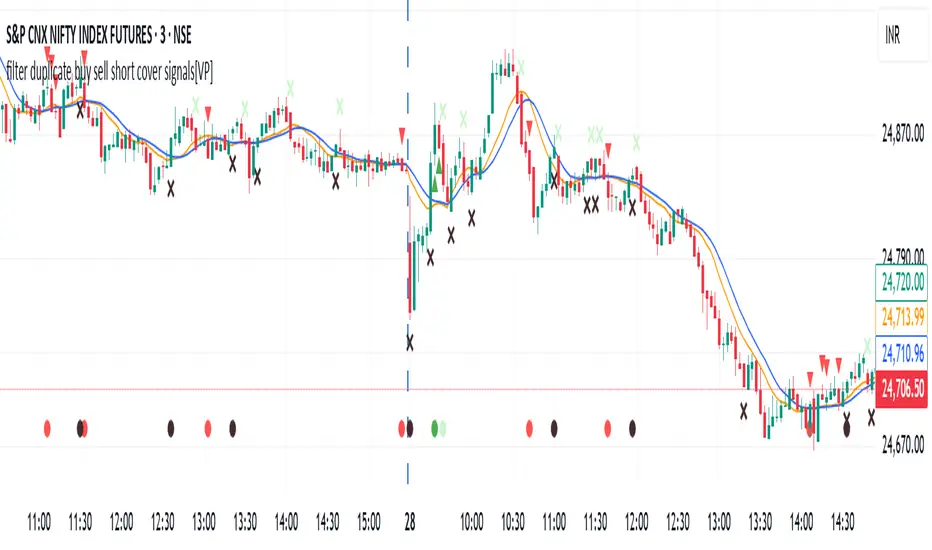
filter duplicate buy sell short cover signals[VP]I was looking for an indicator that would filter signals but could only find solutions for a buy/sell system. I couldn't locate one that dealt with buy/sell AND short/cover.
The indicator expands the idea from the link:
stackoverflow.com
Search in scripts for "text"
Current Hourly Open Liquidity with Sweep DetectionStatistics indicate that if the current hourly candle reaches the high or low of the previous hourly candle, there is a strong likelihood that the price will return to the current hour's open, depending on how quickly the previous hour's high or low was swept. If the sweep occurs within the first 20 minutes, there is a 75% chance the current hour's open will be reached; if it takes between 21 and 40 minutes, the probability decreases to 50%; and if it takes longer than 41 minutes, the chance drops to 25%.
These statistics can help identify manipulation on the hourly timeframe and guide trade decisions accordingly. For instance, if the previous hourly high is taken within the first 20 minutes but the current hour's open is not reached, it may be wise to avoid long positions until it happens or consider short positions in the direction of the open liquidity, using your existing entry rules and risk management.
The indicator highlights the current hour's open with a line and label to visually represent that liquidity pool, adjusting the line's color based on whether and when the previous hour's high or low was tapped. Once the open is reached, the indicator can, depending on settings, remove the line and label from the chart (this is enabled by default) since the liquidity pool is no longer relevant, preventing chart clutter.
All colors, line widths, label text sizes, and colors can be customized.
S&D DirectionThis indicator displays the most recent candle close direction for up to five custom timeframes, as selected in the settings. For each chosen timeframe, it shows whether the last confirmed candle close was bullish (close above the previous high) or bearish (close below the previous low). The indicator labels each timeframe in the top right corner, using green text for bullish closes and red for bearish closes. The displayed timeframes can be customized, and the direction (long/short) is clearly shown after each label.
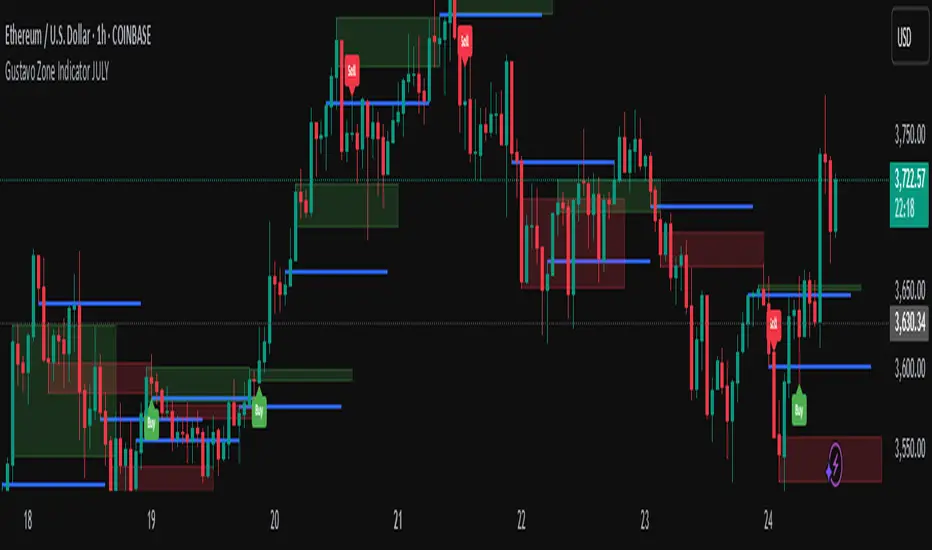
Gustavo Zone Indicator JULYThis indicator watches for runs of at least three consecutive green (or red) candles followed by an opposite-color candle, then marks that reversal zone by drawing a rectangle from the wicks of the first two run candles. It optionally plots a horizontal “target” line at the wick of the third run candle. While the zone is active, if three bars in a row close beyond both the zone boundary and the target line, it issues a customizable “Sell” label above the bar (after bullish runs) or a “Buy” label below the bar (after bearish runs). All colors, text labels, sizes, offsets, and toggles for the zones, lines, and signals can be adjusted in the input settings.
MA Table [RanaAlgo]The "MA Table " indicator is a comprehensive and visually appealing tool for tracking moving average signals in TradingView. Here's a short summary of its usefulness:
Key Features:
Dual MA Support:
Tracks both EMA (Exponential Moving Average) and SMA (Simple Moving Average) signals (10, 20, 30, 50, 100 periods).
Users can toggle visibility for EMA/SMA separately.
Clear Signal Visualization:
Displays Buy (▲) or Sell (▼) signals based on price position relative to each MA.
Color-coded (green for buy, red for sell) for quick interpretation.
Customizable Table Design:
Adjustable position (9 placement options), colors, text size, and border styling.
Alternating row colors improve readability.
Optional MA Plots:
Can display the actual MA lines on the chart for visual confirmation (with distinct colors/styles).
Usefulness:
Quick Overview: The table consolidates multiple MA signals in one place, saving time compared to checking each MA individually.
Trend Confirmation: Helps confirm trend strength when multiple MAs align (e.g., price above all MAs → strong uptrend).
Flexible: Suitable for both short-term (10-20 period) and long-term (50-100 period) traders.
Aesthetic: Professional design enhances chart clarity without clutter.
Ideal For:
Traders who rely on moving average crossovers or price-MA relationships.
Multi-timeframe analysis when combined with other tools.
Beginners learning MA strategies (clear visual feedback).

% / ATR Buy, Target, Stop + Overlay & P/L% / ATR Buy, Target, Stop + Overlay & P/L
This tool combines volatility‑based and fixed‑percentage trade planning into a single, on‑chart overlay—with built‑in profit‑and‑loss estimates. Toggle between ATR or percentage modes, plot your Buy, Target and Stop levels, and see the dollar gain or loss for a specified position size—all in one interactive table and chart display.
NOTE: To activate plotted lines, price labels, P/L rows and table values, enter a Buy Price greater than zero.
What It Does
Mode Toggle: Choose between “ATR” (volatility‑based) or “%” (fixed‑percentage) calculations.
Buy Price Input: Manually enter your entry price.
ATR Mode:
Target = Buy + (ATR × Target Multiplier)
Stop = Buy − (ATR × Stop Multiplier)
Percentage Mode:
Target = Buy × (1 + Target % / 100)
Stop = Buy × (1 – Stop % / 100)
P/L Estimates: Specify a dollar amount to “invest” at your Buy price, and the script calculates:
Gain ($): Profit if Target is hit
Loss ($): Cost if Stop is hit
Visual Overlay: Draws horizontal lines for Buy, Target and Stop, with optional price labels on the chart scale.
Interactive Table: Displays Buy, Target, Stop, ATR/timeframe info (in ATR mode), percentages (in % mode), and P/L rows.
Customization Options
Line Settings:
Choose color, style (solid/dashed/dotted), and width for Buy, Target, Stop lines.
Extend lines rightward only or in both directions.
Table Settings:
Position the table (top/bottom × left/right).
Toggle individual rows: Buy Price; Target (multiplier or %); Stop (multiplier or %); Target ATR %; Stop ATR %; ATR Time Frame; ATR Value; Gain ($); Loss ($).
Customize text colors for each row and background transparency.
General Inputs:
ATR length and optional ATR timeframe override (e.g. use daily ATR on an intraday chart).
Target/Stop multipliers or percentages.
Dollar Amount for P/L calculations.
How to Use It for Trading
Plan Your Entry: Enter your intended Buy Price and position size (dollar amount).
Select Mode: Toggle between ATR or % mode depending on whether you prefer volatility‑based or fixed offsets.
Assess R:R and P/L: Instantly see your Target, Stop levels, and potential profit or loss in dollars.
Visual Reference: Lines and price labels update in real time as you tweak inputs—ideal for live trading, backtesting or trade journaling.
Ideal For
Traders who want both volatility‑based and percentage‑based exit options in one tool
Those who need on‑chart P/L estimates based on position size
Swing and intraday traders focused on objective, rule‑based trade management
Anyone who uses ATR for adaptive stops/targets or fixed percentages for simpler exits
Supply/Demand Zones - Fixed v3 (Cross YES Only)This Pine Script indicator creates Supply/Demand Zones with specific filtering criteria for TradingView. Here's a comprehensive description:
Supply/Demand Zones -(Cross YES Only)
Core Functionality
Session-Based Analysis: Identifies and visualizes price ranges during user-defined time sessions
Cross Validation Filter: Only displays zones when the "Cross" condition is met (Open and Close prices cross the mid-range level)
Real-Time Monitoring: Tracks price action during active sessions and creates zones after session completion
Key Features
Time Range Configuration
Customizable session hours (start/end time with minute precision)
Timezone support (default: Europe/Bucharest)
Flexible scheduling for different trading sessions
Visual Elements
Range Border: Dotted outline showing the full session range (High to Low)
Key Levels: Horizontal lines for High, Low, and Mid-range levels
Sub-Range Zones: Shaded areas showing Open and Close price zones
Percentage Labels: Display the percentage of range occupied by Open/Close zones
Active Session Background: Blue background highlighting during active sessions
Smart Filtering System
Cross Condition: Only creates zones when:
Open < Mid AND Close > Mid (bullish cross), OR
Open > Mid AND Close < Mid (bearish cross)
This filter ensures only significant price movements that cross the session's midpoint are highlighted
Customization Options
Display Controls: Toggle visibility for borders, lines, zones, and labels
Color Schemes: Full color customization for all elements
Transparency Settings: Adjustable transparency for zone fills
Text Styling: Configurable label colors and information display
Technical Specifications
Maximum capacity: 500 boxes, 500 lines, 200 labels
Overlay indicator (draws directly on price chart)
Bar-time based positioning for accurate historical placement
Use Cases
Supply/Demand Trading: Identify key price levels where institutions may have interest
Session Analysis: Understand price behavior during specific trading hours
Breakout Detection: Focus on sessions where price crosses significant levels
Support/Resistance: Use range levels for future trade planning
What Makes It Unique
The "Cross YES Only" filter ensures that only meaningful price sessions are highlighted - those where the market shows directional bias by crossing from one side of the range to the other, indicating potential institutional interest or significant market sentiment shifts.

FVG 9:31–10:00 AM ETFVG 9:31–10:00 AM ET - Script Description
What This Script Does
This indicator finds **Fair Value Gaps (FVGs)** that form during the first 29 minutes of the U.S. stock market (9:31 AM to 10:00 AM Eastern Time). A Fair Value Gap is a price imbalance where there's a gap between candles that often becomes an important support or resistance level.
Key Features:
- **Time Window**: Only looks for FVGs between 9:31-10:00 AM ET (most important opening period)
- **One Per Day**: Finds only the first FVG that forms in this time window each day
- **Visual Display**: Draws a purple box around the gap with a clear "FVG" label
- **Price Tracking**: Monitors when price comes back to test the gap level
- **Alert System**: Sends notifications when price returns to the FVG zone
How FVGs Are Detected:
- **Bullish FVG**: When there's a gap up (low of middle candle is above high of 3rd candle back)
- **Bearish FVG**: When there's a gap down (high of middle candle is below low of 3rd candle back)
The 9:31-10:00 AM window is chosen because this is when institutions and algorithms create their biggest price moves right after market open, making these gaps very reliable.
Customization Options
User Settings
Extend FVG Box (Bars)
- **What it does**: Makes the purple box longer to the right
- **Default**: 0 (box ends right after the gap forms)
- **Options**: Any number from 0 to 100+
- **When to use**:
- Keep at 0 for clean historical view
- Set to 10-20 to track the gap during the current session
- Set higher for longer reference
Code Settings (Can Be Changed)
Time Window
- **Start**: 9:31 AM Eastern Time
- **End**: 10:00 AM Eastern Time
- **Can modify**: Change the hour/minute numbers in the code
Visual Style
- **Color**: Purple with see-through background
- **Label**: Shows "FVG" text in white
- **Can modify**: Change colors and transparency in the code
How to Use:
Setup
Chart Settings
1. Use 1-minute, 5-minute, or 15-minute charts (works best on these timeframes)
2. Apply to liquid markets like ES, NQ, major stocks, or forex pairs
3. Set the "Extend FVG Box" to your preference (start with 0 or 10)
What You'll See
- A purple box appears when an FVG forms during 9:31-10:00 AM
- Box shows the exact price levels of the gap
- "FVG" label appears on the box
- Only one FVG per day will be marked
Trading Strategies
Basic FVG Trading
1. **Wait for Formation**: Let the purple box appear during 9:31-10:00 AM
2. **Watch Price Movement**: See if price moves away from the gap
3. **Enter on Retest**: When price comes back to the purple box area, consider entering
4. **Trade Direction**:
- Bullish FVG = look for long opportunities when price retests
- Bearish FVG = look for short opportunities when price retests
Entry Methods
- **Bounce Play**: Enter when price touches the FVG box and bounces away
- **Break Play**: Enter if price strongly breaks through the FVG box
- **Rejection Play**: Enter opposite direction if price gets rejected at the FVG
Risk Management
Stop Losses
- Place stops just outside the FVG box (a few ticks beyond the gap)
- If trading a bounce, stop goes on opposite side of the gap
- If trading a break, stop goes back inside the gap
Position Sizing
- Start small until you understand how FVGs work in your market
- Bigger gaps = smaller position size (more risk)
- Smaller gaps = can use larger position size
Profit Targets
- Take profits at obvious levels like round numbers, previous highs/lows
- Consider taking half profits at 1:1 risk/reward ratio
- Let some position run if the move is strong
Best Practices
When It Works Best
- High-volume stocks and futures (ES, NQ work great)
- Normal market days without major news during the 9:31-10:00 window
- When there's clear institutional activity in the opening period
When to Be Careful
- Low-volume stocks or markets
- Major economic news releases during the time window
- Market holidays when volume is low
- Very choppy or sideways days
Alert Usage
- The script will alert you when price comes back to test the FVG
- Don't trade the alert blindly - always check the current market situation
- Use the alert as a heads-up to start watching the setup more closely
Tips for Success
- The earlier the FVG forms in the 9:31-10:00 window, often the more significant it is
- FVGs that form with high volume are usually more reliable
- Always consider the overall market direction - don't fight the main trend
- Practice on paper first to understand how FVGs behave in your chosen market
🔗 Works Best With:
✅ Liquidity Levels — Smart Swing Lows: Spot key structural lows that can fuel stop hunts and reversals.
✅ ICT Turtle Soup — Liquidity Reversal: Add a classic reversal pattern to your toolkit to catch fakeouts cleanly.
✅ ICT SMC Liquidity Grabs and OBs- Liquidity Grabs, Order Block Zones, and Fibonacci OTE Levels, allowing traders to identify institutional entry models with clean, rule-based visual signals.
This script is most valuable for day traders who want to catch institutional moves right after market open, but it can also help swing traders identify important intraday levels.
✅ ICT Macro Zones (Grey Box Version)- It tracks real-time highs and lows for each Silver Bullet session.
✅ Weekly Opening Gap (cryptonnnite)

Big Trade % Heatmap### Big Trade % Heatmap
**Quick overview**
This indicator highlights where “whale” activity is clustered by showing what fraction of the recent candles contained *large‑value trades*. A candle is considered “big” when its notional volume (`volume × close`) exceeds your chosen USD threshold. You instantly see:
* **Percent of big candles** in the last *N* bars, refreshed at the cadence you pick.
* **On‑chart labels & markers** every refresh, so the chart stays clean.
* **Optional heat‑map background** that turns orange (>20 %) or green (>50 %) when big‑trade concentration spikes.
* **Ready‑made alert** when big‑trade dominance crosses 50 %.
---
#### How it works
1. **Trade size per candle** – Calculates `close × volume` to estimate dollars traded.
2. **Threshold filter** – Flags candles whose value is above *Big Trade Threshold (\$)*.
3. **Look‑back window** – Counts what percentage of the last *Lookback Window (X Candles)* were “big.”
4. **Refresh interval** – Repeats the measurement only every *Refresh Interval (Every X Candles)* to avoid label spam.
5. **Visuals** –
* A small blue ▼ above the bar + a text label such as `35.00 % > $25 000`.
* Background shading (green/orange) for quick, at‑a‑glance sentiment.
---
#### Inputs
| Input | Purpose | Default |
| -------------------------------------- | ----------------------------------------------------- | ------- |
| **Lookback Window (X Candles)** | How many recent bars to sample for the % calculation. | 20 |
| **Refresh Interval (Every X Candles)** | How often to display a new label/marker. | 5 |
| **Big Trade Threshold (\$)** | Minimum USD value for a candle to count as “big.” | 10 000 |
Tune these to the symbol and timeframe you trade (e.g., raise the threshold for BTC‑USDT 1‑h, lower it for micro‑caps).
---
#### Alerts
Enable **“High Big Trade %”** to get notified the moment more than half of the last *N* candles qualify as big trades—handy for spotting sudden accumulation or distribution.
---
#### Typical use cases
* **Breakout confirmation** – A surge in big‑trade % just before price escapes a range can validate the move.
* **Whale spotting** – Detect hidden accumulation on pullbacks or aggressive selling into rallies.
* **Filter noise** – Combine with your favorite trend indicator; only act when both align.
---
> *Built with Pine Script v6. Always back‑test before trading live; this tool is for educational purposes and not financial advice.*

ICT Time CaptureICT 8am High/Low + 9am Capture (NY Time) — Fixed 1H
This indicator marks the High and Low of the 8am candle on the 1-hour timeframe fixed to New York time (America/New_York timezone). It also draws a line for the 9am candle open and indicates if the 9am candle “captured” (broke above or below) the 8am High or Low.
Key Features:
Always uses 1-hour data fixed on New York timezone, regardless of the chart’s current timeframe.
Draws horizontal lines for the 8am High and Low, with configurable colors, styles (solid/dashed), thickness, and extension length.
Draws a horizontal line for the 9am open price with customizable style.
Shows labels with price values explaining the lines.
Shows a capture label when the 9am candle breaks above the 8am high or below the 8am low.
Allows full customization of label text colors, line colors, line styles, thickness, and label distances from line start.
How to use:
Use this indicator to monitor key ICT timeframes (8am and 9am NY time) for intraday price action clues.
The capture labels help identify when price breaks key levels from the 8am candle during the 9am candle.
The configurable style options let you customize the indicator to your chart style.

Round Number Levels ProRound Number Levels Pro is a powerful support and resistance indicator that automatically plots psychological price levels on your chart.
What it does:
- Displays major round number levels (100, 200, 300, etc.) with prominent lines
- Shows mid-level lines (50, 150, 250, etc.) for additional reference points
- All lines extend across the entire chart for maximum visibility
- Automatically adjusts levels based on current price action
Key Features:
- Customizable Font Sizes - Large text for main levels, normal for mid-levels
- Clean Black Styling - Professional appearance that works on any chart background
- Flexible Line Styles - Choose solid, dashed, or dotted lines for main and mid levels
- Adjustable Parameters - Control number of levels, rounding increments, and label positioning
- Full Chart Extension - Lines extend both directions for complete price reference
Perfect for:
- Day traders looking for key psychological support/resistance levels
- Swing traders identifying major price zones
- Any trader who uses round numbers as decision points
How to use:
Simply add to your chart and the indicator will automatically plot relevant round number levels. Customize the settings to match your trading style and timeframe.
These psychological levels are where many traders make decisions, often creating natural support and resistance zones in the market.

QQE + Signals RNEdited this to do away with larged signals of long and short to small triangles labeld only with QQE text

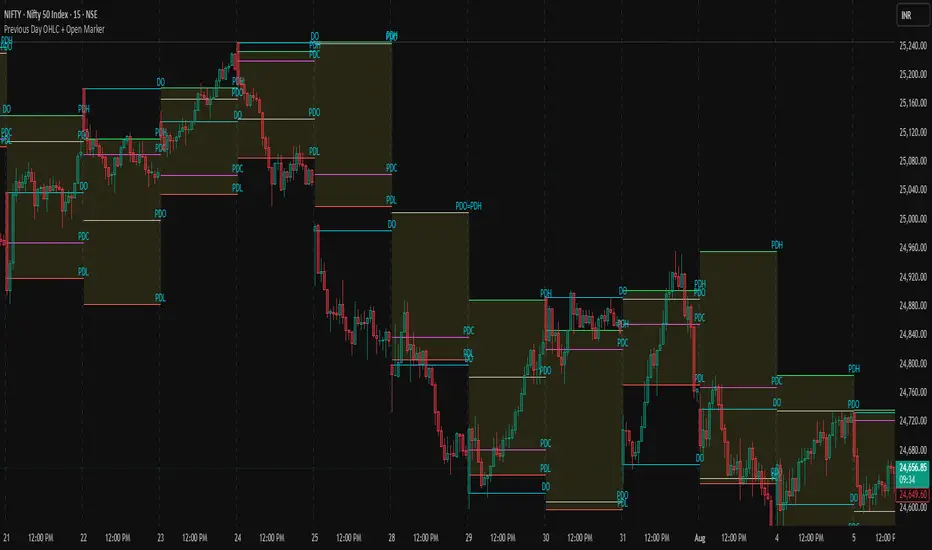
Previous Day OHLC + Open MarkerPrevious Day OHLC + Open Marker
This indicator is designed to help traders quickly identify the most important price levels from the previous trading session and today’s open. It provides a clean and configurable overlay of the previous day’s OHLC (Open, High, Low, Close) along with the current day's opening price, making it easy to spot price reactions, liquidity sweeps, and confluence zones.
📌 Key Features
✅ Previous Day OHLC Lines
Plots horizontal lines for High (H), Low (L), Open (O), and Close (C) from the previous session
Each line is independently toggleable
Fully customizable in color, transparency, and thickness
✅ Today's Session Open (DO)
Marks the current day's opening price
Helps identify directional bias, trend/momentum shifts, or mean-reversion points
✅ Minimalist Labels for Clarity
Text-only labels like H, L, O, C, and DO — no bulky label boxes
Color-matched to each line for visual simplicity
Optional display to keep charts clean
✅ Session-Based Highlight Zone
Optionally highlights the area between the previous day’s High and Low with a shaded box
Useful for identifying the day’s value area or range breakouts
✅ Smart Alerts
Receive alerts when price crosses any of the levels: PDH, PDL, PDO, PDC, or Today’s Open
Helps you catch key interactions without watching the chart constantly
🧠 Ideal For
Intraday traders using VWAP, order blocks, or liquidity concepts
Swing traders who want to see how current price relates to prior structure
Scalpers looking for clean levels to enter fades, reversals, or breakouts
Anyone applying institutional trading concepts (PDH/PDL sweeps, FVGs, BPRs, etc.)
⚙️ Customization Options
Toggle each level (H/L/O/C/DO) individually
Show or hide labels and highlight zone
Customize color, line thickness, and transparency
Clean layout — no line extensions across the entire chart
🧼 Design Philosophy
This script was created for clarity, speed, and minimalism. It avoids clutter while preserving all the crucial context price action traders need. Labels are informative but unobtrusive, and alerts help automate level tracking.
🛠 Built with Pine Script v5
🔔 Alerts Included
📊 Optimized for both intraday and swing trading
📦 Lightweight and modular by design
Zero-Lag RSI DivergenceZero-Lag RSI Divergence
Overview
This indicator identifies RSI divergences in real-time without delay, providing immediate signals as price-momentum discrepancies develop. The indicator analyzes price action against RSI momentum across dual configurable periods, enabling traders to detect potential reversal opportunities with zero lag.
Key Features
Instant Divergence Detection : Identifies bullish and bearish divergences immediately upon formation without waiting for candle confirmation or historical validation. This eliminates signal delay but may increase false signals due to higher sensitivity.
Dual Period Analysis : Configure detection across two independent cycles - Short Period (default 15) and Long Period (default 50) - allowing for multi-timeframe divergence analysis and enhanced signal validation across different market conditions.
Visual Divergence Lines : Automatically draws dashed lines connecting divergence points between price highs/lows and corresponding RSI peaks/troughs, clearly illustrating the momentum-price relationship.
Customizable RSI Parameters : Adjustable RSI length (default 14) allows optimization for different market volatility and trading timeframes.
How It Works
The indicator continuously monitors price action patterns and RSI momentum:
- Bullish Divergence : Detected when price makes lower lows while RSI makes higher lows, suggesting potential upward momentum
- Bearish Divergence : Identified when price makes higher highs while RSI makes lower highs, indicating potential downward momentum
The algorithm uses candle color transitions and immediate RSI comparisons to trigger signals without historical repainting , ensuring backtesting accuracy and real-time reliability.
How To Read
Important Notes
Higher Signal Frequency : The zero-lag approach increases signal sensitivity, generating more frequent alerts that may include false signals. Consider using additional confirmation methods for trade entries.
Non-Repainting : All signals are generated and maintained without historical modification, ensuring consistent backtesting and forward-testing results.
Input Parameters
RSI Length: Period for RSI calculation (default: 14)
Short/Long Periods: Lookback periods for divergence detection (default: 15/50)
Line Colors: Customizable colors for short and long period divergence lines
Label Settings: Optional divergence labels with custom text
This indicator is designed for traders seeking immediate divergence identification across multiple timeframes while maintaining signal integrity and backtesting reliability.

First FVG📘 Indicator Description (English)
First FVG – NY Open is a TradingView indicator designed to automatically identify the first Fair Value Gap (FVG) that appears during the New York session, following the ICT (Inner Circle Trader) methodology.
It highlights institutional inefficiencies in price caused by imbalanced price action and helps traders spot high-probability entry zones, especially after the 9:30 AM EST (New York Open).
⚙️ How It Works
Session time: The indicator scans for FVGs starting at 9:32 AM (allowing 3 candles after the NY Open to form).
FVG Conditions:
Bullish FVG: When the high of 2 candles ago is lower than the low of the current candle and the middle candle is bullish.
Bearish FVG: When the low of 2 candles ago is higher than the high of the current candle and the middle candle is bearish.
Only the first FVG per session is drawn, as taught by ICT for setups like Judas Swing or NY Reversal models.
A colored box is drawn to represent the FVG zone.
A dotted horizontal line (CE) is drawn at the midpoint of the FVG box (Consequent Encroachment), a key level watched by smart money traders.
A dashed vertical line is drawn at 9:30 NY time to mark the open.
🧠 How to Use It
Wait for the NY Open (9:30 AM EST) – the indicator becomes active at 9:32 AM.
Watch for the first FVG box of the day. This is often a high-probability reaction zone.
Use the CE line (center of the FVG) as a reference for entries, rejections, or liquidity grabs.
Combine with market structure, PD Arrays, and liquidity concepts as taught by ICT for confluence.
The FVG box and CE line will extend forward for several candles for visual clarity.
🎛️ Customizable Settings
Session time (default: 09:32–16:00 NY)
FVG box color (up/down)
Text color
Max number of days to keep boxes on chart
Option to show or hide the 9:30 NY Open vertical line

Range Breakout [sgbpulse]Range Breakout
1. Overview
The "Range Breakout " indicator is a powerful tool designed to identify and visually display price ranges on your chart using pivot points. It dynamically draws two distinct boxes – an External Range and an Internal Range – helping traders pinpoint potential support and resistance zones. Beyond its visual representation, the indicator offers a comprehensive set of 12 unique breakout alerts, providing real-time notifications for significant price movements outside these defined ranges. Additionally, it integrates RSI and MFI metrics for momentum confirmation.
2. How It Works
The indicator operates by identifying pivot points based on user-defined "left" and "right" bar lengths. A high pivot is a bar with a specified number of lower highs both to its left and right, and similarly for a low pivot.
External Range: Calculated using longer pivot lengths (default: 15 bars left, 6 bars right). This range represents broader, more significant price consolidation areas.
Internal Range: Calculated using shorter pivot lengths (default: 4 bars left, 3 bars right). This range captures tighter, more immediate price consolidations within the broader trend.
The External Range will always be greater than or equal to the Internal Range, as it's based on a wider historical context. Both ranges are displayed as transparent boxes on your chart, dynamically adjusting as new pivots are formed.
3. Key Features and Settings
Customizable Pivot Lengths:
External Range (Left/Right Bars): Adjust sensitivity for identifying the broader price range. Longer lengths lead to more stable, but less frequent, range updates.
Internal Range (Left/Right Bars): Adjust sensitivity for the tighter, more immediate price range.
Tool Tips: Minimum 6 bars for the External Range, and minimum 2 bars for the Internal Range.
Customizable Range Colors: Easily change the background colors of the External and Internal Range boxes to match your chart's aesthetic.
Dynamic Range Display: The indicator automatically updates the range boxes as new pivot highs and lows are formed, always presenting the most current valid ranges.
RSI / MFI Settings:
Timeframe Source: Select the timeframe for RSI and MFI calculation.
- Chart: Calculation based on the current chart timeframe.
- Daily: Always calculated based on the daily ("D") timeframe, even if the chart is on a lower timeframe.
RSI Length: Period length for RSI calculation (default: 14).
RSI Overbought Level: Overbought level for RSI (default: 70.0).
RSI Oversold Level: Oversold level for RSI (default: 30.0).
MFI Length: Period length for MFI calculation (default: 14).
MFI Overbought Level: Overbought level for MFI (default: 80.0).
MFI Oversold Level: Oversold level for MFI (default: 20.0).
4. Synergy of Ranges & Breakout Strength
The interaction between the External and Internal Ranges provides deep insights into price movement and breakout strength:
Immediate Direction: The movement of the Internal Range (up or down) indicates the short-term directional bias within the broader framework of the External Range.
Strength Confirmation: A breakout of the External Range, followed by a breakout of the Internal Range, confirms the strength of the move and increases confidence in the breakout.
Strong Momentum ("Leaving" Ranges Behind): When price breaks out with exceptionally strong momentum, it continues to move aggressively and does not immediately form new pivots. In such situations, the existing ranges (External and Internal) remain in place while the candles "leave them behind." A "Full Candle" breakout, where the entire candle moves past both ranges, indicates a particularly powerful and decisive move.
Momentum (RSI / MFI) as Confirmation:
- RSI (Relative Strength Index): Measures the speed and change of price movements. Extreme values (above 70 or below 30) indicate overbought/oversold conditions respectively, confirming strong momentum in a breakout.
- MFI (Money Flow Index): Similar to RSI but incorporates volume. Extreme values (above 80 or below 20) indicate strong money flow in/out, reinforcing breakout confirmation.
- Importance of Confirmation: If a breakout occurs but momentum indicators do not confirm it (for example, an upside breakout while RSI is declining), this could signal weakness in the move and the risk of a false breakout (Fakeout).
5. Visuals
The indicator provides clear visual representations on the chart:
Range Boxes:
Two dynamic boxes are drawn on the chart: one for the External Range and one for the Internal Range.
These boxes update continuously, displaying the current range boundaries based on the latest pivots. They provide an immediate visual indication of support and resistance levels.
RSI/MFI Status Labels:
Small text labels appear to the right of the current bar, vertically centered.
They display the status of RSI and MFI: RSI OB (Overbought), RSI OS (Oversold), MFI OB, MFI OS, along with the exact value.
Important: The labels remain on the chart as long as the condition holds (indicator is above/below the level), unlike alerts which mark a singular crossover event.
Plotting of Key Values:
The indicator plots six invisible series on the chart, primarily to allow the user to view the exact numerical values of:
- The upper and lower bounds of the External Range (External High, External Low).
- The upper and lower bounds of the Internal Range (Internal High, Internal Low).
- The calculated RSI and MFI values (RSI, MFI).
These values are accessible for viewing through TradingView's Data Window and also via the Status Line when hovering over the relevant candle. This enables more precise quantitative analysis of range levels and momentum.
6. Comprehensive Breakout Alerts
The "Range Breakout " indicator provides 12 distinct alert conditions for breakouts, allowing you to select the required level of confirmation for each alert. All alerts are triggered only upon a fully confirmed bar close (barstate.isconfirmed) to minimize false signals and ensure reliability.
All breakout alerts are configured to detect a Crossover/Crossunder of the levels, meaning a specific event where the price moves from one side of the range to the other.
External Range Breakout UP
- Close: Price closes above the External Range.
- Real Body: The entire "real body" of the candle (min of open/close prices) closes above the External Range.
- Full Candle: The entire candle (the lowest point of the candle) closes above the External Range.
External Range Breakout DOWN
- Close: Price closes below the External Range.
- Real Body: The entire "real body" of the candle (max of open/close prices) closes below the External Range.
- Full Candle: The entire candle (the highest point of the candle) closes below the External Range.
Internal Range Breakout UP
- Close: Price closes above the Internal Range.
- Real Body: The "real body" of the candle closes above the Internal Range.
- Full Candle: The entire candle closes above the Internal Range.
Internal Range Breakout DOWN
- Close: Price closes below the Internal Range.
- Real Body: The "real body" of the candle closes below the Internal Range.
- Full Candle: The entire candle closes below the Internal Range.
7. Ideal Use Cases
This indicator is ideal for traders who:
Want to clearly identify and monitor price consolidation zones.
Seek confirmation for breakout strategies across various timeframes.
Require reliable and automated alerts for potential entry or exit points based on range expansion.
8. Complementary Indicator
For even more comprehensive market analysis, we highly recommend using this indicator in conjunction with Market Structure Support & Resistance External/Internal & BoS .
This powerful complementary indicator automatically and accurately identifies significant support and resistance levels by locating high and low pivot points, as well as key Pre-Market High/Low levels. Its strength lies in its dynamic adaptability to any timeframe and asset, providing precise and relevant real-time levels while maintaining a clean chart. It also identifies Break of Structure (BoS) to signal potential trend changes or continuations.
Using both indicators together provides a robust framework for identifying defined ranges and potential trend shifts, enabling more informed trading decisions.
View Market Structure Support & Resistance External/Internal & BoS Indicator
9. Important Note: Trading Risk
This indicator is intended for educational and informational purposes only and does not constitute investment advice or a recommendation for trading in any form whatsoever.
Trading in financial markets involves significant risk of capital loss. It is important to remember that past performance is not indicative of future results. All trading decisions are your sole responsibility. Never trade with money you cannot afford to lose.
