Stock Earnings Viewer for Pine ScreenerThe script, titled "Stock Earnings Viewer with Surprise", fetches actual and estimated earnings, calculates absolute and percent surprise values, and presents them for analysis. It is intended to use in Pine Screener, as on chart it is redundant.
How to Apply to Pine Screener
Favorite this script
Open pine screener www.tradingview.com
Select "Stock Earnings Viewer with Surprise" in "Choose indicator"
Click "Scan"
Data
Actual Earnings: The reported earnings per share (EPS) for the stock, sourced via request.earnings().
Estimated Earnings: Analyst-predicted EPS, accessed with field=earnings.estimate.
Absolute Surprise: The difference between actual and estimated earnings (e.g., actual 1.2 - estimated 1.0 = 0.2).
Percent Surprise (%): The absolute surprise as a percentage of estimated earnings (e.g., (0.2 / 1.0) * 100 = 20%). Note: This may return NaN or infinity if estimated earnings are zero, due to division by zero.
Practical Use
This screener script allows users to filter stocks based on earnings metrics. For example, you could screen for stocks where Percent Surprise > 15 to find companies exceeding analyst expectations significantly, or use Absolute Surprise < -0.5 to identify underperformers.
Search in scripts for "the script"

Aggregation BTC CVDThe script calculates the Cumulative Volume Delta (CVD) for multiple cryptocurrency exchanges, then averages these values and plots them.
Indicator Setup:
The script sets up an indicator called "BTC Cumulative Volume Delta (CVD) for multiple cryptocurrency exchanges", displayed as a separate panel (not overlaid on the price chart) with volume format.
Getting 1-minute data from multiple exchanges:
It retrieves 1-minute data (buy and sell volumes) for Bitcoin (BTC) against USD or USDT from several exchanges: Binance, OKEx, Coinbase (both BTCUSDT and BTCUSD), Bitfinex, Bybit, Huobi, and Kraken.
Calculating total buying and selling volume for each exchange:
For each exchange, it calculates the total buying volume (buy_vol_...), selling volume (sell_vol_...), and the difference between them (delta_vol_...).
It then computes the cumulative delta volume (cum_delta_vol_...), which is a running total of delta_vol_....
Calculating the average CVD:
It calculates the average cumulative delta volume (average_cum_delta_vol) by summing the cumulative delta volumes from all exchanges and dividing by the number of exchanges.
Plotting the average CVD:
Finally, it plots the average CVD with white color, and a line width of 2.
This script essentially provides an averaged Cumulative Volume Delta across multiple exchanges, giving a comprehensive view of buying and selling pressure in the Bitcoin market across these platforms.

Stochastic RSI OHLC StrategyThe script titled "Stochastic RSI High Low Close Bars" is a versatile trading strategy implemented in Pine Script, designed for TradingView. Here's an overview of its features:
Description
This strategy leverages the Stochastic RSI to determine entry and exit signals in the market, focusing on high, low, and close values of the indicator. It incorporates various trading styles, stop-loss mechanisms, and multi-timeframe analysis to adapt to different market conditions.
Key Features
Stochastic RSI Analysis:
Uses the Stochastic RSI to identify potential entry points for long and short positions.
Tracks high, low, and close values for more granular analysis.
Multiple Trading Styles:
Supports diverse trading styles like Volume Color Swing, RSI Divergence, RSI Pullback, and more.
Allows switching between these styles to suit market dynamics.
Session-Based Trading:
Offers session control, limiting trades to specific hours (e.g., NY sessions).
Can close all positions at the end of the trading day.
Stop-Loss and Take-Profit Mechanisms:
Includes both static and dynamic stop-losses, with options for time-based stops, trailing stops, and momentum-based exits.
Customizable take-profit levels ensure efficient trade management.
Volume Analysis:
Integrates volume indicators to add a bias for trade entries and exits, enhancing signal reliability.
Multi-Timeframe Integration:
Employs multi-timeframe RSI analysis, allowing the strategy to capture broader trends and optimize entries.
This script is designed to provide flexibility and adaptability, making it useful for different trading strategies and market conditions. It is suitable for traders looking to refine their entries and exits with a focus on the Stochastic RSI.

Engulfing with TrendThe script above is a trading strategy with rules based on the Engulfing candlestick pattern within the context of the trend. Some key elements of this script include:
1. ATR (Average True Range) settings to measure market volatility.
2. Supertrend settings to identify the market trend.
3. Conditions for determining uptrend and downtrend.
4. Determination of Bullish (Engulfing pattern during uptrend) and Bearish (Engulfing pattern during downtrend).
5. Calculation of Stop Loss (SL) and Take Profit (TP) levels based on the Engulfing pattern.
6. Entry conditions based on the Engulfing pattern and the corresponding trend.
7. Exit conditions based on price crossovers with SL and TP levels.
8. Plotting of the Engulfing patterns on the chart.
This strategy is used to identify trading opportunities based on Engulfing candlestick patterns that align with the direction of the market trend. Additionally, stop loss and take profit levels are calculated based on the Engulfing pattern, and trading signals are displayed on the chart.
It's important to note that this script can be customized according to your trading preferences and strategy.

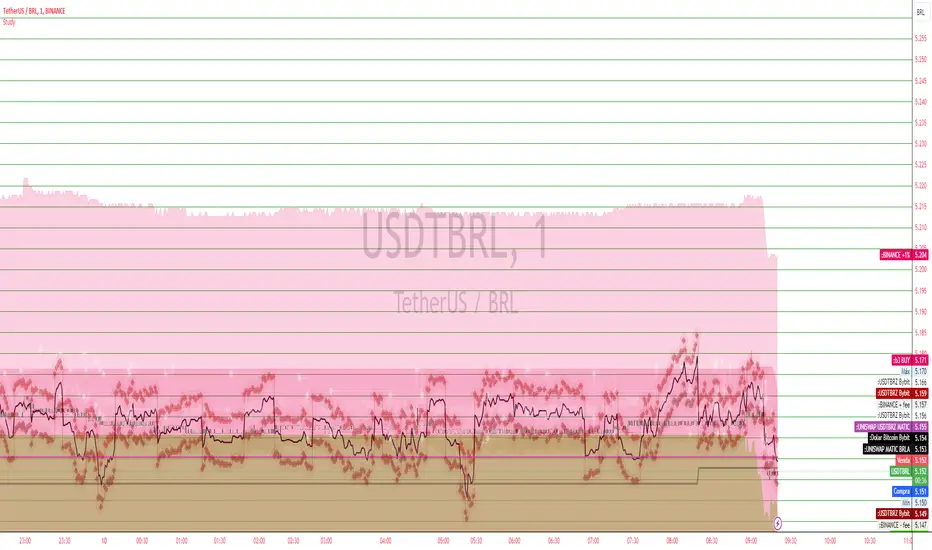
USD BRL Exchange Rate Discrepancy Analysis ScriptThe script is designed to visualize and analyze discrepancies in the exchange rates of USDT to BRL (Tether to Brazilian Real) and USDT to BRZ (Tether to Brazilian Digital Token) across various trading platforms. It fetches the closing prices of multiple trading pairs from different platforms like Bybit, Binance, and Uniswap. The primary focus is to calculate and plot the conversion rate of BTCBRZ (Bitcoin to Brazilian Real) to USD. Additionally, the script highlights the differences in buy and sell rates for USDT-BRL and USDT-BRZ pairs, including fees and percentage adjustments. Visual elements like lines and areas are used to represent these rates, offering a comprehensive view of potential arbitrage opportunities in the Bitcoin market across different exchanges.
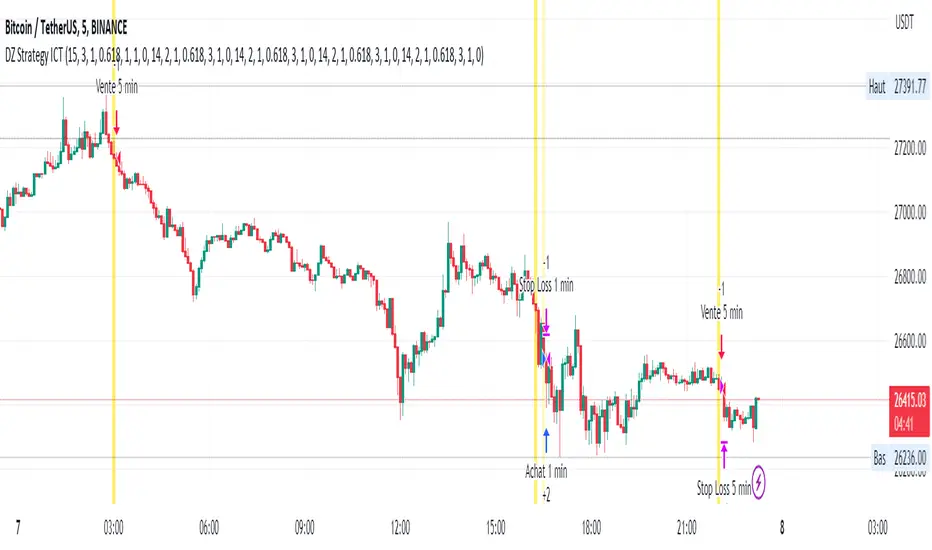
DZ Strategy ICTThe script presented is a trading strategy called "Breaker Block Strategy with Price Channel". This strategy uses multiple time frames (1 minute, 5 minutes, 15 minutes, 1 hour, and 4 hours) to detect support and resistance areas on the chart.
The strategy uses parameters such as length, deviations, multiplier, Fibonacci level, move lag and volume threshold for each time frame. These parameters are adjustable by the user.
The script then calculates support and resistance levels using the simple moving average (SMA) and standard deviation (STDEV) of closing prices for each time frame.
It also detects "Breaker Blocks" based on price movement from support and resistance levels, as well as trade volume. A Breaker Block occurs when there is a significant breakout of a support or resistance level with high volume.
Buy and sell signals are generated based on the presence of a Breaker Block and price movement from support and resistance levels. When a buy signal is generated, a buy order is placed, and when a sell signal is generated, a sell order is placed.
The script also plots price channels for each time frame, representing resistance and support levels.
Profit limit levels are set for each time range, indicating that the price levels assigned to positions should be closed with a profit. Stop-loss levels are also set to limit losses in the event of canceled price movements.
In summary, this trading strategy uses a combination of Breaker Block detection, support and resistance levels, price channels and profit limit levels to generate buy and sell signals and manage positions on different time ranges.
terrible financial advisorThe script you're looking at is a humorous "financial advisor" that places funny and non-traditional investment advice labels on a trading chart. The advice doesn't really have any meaningful connection to real financial indicators or market trends, and it's meant for entertainment purposes only.
Here's how it works:
Every 23 bars on the chart (a bar could represent a day, an hour, or another period, depending on the chart settings), the script places a new label.
The content of each label is determined by the remainder when the current bar number is divided by 10.
Keep in mind that this script is just for fun, and you shouldn't base any real investment decisions on its output!
it works as intended.

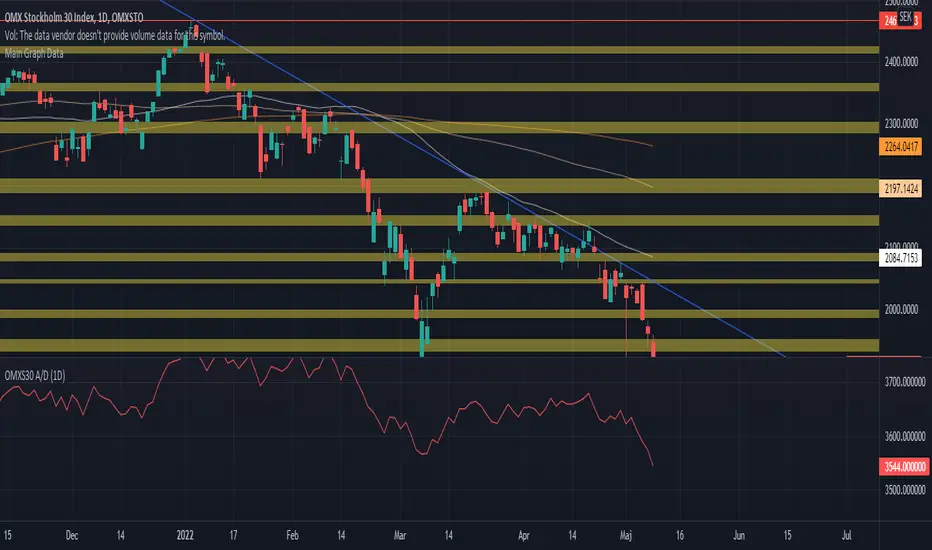
OMXS30 A/DThe script implements the Advance / Decline indicator (A/D) for the Swedish index OMXs30.
The logic for the script is implemented accordingly:
A/D = Ʃ (A - D)
A = Number of daily advancing stocks in the OMXS30 index
D = Number of daily declining stocks in the OMXS30 index
The stocks included in this script as part of the OMXs30 index was last updated 2022-05-09
Cash Gaps on a Future/CFD-ChartThe script is based on the great work of @NgUTech which very nicely prints the gaps on any given chart.
The purpose of this script is to show the gaps to futures or cfd of the underlying cash chart, because very often gap closing provides an opportunity to fade the move.
The script works in the way that the user provides the underlying chart symbol and the current spread of the instruments (cash-future/cfd) and it draws boxes where the cash-gaps are.
If you know a way to automatically calculate the spread of the two instruments, please let me know, thanks.
Michael

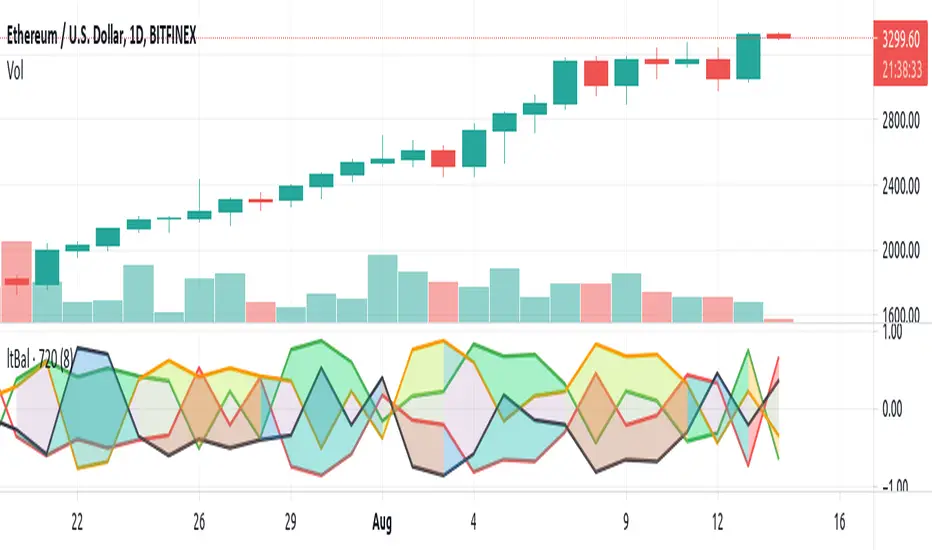
Light BalanceThe script is simple, going for a color scheme logic which tenderly avoids rigorous signals processing.
For the script to remain simple, logical derivatives are also out; as such, there are no secondary relations built off of primary ones. And it also ignores (unless you do this yourself) the logic in a varying order of lines.
Coloring has been done according to a limited set of relations between the four (4) plotted lines.
Quite a bit of information is capture, as you'll see when looking at line order, crossings, and transparency transitions and their patterns.
The approach makes the relations ones which can be learned over time; you become the algorithm to sort out signals. Ha ha. I know that sounds like a cop out doesn't it. Did I mention it's a simple script?
One thing you might want to play with right away are fills having red and green, and lime and fuchsia. It would be cool to reduce it all down to two (2) colors, but all the boolean relations might have to be listed, and it also may not be possible to cumulatively combine transparency overlays of the same value. Visually, that approach may not result to awaken a useful feature anyway. Also, fill() has its limitations in that it cannot be in a local scope; this includes function wrapped calls to fill(), or calls made using branching logic statements if/elseif, iff(), and var = (cond) ? t_val/exp : f_val/exp. So, to my knowledge, a fill() can not be made to be logically on/off.
Please, enjoy getting some use out of it.
FullPac4Trader (I.Denis)The script combines the three most important indicators on the chart.
1. A set of six moving averages ( EMA and SMA ), which can be turned on and adjusted at your discretion.
2. Indication of support and resistance levels, calculated according to the Bollinger scheme.
3. Pivot Point and the nearest goals using the Floor method with the possibility of selecting a time period.
The script version is v.1 (beta)
The development of this script will continue. Feedback and suggestions are welcome.
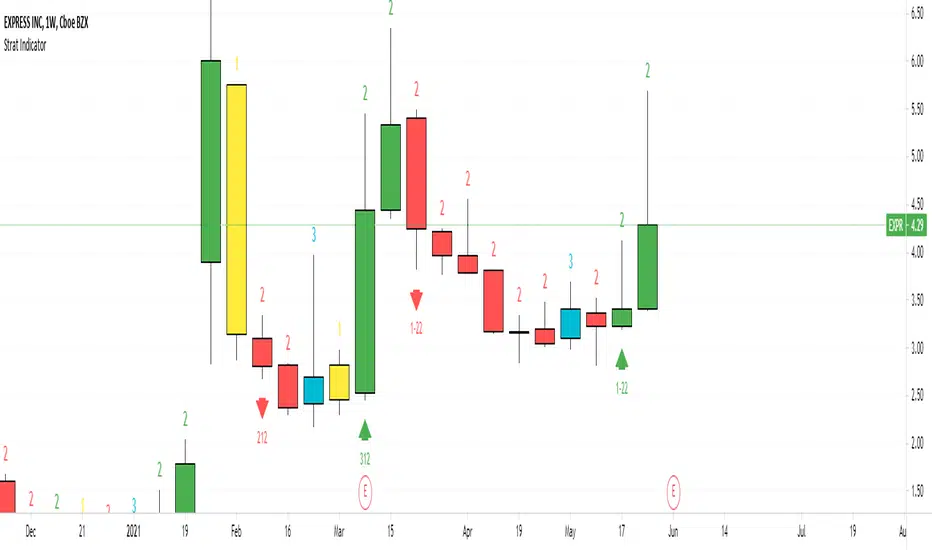
Strat IndicatorThe script implements the Strat method of trading.
Script will label the candles as 1,2,3 where 1 = inside candle. 2 = trend candle, 3 = outside candle.
The bullish , bearish and continuation patterns are labelled with the relevant strat combination
and up, down rrows.
Some setups are
2-1-2 Bearish Reversal = 2 green candle, 1 inside candle, 2 red candle
This indicator can be used in all timeframes.
It can be used on Split screen
for Intraday 1 hour & 15 min
For Swing 1 day & 1 hour
For Long term 1 week & 1 day
For 6 continuous 2 candles, the script will mark the candle as PMG "Pivot Machine Gun" this a big reversal.
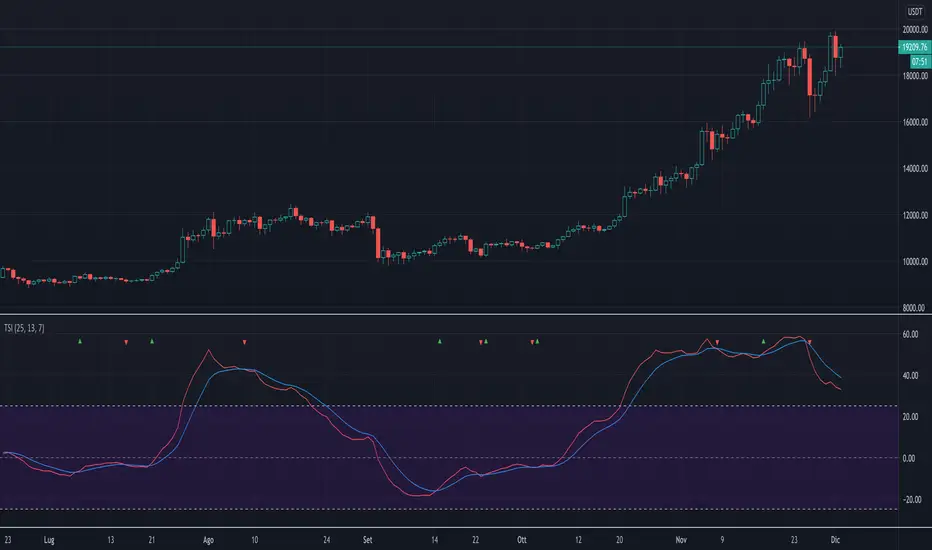
True Strength IndexThe script implements a custom version of TSI (True Strength Index). This index may be useful for determining overbought and oversold conditions, indicating potential trend direction changes via centerline or signal line crossovers, and warning of trend weakness through divergence.
The script highlights when TSI line crosses the signal line with a colored triangle, that is
when the TSI line crosses above the signal line from below, that may warrant buying, a green triangle that's pointing up is drawned;
when the TSI line crosses below the signal line from above, that may warrant selling, a red triangle that's pointing down is drawned.
Note: Signal line crossovers occur frequently, so should be utilized only in conjunction with other signals from the TSI.
The script is very easy to use and it is possible to change the following parameters:
EMA smoothing period for momentum (default value is 25)
EMA smoothing period for smoothed momentum (default value is 13)
Signal line period (default value is 7)
The type of signal line: EMA or SMA (default value is EMA)
Show or not the TSI line
Show or not the signal line
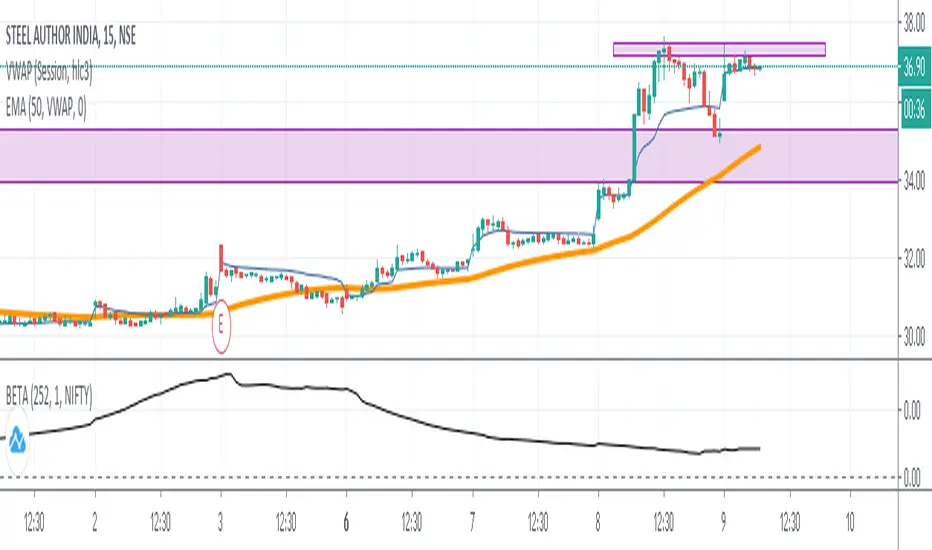
Beta 252 Days (NIFTY 50) by AkshayThe script derives the Beta Value of 252 days of a stock with Benchmark Index NIFTY 50. Note:- I have edited the script using an existing Beta script by Ricardo Santos. Thank you to him! :)
Data structure ListThe script shows a workaround for list in pine-script via drawings.
There are few restrictions with them:
1. The size of the list cannot be more that amount of allowed drawings (about 40 by now)
2. Because the list shares the space of drawings throughout the whole script, using drawings with the list must be careful, with handly creating and removing of each drawing, because otherwise pine's garbage collector might break the list
3. Setters and Getters must be called on every bar, because of implementation of functions in pine there are inner serieses, which must be updated on every bar. So wherever you have a setter or getter in the code - it must be called on every bar. But if it's just an update, then you should pass 'false' as a param of the funtion.
And an example of using the list - reversing of the list. When the list have been created, it's filled on every bar and then gets reversed. Plots show result before and after reversing of the list.
There are also some pieces of commented code showing possible way of working with another funtions of the list.

Data Structure StackThe script shows a workaround for stack in pine-script via drawings.
There are few restrictions with them:
1. The depth of the stack cannot be more that amount of allowed drawings (about 40 by now)
2. Because the stack shares the space of drawings throughout the whole script, using drawings with the stack must be careful, with handly creating and removing of each drawing, because otherwise pine's garbage collector might break the stack
3. push() and pop() must be called on every bar, because of implementation of functions in pine there are inner serieses, which must be updated on every bar. So wherever you have a setter or getter in the code - it must be called on every bar. But if it's just an update, then you should pass 'false' as a param of the funtion.
And the example of using the stack: if the stack is empty - then fill it and taking by a value per bar till the stack is emty and then fill it again.

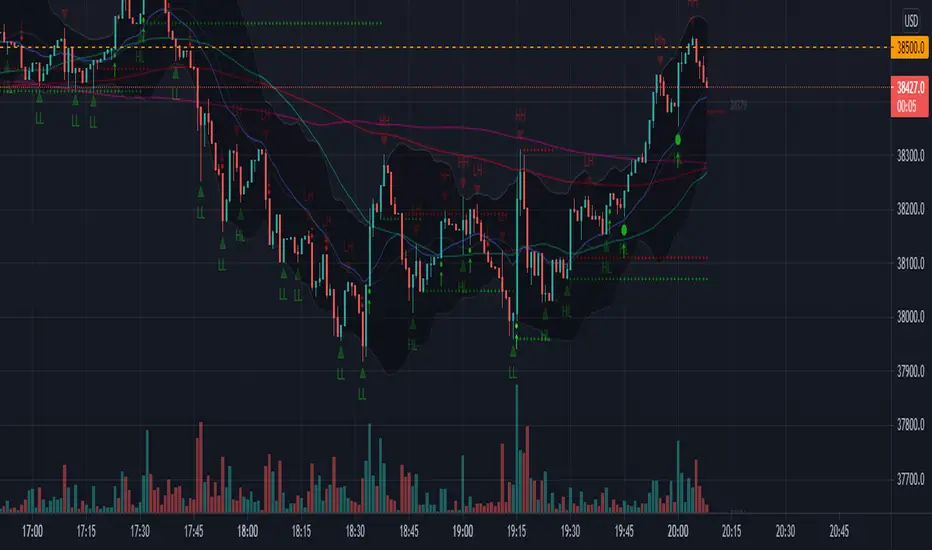
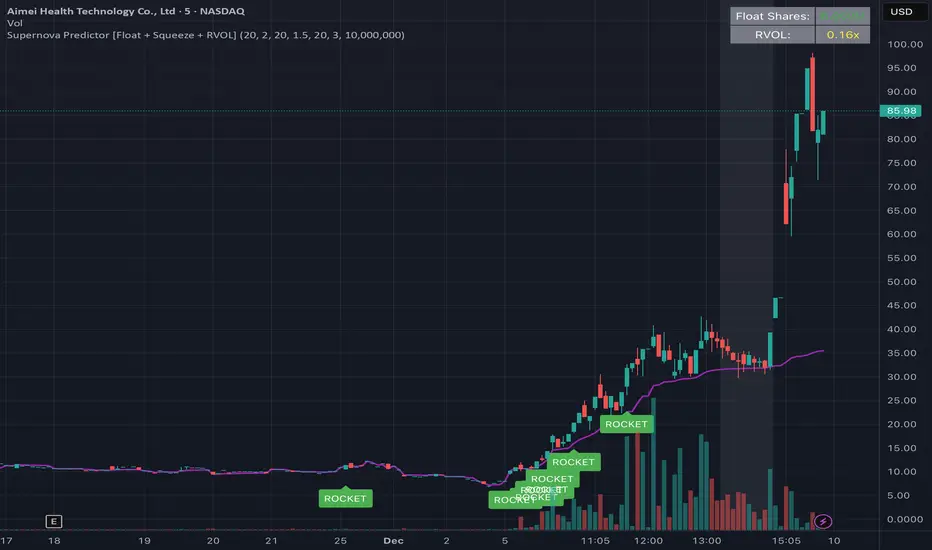
W Alart Supernova Predictor [Float + Squeeze + RVOL]the script will automatically fetch the Float size of the stock you are looking at.
If the Float is Low (< 10M), it will show a "Low Float" label on the chart.
The "ROCKET" alert will ONLY fire if the stock is actually a Low Float stock. This prevents you from getting false signals on heavy stocks like Apple or Tesla.
How to read the signals on your chart
The Grey Background (The Warning):
When you see the background of the chart turn Grey, this indicates a Squeeze.
This matches the left side of your screenshot where the price was flat. It tells you: "Pay attention, energy is building up."
The Purple Line:
This is the VWAP. Generally, you only want to take long trades when the price is above this line.
The "ROCKET" Label:
This label will appear only when three things happen at once:
Price breaks the upper Bollinger Band.
Price is above VWAP.
Volume is 2.5x higher than average (you can change this number in settings).
******A Crucial Note on "False Positives"****
This script is designed to catch the start of the move. However, sometimes a stock will break out and then immediately fail (a "fake out").
To protect yourself, professional traders usually wait for the candle with the "ROCKET" signal to close, and then enter the trade only if the next candle breaks the high of that signal candle.
DMI_HMA Oscillator Smoothed by HMA v2The script provided, titled "DMI_HMA Oscillator Smoothed by HMA v2," is a technical analysis tool written in Pine Script (Version 6) for the TradingView platform. It represents a hybrid approach to momentum trading, combining the directional insight of the Directional Movement Index (DMI) with the noise-reduction capabilities of the Hull Moving Average (HMA). The purpose of this indicator is to provide a cleaner, lag-reduced view of market trend strength and direction, filtering out the erratic noise often associated with raw DMI readings.
Using this indicator is highly appropriate for traders who struggle with the "noise" of standard momentum indicators but cannot afford the delay of traditional smoothing.
Noise Reduction: Standard DMI crossovers can trigger frequently in sideways markets. The HMA smoothing suppresses these minor fluctuations, helping traders stay in a trade longer without being shaken out by temporary volatility.
Lag Management: Most smoothing techniques (like SMA or EMA) introduce significant lag, making signals arrive too late. The HMA is specifically designed to minimize this, making it an excellent choice for a leading indicator like DMI.
Clarity: By converting the two-line DMI system into a single oscillator relative to a zero line, the visual complexity is reduced. A trader simply needs to observe if the teal line is above or below the gray dashed zero line.
Conclusion: The DMI_HMA Oscillator is a sophisticated yet elegant tool. It effectively addresses the primary weakness of the standard DMI (noise) without sacrificing its primary strength (responsiveness). It is best used as a trend-confirmation tool in conjunction with price action analysis, serving as a reliable filter for determining the prevailing market bias.

BTC CB Discount / PremiumThe scripts shows the difference between BTCUSD on Coinbase and BTCUSDT on Binance - also known as CB Premium & Discount.

Coefficient of Variance BarsThe script calculates the Coefficient of Variance (CV), which is the standard deviation (a measure of volatility) divided by the average price over a set period. In simple terms, it tells you how volatile the market is in relation to its current price level.
• Highlighting Volatility Increase: By default, the script colors the bars when this relative volatility makes a new high. This suggests that the market is "waking up" and that a significant price move could be starting.
• Highlighting Low Volatility (Inverse Mode): When you uncheck the box in the settings, it highlights periods where volatility is not making a new high. This is useful for spotting quiet, consolidating markets.
________________________________________
How to Use It in Trading
This indicator is a complementary tool and should be used with other forms of analysis, like price action or trend indicators.
1. Spotting Potential Breakouts
The most common use is to anticipate breakouts. When the price is moving in a tight range (consolidation) and you suddenly see a highlighted bar, it signals a surge in volatility. This is often the catalyst that pushes the price out of the range.
• Strategy: Look for a period of price consolidation. When a bar is colored, indicating a volatility spike, look for a confirmation of a breakout (e.g., a candle closing above resistance or below support) and consider entering a trade in that direction.
2. Identifying Ranging Markets
By switching to the inverse mode, you can easily see when the market is quiet and range-bound.
• Strategy: When the bars are consistently highlighted in inverse mode, it confirms a ranging market. This is the ideal environment for strategies that capitalize on sideways movement, such as using oscillators (like RSI or Stochastics) to trade between support and resistance levels.
3. Gauging Trend Strength and Exhaustion
In a strong, ongoing trend, you'll likely see intermittent volatility spikes confirming the momentum. However, a sudden, massive spike in volatility after a very long trend might signal a "climax," potentially indicating the trend is exhausted and a reversal could be near.

Dynamic VWAP Levels (V1.0)The script calculates bands around the VWAP (Volume Weighted Average Price) using the Average True Range (ATR) to adjust the levels according to market reality. Buy and sell signals are generated when the price crosses these bands.
Customizable Parameters SmoothingLength (SmoothLength): The period used to smooth the levels. A higher value results in smoother bands that are less susceptible to rapid fluctuations.
Use EMA for smoothing?: Selects between using the Exponential Moving Average (EMA) or the Simple Moving Average (SMA) for smoothing.
ATR Length: The period used to calculate the ATR, which determines the frequency.
ATR Multiplier: A multiplier that adjusts the amplitude of the bands around the VWAP.
How the Script Works Calculating VWAP and Bands: The VWAP is calculated to obtain the volume weighted average price.
Bands are created around the VWAP by adding or subtracting a fraction of the ATR to account for the current market variation.
Smoothing Application: Price levels are smoothed to reduce market noise, allowing for better visualization of trends.
Signal Generation: Buy Signal: Generated when price crosses upwards the smoothed lower band (default dp7_smooth).
Sell Signal: Generated when price crosses downwards the smoothed upper band (default dp1_smooth).

Optimized WaveletsThe script, High-Resolution Volume-Price Pressure Indicator with Wavelets, utilizes wavelet transforms and high-resolution data to analyze market pressure based on volume and price dynamics. The approach combines volume data from smaller timeframes (1 second) with non-linear transformation techniques to generate a refined view of market conditions. Here’s a detailed breakdown of how it works:
Key Components:
Wavelet Transform:
A wavelet function is applied to the price and volume data to capture patterns over a set time period. This technique helps identify underlying structures in the data that might be missed with traditional moving averages.
High-Resolution Data:
The indicator fetches 1-second high-resolution data for price movements and volume. This allows the strategy to capture granular price and volume changes, crucial for short-term trading decisions.
Normalized Difference:
The script calculates the normalized difference in price and volume data. By comparing changes over the selected length, it standardizes these movements to help detect sudden shifts in market pressure.
Sigmoid Transformation:
After combining the price and volume wavelet data, a sigmoid function is applied to smooth out the resulting values. This non-linear transformation helps highlight significant moves while filtering out minor fluctuations.
Volume-Price Pressure:
The up and down volume differences, together with price movements, are combined to create a "Volume-Price Pressure Score." The final indicator reflects the pressure exerted on the market by both buyers and sellers.
Indicator Plot:
The final transformed score is plotted, showing how price and volume dynamics, combined through wavelet transformation, interact. The indicator can be used to identify potential market turning points or pressure buildups based on volume and price movement patterns.
This approach is well-suited for traders looking for advanced signal detection based on high-frequency data and can provide insight into areas where typical indicators may lag or overlook short-term volatility.

D2MAThe script is called "D2MA" (Distance to Moving Average). It calculates the distance between the closing price and a user-selected type of moving average (MA). It also plots this distance on a chart, allowing users to see how far the price is from the chosen moving average. Users can choose to display this distance as either an absolute value or as a percentage.
Input Parameters
Length (len): The number of bars (or periods) used to calculate the moving average.
Source (src): The price data used for calculations, typically the closing price.
Percentage Distance (pc): A boolean option to display the distance as a percentage instead of an absolute value.
MA Type (maType): The type of moving average to use.
Simple Moving Average (SMA)
Exponential Moving Average (EMA)
Hull Moving Average (HMA)
Arnaud Legoux Moving Average (ALMA)
Triple Exponential Moving Average (T3)
Power Weighted Moving Average (PWMA)
The script includes functions to calculate different types of moving averages:
The difference between the source price (e.g., closing price) and the calculated moving average. if Distance as Percentage , the distance expressed as a percentage of the moving average value.
Plotting the Data
Signal Line: The signal line changes colour (green or red) based on whether the distance is increasing or decreasing.
Visual Representation
How to Use
Identify Trends: By seeing how far the price is from a selected moving average, traders can gauge the strength of a trend.
Spot Reversals: Significant deviations from the moving average can signal potential reversals.
