QuantCat Chande Swinger StrategyQuantCat Chande Swinger
This strategy is designed to be used on the 1 minute with mainly bitcoin, and cryptocurrencies. But parameters can be adjusted to ANY pair.
After some long research about chande momentum oscillator, I decided to create a strategy using normal distribution percentage levels to snipe entries. This in turn on the 1 minute can create a nice profit over a consecutive amount of days, the end goal is to get a stronger version of this strategy running on a bot and print some money. This strategy is tightly defined, and can be loosened up to make more trades too- giving a higher sample size and better sharpe ratio.
The strategy checks to see if the Chande value is in an extreme percentile based on the last few hundred chande values- if it is it will open a position.
No stoploss or take profit implemented into the swinger yet, but this will be the next addition to really minimise loss and amplify potential profits.
Any liquid crypto pair on the low timesframes will net a good result with this strategy.
We also have a free 15M and 1H strategy available too.
You can join our discord server to get live alerts for the strategies as well as speak to our devs! Link in signature below!!!
Search in scripts for "the strat"

QuantCat Mom Finder Strategy (1H)QuantCat Momentum Finder Strategy
This strategy is designed to be used on the 1 hour time frame, on all x/btc pairs.
The beautiful thing is it plots the take profit, and stoploss for you for each entry- where I would say use the stoploss for sure and feel with water with how the price action is looking when in profit.
In this strategy, I actually implemented my own trading style into building the strategy. Having to replicate my own trading strategy into an algorithm, I can't make it exactly perfect to how I would trade, but what I can do is try and program the parameters that give it the absolute best chance of making a big move with a small drawdown- which replicates part of my momentum trading style. Here I am using RSI, MACD, EMA and trend filtering values to find moments where there has been a momentum change to play the rest of the move. It only picks the best entries.
There is always a 3-4 R/R move on average with with these trades, meaning 1 in 4 only need to hit to be a break even trader- where most of these strategies have about 35% hit rate.
The stoploss is so crucial to minimise any damage from huge unexpected candles, the strategies can just be used for entries as well, you don't have to stick to the exact formula- of the long and short system, but this by itself is profitable.
The system nets positive results on
-ETH/BTC
-LTC/BTC
-XRP/BTC
-ADA/BTC
-NEO/BTC etc.
We also have a free 15M strategy available too.
You can join our discord server to get live alerts for the strategy as well as speak to our devs! Link in signature below!!!

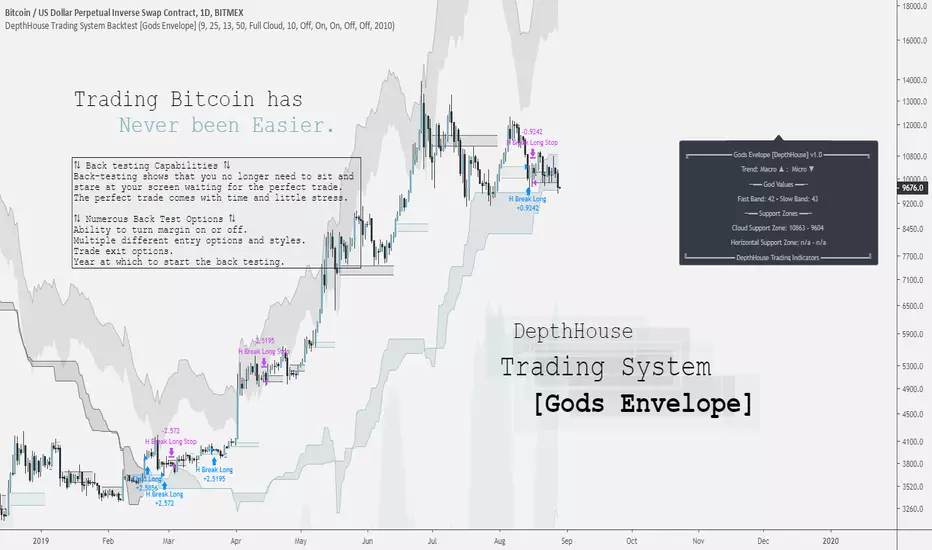
DepthHouse Trading System [Gods Envelope] Backtest StrategyCreated for Bitcoin!
*All testing has been done on the 1 Day time frame of BTC USD pairs.
Use at your own risk.
DepthHouse Trading System Basics
The Cloud:
The cloud is used in a very similar manner as the ichimoku cloud. A complete cross above or below the represents a macro trend change. The cloud then could be used as dynamic support and resistance zones.
By default there is no smoothing to the full cloud. If you wish to add smoothing, you can change the ‘Trend Base On’ option to ‘Modded Cloud Average’ to add price action and smoothing into the cloud’s calculations. The Modded Cloud can then be used in the same manner as the Full Cloud. Generally, the Full Cloud is more forgiving and has less Macro Trend changes. By default, this option is turned off. The support or resistance zone created will be shown on the info panel on the right.
Horizontal Levels:
A Horizonal zone is generated each time there is a micro level trend change. For example, as soon as a positive micro trend change occurs a green horizontal level will be plotted.
These levels then can be used as temporary support and resistance zones. The Horizontal Break Trading Strategy is entirely based on these levels. These levels are also shown on the info panel on the right.
The Envelope Itself: (by default this is off)
By selecting the Overbought and Oversold Ranges option, a cloud envelope will appear around the price action. This envelope represents the overbought and oversold ranges. If the price action should go into these zones, the info panel on the right will show ‘CAUTION’ beside the God Values as this signals that the pair is either overbought or oversold.
The God Values:
The God values are listed on the info panel on the right. These are the values created by the Godmode indicator. Generally, below 20 or above 80 it signals for caution as the price action has overextended itself.
The Back-Test Strategy Options:
⇅ - Child Fomo Positioning:
Child Fomo Positioning strategy is entirely based on the macro trend change with the center cloud. As soon as there is a complete candle close above or below the cloud and a trend change takes place. The back-test places a market order as soon as the next candle opens. By default, it then will not close this position until the price action fully crosses the cloud once again.
⇅ - Horizontal Break Trading:
Horizontal Break Trading Strategy is entirely based on the horizontal levels generated and the macro trend direction. For example, say the Macro Trend is up, and a green, positive horizontal level is formed. As soon as a complete candle closes above the upper level of the positive zone, a limit order is placed in hope that the price action comes back down and retests, filling the order. This long will not close then until a negative level is formed. As soon as a negative level is formed a stop/loss order is placed on the lower level of the horizontal support zone. It will then do the opposite in a bearish trend, and margin trading is turned on.
⇅ - Parent Positions :
Parent Positioning Strategy is based on the overall trend and the center cloud levels. This strategy has limit orders waiting on the level of the cloud that is closest to the price action. Therefore, using this strategy alone, the back-test system waits for the trend to be confirmed, and then follows the price action with limit orders waiting on the cloud to be retested. By default this order does not close until a Marco trend change occurs.
⇅ - Take 50% Partial Profits:
This options allows the back-test to take 50% profit or loss when one of the two options occur.
Horizontal Break: This would close 50% of the position in the same manner it would close a trade using the horizontal break trading system.
God Values: Once the price action enters the oversold or overbought clouds, it would then place a close order as soon as the price action exits the cloud.
⟲ - Backtest Year Start Date :
Start year of the back-testing. If set to ex. 2017, the back-test will not calculate any trades that took place before Jan. 1 of 2017.
⚖ - Margin Trading :
By default, margin trading is turned off. Simply switch this option to on the enable ‘Short Trading’ into the strategy back-test.
Notes: If you are back testing multiple strategies at the same time, you must increase the pyramiding to correspond to the number or strategies.
My Favorite Settings:
Margin = Off
Pyramiding = 2 [Settings → Properties → Pyramiding → 2 orders
Child Fomo Positioning = On
Horizontal Break Trading = On
Everything else off 😊
DISCLAIMER: Past performance does not guarantee future results.
Use at your own risk.
Combo Backtest 123 Reversal & CMO & WMA This is combo strategies for get a cumulative signal.
First strategy
This System was created from the Book "How I Tripled My Money In The
Futures Market" by Ulf Jensen, Page 183. This is reverse type of strategies.
The strategy buys at market, if close price is higher than the previous close
during 2 days and the meaning of 9-days Stochastic Slow Oscillator is lower than 50.
The strategy sells at market, if close price is lower than the previous close price
during 2 days and the meaning of 9-days Stochastic Fast Oscillator is higher than 50.
Second strategy
This indicator plots Chande Momentum Oscillator and its WMA on the
same chart. This indicator plots the absolute value of CMO.
The CMO is closely related to, yet unique from, other momentum oriented
indicators such as Relative Strength Index, Stochastic, Rate-of-Change,
etc. It is most closely related to Welles Wilder?s RSI, yet it differs
in several ways:
- It uses data for both up days and down days in the numerator, thereby
directly measuring momentum;
- The calculations are applied on unsmoothed data. Therefore, short-term
extreme movements in price are not hidden. Once calculated, smoothing
can be applied to the CMO, if desired;
- The scale is bounded between +100 and -100, thereby allowing you to clearly
see changes in net momentum using the 0 level. The bounded scale also allows
you to conveniently compare values across different securities.
WARNING:
- For purpose educate only
- This script to change bars colors.

Combo Backtest 123 Reversal & Chande Momentum Oscillator This is combo strategies for get a cumulative signal.
First strategy
This System was created from the Book "How I Tripled My Money In The
Futures Market" by Ulf Jensen, Page 183. This is reverse type of strategies.
The strategy buys at market, if close price is higher than the previous close
during 2 days and the meaning of 9-days Stochastic Slow Oscillator is lower than 50.
The strategy sells at market, if close price is lower than the previous close price
during 2 days and the meaning of 9-days Stochastic Fast Oscillator is higher than 50.
Second strategy
This indicator plots Chande Momentum Oscillator. This indicator was
developed by Tushar Chande. A scientist, an inventor, and a respected
trading system developer, Mr. Chande developed the CMO to capture what
he calls "pure momentum". For more definitive information on the CMO and
other indicators we recommend the book The New Technical Trader by Tushar
Chande and Stanley Kroll.
The CMO is closely related to, yet unique from, other momentum oriented
indicators such as Relative Strength Index, Stochastic, Rate-of-Change,
etc. It is most closely related to Welles Wilder`s RSI, yet it differs
in several ways:
- It uses data for both up days and down days in the numerator, thereby
directly measuring momentum;
- The calculations are applied on unsmoothed data. Therefore, short-term
extreme movements in price are not hidden. Once calculated, smoothing
can be applied to the CMO, if desired;
- The scale is bounded between +100 and -100, thereby allowing you to
clearly see changes in net momentum using the 0 level. The bounded scale
also allows you to conveniently compare values across different securities.
WARNING:
- For purpose educate only
- This script to change bars colors

Combo Backtest 123 Reversal & Chande Forecast Oscillator This is combo strategies for get a cumulative signal.
First strategy
This System was created from the Book "How I Tripled My Money In The
Futures Market" by Ulf Jensen, Page 183. This is reverse type of strategies.
The strategy buys at market, if close price is higher than the previous close
during 2 days and the meaning of 9-days Stochastic Slow Oscillator is lower than 50.
The strategy sells at market, if close price is lower than the previous close price
during 2 days and the meaning of 9-days Stochastic Fast Oscillator is higher than 50.
Second strategy
The Chande Forecast Oscillator developed by Tushar Chande The Forecast
Oscillator plots the percentage difference between the closing price and
the n-period linear regression forecasted price. The oscillator is above
zero when the forecast price is greater than the closing price and less
than zero if it is below.
WARNING:
- For purpose educate only
- This script to change bars colors.
SUPERTREND ATR WITH TRAILING STOP LOSS## THIS SCRIPT IS ON GITHUB
## MORE BACKTEST
SuperTrend is a moving stop and reversal line based on the volatility (ATR).
The strategy will ride up your stop loss when price moviment 1%.
The strategy will close your operation when the market price crossed the stop loss.
The strategy will close operation when the line based on the volatility will crossed
The strategy has the following parameters:
+ **ATR PERIOD** - To select number of bars back to execute calculation
+ **ATR MULTPLIER** - To add a multplier factor on volatility
+ **INITIAL STOP LOSS** - Where can isert the value to first stop.
+ **POSITION TYPE** - Where can to select trade position.
+ **BACKTEST PERIOD** - To select range.
## DISCLAIMER
1. I am not licensed financial advisors or broker dealers. I do not tell you when or what to buy or sell. I developed this software which enables you execute manual or automated trades multiple trades using TradingView. The software allows you to set the criteria you want for entering and exiting trades.
2. Do not trade with money you cannot afford to lose.
3. I do not guarantee consistent profits or that anyone can make money with no effort. And I am not selling the holy grail.
4. Every system can have winning and losing streaks.
5. Money management plays a large role in the results of your trading. For example: lot size, account size, broker leverage, and broker margin call rules all have an effect on results. Also, your Take Profit and Stop Loss settings for individual pair trades and for overall account equity have a major impact on results. If you are new to trading and do not understand these items, then I recommend you seek education materials to further your knowledge.
**YOU NEED TO FIND AND USE THE TRADING SYSTEM THAT WORKS BEST FOR YOU AND YOUR TRADING TOLERANCE.**
**I HAVE PROVIDED NOTHING MORE THAN A TOOL WITH OPTIONS FOR YOU TO TRADE WITH THIS PROGRAM ON TRADINGVIEW.**
## NOTE
I accept suggestions to improve the script.
If you encounter any problems i will be happy to share with me.
+ Authors: @exit490
+ Revision: v1.0.0
+ Date: 5-Aug-2019
+ Pinescript version: 4
## LICENSE
Copyright 2019 Mauricio Pimenta / exit490
SuperTrend with Trailing Stop Loss script may be freely distributed under the (../LICENSE).

TRAILING STOP LOSS TO LONG AND SHORT##THIS SCRIPT IS ON GITHUB
This TradingView strategy it is designed to integrate with other strategies with indicators.
It performs a trailing stop loss from entry and exit conditions.
In this strategy you can add conditions for long and short positions.
The strategy will ride up your stop loss when price moviment 1%.
The strategy will close your operation when the market price crossed the stop loss.
Also is possible to select the period that strategy will execute the backtest.
The strategy has the following parameters:
+ **INITIAL STOP LOSS** - Where can isert the value to first stop.
+ **POSITION TYPE** - Where can to select trade position.
+ **BACKTEST PERIOD** - To select range.
## DISCLAIMER
1. I am not licensed financial advisors or broker dealers. I do not tell you when or what to buy or sell. I developed this software which enables you execute manual or automated trades multiple trades using TradingView. The software allows you to set the criteria you want for entering and exiting trades.
2. Do not trade with money you cannot afford to lose.
3. I do not guarantee consistent profits or that anyone can make money with no effort. And I am not selling the holy grail.
4. Every system can have winning and losing streaks.
5. Money management plays a large role in the results of your trading. For example: lot size, account size, broker leverage, and broker margin call rules all have an effect on results. Also, your Take Profit and Stop Loss settings for individual pair trades and for overall account equity have a major impact on results. If you are new to trading and do not understand these items, then I recommend you seek education materials to further your knowledge.
**YOU NEED TO FIND AND USE THE TRADING SYSTEM THAT WORKS BEST FOR YOU AND YOUR TRADING TOLERANCE.**
**I HAVE PROVIDED NOTHING MORE THAN A TOOL WITH OPTIONS FOR YOU TO TRADE WITH THIS PROGRAM ON TRADINGVIEW.**
## NOTE
I accept suggestions to improve the script.
If you encounter any problems I will be happy to share with me.
+ Authors: @exit490
+ Revision: v1.0.0
+ Date: 03-Aug-2019
+ Pinescript version: 4
## LICENSE
Copyright 2019 Mauricio Pimenta / exit490
Trailing Stop Loss script may be freely distributed under the MIT license .

Combo Backtest 123 Reversal & Chaikin Volatility This is combo strategies for get a cumulative signal.
First strategy
This System was created from the Book "How I Tripled My Money In The
Futures Market" by Ulf Jensen, Page 183. This is reverse type of strategies.
The strategy buys at market, if close price is higher than the previous close
during 2 days and the meaning of 9-days Stochastic Slow Oscillator is lower than 50.
The strategy sells at market, if close price is lower than the previous close price
during 2 days and the meaning of 9-days Stochastic Fast Oscillator is higher than 50.
Second strategy
Chaikin's Volatility indicator compares the spread between a security's
high and low prices. It quantifies volatility as a widening of the range
between the high and the low price.
You can use in the xPrice1 and xPrice2 any series: Open, High, Low, Close, HL2,
HLC3, OHLC4 and ect...
WARNING:
- For purpose educate only
- This script to change bars colors.

Combo Backtest 123 Reversal & Center Of Gravity This is combo strategies for get a cumulative signal.
First strategy
This System was created from the Book "How I Tripled My Money In The
Futures Market" by Ulf Jensen, Page 183. This is reverse type of strategies.
The strategy buys at market, if close price is higher than the previous close
during 2 days and the meaning of 9-days Stochastic Slow Oscillator is lower than 50.
The strategy sells at market, if close price is lower than the previous close price
during 2 days and the meaning of 9-days Stochastic Fast Oscillator is higher than 50.
Second strategy
The indicator is based on moving averages. On the basis of these, the
"center" of the price is calculated, and price channels are also constructed,
which act as corridors for the asset quotations.
WARNING:
- For purpose educate only
- This script to change bars colors.
Combo Strategy 123 Reversal & CCI This is combo strategies for get a cumulative signal.
First strategy
This System was created from the Book "How I Tripled My Money In The
Futures Market" by Ulf Jensen, Page 183. This is reverse type of strategies.
The strategy buys at market, if close price is higher than the previous close
during 2 days and the meaning of 9-days Stochastic Slow Oscillator is lower than 50.
The strategy sells at market, if close price is lower than the previous close price
during 2 days and the meaning of 9-days Stochastic Fast Oscillator is higher than 50.
Second strategy
The Commodity Channel Index (CCI) is best used with markets that display cyclical or
seasonal characteristics, and is formulated to detect the beginning and ending of these
cycles by incorporating a moving average together with a divisor that reflects both possible
and actual trading ranges. The final index measures the deviation from normal, which indicates
major changes in market trend.
To put it simply, the Commodity Channel Index (CCI) value shows how the instrument is trading
relative to its mean (average) price. When the CCI value is high, it means that the prices are
high compared to the average price; when the CCI value is down, it means that the prices are low
compared to the average price. The CCI value usually does not fall outside the -300 to 300 range
and, in fact, is usually in the -100 to 100 range.
WARNING:
- For purpose educate only
- This script to change bars colors.

kiska clouds backtest editionkiska clouds: crypto twitter's next cloud meme
Crypto is a fast-paced, highly-volatile asset, therefore, many traditional strategies are thrown out of the window when applied to cryptocurrency markets. In trading, there are only two things known for sure: price and volume . Price and volume data is then manipulated using various math equations in an effort to discover patterns and/or make predictions. kiska clouds are no different.
The kiska clouds are a simple crossover strategy. The clouds are different because of the unique averages being used and the embedded momentum indicator .
To use the clouds is simple:
When the green line crosses above the pink line, you buy/long.
When the green line crosses below the pink line, you sell/short.
The clouds are indicative of the trend's momentum. Using the power of math, the larger the cloud indicates a higher amount of buying/selling pressure. As the cloud thins, momentum is slowing, and the trend may be reversing.
At the time of testing, the strategy had a profitability of 54.55% accuracy with 1133.41% net profit. While I think this could be automated into a bot, adding a human element with stop losses and further analysis will significantly improve the accuracy/profitability.
This indicator is the backtest version of the kiska clouds (). For a trial or to purchase this indicator, send me a message on Twitter @moonkiska or here on TradingView. You will be granted a 2-3 day trial period to the backtesting strategy.

Double 7's StrategyStrategy described in the book "Short Term Trading Strategies that Work", written by Larry Connors and Cesar Alvarez.
It is the simplest strategy I know and has only 3 rules:
- Price must be above the arithmetic moving average of 200 periods.
- Buy when the price closes below the closing of the last 7 days.
- Sale when the price closes above the closing of the last 7 days.
Simple as it may seem, this strategy works very well in some stocks and/or graphical times (in some stocks it overcomes many RSI 2 strategies). It was developed for the daily chart and does not usually work well on weekly or monthly charts, but can be used for day trades if the back-test proves to be favorable.
If you want, you can change the input and output rules by setting other values for the input or output period and thus find more positive results for specific stocks.
There is no stop loss because in tests the stop loss usually reduces the gains of the strategy.
Good luck and good trades.
================================
Estrategia descrita no livro "Short Term Trading Strategies that Work", escrito por Larry Connors e Cesar Alvarez.
É a estratégia mais simples que eu conheço e tem apenas 3 regras:
- Preço deve estar acima da média móvel aritmética de 200 períodos.
- Compre quando o preço fechar abaixo do fechamento dos ultimos 7 dias.
- Venda quando o preço fechar acima do fechamento dos ultimos 7 dias.
Por mais simples que pareça, esta estratégia funciona muito bem em alguns papeis e/ou tempos gráficos (em alguns papeis a mesma supera muitas estratégias pelo IFR2). A mesma foi desenvolvida para o gráfico diário e normalmente não funciona muito bem em gráficos semanais ou mensais, mas pode ser utilizado no intraday caso o backtest se mostre favorável.
Caso você queira, é possível alterar a regra de entrada e saída definindo outros valores para o período de entrada ou saída e assim encontrar resultados mais positivos para cada papel.
Não existe stop loss pois nos testes normalmente o stop loss reduz os ganhos da estratégia.
Boa sorte e bons trades.

Combo Backtest 123 Reversal & Bull Power This is combo strategies for get a cumulative signal.
First strategy
This System was created from the Book "How I Tripled My Money In The
Futures Market" by Ulf Jensen, Page 183. This is reverse type of strategies.
The strategy buys at market, if close price is higher than the previous close
during 2 days and the meaning of 9-days Stochastic Slow Oscillator is lower than 50.
The strategy sells at market, if close price is lower than the previous close price
during 2 days and the meaning of 9-days Stochastic Fast Oscillator is higher than 50.
Second strategy
Bull Power Indicator
To get more information please see "Bull And Bear Balance Indicator"
by Vadim Gimelfarb.
WARNING:
- For purpose educate only
- This script to change bars colors.

Combo Backtest 123 Reversal & Bull And Bear Balance This is combo strategies for get a cumulative signal.
First strategy
This System was created from the Book "How I Tripled My Money In The
Futures Market" by Ulf Jensen, Page 183. This is reverse type of strategies.
The strategy buys at market, if close price is higher than the previous close
during 2 days and the meaning of 9-days Stochastic Slow Oscillator is lower than 50.
The strategy sells at market, if close price is lower than the previous close price
during 2 days and the meaning of 9-days Stochastic Fast Oscillator is higher than 50.
Second strategy
This new indicator analyzes the balance between bullish and
bearish sentiment.
One can cay that it is an improved analogue of Elder Ray indicator.
To get more information please see "Bull And Bear Balance Indicator"
by Vadim Gimelfarb.
WARNING:
- For purpose educate only
- This script to change bars colors.

Combo Backtest 123 Reversal & Breakout Range Short This is combo strategies for get a cumulative signal.
First strategy
This System was created from the Book "How I Tripled My Money In The
Futures Market" by Ulf Jensen, Page 183. This is reverse type of strategies.
The strategy buys at market, if close price is higher than the previous close
during 2 days and the meaning of 9-days Stochastic Slow Oscillator is lower than 50.
The strategy sells at market, if close price is lower than the previous close price
during 2 days and the meaning of 9-days Stochastic Fast Oscillator is higher than 50.
Second strategy
Breakout Range Short Strategy
WARNING:
- For purpose educate only
- This script to change bars colors.

MACD/EMA/SMA/Ichimoku Confluence StrategyThis strategy uses a number of chart indicators to provide a Bullish/Bearish signal. Using a combination of the 200 SMA, the 20 EMA, the MACD and the Ichimoku cloud, the strategy logic will adjust the amount of confluence required between the indicators depending on how bullish or bearish the chart is looking. The logic looks for the following:
- Are we above or below the 200 SMA?
- Are we above or below the 20 EMA?
- Have we had a bullish MACD cross?
- Where are we in relation to the Ichimoku cloud?
If the coin is below the 200 SMA, then the strategy will only give a buy signal if the coin closes a candle above the 20 EMA AND the MACD is bullish and either the Ichimoku cloud is green, or the coin is above the Ichimoku cloud (regardless of colour).
If the coin is above the 200 SMA, Then the strategy will give a buy signal if the coin closes a candle above the 20 EMA AND the MACD is bullish and the coin is either IN the cloud (not necessarily above it) or the cloud is green.
The reverse is true for a sell signal, i.e. when the coin is above the 200 SMA it must close a candle below the Ichimoku cloud and be bearish in relation to the 20 EMA and MACD. If it is below the 200 SMA, then the strategy will give a sell signal if the the EMA/MACD conditions are true and the coin enters the cloud.
This strategy gives a fairly conservative signal for entry and exit points, but is fairly successful across a number of time frames, both short term and long term. As with all my strategies, I only include LONG entries and closes, not SHORT entries (as I find they make for inaccurate backtesting).
Please feel free to like, share, critique and suggest any improvements to this strategy. All feedback, positive and negative, is appreciated.

Combo Backtest 123 Reversal & Breakout Range Long This is combo strategies for get a cumulative signal.
First strategy
This System was created from the Book "How I Tripled My Money In The
Futures Market" by Ulf Jensen, Page 183. This is reverse type of strategies.
The strategy buys at market, if close price is higher than the previous close
during 2 days and the meaning of 9-days Stochastic Slow Oscillator is lower than 50.
The strategy sells at market, if close price is lower than the previous close price
during 2 days and the meaning of 9-days Stochastic Fast Oscillator is higher than 50.
Second strategy
Breakout Range Long Strategy
WARNING:
- For purpose educate only
- This script to change bars colors.

Combo Backtest 123 Reversal & Bill Williams. AO with Signal Line This is combo strategies for get a cumulative signal.
First strategy
This System was created from the Book "How I Tripled My Money In The
Futures Market" by Ulf Jensen, Page 183. This is reverse type of strategies.
The strategy buys at market, if close price is higher than the previous close
during 2 days and the meaning of 9-days Stochastic Slow Oscillator is lower than 50.
The strategy sells at market, if close price is lower than the previous close price
during 2 days and the meaning of 9-days Stochastic Fast Oscillator is higher than 50.
Second strategy
This indicator plots the oscillator as a histogram where blue denotes
periods suited for buying and red . for selling. If the current value
of AO (Awesome Oscillator) is above previous, the period is considered
suited for buying and the period is marked blue. If the AO value is not
above previous, the period is considered suited for selling and the
indicator marks it as red.
You can make changes in the property for set calculating strategy MA, EMA, WMA
WARNING:
- For purpose educate only
- This script to change bars colors.

RSI-RENKO Divine Strategy (Backtesting)Live, non-repainting strategy using RENKO and RSI mixed together to multiple types of long and short positions.
- Features -
Live entry direction with trade warnings and alerts
Live trade building buy and sell limits (for buy/sell limits)
Entry location icons as well as pyramid entries (to add to existing position)
Swing trades that keep you in the trade for the maximum possible profit
1 scalp target based on the RSI settings and entry location
Dynamic trailing stop for swings and scalps
Alert conditions for every update and condition change of the strategy (Provided by indicator study)
4 pre-built color themes, including candlestick coloring
This strategy is best used with the companion indicators: Renko RSI and Renko Trend Momentum using the identical RSI and Trend settings.
The linked script is identical and used solely for alerts, because Trading View still after 3 years of requesting does not provide the ability to use alert conditions inside a strategy script, only an indicator script. This strategy should be used to backtest your settings.
The approach to this strategy uses several parallel trades of different types. In order to generate multiple trade types the "pyramid trades" setting of the strategy (second tab of the settings that lets you adjust the number of pyramid contracts) should be used.
- Trade Types -
Swing: This trade is entered on the solid arrows after the RSI has become oversold or overbought. It is key that all trades wait for some degree of pullback before entering, even after the trend flips between positive and negative. This trade is held until stopped out or an opposite trade is triggered that reverses the position.
Scalp: These trades have a limit buy/sell entry and a target. The initial target is the opposing RSI overbought or oversold level and changes in real time.
Turning on/off the different trade types (strategy only) is simple done by decreasing the number of contracts used for that trade type to zero. When the quantity is set to zero, that trade is not considered.
- Session -
The session filter is used to narrow trade executions by only allowing trades that are inside the session boundaries. This can be used to isolate the London or New York session for example. The default is 24 x 7 which filters no trades (Trading View has a bug when resetting this, so simply reset the indicator to get it back to 24x7).
Please see the following 3 videos introducing the concept of this strategy.
All feature requests or bug reports are welcome either by direct messaging or comments on this page or the linked indicator page.
Please PM for access. Cheers.

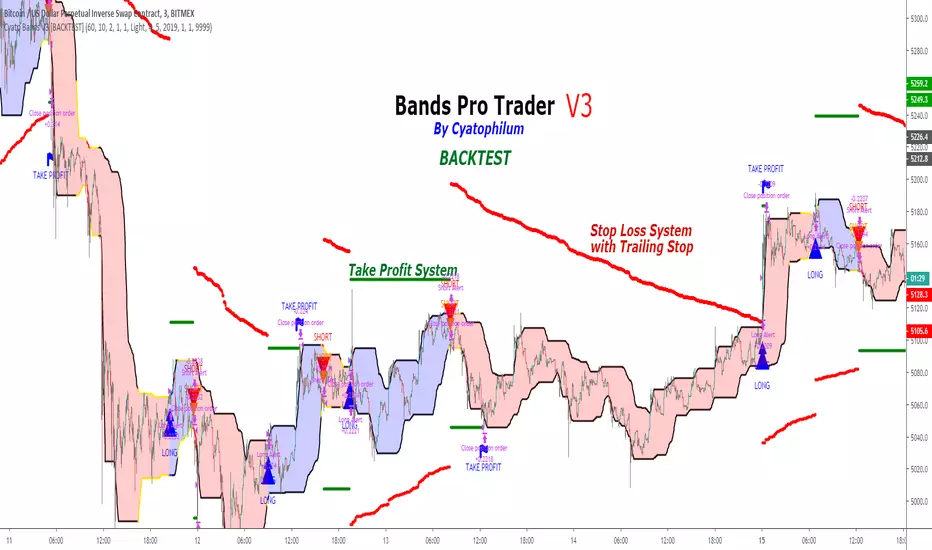
Cyatophilum Bands Pro Trader V3 [BACKTEST]An Original Automated Strategy that can be used for Manual or Bot Trading, on any timeframe and market.
>> Presentation <<
How it works
No, these are NOT Bollinger Bands..
The Cyatophilum Bands are an original formula that I created. You will probably never find it anywhere else.
Their behavior is the following:
When they are horizontal it means the trend is going sideways and they represent supports (lower band) and resistances (upper band).
When they are climbing or falling it means the trend is either bullish or bearish and they represent Trend Lines.
The strategy enters Long on a Bull Breakout and enters Short on a Bear Breakout.
The exits are triggered either on a Trend Reversal, a Stop Loss or a Take Profit.
FEATURES
Take Profit System
Stop Loss System
Show Net profit Line
More features here
Finding a profitable configuration is GUARANTEED
0. Choose your symbol and timeframe. Then add the Backtest version to your chart. If at any time you decide to change your timeframe, go back to step 1.
1. Open the strategy tester and look at the buy & hold line.
If it is mostly climbing (last value greater than 0) then it means we are in a bull market. You should then opt or a long only strategy.
If it is mostly dropping (last value lower than 0) then it means we are in a bear market. You should then opt or a short only strategy.
Note : This first step is really important. Trading against the market has very little chances to succeed.
2. Go into the Strategy Input Parameters:
check "Enable Long Results" and uncheck "Enable Short Results" if you are in a long only strategy.
check "Enable Short Results" and uncheck "Enable Long Results" if you are in a short only strategy.
3. Open the Strategy Tester and open the Strategy Properties.
We are going to find the base parameters for the Bands.
The "Bands Lookback" is the main parameter to configure for any strategy. It corresponds to how strong of a support and resistance the bands will behave. The lower the timeframe, the higher lookback you will need. It can move from 10 to 60. For example 60 is a good value for a 3 minute timeframe. Try different values, and look at the "net profit" value in the Overview tab of the Strategy Tester. Keep the Lookback value that shows the best net profit value.
Then play with the "Bands Smoothing" from 2 to 20 and keep the best net profit value.
The "Band Smoothing" is used to reduce noise.
Usually, the default value (10) is what gives the best results.
From this point you should already be able to have a profitable strategy (net profit>0), but we can improve it using the Stop Loss and the Take Profit feature.
4. To activate the Stop Loss feature, click on the "SECURITY" checkbox
You should see horizontal red lines appear.
A Long/short exit alert will be triggered if the price were to cross this line. (A red Xcross will appear)
Choose the Stop Loss percentage.
On top of that, you can enable the feature "Trailing Stop". It will make the red line follow the price, at a speed that you can configure with the "Trailing Speed" parameter.
Now, sometimes a stop is triggered and it was just a fakeout. You can enable "Re-entries after a stop" to avoid missing additional opportunities.
5. To activate the Take Profit feature, click on the "TAKE PROFIT" checkbox
You should see horizontal green lines appear.
A Long/short exit alert will be triggered if the price were to cross this line. (A flag will appear)
Choose the Take Profit percentage.
A low takeprofit will provide a safer strategy but can reduce potential profits.
A higher takeprofit will increase risk but can provide higher potential profits.
6. Money Management
You can configure the backtest according to your own money management.
Let's say you have 10 000 $ as initial capital and want to trade only 5%, set the Order Size to 5% of Equity.
You can increase net profit by increasing the order size but this is at your own risk.
How to create alerts explained here
Sample Uses Cases
Use it literally anywhere
This indicator can be used on any timeframe and market (not only cryptocurrencies).
About the Backtest below
The Net Profit (Gross profit - Gross loss) is calculated with a commission of 0.05% on each order.
No leverage used. This is a long strategy.
Each trade is made with 10 % of equity from an inital capital of 10 000$. The net profit can be bigger by increasing the % of equity but this a trader's rule to minimise the risk.
I am selling access to all my indicators on my website : blockchainfiesta.com
To get a 2 days free trial, just leave a comment , thanks !
Join my Discord for help, configurations, requests, etc. discord.gg
Bollinger_Bands_Strategy(Add Function) - BB Free (By Wolf)전략 및 지표 얼러트등 파인스크립트 제작 문의 - 트레이딩뷰 메시지
Contact to create strategy and indicators add alert etc - TradingView Message
이름(Name)
Bollinger Bands Strategy (Add Function) (By Wolf)
-해당 전략은 Long & Short 의 신호를 발생시키는 전략입니다.
-The strategy is to generate a signal from Long & Short
기능 추가(Add Function)
-Trade Direction Long
-Trade Direction Short
-Stoploss ($)
-Profit target($)
-Backtest date
해당 전략은 수익률이 높은값으로 임의로 변경해놓았습니다
본인의 투자전략에 맞는 수치로 변경하여 사용하셔도 좋습니다.
*I entered the value with good profits settings for the strategy.
You can use this customarily
소스코드(Source code)
-비공개 (not open to the public)
*모든 전략은 리페인트 코드를 등록하지않았습니다.
-All strategies do not register the repaint code
*모든 전략 및 지표의 백테스트 결과는 BITMEX Fee 0.075% 를 입력한 결과값입니다.
-The back test result for all strategies and indicators is the result of inputting BITEX Fee 0.075%
*모든 거래는 높은 위험을 수반하며, 과거 백테스트 결과가 반드시 현재 및 미래의 결과를 나타내는것은 아닙니다.
가상 또는 시뮬레이션 백테스트 결과는 한계를 가지고 있으며 실제거래와 시장의 변동 및 유동에 따라 똑같지않을
가능성이있으며, 모든 손실에 대한 책임은 본인에게 있습니다.
-All trade involve high risk, and past backtest results do not necessarily represent current and future results.
Virtual or simulated backtest results have limitations and are not consistent with actual transactions and market changes and flows
It is possible and you are responsible for any loss.

Reversal Bar Signal TestReversal Bars are simple indicators I draw on modified uni renko bars. These simply indicates the bars that "can be" a sign of a reversal or at least a retrace in trend.
This is a test with a simple strategy to buy and sell on those reversal signals.
Keep in mind, all the strategies I am providing are single tool being tested. My methodology is a combination of all these tools with the concept being that if each tool can give good result in testing, the synergistic combination will be something that you wouldn't find anywhere else.
Please don't contact me about getting access to these strategies. These strategies are being developed for my students only.
Right now, the English version of website and learning material is under development, as soon as they are ready, there will be comments bellow every single one of the tool set related.
