Daily Breakout + Daily Shadow By RouroThis script is a Pine v5 strategy designed to detect daily candle body breakouts and execute them on any intraday timeframe, while also providing:
Daily Data Retrieval
Using request.security(..., "D", ...) it fetches the OHLC and timestamp of the daily candle, regardless of the chart’s current timeframe.
Calculation of Yesterday’s and Day-Before-Yesterday’s Bodies
b1High and b1Low → the high/low of yesterday’s daily candle body
b2High and b2Low → the high/low of the previous day’s body
Detection of the First Intraday Bar After a New Day
By using ta.change(time("D")), it marks the start of each new trading day.
Drawing the Previous Day’s “Shadow” on the Chart
It overlays a box (box.new) and two wick lines (line.new) with configurable colors and transparency, so you can clearly see the full range of yesterday’s candle on any intraday chart.
Automatic End-of-Day Position Closure
It will automatically close any open position at the start of the next day to avoid unintended rollovers.
Entry Signals
On the very first intraday bar after the daily close:
Long if yesterday’s close broke above the body of the day before yesterday
Short if yesterday’s close broke below the body of the day before yesterday
…which triggers a strategy.entry at the intraday open.
Fully Customizable Stop-Loss and Take-Profit
SL options:
Opposite end of yesterday’s body
Fixed pips from entry
A risk-reward ratio on yesterday’s wick
Optional “safety SL” in fixed pips that overrides the above
TP options:
Fixed pips
Yesterday’s wick extreme (high/low)
Partial exit on the wick (TP1), then second exit (TP2) either:
At a multiplied RR
Or at the daily close (“Close of Day”)
You can also choose to move SL to breakeven after TP1 is hit.
Live Metrics Table
In the upper-right corner it displays in real time:
Start of backtest (date of first trade)
Number of ✅ Winning trades and ❌ Losing trades
Total number of trades
Win rate (%)
Profit Factor
All within a fixed table layout so it never runs out of rows or columns.
Search in scripts for "tp"

EXODUS EXODUS by (DAFE) Trading Systems
EXODUS is a sophisticated trading algorithm built by Dskyz (DAFE) Trading Systems for competitive and competition purposes, designed to identify high-probability trades with robust risk management. this strategy leverages a multi-signal voting system, combining three core components—SPR, VWMO, and VEI—alongside ADX, choppiness filters, and ATR-based volatility gates to ensure trades are taken only in favorable market conditions. the algo uses a take-profit to stop-loss ratio, dynamic position sizing, and a strict voting mechanism requiring all signals to align before entering a trade.
EXODUS was not overfitted for any specific symbol. instead, it uses a generic tuned setting, making it versatile across various markets. while it can trade futures, it’s not currently set up for it but has the potential to do more with further development. visuals are intentionally minimal due to its competition focus, prioritizing performance over aesthetics. a more visually stunning version may be released in the future with enhanced graphics.
The Unique Core Components Developed for EXODUS
SPR (Session Price Recalibration)
SPR measures momentum during regular trading hours (RTH, 0930-1600, America/New_York) to catch session-specific trends.
spr_lookback = input.int(15, "SPR Lookback") this sets how many bars back SPR looks to calculate momentum (default 15 bars). it compares the current session’s price-volume score to the score 15 bars ago to gauge momentum strength.
how it works: a longer lookback smooths out the signal, focusing on bigger trends. a shorter one makes SPR more sensitive to recent moves.
how to adjust: on a 1-hour chart, 15 bars is 15 hours (about 2 trading days). if you’re on a shorter timeframe like 5 minutes, 15 bars is just 75 minutes, so you might want to increase it to 50 or 100 to capture more meaningful trends. if you’re trading a choppy stock, a shorter lookback (like 5) can help catch quick moves, but it might give more false signals.
spr_threshold = input.float (0.7, "SPR Threshold")
this is the cutoff for SPR to vote for a trade (default 0.7). if SPR’s normalized value is above 0.7, it votes for a long; below -0.7, it votes for a short.
how it works: SPR normalizes its momentum score by ATR, so this threshold ensures only strong moves count. a higher threshold means fewer trades but higher conviction.
how to adjust: if you’re getting too few trades, lower it to 0.5 to let more signals through. if you’re seeing too many false entries, raise it to 1.0 for stricter filtering. test on your chart to find a balance.
spr_atr_length = input.int(21, "SPR ATR Length") this sets the ATR period (default 21 bars) used to normalize SPR’s momentum score. ATR measures volatility, so this makes SPR’s signal relative to market conditions.
how it works: a longer ATR period (like 21) smooths out volatility, making SPR less jumpy. a shorter one makes it more reactive.
how to adjust: if you’re trading a volatile stock like TSLA, a longer period (30 or 50) can help avoid noise. for a calmer stock, try 10 to make SPR more responsive. match this to your timeframe—shorter timeframes might need a shorter ATR.
rth_session = input.session("0930-1600","SPR: RTH Sess.") rth_timezone = "America/New_York" this defines the session SPR uses (0930-1600, New York time). SPR only calculates momentum during these hours to focus on RTH activity.
how it works: it ignores pre-market or after-hours noise, ensuring SPR captures the main market action.
how to adjust: if you trade a different session (like London hours, 0300-1200 EST), change the session to match. you can also adjust the timezone if you’re in a different region, like "Europe/London". just make sure your chart’s timezone aligns with this setting.
VWMO (Volume-Weighted Momentum Oscillator)
VWMO measures momentum weighted by volume to spot sustained, high-conviction moves.
vwmo_momlen = input.int(21, "VWMO Momentum Length") this sets how many bars back VWMO looks to calculate price momentum (default 21 bars). it takes the price change (close minus close 21 bars ago).
how it works: a longer period captures bigger trends, while a shorter one reacts to recent swings.
how to adjust: on a daily chart, 21 bars is about a month—good for trend trading. on a 5-minute chart, it’s just 105 minutes, so you might bump it to 50 or 100 for more meaningful moves. if you want faster signals, drop it to 10, but expect more noise.
vwmo_volback = input.int(30, "VWMO Volume Lookback") this sets the period for calculating average volume (default 30 bars). VWMO weights momentum by volume divided by this average.
how it works: it compares current volume to the average to see if a move has strong participation. a longer lookback smooths the average, while a shorter one makes it more sensitive.
how to adjust: for stocks with spiky volume (like NVDA on earnings), a longer lookback (50 or 100) avoids overreacting to one-off spikes. for steady volume stocks, try 20. match this to your timeframe—shorter timeframes might need a shorter lookback.
vwmo_smooth = input.int(9, "VWMO Smoothing")
this sets the SMA period to smooth VWMO’s raw momentum (default 9 bars).
how it works: smoothing reduces noise in the signal, making VWMO more reliable for voting. a longer smoothing period cuts more noise but adds lag.
how to adjust: if VWMO is too jumpy (lots of false votes), increase to 15. if it’s too slow and missing trades, drop to 5. test on your chart to see what keeps the signal clean but responsive.
vwmo_threshold = input.float(10, "VWMO Threshold") this is the cutoff for VWMO to vote for a trade (default 10). above 10, it votes for a long; below -10, a short.
how it works: it ensures only strong momentum signals count. a higher threshold means fewer but stronger trades.
how to adjust: if you want more trades, lower it to 5. if you’re getting too many weak signals, raise it to 15. this depends on your market—volatile stocks might need a higher threshold to filter noise.
VEI (Velocity Efficiency Index)
VEI measures market efficiency and velocity to filter out choppy moves and focus on strong trends.
vei_eflen = input.int(14, "VEI Efficiency Smoothing") this sets the EMA period for smoothing VEI’s efficiency calc (bar range / volume, default 14 bars).
how it works: efficiency is how much price moves per unit of volume. smoothing it with an EMA reduces noise, focusing on consistent efficiency. a longer period smooths more but adds lag.
how to adjust: for choppy markets, increase to 20 to filter out noise. for faster markets, drop to 10 for quicker signals. this should match your timeframe—shorter timeframes might need a shorter period.
vei_momlen = input.int(8, "VEI Momentum Length") this sets how many bars back VEI looks to calculate momentum in efficiency (default 8 bars).
how it works: it measures the change in smoothed efficiency over 8 bars, then adjusts for inertia (volume-to-range). a longer period captures bigger shifts, while a shorter one reacts faster.
how to adjust: if VEI is missing quick reversals, drop to 5. if it’s too noisy, raise to 12. test on your chart to see what catches the right moves without too many false signals.
vei_threshold = input.float(4.5, "VEI Threshold") this is the cutoff for VEI to vote for a trade (default 4.5). above 4.5, it votes for a long; below -4.5, a short.
how it works: it ensures only strong, efficient moves count. a higher threshold means fewer trades but higher quality.
how to adjust: if you’re not getting enough trades, lower to 3. if you’re seeing too many false entries, raise to 6. this depends on your market—fast stocks like NQ1 might need a lower threshold.
Features
Multi-Signal Voting: requires all three signals (SPR, VWMO, VEI) to align for a trade, ensuring high-probability setups.
Risk Management: uses ATR-based stops (2.1x) and take-profits (4.1x), with dynamic position sizing based on a risk percentage (default 0.4%).
Market Filters: ADX (default 27) ensures trending conditions, choppiness index (default 54.5) avoids sideways markets, and ATR expansion (default 1.12) confirms volatility.
Dashboard: provides real-time stats like SPR, VWMO, VEI values, net P/L, win rate, and streak, with a clean, functional design.
Visuals
EXODUS prioritizes performance over visuals, as it was built for competitive and competition purposes. entry/exit signals are marked with simple labels and shapes, and a basic heatmap highlights market regimes. a more visually stunning update may be released later, with enhanced graphics and overlays.
Usage
EXODUS is designed for stocks and ETFs but can be adapted for futures with adjustments. it performs best in trending markets with sufficient volatility, as confirmed by its generic tuning across symbols like TSLA, AMD, NVDA, and NQ1. adjust inputs like SPR threshold, VWMO smoothing, or VEI momentum length to suit specific assets or timeframes.
Setting I used: (Again, these are a generic setting, each security needs to be fine tuned)
SPR LB = 19 SPR TH = 0.5 SPR ATR L= 21 SPR RTH Sess: 9:30 – 16:00
VWMO L = 21 VWMO LB = 18 VWMO S = 6 VWMO T = 8
VEI ES = 14 VEI ML = 21 VEI T = 4
R % = 0.4
ATR L = 21 ATR M (S) =1.1 TP Multi = 2.1 ATR min mult = 0.8 ATR Expansion = 1.02
ADX L = 21 Min ADX = 25
Choppiness Index = 14 Chop. Max T = 55.5
Backtesting: TSLA
Frame: Jan 02, 2018, 08:00 — May 01, 2025, 09:00
Slippage: 3
Commission .01
Disclaimer
this strategy is for educational purposes. past performance is not indicative of future results. trading involves significant risk, and you should only trade with capital you can afford to lose. always backtest and validate any strategy before using it in live markets.
(This publishing will most likely be taken down do to some miscellaneous rule about properly displaying charting symbols, or whatever. Once I've identified what part of the publishing they want to pick on, I'll adjust and repost.)
About the Author
Dskyz (DAFE) Trading Systems is dedicated to building high-performance trading algorithms. EXODUS is a product of rigorous research and development, aimed at delivering consistent, and data-driven trading solutions.
Use it with discipline. Use it with clarity. Trade smarter.
**I will continue to release incredible strategies and indicators until I turn this into a brand or until someone offers me a contract.
2025 Created by Dskyz, powered by DAFE Trading Systems. Trade smart, trade bold.

position_toolLibrary "position_tool"
Trying to turn TradingView's position tool into a library from which you can draw position tools for your strategies on the chart. Not sure if this is going to work
calcBaseUnit()
Calculates the chart symbol's base unit of change in asset prices.
Returns: (float) A ticks or pips value of base units of change.
calcOrderPipsOrTicks(orderSize, unit)
Converts the `orderSize` to ticks.
Parameters:
orderSize (float) : (series float) The order size to convert to ticks.
unit (simple float) : (simple float) The basic units of change in asset prices.
Returns: (int) A tick value based on a given order size.
calcProfitLossSize(price, entryPrice, isLongPosition)
Calculates a difference between a `price` and the `entryPrice` in absolute terms.
Parameters:
price (float) : (series float) The price to calculate the difference from.
entryPrice (float) : (series float) The price of entry for the position.
isLongPosition (bool)
Returns: (float) The absolute price displacement of a price from an entry price.
calcRiskRewardRatio(profitSize, lossSize)
Calculates a risk to reward ratio given the size of profit and loss.
Parameters:
profitSize (float) : (series float) The size of the profit in absolute terms.
lossSize (float) : (series float) The size of the loss in absolute terms.
Returns: (float) The ratio between the `profitSize` to the `lossSize`
createPosition(entryPrice, entryTime, tpPrice, slPrice, entryColor, tpColor, slColor, textColor, showExtendRight)
Main function to create a position visualization with entry, TP, and SL
Parameters:
entryPrice (float) : (float) The entry price of the position
entryTime (int) : (int) The entry time of the position in bar_time format
tpPrice (float) : (float) The take profit price
slPrice (float) : (float) The stop loss price
entryColor (color) : (color) Color for entry line
tpColor (color) : (color) Color for take profit zone
slColor (color) : (color) Color for stop loss zone
textColor (color) : (color) Color for text labels
showExtendRight (bool) : (bool) Whether to extend lines to the right
Returns: (bool) Returns true when position is closed
ICT SMC Liquidity Grabs and OBsICT SMC Liquidity Grabs + OB + Fibonacci OTE Levels
Smart Money Concepts Trading Assistant
This script is built for traders who follow ICT (Inner Circle Trader) and Smart Money Concepts. It intelligently combines three critical components of SMC trading: Liquidity Grabs, Order Blocks, and Fibonacci-based Optimal Trade Entry (OTE) zones — giving traders visual cues for potential high-probability reversals and entry points.
🔍 What This Script Does:
Detects Liquidity Grabs
Identifies swing highs/lows where price sweeps liquidity, then immediately reverses.
Labels them with orange markers when price takes out previous highs/lows but closes back inside.
Draws Order Blocks
After a liquidity grab, the script looks for strong bullish or bearish candles and automatically highlights the OB zone.
These OB zones are visualized with transparent colored boxes extending several bars forward.
Plots Fibonacci OTE Levels
Uses recent swing high/low pivots to dynamically draw customizable OTE retracement levels (e.g., 62% and 75%) for both long and short setups.
Highlights Optimal Entry Zones
Marks valid OTE-based buy/sell opportunities only when:
Liquidity has been taken,
Price enters the OTE zone,
And a strong confirming candle appears.
Adds visual zones, trade labels, and optional alerts for each qualified entry.
Includes Take Profit Targets
Automatically calculates take-profit levels based on previous structure and risk-reward ratios.
TP1 is the previous swing, and TP2 is an extended R-multiple (customizable by user).
⚙️ Customization Options:
Toggle each feature (Liquidity Grabs, OBs, Fibonacci Levels)
Adjust Fibonacci levels (default: 62% and 75%)
Set lookback period for liquidity checks
Customize the R-multiple for TP2 levels
💡 How to Use:
Enable desired features from the input panel.
Watch for Buy/Sell OTE zones highlighted in green/red.
Confirm with liquidity sweep and OB support for stronger signals.
Use the automatically generated TP levels to manage risk.
🚀 What Makes It Unique:
Unlike other open-source mashups, this script synchronizes multiple SMC concepts into a single tool that:
Waits for high-confidence conditions (not just blind fib or OB detection)
Validates entries using multiple confluences
Visually marks actionable setups
Automates trade management zones
Whether you're trend-trading, scalping, or swing trading ICT-style, this tool offers a streamlined, smart-money-aligned workflow directly on your chart.

Supertrend Hombrok BotSupertrend Hombrok Bot – Automated Trading Strategy for Dynamic Market Conditions
This trading strategy script has been developed to operate automatically based on detailed market conditions. It combines the popular Supertrend indicator, RSI (Relative Strength Index), Volume, and ATR (Average True Range) to determine the best entry and exit points while maintaining proper risk management.
Key Features:
Supertrend as the Base: Uses the Supertrend indicator to identify the market's trend direction, generating buy signals when the market is in an uptrend and sell signals when in a downtrend.
RSI Filter: The RSI is used to determine overbought and oversold conditions, helping to avoid entries in extreme market conditions. Entries are avoided when RSI > 70 (overbought) and RSI < 30 (oversold), reducing the risk of false movements.
Volume Filter: The strategy checks if the trading volume is above the average multiplied by a user-defined factor. This ensures that only significant movements, with higher liquidity, are considered.
Candle Body Size: The strategy filters only candles with a body large enough relative to the ATR (Average True Range), ensuring that the price movements on the chart have sufficient strength.
Risk Management: The bot is configured to operate with an adjustable Risk/Reward Ratio (R:R). This means that for each trade, both Take Profit (TP) and Stop Loss (SL) are adjusted based on the market's volatility as measured by the ATR.
Automatic Entries and Exits: The script automatically executes entries based on the specified conditions and exits with predefined Stop Loss and Take Profit levels, ensuring risk is controlled for each trade.
How It Works:
Buy Condition: Triggered when the market is in an uptrend (Supertrend), the volume is above the adjusted average, the candle body is strong enough, and the RSI is below the overbought level.
Sell Condition: Triggered when the market is in a downtrend (Supertrend), the volume is above the adjusted average, the candle body is strong enough, and the RSI is above the oversold level.
Alerts:
Buy and Sell Alerts are configured with detailed information, including Stop Loss and Take Profit values, allowing the user to receive notifications when trading conditions are met.
Capital Management:
The capital per trade can be adjusted based on account size and risk profile.
Important Note:
Always test before trading with real capital: While the strategy has been designed based on solid technical analysis methods, always perform tests in real-time market conditions with demo accounts before applying the bot in live trading.
Disclaimer: This script is a tool to assist in the trading process and does not guarantee profit. Past performance is not indicative of future results, and the trader is always responsible for their investment decisions.

ATR Stop-Loss & TargetsATR and Supertrend-based SL/TP & Trailing System
This indicator combines Average True Range (ATR) and Supertrend logic to help traders define precise stop-loss, first target, and trailing stop-loss (TSL) levels.
⚙️ Key Features:
📏 ATR-based Stop-Loss & Target Lines:
Uses ATR (default period: 5) based on the previous day's candle for more stable risk management.
Traders can choose the price source: Close, Open, or enter a manual price.
SL and first target are calculated using multipliers:
Multiplier 1 = Stop Loss
Multiplier 2 = First Target
📉 Supertrend for Trailing Stop:
Built-in Supertrend logic for trailing stop-loss management.
Uses ATR(10) with a multiplier of 2.1, based on HL2.
Supertrend can be toggled ON/OFF from the settings.

ICT Judas + Silver Bullet🔰 ICT Judas + Silver Bullet Indicator (SMC-based)
Built for Prop Firm and High Win Rate Intraday Traders
This indicator identifies key institutional setups from Inner Circle Trader (ICT) and Smart Money Concepts (SMC) strategies, optimized for XAUUSD, EURUSD, and other high-volume pairs on the 5-minute chart.
📌 Core Features:
✅ Asian Range Box (02:00–08:00 SGT) – used as manipulation anchor
✅ London Killzone (14:00–16:00 SGT) – Judas Swing detection
✅ New York Killzone (22:30–23:30 SGT) – Silver Bullet setups
✅ Automatic Fair Value Gap (FVG) detection
✅ Liquidity sweep detection based on 20-bar EQH/EQL
✅ Entry + Stop Loss + Take Profit visualization with adjustable RR
✅ Alerts for Judas and Silver setups
✅ Perfect for prop firm scalping and intraday swing logic
🛠️ How It Works:
- Judas Swing: triggers when liquidity above the Asian high is swept during London Killzone
- Silver Bullet: triggers when liquidity below recent lows is swept during NY Killzone
- Entry shown via circle, SL and TP lines based on user-defined RR and stop-loss pip distance
- Designed to be paired with SMC/ICT OB/FVG confirmation entries
⚙️ Settings:
- Adjustable session times
- Toggle FVG display
- Set RR and SL pips to match prop firm rules
- Compatible with alert webhooks for Telegram
🕰️ Note:
All times are fixed to **SGT (GMT+8)**. If you're in another timezone, adjust your TradingView timezone accordingly or update the session inputs manually during Daylight Saving Time changes.
🔔 Alert-Ready:
Use alerts for live signals and pair with webhooks for automation.
🔍 Recommended Pairings:
XAUUSD, EURUSD, GBPUSD, NAS100 on M5 chart
📈 Win Rate Potential:
Backtested with high-probability setups aligned with prop firm daily goals. Best used with strict discipline and 1-2 setups per day.
—
Built with ❤️ by a trader, for traders looking for precision-based executions using ICT logic.

ICT Liquidity Sweep MAX RETRI (ALERT)Strategy Description: SMC + ICT Reversal Sniper | 5-Min | R2 TP
This strategy applies Smart Money Concepts (SMC) and ICT methodology to identify high-probability reversal trades using a clean, rule-based system designed for the 5-minute timeframe.
⸻
Core Logic:
• Liquidity Sweep: Identifies stop hunts beyond recent swing highs/lows using a configurable lookback window.
• Break of Structure (BOS): Validates a directional shift after the sweep.
• Fixed R2 Risk-Reward: Entry is followed by a 2:1 take-profit target. Stop loss is set at the sweep candle’s high/low.
• No Entry Between 8 PM–12 AM NY Time: Avoids the manipulation-prone and illiquid zone.
• Discreet SL Handling: SL hits close trades silently — no labels or visuals.
⸻
Entry Precision & Timing Notes:
• The strategy may occasionally fire before a confirmed liquidity sweep — this is expected. If a sweep occurs later, you may still re-enter toward equilibrium, with take profit also targeted at equilibrium.
• Alerts or trades that trigger near 9:30 AM NY often align with real direction, but this time can be volatile.
• For more reliable and lower-risk entries, focus on the 1:30 PM to 2:00 PM silver bullet window, which tends to produce cleaner setups with more favorable flow. 🖤

Moving Average Shift WaveTrend StrategyMoving Average Shift WaveTrend Strategy
🧭 Overview
The Moving Average Shift WaveTrend Strategy is a trend-following and momentum-based trading system designed to be overlayed on TradingView charts. It executes trades based on the confluence of multiple technical conditions—volatility, session timing, trend direction, and oscillator momentum—to deliver logical and systematic trade entries and exits.
🎯 Strategy Objectives
Enter trades aligned with the prevailing long-term trend
Exit trades on confirmed momentum reversals
Avoid false signals using session timing and volatility filters
Apply structured risk management with automatic TP, SL, and trailing stops
⚙️ Key Features
Selectable MA types: SMA, EMA, SMMA (RMA), WMA, VWMA
Dual-filter logic using a custom oscillator and moving averages
Session and volatility filters to eliminate low-quality setups
Trailing stop, configurable Take Profit / Stop Loss logic
“In-wave flag” prevents overtrading within the same trend wave
Visual clarity with color-shifting candles and entry/exit markers
📈 Trading Rules
✅ Long Entry Conditions:
Price is above the selected MA
Oscillator is positive and rising
200-period EMA indicates an uptrend
ATR exceeds its median value (sufficient volatility)
Entry occurs between 09:00–17:00 (exchange time)
Not currently in an active wave
🔻 Short Entry Conditions:
Price is below the selected MA
Oscillator is negative and falling
200-period EMA indicates a downtrend
All other long-entry conditions are inverted
❌ Exit Conditions:
Take Profit or Stop Loss is hit
Opposing signals from oscillator and MA
Trailing stop is triggered
🛡️ Risk Management Parameters
Pair: ETH/USD
Timeframe: 4H
Starting Capital: $3,000
Commission: 0.02%
Slippage: 2 pips
Risk per Trade: 2% of account equity (adjustable)
Total Trades: 224
Backtest Period: May 24, 2016 — April 7, 2025
Note: Risk parameters are fully customizable to suit your trading style and broker conditions.
🔧 Trading Parameters & Filters
Time Filter: Trades allowed only between 09:00–17:00 (exchange time)
Volatility Filter: ATR must be above its median value
Trend Filter: Long-term 200-period EMA
📊 Technical Settings
Moving Average
Type: SMA
Length: 40
Source: hl2
Oscillator
Length: 15
Threshold: 0.5
Risk Management
Take Profit: 1.5%
Stop Loss: 1.0%
Trailing Stop: 1.0%
👁️ Visual Support
MA and oscillator color changes indicate directional bias
Clear chart markers show entry and exit points
Trailing stops and risk controls are transparently managed
🚀 Strategy Improvements & Uniqueness
In-wave flag avoids repeated entries within the same trend phase
Filtering based on time, volatility, and trend ensures higher-quality trades
Dynamic high/low tracking allows precise trailing stop placement
Fully rule-based execution reduces emotional decision-making
💡 Inspirations & Attribution
This strategy is inspired by the excellent concept from:
ChartPrime – “Moving Average Shift”
It expands on the original idea with advanced trade filters and trailing logic.
Source reference:
📌 Summary
The Moving Average Shift WaveTrend Strategy offers a rule-based, reliable approach to trend trading. By combining trend and momentum filters with robust risk controls, it provides a consistent framework suitable for various market conditions and trading styles.
⚠️ Disclaimer
This script is for educational purposes only. Trading involves risk. Always use proper backtesting and risk evaluation before applying in live markets.

DI+/- Cross Strategy with ATR SL and 2% TPDI+/- Cross Strategy with ATR Stop Loss and 2% Take Profit
📝 Script Description for Publishing:
This strategy is based on the directional movement of the market using the Average Directional Index (ADX) components — DI+ and DI- — to generate entry signals, with clearly defined risk and reward targets using ATR-based Stop Loss and Fixed Percentage Take Profit.
🔍 How it works:
Buy Signal: When DI+ crosses above 40, signaling strong bullish momentum.
Sell Signal: When DI- crosses above 40, indicating strong bearish momentum.
Stop Loss: Dynamically calculated using ATR × 1.5, to account for market volatility.
Take Profit: Fixed at 2% above/below the entry price, for consistent reward targeting.
🧠 Why it’s useful:
Combines momentum breakout logic with volatility-based risk management.
Works well on trending assets, especially when combined with higher timeframe filters.
Clean BUY and SELL visual labels make it easy to interpret and backtest.
✅ Tips for Use:
Use on assets with clear trends (e.g., major forex pairs, trending stocks, crypto).
Best on 30m – 4H timeframes, but can be customized.
Consider combining with other filters (e.g., EMA trend direction or Bollinger Bands) for even better accuracy.

RSI and CCICombined RSI and CCI Indicator for MetaTrader
The Combined RSI and CCI Indicator is a powerful hybrid momentum oscillator designed to merge the strengths of two popular indicators—the Relative Strength Index (RSI) and the Commodity Channel Index (CCI)—into a single, visually intuitive chart window. This tool enhances traders’ ability to identify overbought and oversold conditions, divergences, trend strength, and potential reversal zones with improved precision.
Purpose
By integrating RSI and CCI, this indicator helps filter out false signals that often occur when using each tool independently. It is especially useful for swing trading, trend confirmation, and spotting high-probability entry/exit zones. This dual-oscillator approach combines RSI’s relative momentum insights with CCI’s deviation-based analysis to produce a more reliable signal structure.
Key Features
Dual Oscillator Display: Plots both RSI and CCI on the same subwindow for easy comparison and correlation analysis.
Customizable Parameters:
RSI Period and Level (default: 14)
CCI Period and Typical Price Type (default: 20, TP)
Overbought/Oversold Levels for both indicators
Color-Coded Zones:
Background highlights when both RSI and CCI enter overbought/oversold territory, signaling high potential reversal zones.
Combined Signal Logic (Optional Feature):
Buy Signal: RSI < 30 and CCI < -100
Sell Signal: RSI > 70 and CCI > 100
These can be visualized as arrows or plotted as signal markers.
Trend Filter Overlay (Optional):
Can be combined with a moving average or price action filter to confirm trend direction before accepting signals.
Divergence Detection (Advanced Option):
Optional plotting of bullish or bearish divergence where both indicators diverge from price action.
Multi-Timeframe Compatibility:
Allows the use of higher timeframe RSI/CCI values to confirm signals on lower timeframes.
Benefits
Improved Signal Accuracy: Using both RSI and CCI together helps avoid false breakouts and whipsaws.
More Informed Decision-Making: Correlating momentum (RSI) with deviation (CCI) provides a well-rounded picture of market behavior.
Efficient Charting: Saves screen space and cognitive load by combining two indicators into one clean panel.
Scalable Strategy Integration: Can be used in discretionary trading or coded into automated strategies/alerts.
Use Case Example
In a ranging market, the indicator highlights zones where both RSI and CCI are oversold, alerting traders to potential bounce opportunities.
In trending markets, it confirms trend strength when RSI and CCI are both aligned with trend direction.
When RSI is diverging from price but CCI isn’t, it can be a clue of weakening momentum, helping traders scale out or avoid traps.
This combined indicator offers a versatile, high-performance toolset for traders looking to elevate their technical analysis by leveraging multiple momentum perspectives simultaneously.

Buy/Sell EMA Trend Filter v6Buy/Sell EMA Trend Filter v6
This indicator provides a comprehensive trading system based on EMA crossovers with trend filtering for TradingView. It's designed to identify high-probability buy and sell signals by combining short-term crossovers with longer-term trend direction confirmation.
Key Features:
EMA Crossover System: Uses fast and slow EMAs (9 and 21 by default) to generate initial signals
Trend Filtering: Confirms signals with longer-term trend direction (50 and 200 EMAs)
Automatic TP/SL Calculation: Displays clear take profit and stop loss levels based on fixed risk points
Visual Alerts: Clear buy/sell markers at the point of signal with detailed labels
Risk Management: Pre-calculated risk-to-reward setup (default 1:2 ratio)
How It Works:
Buy Signal: When the fast EMA crosses above the slow EMA while the 50 EMA is above the 200 EMA (bullish trend)
Sell Signal: When the fast EMA crosses below the slow EMA while the 50 EMA is below the 200 EMA (bearish trend)
Customizable Parameters:
Fast EMA period (default: 9)
Slow EMA period (default: 21)
Trend EMA periods (default: 50 and 200)
Fixed risk in points (default: 20)
Reward ratio (default: 2.0)
The indicator displays clear entry points with predefined stop loss and take profit levels, making it ideal for traders looking for a systematic approach to the markets. Perfect for both day trading and swing trading timeframes.
This tool combines both trend following and momentum principles to filter out low-probability trades and focus on high-quality setups where the trend and momentum align.

BB Breakout + Momentum Squeeze [Strategy]This Strategy is Based on 3 free indicators
- Bollinger Bands Breakout Oscillator: Link
- TTM Squeeze Pro: Link
- Rolling ATR Bands: Link
Bollinger Bands Breakout Oscillator - This tool shows how strong a market trend is by measuring how often prices move outside their normal Bollinger bands range. It helps you see whether prices are strongly moving in one direction or just moving sideways. By looking at how much and how frequently prices push beyond their typical boundaries, you can identify which direction the market is heading over your selected time period.
TM Squeeze Pro - This is a custom version of the TTM Squeeze indicator.
It's designed to help traders spot consolidation phases in the market (when price is coiling or "squeezing") and to catch breakouts early when volatility returns. The logic is based on the relationship between Bollinger Bands and Keltner Channels, combined with a momentum oscillator to show direction and strength.
Rolling ATR Bands - This indicator combines volatility bands (ATR) with momentum and trend signals to show where the market might be breaking out, retesting, or trending. It's highly visual and helpful for traders looking to time entries/exits during trending or volatile moves.
Logic Of the Strategy:
We are going to use the Bollinger Bands Breakout to determine the direction of the market. Than check the Volatility of the price by looking at the TTM Squeeze indicator. And use the ATR Bands to determine dynamic Stop Losses and based on the calculate the Take Profit targets and quantity for each position dynamically.
For the Long Setup:
1. We need to see the that Bull Power (Green line of the Bollinger Bands Breakout Oscilator) is crossing the level of 50.
2. Check the presence of volatility (Green dot based on the TTM Squeeze indicator)
For the Short Setup:
1. We need to see the that Bear Power (Red line of the Bollinger Bands Breakout Oscilator) is crossing the level of 50.
2. Check the presence of volatility (Green dot based on the TTM Squeeze indicator)
Stop Loss is determined by the Lower ATR Band (for the Long entry) and Upper ATR Band (For the Short entry)
Take Profit is 1:1.5 risk reward ration, which means if the Stop loss is 1% the TP target will be 1.5%
Move stop Loss to Breakeven: If the price will go in the direction of the trade for at least half of the Risk Reward target then the stop will automatically be adjusted to the entry price. For Example: the Stop Loss is 1%, the price has move at least 0.5% in the direction of your trade and that will move the Stop Loss level to the Entry point.
You can Adjust the parameters for each indicator used in that script and also adjust the Risk and Money management block to see how the PnL will change.

Falcon SignalsThis script is a TradingView Pine Script for a trading strategy called "Falcon Signals." It combines multiple technical indicators and strategies to generate buy and sell signals. Here’s a breakdown of what the script does:
1. Supertrend Indicator:
The script calculates the Supertrend indicator using the Average True Range (ATR) and a specified multiplier (factor). The Supertrend is used to define the trend direction, with a green line for an uptrend and a red line for a downtrend.
2. EMA (Exponential Moving Average):
Two EMAs are used: a fast EMA (9-period) and a slow EMA (21-period). The script checks for crossovers of the fast EMA above or below the slow EMA as a basis for buying and selling signals.
3. RSI (Relative Strength Index):
The RSI (14-period) is used to measure the momentum of the price. A buy signal is generated when the RSI is less than 70, while a sell signal is generated when it’s greater than 30.
4. Take Profit (TP) and Stop Loss (SL):
The script allows users to set custom percentages for take profit and stop loss. The take profit is set at a certain percentage above the entry price for buy signals, and the stop loss is set at a percentage below the entry price, and vice versa for sell signals.
5. Trailing Stop:
A trailing stop can be enabled, which dynamically adjusts the stop loss level as the price moves in the favorable direction. If the price moves against the position by a certain trailing percentage, the position will be closed.
6. Engulfing Patterns:
The script checks for bullish and bearish engulfing candlestick patterns, indicating potential reversals. A bullish engulfing pattern is marked with a teal label ("🔄 Reversal Up"), and a bearish engulfing pattern is marked with a fuchsia label ("🔄 Reversal Down").
7. Plotting:
The script plots various indicators and signals:
Entry line: Shows where the buy or sell signal is triggered.
Take profit and stop loss levels are plotted as lines.
EMA and Supertrend lines are plotted on the chart.
Trailing stop line, if enabled, is also plotted.
8. Buy and Sell Labels:
The script places labels on the chart when buy or sell signals are triggered, indicating the price at which the order should be placed.
9. Exit Line:
The script plots an exit line when the trailing stop is hit, signaling when a position should be closed.
10. Alerts:
Alerts are set for both buy and sell signals, notifying the trader when to act based on the strategy's conditions.
This strategy combines trend-following (Supertrend), momentum (RSI), and price action patterns (EMA crossovers and engulfing candlestick patterns) to generate trade signals. It also offers the flexibility of take profit, stop loss, and trailing stop features.

ATM Option Selling StrategyATM Option Selling Strategy – Explained
This strategy is designed for intraday option selling based on the 9/15 EMA crossover, 50/80 MA trend filter, and RSI 50 level. It ensures that all trades are exited before market close (3:24 PM IST).
. Indicators Used:
9 EMA & 15 EMA → For short-term trend identification.
50 MA & 80 MA → To determine the overall trend.
RSI (14) → To confirm momentum (above or below 50 level).
2. Entry Conditions:
🔴 Sell ATM Call (CE) when:
Price is below 50 & 80 MA (Bearish trend).
9 EMA crosses below 15 EMA (Short-term trend turns bearish).
RSI is below 50 (Momentum confirms weakness).
🟢 Sell ATM Put (PE) when:
Price is above 50 & 80 MA (Bullish trend).
9 EMA crosses above 15 EMA (Short-term trend turns bullish).
RSI is above 50 (Momentum confirms strength).
3. Position Sizing & Risk Management:
Sell 375 quantity per trade (Lot size).
50-Point Stop Loss → If option premium moves against us by 50 points, exit.
50-Point Take Profit → If option premium moves in our favor by 50 points, book profit.
Exit all trades at 3:24 PM IST → No overnight positions.
4. Exit Conditions:
✅ Stop Loss or Take Profit Hits → Automatically exits based on a 50-point move.
✅ Time-Based Exit at 3:24 PM → Ensures no open positions at market close.
Why This Works?
✔ Trend Confirmation → 50/80 MA ensures we only sell options in the direction of the market trend.
✔ Momentum Confirmation → RSI prevents entering weak trades.
✔ Controlled Risk → SL and TP protect against large losses.
✔ No Overnight Risk → All trades close before market close.

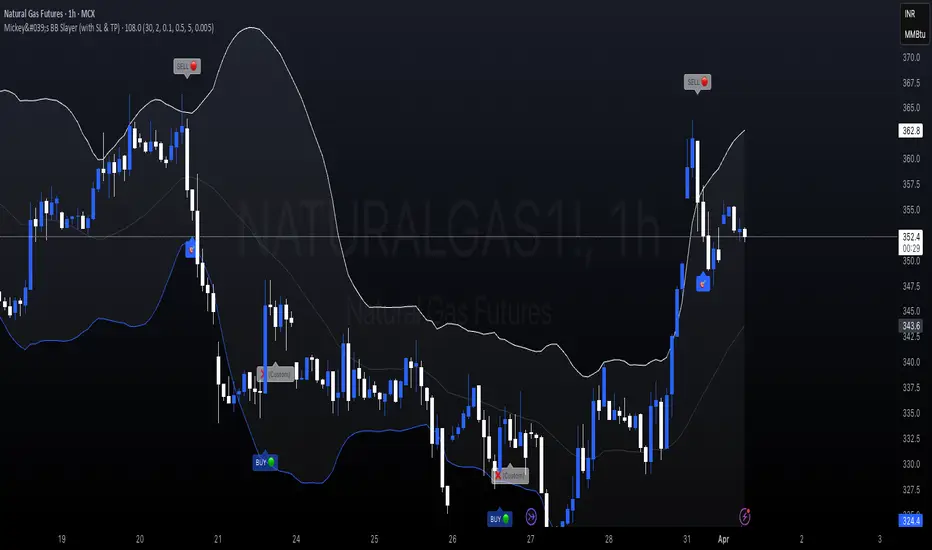
Mickey's BBMickey's BB – Smart Reversal Detector with SL Tracking 🔁
This indicator combines the power of Bollinger Bands with engulfing candle patterns to identify high-probability reversal points.
✅ Buy Signal: Triggered when a red candle touches the lower Bollinger Band and is engulfed by a green candle within the next few candles.
✅ Sell Signal: Triggered when a green candle touches the upper Bollinger Band and is engulfed by a red candle within the next few candles.
✅ Smart Lookahead: Scans up to X candles ahead (user-defined) to confirm engulfing reversals — reducing noise in sideways markets.
✅ Dynamic Stop-Loss & Target: Automatically plots SL/TP levels based on user-defined % thresholds.
✅ SL HIT Labels: Highlights exactly when a stop-loss is breached, giving clear visual feedback on trade failures.
✅ Adaptive Market Filter: Signals are only shown when Bollinger Band width exceeds a minimum threshold — filtering out weak/noise signals in low volatility.
🔍 Ideal for reversal traders, scalpers, and those who love combining price action with volatility-based setups.
🛠️ Customizable Parameters:
SMA Period & Std Dev Multiplier (for BB)
SL/Target % levels
Engulf Lookahead range
Minimum BB width to filter signals
🎯 Build it into your strategy, set alerts, or just use it visually to time your entries and exits with clarity.
Trendline Breaks with Multi Fibonacci Supertrend StrategyTMFS Strategy: Advanced Trendline Breakouts with Multi-Fibonacci Supertrend
Elevate your algorithmic trading with institutional-grade signal confluence
Strategy Genesis & Evolution
This advanced trading system represents the culmination of a personal research journey, evolving from my custom " Multi Fibonacci Supertrend with Signals " indicator into a comprehensive trading strategy. Built upon the exceptional trendline detection methodology pioneered by LuxAlgo in their " Trendlines with Breaks " indicator, I've engineered a systematic framework that integrates multiple technical factors into a cohesive trading system.
Core Fibonacci Principles
At the heart of this strategy lies the Fibonacci sequence application to volatility measurement:
// Fibonacci-based factors for multiple Supertrend calculations
factor1 = input.float(0.618, 'Factor 1 (Weak/Fibonacci)', minval = 0.01, step = 0.01)
factor2 = input.float(1.618, 'Factor 2 (Medium/Golden Ratio)', minval = 0.01, step = 0.01)
factor3 = input.float(2.618, 'Factor 3 (Strong/Extended Fib)', minval = 0.01, step = 0.01)
These precise Fibonacci ratios create a dynamic volatility envelope that adapts to changing market conditions while maintaining mathematical harmony with natural price movements.
Dynamic Trendline Detection
The strategy incorporates LuxAlgo's pioneering approach to trendline detection:
// Pivotal swing detection (inspired by LuxAlgo)
pivot_high = ta.pivothigh(swing_length, swing_length)
pivot_low = ta.pivotlow(swing_length, swing_length)
// Dynamic slope calculation using ATR
slope = atr_value / swing_length * atr_multiplier
// Update trendlines based on pivot detection
if bool(pivot_high)
upper_slope := slope
upper_trendline := pivot_high
else
upper_trendline := nz(upper_trendline) - nz(upper_slope)
This adaptive trendline approach automatically identifies key structural market boundaries, adjusting in real-time to evolving chart patterns.
Breakout State Management
The strategy implements sophisticated state tracking for breakout detection:
// Track breakouts with state variables
var int upper_breakout_state = 0
var int lower_breakout_state = 0
// Update breakout state when price crosses trendlines
upper_breakout_state := bool(pivot_high) ? 0 : close > upper_trendline ? 1 : upper_breakout_state
lower_breakout_state := bool(pivot_low) ? 0 : close < lower_trendline ? 1 : lower_breakout_state
// Detect new breakouts (state transitions)
bool new_upper_breakout = upper_breakout_state > upper_breakout_state
bool new_lower_breakout = lower_breakout_state > lower_breakout_state
This state-based approach enables precise identification of the exact moment when price breaks through a significant trendline.
Multi-Factor Signal Confluence
Entry signals require confirmation from multiple technical factors:
// Define entry conditions with multi-factor confluence
long_entry_condition = enable_long_positions and
upper_breakout_state > upper_breakout_state and // New trendline breakout
di_plus > di_minus and // Bullish DMI confirmation
close > smoothed_trend // Price above Supertrend envelope
// Execute trades only with full confirmation
if long_entry_condition
strategy.entry('L', strategy.long, comment = "LONG")
This strict requirement for confluence significantly reduces false signals and improves the quality of trade entries.
Advanced Risk Management
The strategy includes sophisticated risk controls with multiple methodologies:
// Calculate stop loss based on selected method
get_long_stop_loss_price(base_price) =>
switch stop_loss_method
'PERC' => base_price * (1 - long_stop_loss_percent)
'ATR' => base_price - long_stop_loss_atr_multiplier * entry_atr
'RR' => base_price - (get_long_take_profit_price() - base_price) / long_risk_reward_ratio
=> na
// Implement trailing functionality
strategy.exit(
id = 'Long Take Profit / Stop Loss',
from_entry = 'L',
qty_percent = take_profit_quantity_percent,
limit = trailing_take_profit_enabled ? na : long_take_profit_price,
stop = long_stop_loss_price,
trail_price = trailing_take_profit_enabled ? long_take_profit_price : na,
trail_offset = trailing_take_profit_enabled ? long_trailing_tp_step_ticks : na,
comment = "TP/SL Triggered"
)
This flexible approach adapts to varying market conditions while providing comprehensive downside protection.
Performance Characteristics
Rigorous backtesting demonstrates exceptional capital appreciation potential with impressive risk-adjusted metrics:
Remarkable total return profile (1,517%+)
Strong Sortino ratio (3.691) indicating superior downside risk control
Profit factor of 1.924 across all trades (2.153 for long positions)
Win rate exceeding 35% with balanced distribution across varied market conditions
Institutional Considerations
The strategy architecture addresses execution complexities faced by institutional participants with temporal filtering and date-range capabilities:
// Time Filter settings with flexible timezone support
import jason5480/time_filters/5 as time_filter
src_timezone = input.string(defval = 'Exchange', title = 'Source Timezone')
dst_timezone = input.string(defval = 'Exchange', title = 'Destination Timezone')
// Date range filtering for precise execution windows
use_from_date = input.bool(defval = true, title = 'Enable Start Date')
from_date = input.time(defval = timestamp('01 Jan 2022 00:00'), title = 'Start Date')
// Validate trading permission based on temporal constraints
date_filter_approved = time_filter.is_in_date_range(
use_from_date, from_date, use_to_date, to_date, src_timezone, dst_timezone
)
These capabilities enable precise execution timing and market session optimization critical for larger market participants.
Acknowledgments
Special thanks to LuxAlgo for the pioneering work on trendline detection and breakout identification that inspired elements of this strategy. Their innovative approach to technical analysis provided a valuable foundation upon which I could build my Fibonacci-based methodology.
This strategy is shared under the same Attribution-NonCommercial-ShareAlike 4.0 International (CC BY-NC-SA 4.0) license as LuxAlgo's original work.
Past performance is not indicative of future results. Conduct thorough analysis before implementing any algorithmic strategy.

Supertrend Fixed TP Unified with Time Filter (MSK)Trend Strategy Based on the SuperTrend Indicator
This strategy is based on the use of the adaptive SuperTrend indicator, which takes into account the current market volatility and acts as a dynamic trailing stop. The indicator is visualized on the chart with colors that change depending on the direction of the trade: green indicates an uptrend (long), while red indicates a downtrend (short).
How It Works:
A buy signal (long) is generated when a bar closes above the indicator line.
A sell signal (short) is triggered when a bar closes below the indicator line.
Strategy Settings:
Trading Modes :
Long only : Only long positions are allowed.
Short only : Only short positions are allowed.
Both : Both types of trades are permitted.
Take-Profit :
The strategy supports a simple percentage-based take-profit, allowing you to lock in profits during sharp price movements without waiting for a pullback.
The take-profit level and its value are visualized on the chart. Visualization can be disabled in the settings.
Colored Chart Areas :
Long and short areas on the chart are highlighted with background colors for easier analysis.
Price Level :
You can set a price level in the settings to restrict trade execution:
Long trades are executed only above the specified level.
Short trades are executed only below the specified level.
This mode can be enabled or disabled in the parameters.
________________________________________________________________
Описание стратегии (на русском языке)
Трендовая стратегия на основе индикатора SuperTrend
Стратегия основана на использовании адаптивного индикатора SuperTrend , который учитывает текущую волатильность рынка и играет роль динамического трейлинг-стопа. Индикатор визуализируется на графике цветом, который меняется в зависимости от направления сделки: зелёный цвет указывает на восходящий тренд (лонг), а красный — на нисходящий тренд (шорт).
Принцип работы:
Сигнал на покупку (лонг) генерируется при закрытии бара выше линии индикатора.
Сигнал на продажу (шорт) возникает при закрытии бара ниже линии индикатора.
Настройки стратегии:
Режимы торговли :
Long only : только лонговые позиции.
Short only : только шортовые позиции.
Both : разрешены оба типа сделок.
Тейк-профит :
Стратегия поддерживает простой процентный тейк-профит, что позволяет фиксировать прибыль при резком изменении цены без ожидания отката.
Уровень и значение тейк-профита визуализируются на графике. Визуализацию можно отключить в настройках.
Цветные области графика :
Лонговые и шортовые области графика выделяются цветом фона для удобства анализа.
Уровень цены :
В настройках можно задать уровень цены, который будет ограничивать выполнение сделок:
Лонговые сделки выполняются только выше указанного уровня.
Шортовые сделки выполняются только ниже указанного уровня.
Этот режим можно включать или отключать в параметрах.

Gold Futures 2M 5M Tick Move Indicator📢 Gold Futures Tick Move Indicator 🚀
Customizable Tick-Based Trading Alerts & Visualization
🔹 Overview:
The Gold Futures Tick Move Indicator is designed for traders who rely on tick-based price movements to detect significant market activity. This indicator identifies strong momentum moves, triggers customizable buy and sell signals, and provides clear trade range visualizations with take profit and stop loss levels.
🔹 Key Features:
✅ Customizable Tick Threshold – Adjust the number of ticks needed to trigger a buy/sell signal (default: 65 ticks).
✅ Take Profit & Stop Loss Levels – Automatically calculates and plots exit levels (default: 75 TP, 40 SL).
✅ Buy/Sell Alerts – Get real-time alerts when a candle moves beyond the defined tick threshold.
✅ Custom Colors for Trade Signals – Buy (teal #008080), Sell (hot pink #FF69B4).
✅ Trade Range Visualization – Background colors highlight long & short positions for better clarity.
✅ Candle Highlighting – Turns white when a tick-based signal is detected.
🔹 How It Works:
1️⃣ Set your tick movement threshold – Define how many ticks the price must move to trigger a trade signal.
2️⃣ Customize Take Profit & Stop Loss – Modify exit levels to match your strategy.
3️⃣ Wait for a Signal – If the price moves beyond the defined tick range, the indicator plots a Buy (teal) or Sell (hot pink) signal.
4️⃣ Monitor Trade Zones – Trade ranges are highlighted in teal or pink for quick visualization.
5️⃣ Receive Alerts – Set up TradingView alerts to be notified of trade opportunities.
🔹 Who is This For?
💰 Gold Futures Traders looking to capitalize on price momentum
📈 Scalpers & Day Traders seeking precise tick-based entries
🎯 Algo Traders who want automated alerts & visual cues

Pure Price Action StrategyTest Price Action Strategy from Lux Pure Price Action Indicator
How This Strategy Works:
Recognizing Trends & Reversals:
Break of Structure (BOS): A bullish signal indicating a trend continuation.
Market Structure Shift (MSS): A bearish signal indicating a potential reversal.
Analyzing Market Momentum:
It uses recent highs and lows to confirm whether the price is making higher highs (bullish) or lower lows (bearish).
Customizing Visualization Styles:
Buy signals (BUY Signal) are plotted as green upward arrows.
Sell signals (SELL Signal) are plotted as red downward arrows.
Stop-Loss (SL) & Take-Profit (TP): Configurable via percentage input.

Strategy SuperTrend SDI WebhookThis Pine Script™ strategy is designed for automated trading in TradingView. It combines the SuperTrend indicator and Smoothed Directional Indicator (SDI) to generate buy and sell signals, with additional risk management features like stop loss, take profit, and trailing stop. The script also includes settings for leverage trading, equity-based position sizing, and webhook integration.
Key Features
1. Date-based Trade Execution
The strategy is active only between the start and end dates set by the user.
times ensures that trades occur only within this predefined time range.
2. Position Sizing and Leverage
Uses leverage trading to adjust position size dynamically based on initial equity.
The user can set leverage (leverage) and percentage of equity (usdprcnt).
The position size is calculated dynamically (initial_capital) based on account performance.
3. Take Profit, Stop Loss, and Trailing Stop
Take Profit (tp): Defines the target profit percentage.
Stop Loss (sl): Defines the maximum allowable loss per trade.
Trailing Stop (tr): Adjusts dynamically based on trade performance to lock in profits.
4. SuperTrend Indicator
SuperTrend (ta.supertrend) is used to determine the market trend.
If the price is above the SuperTrend line, it indicates an uptrend (bullish).
If the price is below the SuperTrend line, it signals a downtrend (bearish).
Plots visual indicators (green/red lines and circles) to show trend changes.
5. Smoothed Directional Indicator (SDI)
SDI helps to identify trend strength and momentum.
It calculates +DI (bullish strength) and -DI (bearish strength).
If +DI is higher than -DI, the market is considered bullish.
If -DI is higher than +DI, the market is considered bearish.
The background color changes based on the SDI signal.
6. Buy & Sell Conditions
Long Entry (Buy) Conditions:
SDI confirms an uptrend (+DI > -DI).
SuperTrend confirms an uptrend (price crosses above the SuperTrend line).
Short Entry (Sell) Conditions:
SDI confirms a downtrend (+DI < -DI).
SuperTrend confirms a downtrend (price crosses below the SuperTrend line).
Optionally, trades can be filtered using crossovers (occrs option).
7. Trade Execution and Exits
Market entries:
Long (strategy.entry("Long")) when conditions match.
Short (strategy.entry("Short")) when bearish conditions are met.
Trade exits:
Uses predefined take profit, stop loss, and trailing stop levels.
Positions are closed if the strategy is out of the valid time range.
Usage
Automated Trading Strategy:
Can be integrated with webhooks for automated execution on supported trading platforms.
Trend-Following Strategy:
Uses SuperTrend & SDI to identify trend direction and strength.
Risk-Managed Leverage Trading:
Supports position sizing, stop losses, and trailing stops.
Backtesting & Optimization:
Can be used for historical performance analysis before deploying live.
Conclusion
This strategy is suitable for traders who want to automate their trading using SuperTrend and SDI indicators. It incorporates risk management tools like stop loss, take profit, and trailing stop, making it adaptable for leverage trading. Traders can customize settings, conduct backtests, and integrate it with webhooks for real-time trade execution. 🚀
Important Note:
This script is provided for educational and template purposes and does not constitute financial advice. Traders and investors should conduct their research and analysis before making any trading decisions.

WaveTrend Divergences, Candle Colouring and TP Signal [LuciTech]WaveTrend is a momentum-based oscillator designed to track trend strength, detect divergences, and highlight potential take-profit zones using Bollinger Bands. It provides a clear visualization of market conditions to help traders identify trend shifts and exhaustion points.
The WaveTrend Oscillator consists of a smoothed momentum line (WT Line) and a signal line, which work together to indicate trend direction and possible reversals. When the WT Line crosses above the signal line, it suggests bullish momentum, while crossing below signals bearish momentum.
Candle colouring changes dynamically based on WaveTrend crossovers. If the WT Line crosses above the signal line, candles turn bullish. If the WT Line crosses below the signal line, candles turn bearish. This provides an immediate visual cue for trend direction.
Divergence Detection identifies when price action contradicts the WaveTrend movement.
Bullish Divergence appears when price makes a lower low, but the WT Line forms a higher low, suggesting weakening bearish pressure.
Bearish Divergence appears when price makes a higher high, but the WT Line forms a lower high, indicating weakening bullish pressure.
Plus (+) Divergences are stronger signals that occur when the first pivot of the divergence happens at an extreme level—above +60 for bearish divergence or below -60 for bullish divergence. These levels suggest the market is overbought or oversold, making the divergence more significant.
Bollinger Band Signals highlight potential take-profit zones by detecting when the WT Line moves beyond its upper or lower Bollinger Band.
If the WT Line crosses above the upper band, it signals stretched bullish momentum, suggesting a possible pullback or reversal.
If the WT Line crosses below the lower band, it indicates stretched bearish momentum, warning of a potential bounce.
How It Works
The WaveTrend momentum calculation is based on an EMA-smoothed moving average to filter out noise and provide a more reliable trend indication.
The WT Line (momentum line) fluctuates based on market momentum.
The signal line smooths out the WT Line to help identify trend shifts.
When the WT Line crosses above the signal line, it suggests buying pressure, and when it crosses below, it indicates selling pressure.
Divergences are detected by comparing pivot highs and lows in price with pivot highs and lows in the WT Line.
A pivot forms when a local high or low is confirmed after a certain number of bars.
The indicator tracks whether price action and the WT Line are making opposite movements.
If a divergence occurs and the first pivot was beyond ±60, it is marked as a Plus Divergence, making it a stronger reversal signal.
Bollinger Bands are applied directly to the WT Line instead of price, identifying when the WT Line moves outside its volatility range. This helps traders recognize when momentum is overstretched and a potential reversal or retracement is likely.
Settings
Channel Length (default: 8) controls the period used to calculate the WT Line.
Average Length (default: 16) smooths the WT Line for better trend detection.
Divergences (on/off) enables or disables divergence plotting.
Candle colouring (on/off) applies or removes trend-based candle colour changes.
Bollinger Band Signals (on/off) toggles take-profit signals when the WT Line crosses the bands.
Bullish/Bearish colours allow customization of divergence and signal colours.
Interpretation
The WaveTrend Oscillator helps traders assess market momentum and trend strength.
Crossovers between the WT Line and signal line indicate potential trend reversals.
Divergences warn of weakening momentum and possible reversals, with Plus Divergences acting as stronger signals.
Bollinger Band Crosses highlight areas where momentum is overstretched, signaling potential profit-taking opportunities.
