HSI First 30m Candle Strategy (5m Chart)## HSI First Candle Breakout Strategy
USE on 10m TF for max profit rate.
**The HSI First Candle Breakout Strategy** is a systematic trading approach tailored for Hang Seng Index Futures during the main Hong Kong day session. The strategy is designed to capture early market momentum by reacting to the first significant move of the day.
### How It Works
- **Reference Candle:** At the start of each day session (09:00), the high and low of the first 15-minute candle are recorded.
- **Breakout Trigger:**
- A **buy (long) trade** is initiated if price breaks above the first candle’s high.
- A **sell (short) trade** is initiated if price breaks below the first candle’s low.
- **Stop Loss & Take Profit:**
- Stop-loss is placed on the opposite side of the reference candle.
- Take-profit target is set at a distance equal to the size of the reference candle (1R).
- **Filters:**
- Skip the day if the first candle’s range exceeds 200 index points.
- Only the first triggered direction is traded per session.
- All trades are closed before the market closes if neither target nor stop is hit.
- **Execution:** The strategy works best on intraday charts (5m or 15m) and is ideal for traders seeking disciplined, systematic intraday setups.
### Key Features
- Captures the day’s initial momentum burst.
- Strict risk management with predefined stops and targets.
- One trade per day, reducing overtrading and noise.
- Clear-cut, rule-based, and objective system—no discretion required.
**This strategy offers a transparent and robust framework for traders to systematically capture high-probability breakouts in the Hang Seng Index Futures market.**
Search in scripts for "trigger"

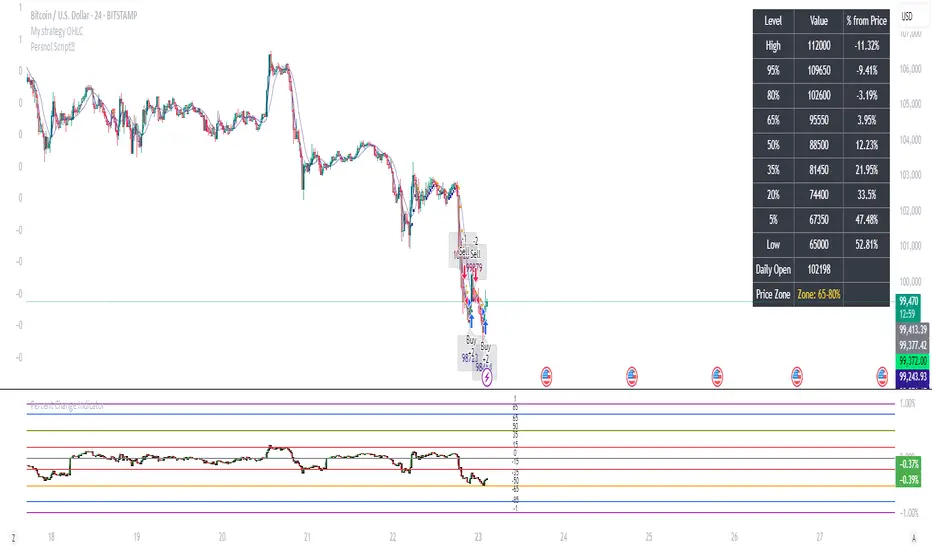
Percent Change IndicatorPercent Change Indicator Description
Overview:
The Percent Change Indicator is a Pine Script (version 6) indicator designed for TradingView to calculate and visualize the percentage change of the current close price relative to a user-selected reference price. It provides a customizable interface to display percentage changes as candlesticks or a line plot, with optional horizontal lines and labels for key levels. The indicator also includes visual signals and alerts for user-defined percentage thresholds, making it useful for identifying significant price movements.
Key Features:
1. Percentage Change Calculation:
- Computes the percentage change of the current close price compared to a reference price, scaled by a user-defined length parameter.
- Formula: percentChange = (close - refPrice) / refPrice * len
- The reference price is sourced from a user-selected timeframe (default: 1D) and price type (Open, High, Low, Close, HL2, HLC3, or HLCC4).
2. Visualization Options:
- Candlestick Plot: Displays percentage change as candlesticks, colored green for rising values and red for falling values.
- Line Plot: Plots the percentage change as a line, with the same color logic.
- Horizontal Lines: Optional horizontal lines at key percentage levels (0%, ±0.2%, ±0.5%, ±0.8%, ±1%) for reference.
- Labels: Optional labels for percentage levels (0, ±15%, ±35%, ±50%, ±65%, ±85%, ±100%) displayed at the chart's right edge.
- All visualizations are toggleable via input settings.
3. Signal and Alert System:
- Threshold-Based Signals: Plots green triangles below bars for long signals (percent change above a user-defined threshold) and red triangles above bars for short signals (percent change below the threshold).
- Alerts: Configurable alerts for long and short conditions, triggered when the percentage change crosses the user-defined threshold (default: 2%). Alert messages include the threshold value for clarity.
4. Customizable Inputs:
- Show Labels: Toggle visibility of percentage level labels (default: true).
- Show Percentage Change: Toggle the line plot of percentage change (default: true).
- Show HLines: Toggle visibility of horizontal reference lines (default: false).
- Show Candle Plot: Toggle the candlestick plot (default: true).
- Percent Change Length: Adjust the scaling factor for percentage change (default: 14).
- Plot Timeframe: Select the timeframe for the reference price (default: 1D).
- Price Type: Choose the reference price type (Open, High, Low, Close, HL2, HLC3, HLCC4; default: Open).
- Percentage Threshold: Set the threshold for long/short signals and alerts (default: 0.02 or 2%).
How It Works:
- The indicator fetches the reference price using request.security() based on the selected timeframe and price type.
- It calculates the percentage change and scales it by the user-defined length.
- Visuals (candlesticks, lines, labels, horizontal lines) are plotted based on user preferences.
- Long and short signals are generated when the percentage change exceeds or falls below the user-defined threshold, with corresponding triangles plotted and alerts triggered.
Use Cases:
- Trend Identification: Monitor significant price movements relative to a reference price.
- Signal Generation: Identify potential entry/exit points based on percentage change thresholds.
- Custom Analysis: Analyze price changes across different timeframes and price types for various trading strategies.
- Alert Notifications: Receive alerts for significant price movements to stay informed without constant chart monitoring.
Setup Instructions:
1. Add the indicator to a TradingView chart.
2. Adjust input settings (timeframe, price type, threshold, etc.) to suit your analysis.
3. Enable/disable visualization options (candlesticks, lines, labels, horizontal lines) as needed.
4. Set up alerts in TradingView:
- Go to the "Alerts" tab and select "Percent Change Indicator."
- Choose "Long Alert" or "Short Alert" to monitor threshold crossings.
- Configure alert frequency and notification method (e.g., email, webhook).
Notes:
- The indicator is non-overlay, displayed in a separate pane below the main chart.
- Alerts trigger on bar close by default; adjust TradingView alert settings for real-time notifications if needed.
- The indicator is released under the Mozilla Public License 2.0.
Author: Dshergill
This indicator is ideal for traders seeking a flexible tool to track percentage-based price movements with customizable visuals and alerts.
QQQ Strategy v2 ESL | easy-peasy-x This is a strategy optimized for QQQ (and SPY) for the 1H timeframe. It significantly outperforms passive buy-and-hold approach. With settings adjustments, it can be used on various assets like stocks and cryptos and various timeframes, although the default out of the box settings favor QQQ 1H.
The strategy uses various triggers to take both long and short trades. These can be adjusted in settings. If you try a different asset, see what combination of triggers works best for you.
Some of the triggers employ LuxAlgo's Ultimate RSI - shoutout to him for great script, check it out here .
Other triggers are based on custom signed standard deviation - basically the idea is to trade Bollinger Bands expansions (long to the upside, short to the downside) and fade or stay out of contractions.
There are three key moving averages in the strategy - LONG MA, SHORT MA, BASIC MA. Long and Short MAs are guides to eyes on the chart and also act as possible trend filters (adjustable in settings). Basic MA acts as guide to eye and a possible trade trigger (adjustable in settings).
There are a few trend filters the strategy can use - moving average, signed standard deviation, ultimate RSI or none. The filters act as an additional condition on triggers, making the strategy take trades only if both triggers and trend filter allows. That way one can filter out trades with unfavorable risk/reward (for instance, don't long if price is under the MA200). Different trade filters can be used for long and short trades.
The strategy employs various stop loss types, the default of which is a trailing %-based stop loss type. ATR-based stop loss is also available. The default 1.5% trailing stop loss is suitable for leveraged trading.
Lastly, the strategy can trigger take profit orders if certain conditions are met, adjustable in settings. Also, it can hold onto winning trades and exit only after stop out (in which case, consecutive triggers to take other positions will be ignored until stop out).
Let me know if you like it and if you use it, what kind of tweaks would you like to see.
With kind regards,
easy-peasy-x

Reversal Trap Sniper – Verified VersionReversal Trap Sniper
Overview
Reversal Trap Sniper is a counterintuitive momentum-following strategy that identifies "reversal traps"—situations where traders expect a market reversal based on RSI, but the price continues trending. By detecting these failed reversal signals, the strategy enters trades in the trend direction, often catching strong follow-through moves.
How It Works
The system monitors the Relative Strength Index (RSI). When RSI moves above the overbought level (e.g., 70) and then drops back below it, many traders interpret this as a sell signal.
However, this strategy treats such moves with caution. If the RSI pulls back below the overbought threshold but the price continues to rise, the system considers it a "reversal trap"—a fakeout.
In such cases, instead of going short, the strategy enters a long position, assuming that the trend is still valid and those betting on a reversal may fuel a breakout.
Similarly, if RSI rises above the oversold level from below, but price continues falling, a short trade is triggered.
Entries are followed by ATR-based stop-loss and dynamic take-profit (2× risk), with a fallback time-based exit after 30 bars.
Key Features
- Detects failed RSI-based reversals ("traps")
- Follows momentum after the trap is triggered
- Uses ATR for dynamic stop-loss and take-profit
- Auto-exit after a fixed bar count (30 bars)
- Visual markers on chart for transparency
- Realistic trading assumptions: 0.05% commission, slippage, and capped pyramiding
Parameter Explanation
RSI Length (14): Standard RSI calculation period
Overbought/Oversold Levels (70/30): Common thresholds used by many traders
ATR Length (14): Used to define stop-loss and target dynamically
Risk-Reward Ratio (2.0): Take-profit is set at 2× the stop-loss distance
Max Holding Bars (30): Ensures trades don’t remain open indefinitely
Pyramiding (10): Allows scaling into trades, simulating real-world strategy stacking
Originality Note
This strategy inverts traditional RSI logic. Instead of treating overbought/oversold conditions as signals for reversal, it waits for those signals to fail. Only after such failures, confirmed by continued price action in the same direction, does the system enter trades. This logic is based on the behavioral observation that failed reversal signals often trigger stronger trend continuation—making this strategy uniquely positioned to exploit trap scenarios.
Disclaimer
This script is for educational and research purposes only. Trading involves risk, and past performance does not guarantee future results. Always test thoroughly before applying with live capital.

RSI3M3+ v.1.8RSI3M3+ v.1.8 Indicator
This script is an advanced trading indicator based on Walter J. Bressert's cycle analysis methodology, combined with an RSI (Relative Strength Index) variation. Let me break it down and explain how it works.
Core Concepts
The RSI3M3+ indicator combines:
A short-term RSI (3-period)
A 3-period moving average to smooth the RSI
Bressert's cycle analysis principles to identify optimal trading points
RSI3M3+ Indicator VisualizationImage Walter J. Bressert's Cycle Analysis Concepts
Walter Bressert was a pioneer in cycle analysis trading who believed markets move in cyclical patterns that can be measured and predicted. His key principles integrated into this indicator include:
Trading Cycles: Markets move in cycles with measurable time spans from low to low
Timing Bands: Projected periods when the next cyclical low or high is anticipated
Oscillator Use: Using oscillators like RSI to confirm cycle position
Entry/Exit Rules: Specific rules for trade entry and exit based on cycle position
Key Parameters in the Script
Basic RSI Parameters
Required bars: Minimum number of bars needed (default: 20)
Overbought region: RSI level considered overbought (default: 70)
Oversold region: RSI level considered oversold (default: 30)
Bressert-Specific Parameters
Cycle Detection Length: Lookback period for cycle identification (default: 30)
Minimum/Maximum Cycle Length: Expected cycle duration in days (default: 15-30)
Buy Line: Lower threshold for buy signals (default: 40)
Sell Line: Upper threshold for sell signals (default: 60)
How the Indicator Works
RSI3M3 Calculation:
Calculates a 3-period RSI (sRSI)
Smooths it with a 3-period moving average (sMA)
Cycle Detection:
Identifies bottoms: When the RSI is below the buy line (40) and starting to turn up
Identifies tops: When the RSI is above the sell line (60) and starting to turn down
Records these points to calculate cycle lengths
Timing Bands:
Projects when the next cycle bottom or top should occur
Creates visual bands on the chart showing these expected time windows
Signal Generation:
Buy signals occur when the RSI turns up from below the oversold level (30)
Sell signals occur when the RSI turns down from above the overbought level (70)
Enhanced by Bressert's specific timing rules
Bressert's Five Trading Rules (Implemented in the Script)
Cycle Timing: The low must be 15-30 market days from the previous Trading Cycle bottom
Prior Top Validation: A Trading Cycle high must have occurred with the oscillator above 60
Oscillator Behavior: The oscillator must drop below 40 and turn up
Entry Trigger: Entry is triggered by a rise above the price high of the upturn day
Protective Stop: Place stop slightly below the Trading Cycle low (implemented as 99% of bottom price)
How to Use the Indicator
Reading the Chart
Main Plot Area:
Green line: 3-period RSI
Red line: 3-period moving average of the RSI
Horizontal bands: Oversold (30) and Overbought (70) regions
Dotted lines: Buy line (40) and Sell line (60)
Yellow vertical bands: Projected timing windows for next cycle bottom
Signals:
Green up arrows: Buy signals
Red down arrows: Sell signals
Trading Strategy
For Buy Signals:
Wait for the RSI to drop below the buy line (40)
Look for an upturn in the RSI from below this level
Enter the trade when price rises above the high of the upturn day
Place a protective stop at 99% of the Trading Cycle low
For Sell Signals:
Wait for the RSI to rise above the sell line (60)
Look for a downturn in the RSI from above this level
Consider exiting or taking profits when a sell signal appears
Alternative exit: When price moves below the low of the downturn day
Cycle Timing Enhancement:
Pay attention to the yellow timing bands
Signals occurring within these bands have higher probability of success
Signals outside these bands may be less reliable
Practical Tips for Using RSI3M3+
Timeframe Selection:
The indicator works best on daily charts for intermediate-term trading
Can be used on weekly charts for longer-term position trading
On intraday charts, adjust cycle lengths accordingly
Market Applicability:
Works well in trending markets with clear cyclical behavior
Less effective in choppy, non-trending markets
Consider additional indicators for trend confirmation
Parameter Adjustment:
Different markets may have different natural cycle lengths
You may need to adjust the min/max cycle length parameters
Higher volatility markets may need wider overbought/oversold levels
Trade Management:
Enter trades when all Bressert's conditions are met
Use the protective stop as defined (99% of cycle low)
Consider taking partial profits at the projected cycle high timing
Advanced Techniques
Multiple Timeframe Analysis:
Confirm signals with the same indicator on higher timeframes
Enter in the direction of the larger cycle when smaller and larger cycles align
Divergence Detection:
Look for price making new lows while RSI makes higher lows (bullish)
Look for price making new highs while RSI makes lower highs (bearish)
Confluence with Price Action:
Combine with support/resistance levels
Use with candlestick patterns for confirmation
Consider volume confirmation of cycle turns
This RSI3M3+ indicator combines the responsiveness of a short-term RSI with the predictive power of Bressert's cycle analysis, offering traders a sophisticated tool for identifying high-probability trading opportunities based on market cycles and momentum shifts.
THANK YOU FOR PREVIOUS CODER THAT EFFORT TO CREATE THE EARLIER VERSION THAT MAKE WALTER J BRESSERT CONCEPT IN TRADINGVIEW @ADutchTourist

Red & Green Zone ReversalOverview
The “Red & Green Zone Reversal” indicator is designed to visually highlight potential reversal zones on your chart by using a combination of Bollinger Bands and the Relative Strength Index (RSI).
It overlays on the chart and provides background color cues—red for oversold conditions and green for overbought conditions—along with corresponding alert triggers.
Key Components
Overlay: The indicator is set to overlay the chart, meaning its visual cues (colored backgrounds) are drawn directly on the price chart.
Bollinger Bands Calculation
Period: A 20-period simple moving average (SMA) is calculated from the closing prices.
Standard Deviation Multiplier: A multiplier of 2.0 is applied.
Bands Defined:
Basis: The 20-period SMA.
Deviation: Calculated as 2 times the standard deviation over the same period.
Upper Band: Basis plus the deviation.
Lower Band: Basis minus the deviation.
RSI Calculation
Period: The RSI is computed over a 14-period span using the closing prices.
Thresholds:
Oversold Threshold: 30 (used for the red zone condition).
Overbought Threshold: 70 (used for the green zone condition).
Zone Conditions
Red Zone (Oversold):
Criteria: The price is below the lower Bollinger Band and the RSI is below 30.
Purpose: Highlights a situation where the asset may be deeply oversold, signaling a potential reversal to the upside.
Green Zone (Overbought):
Criteria: The price is above the upper Bollinger Band and the RSI is above 70.
Purpose: Indicates that the asset may be overbought, potentially signaling a reversal to the downside.
Visual and Alert Components
Background Coloring:
Red Background: Applied when the red zone condition is met (using a semi-transparent red).
Green Background: Applied when the green zone condition is met (using a semi-transparent green).
Alerts:
Red Alert: An alert condition titled “Deep Oversold Alert” is triggered with the message “Deep Oversold Signal triggered!” when the red zone criteria are satisfied.
Green Alert: Similarly, an alert condition titled “Deep Overbought Alert” is triggered with the message “Deep Overbought Signal triggered!” when the green zone criteria are met.
Important Disclaimers
Not Financial Advice:
This indicator is provided for informational and analytical purposes only. It does not constitute trading advice or a recommendation to buy or sell any asset. Traders should use it as one of several tools in their analysis and should perform their own due diligence.
Risk Management:
Trading inherently involves risk. Past performance is not indicative of future results. Always implement appropriate risk management and use stop losses where necessary.
Summary
In summary, the “Red & Green Zone Reversal” indicator uses Bollinger Bands and RSI to detect extreme market conditions. It visually marks oversold (red) and overbought (green) conditions directly on the chart and offers alert conditions to help traders monitor these potential reversal points.
Enjoy!!

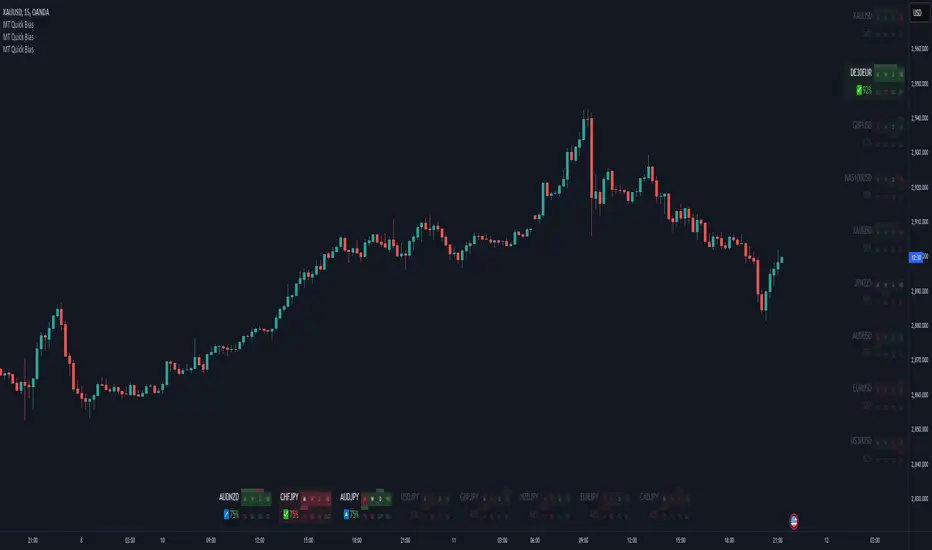
Momentum Theory Quick BiasMomentum Theory Quick Bias is a watchlist screener tool for rapid multi-timeframe analysis. It displays a variety of information from higher timeframes in order to set a directional bias including: breakout levels, peak levels, previous bar closes, and swing points.
✅ 8 Symbol Watchlist Scanner
✅ Quickly Set Directional Bias
✅ For Scalpers, Day Traders, and Swing Traders
--- 📷 INDICATOR GALLERY ---
--- 🚀 QUICK LOOK ---
✔ Multi-Timeframe Analysis
Displays various higher timeframe information in order to read how an asset is moving with one quick glance. Utilizes icons and colors that serve as visual cues.
--- ⚡ FEATURES ---
✔ Breakout Bias
Shows if the current price is above or below the breakout level on the timeframe.
✔ Peak Bias
Shows if the current previous peak has been triggered and where price is relative to it.
✔ Previous Bar Close
Shows how the previous bar closed and whether it's bullish or bearish.
Breakout
Fakeout
Inside
Outside
✔ Swing Point
Shows if the timeframe has currently flipped its breakout level.
✔ Bias Alignment
Shows visual icons if there is bias alignment between the timeframes.
↗️↘️ Breakout Bias Alignment
🔼🔽 Peak Bias Alignment
🔀 Breakout and Peak Bias Alignment, but opposite
✅ Breakout and Peak Bias Alignment
✔ Quick Analysis
Hover over the symbol name to view which timeframe levels are bullish or bearish and if peak levels have been triggered.
--- 🔥 OTHER FEATURES ---
✔ Built-In Presets
Create your own custom watchlist or use one of the built-in ones (using Oanda charts)
It's recommended to use the same source for all assets in your watchlist whenever possible
✔ Customized Layouts
Display the watchlist in a variety of different column arrangements.
✔ Dark and Light Modes
Adjustable theme colors to trade your chart the way you want.
✔ Plug-and-Play
Automatically changes the relevant levels depending on the viewed timeframe. Just fill in your watchlist, add it to your chart, and start trading!
Set the indicator to the following timeframes to view those arrangements:
Month Timeframe - Y / 6M / 3M / M
Week Timeframe - 6M / 3M / M / W
Day Timeframe - 3M / M / W / D
H4 Timeframe - Y / M / W / D
M15 Timeframe - M / W / D / H8
M10 Timeframe - M / W / D / H4
M5 Timeframe - W / D / H8 / H2
M3 Timeframe - W / D / H4 / H1
M2 Timeframe - D / H8 / H2 / M30
M1 Timeframe - D / H4 / H1 / M15
--- 📝 HOW TO USE ---
1) Create your watchlist or use one of the built-in presets and place it on the timeframe you want to see. If no watchlist is created, it automatically sets to the current asset.
2) Alignments will trigger in real-time and push to the top of the column.
It is recommended to place the indicator in a different chart window, so it won't have to refresh every time the asset or timeframe changes.
Average High-Low Range + IBS Reversal Strategy█ STRATEGY DESCRIPTION
The "Average High-Low Range + IBS Reversal Strategy" is a mean-reversion strategy designed to identify potential buying opportunities when the price deviates significantly from its average high-low range and the Internal Bar Strength (IBS) indicates oversold conditions. It enters a long position when specific conditions are met and exits when the price shows strength by exceeding the previous bar's high. This strategy is suitable for use on various timeframes.
█ WHAT IS THE AVERAGE HIGH-LOW RANGE?
The Average High-Low Range is calculated as the Simple Moving Average (SMA) of the difference between the high and low prices over a specified period. It helps identify periods of increased volatility and potential reversal points.
█ WHAT IS INTERNAL BAR STRENGTH (IBS)?
Internal Bar Strength (IBS) is a measure of where the closing price is relative to the high and low of the bar. It is calculated as:
IBS = (Close - Low) / (High - Low)
A low IBS value (e.g., below 0.2) indicates that the close is near the low of the bar, suggesting oversold conditions.
█ SIGNAL GENERATION
1. LONG ENTRY
A Buy Signal is triggered when:
The close price has been below the buy threshold (calculated as `upper - (2.5 * hl_avg)`) for a specified number of consecutive bars (`bars_below_threshold`).
The IBS value is below the specified buy threshold (`ibs_buy_treshold`).
The signal occurs within the specified time window (between `Start Time` and `End Time`).
2. EXIT CONDITION
A Sell Signal is generated when the current closing price exceeds the high of the previous bar (`close > high `). This indicates that the price has shown strength, potentially confirming the reversal and prompting the strategy to exit the position.
█ ADDITIONAL SETTINGS
Length: The lookback period for calculating the average high-low range. Default is 20.
Bars Below Threshold: The number of consecutive bars the price must remain below the buy threshold to trigger a Buy Signal. Default is 2.
IBS Buy Threshold: The IBS value below which a Buy Signal is triggered. Default is 0.2.
Start Time and End Time: The time window during which the strategy is allowed to execute trades.
█ PERFORMANCE OVERVIEW
This strategy is designed for mean-reverting markets and performs best when the price frequently deviates from its average high-low range.
It is sensitive to oversold conditions, as indicated by the IBS, which helps to identify potential reversals.
Backtesting results should be analyzed to optimize the Length, Bars Below Threshold, and IBS Buy Threshold parameters for specific instruments.

VPSA-VTDDear Sir/Madam,
I am pleased to present the next iteration of my indicator concept, which, in my opinion, serves as a highly useful tool for analyzing markets using the Volume Spread Analysis (VSA) method or the Wyckoff methodology.
The VPSA (Volume-Price Spread Analysis), the latest version in the family of scripts I’ve developed, appears to perform its task effectively. The combination of visualizing normalized data alongside their significance, achieved through the application of Z-Score standardization, proved to be a sound solution. Therefore, I decided to take it a step further and expand my project with a complementary approach to the existing one.
Theory
At the outset, I want to acknowledge that I’m aware of the existence of other probabilistic models used in financial markets, which may describe these phenomena more accurately. However, in line with Occam's Razor, I aimed to maintain simplicity in the analysis and interpretation of the concepts below. For this reason, I focused on describing the data using the Gaussian distribution.
The data I read from the chart — primarily the closing price, the high-low price difference (spread), and volume — exhibit cyclical patterns. These cycles are described by Wyckoff's methodology, while VSA complements and presents them from a different perspective. I will refrain from explaining these methods in depth due to their complexity and broad scope. What matters is that within these cycles, various events occur, described by candles or bars in distinct ways, characterized by different spreads and volumes. When observing the chart, I notice periods of lower volatility, often accompanied by lower volumes, as well as periods of high volatility and significant volumes. It’s important to find harmony within this apparent chaos. I think that chart interpretation cannot happen without considering the broader context, but the more variables I include in the analytical process, the more challenges arise. For instance, how can I determine if something is large (wide) or small (narrow)? For elements like volume or spread, my script provides a partial answer to this question. Now, let’s get to the point.
Technical Overview
The first technique I applied is Min-Max Normalization. With its help, the script adjusts volume and spread values to a range between 0 and 1. This allows for a comparable bar chart, where a wide bar represents volume, and a narrow one represents spread. Without normalization, visually comparing values that differ by several orders of magnitude would be inconvenient. If the indicator shows that one bar has a unit spread value while another has half that value, it means the first bar is twice as large. The ratio is preserved.
The second technique I used is Z-Score Standardization. This concept is based on the normal distribution, characterized by variables such as the mean and standard deviation, which measures data dispersion around the mean. The Z-Score indicates how many standard deviations a given value deviates from the population mean. The higher the Z-Score, the more the examined object deviates from the mean. If an object has a Z-Score of 3, it falls within 0.1% of the population, making it a rare occurrence or even an anomaly. In the context of chart analysis, such strong deviations are events like climaxes, which often signal the end of a trend, though not always. In my script, I assigned specific colors to frequently occurring Z-Score values:
Below 1 – Blue
Above 1 – Green
Above 2 – Red
Above 3 – Fuchsia
These colors are applied to both spread and volume, allowing for quick visual interpretation of data.
Volume Trend Detector (VTD)
The above forms the foundation of VPSA. However, I have extended the script with a Volume Trend Detector (VTD). The idea is that when I consider market structure - by market structure, I mean the overall chart, support and resistance levels, candles, and patterns typical of spread and volume analysis as well as Wyckoff patterns - I look for price ranges where there is a lack of supply, demand, or clues left behind by Smart Money or the market's enigmatic identity known as the Composite Man. This is essential because, as these clues and behaviors of market participants — expressed through the chart’s dynamics - reflect the actions, decisions, and emotions of all players. These behaviors can help interpret the bull-bear battle and estimate the probability of their next moves, which is one of the key factors for a trader relying on technical analysis to make a trade decision.
I enhanced the script with a Volume Trend Detector, which operates in two modes:
Step-by-Step Logic
The detector identifies expected volume dynamics. For instance, when looking for signs of a lack of bullish interest, I focus on setups with decreasing volatility and volume, particularly for bullish candles. These setups are referred to as No Demand patterns, according to Tom Williams' methodology.
Simple Moving Average (SMA)
The detector can also operate based on a simple moving average, helping to identify systematic trends in declining volume, indicating potential imbalances in market forces.
I’ve designed the program to allow the selection of candle types and volume characteristics to which the script will pay particular attention and notify me of specific market conditions.
Advantages and Disadvantages
Advantages:
Unified visualization of normalized spread and volume, saving time and improving efficiency.
The use of Z-Score as a consistent and repeatable relative mechanism for marking examined values.
The use of colors in visualization as a reference to Z-Score values.
The possibility to set up a continuous alert system that monitors the market in real time.
The use of EMA (Exponential Moving Average) as a moving average for Z-Score.
The goal of these features is to save my time, which is the only truly invaluable resource.
Disadvantages:
The assumption that the data follows a normal distribution, which may lead to inaccurate interpretations.
A fixed analysis period, which may not be perfectly suited to changing market conditions.
The use of EMA as a moving average for Z-Score, listed both as an advantage and a disadvantage depending on market context.
I have included comments within the code to explain the logic behind each part. For those who seek detailed mathematical formulas, I invite you to explore the code itself.
Defining Program Parameters:
Numerical Conditions:
VPSA Period for Analysis – The number of candles analyzed.
Normalized Spread Alert Threshold – The expected normalized spread value; defines how large or small the spread should be, with a range of 0-1.00.
Normalized Volume Alert Threshold – The expected normalized volume value; defines how large or small the volume should be, with a range of 0-1.00.
Spread Z-SCORE Alert Threshold – The Z-SCORE value for the spread; determines how much the spread deviates from the average, with a range of 0-4 (a higher value can be entered, but from a logical standpoint, exceeding 4 is unnecessary).
Volume Z-SCORE Alert Threshold – The Z-SCORE value for volume; determines how much the volume deviates from the average, with a range of 0-4 (the same logical note as above applies).
Logical Conditions:
Logical conditions describe whether the expected value should be less than or equal to or greater than or equal to the numerical condition.
All four parameters accept two possibilities and are analogous to the numerical conditions.
Volume Trend Detector:
Volume Trend Detector Period for Analysis – The analysis period, indicating the number of candles examined.
Method of Trend Determination – The method used to determine the trend. Possible values: Step by Step or SMA.
Trend Direction – The expected trend direction. Possible values: Upward or Downward.
Candle Type – The type of candle taken into account. Possible values: Bullish, Bearish, or Any.
The last available setting is the option to enable a joint alert for VPSA and VTD.
When enabled, VPSA will trigger on the last closed candle, regardless of the VTD analysis period.
Example Use Cases (Labels Visible in the Script Window Indicate Triggered Alerts):
The provided labels in the chart window mark where specific conditions were met and alerts were triggered.
Summary and Reflections
The program I present is a strong tool in the ongoing "game" with the Composite Man.
However, it requires familiarity and understanding of the underlying methodologies to fully utilize its potential.
Of course, like any technical analysis tool, it is not without flaws. There is no indicator that serves as a perfect Grail, accurately signaling Buy or Sell in every case.
I would like to thank those who have read through my thoughts to the end and are willing to take a closer look at my work by using this script.
If you encounter any errors or have suggestions for improvement, please feel free to contact me.
I wish you good health and accurately interpreted market structures, leading to successful trades!
CatTheTrader

First 15-Min Candle Detector [With Breakout Alerts]Indicator: First 15-Minute Candle Detector
Purpose
This indicator helps traders by identifying and marking the high, low, and mid-point of the first 15-minute candle of the market session. It also provides visual aids and alerts for price breakouts above or below these levels, making it ideal for intraday trading strategies.
This script is suitable for traders focusing on early session momentum or reversal strategies.
Key Features
Market Start Customization: Configure the market start time (hour and minute) to align with your trading session or exchange timezone.
Visual Aids:
Horizontal lines to mark the High , Low , and Mid-point of the first 15-minute candle.
Background highlighting to identify the first 15-minute candle.
Configurable colors and line widths for clear visuals.
Breakout Alerts:
Real-time alerts for breakouts above the high or below the low of the first 15-minute candle.
Customizable alert messages.
Alerts configured using alertcondition .
Dynamic Adjustments:
Adapts dynamically to timeframes of 15 minutes or lower.
Resets and recalculates at the start of each new session.
Inputs and Configurations
Market Settings:
Market Start Hour: Default is 9.
Market Start Minute: Default is 30.
Visual Settings:
Enable/disable background highlighting.
Set colors for the background, high line, low line, and mid-line.
Adjust line width (1 to 5).
Toggle the visibility of the mid-line.
Alert Settings:
Enable breakout alerts.
Set custom alert messages for high and low breakouts.
How It Works
// First 15-Minute Candle Detection
The indicator monitors the first 15-minute candle after the market opens based on the configured start time. It records the high , low , and calculates the mid-point of this candle.
// Visual Markings
Horizontal lines are drawn at the high, low, and mid-point of the first 15-minute candle, extending to the right for the rest of the session.
// Breakout Detection
The indicator checks for price breakouts above the high or below the low of the first 15-minute candle and triggers alerts if enabled.
// Dynamic Reset
The indicator resets values and deletes previous session lines at the start of each new session.
Conditions and Alerts
Breakout Conditions:
High Breakout: The closing price exceeds the high of the first 15-minute candle.
Low Breakout: The closing price falls below the low of the first 15-minute candle.
Alert Triggers: Configurable alerts notify you of breakouts in real-time.
Use Cases
Intraday Traders: Ideal for early-session momentum or reversal strategies.
Breakout Traders: Helps identify entry points when price breaks key levels.
Visual Clarity: Simplifies tracking important session levels.
Limitations
Works only on 15-minute or lower timeframes.
Requires accurate market start time configuration.

Strategy: Candlestick Wick Analysis with Volume Conditions
This strategy focuses on analyzing the wicks (or shadows) of candlesticks to identify potential trading opportunities based on candlestick structure and volume. Based on these criteria, it places stop orders at the extremities of the wicks when certain conditions are met, thus increasing the chances of capturing significant price movements.
Trading Criteria
Volume Conditions:
The strategy checks if the volume of the current candle is higher than that of the previous three candles. This ensures that the observed price movement is supported by significant volume, increasing the probability that the price will continue in the same direction.
Wick Analysis:
Upper Wick:
If the upper wick of a candle represents more than 90% of its body size and is longer than the lower wick, this indicates that the price tested a resistance level before pulling back.
Order Placement: In this case, a Buy Stop order is placed at the upper extremity of the wick. This means that if the price rises back to this level, the order will be triggered, and the trader will take a buy position.
SL Management: A stop-loss is then placed below the lowest point of the same candle. This protects the trader by limiting losses if the price falls back after the order is triggered.
Lower Wick:
If the lower wick of a candle is longer than the upper wick and represents more than 90% of its body size, this indicates that the price tested a support level before rising.
Order Placement: In this case, a Sell Stop order is placed at the lower extremity of the wick. Thus, if the price drops back to this level, the order will be triggered, and the trader will take a sell position.
SL Management: A stop-loss is then placed above the highest point of the same candle. This ensures risk management by limiting losses if the price rebounds upward after the order is triggered.
Strategy Advantages
Responsiveness to Price Movements: The strategy is designed to detect significant price movements based on the market's reaction around support and resistance levels. By placing stop orders directly at the wick extremities, it allows capturing strong movements in the direction indicated by the candles.
Securing Positions: Using stop-losses positioned just above or below key levels (wicks) provides better risk management. If the market doesn't move as expected, the position is automatically closed with a limited loss.
Clear Visual Indicators: Symbols are displayed on the chart at the points where orders have been placed, making it easier to understand trading decisions. This helps to quickly identify the support or resistance levels tested by the price, as well as potential entry points.
Conclusion
The strategy is based on the idea that large wicks signal areas where buyers or sellers have tested significant price levels before temporarily retreating. By placing stop orders at the extremities of these wicks, the strategy allows capturing price movements when they confirm, while limiting risks through strategically placed stop-losses. It thus offers a balanced approach between capturing potential profit and managing risk.
This description emphasizes the idea of capturing significant market movements with stop orders while providing a clear explanation of the logic and risk management. It’s tailored for publication on TradingView and highlights the robustness of the strategy.

Cloak & Dagger Heikin-ashiThis indicator is intended to reduce market noise by averaging "Heikin-ashi" a few more times.
You can set the number of averages and how the closing price is calculated.
The Modes:
There are several presets.
The "Mode 1" is more conservative and flips fewer times, but with less noise.
(Averaged by 5 times, Close calculated by oc2)
The "Mode 2" is more aggressive, with more flips and faster timing.
(Averaged by 10 times, Close calculated by ohlc4)
Triggers:
Triggers the inversion of the bar. It can be visualized and alerts can be set.

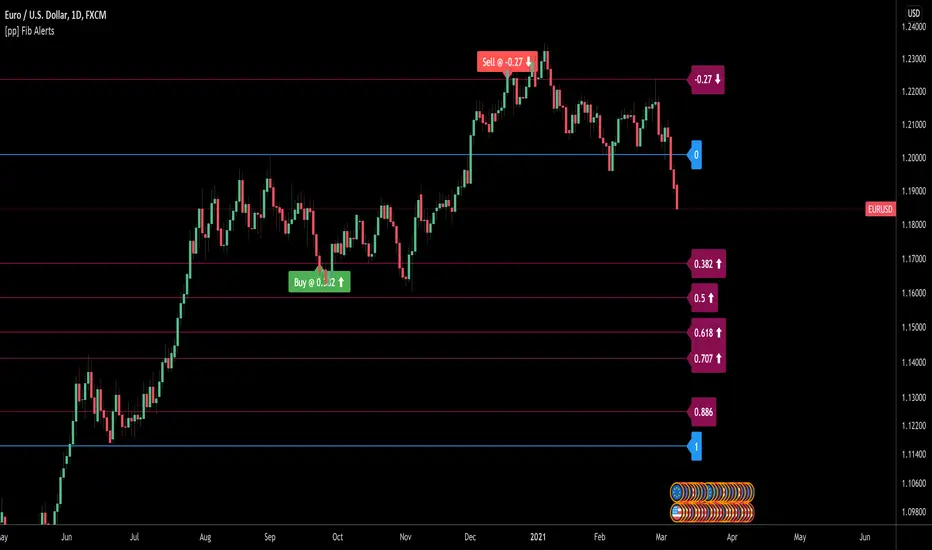
[pp] Fib AlertsUsing the new input.price() function we can now automate our fibonacci tools a little better.
This tool is designed with the intention of trading off of a fibonacci level using alerts.
How to use:
1.Add the indicator to your chart.
2. Place the bottom price where you would normally start your fibonnaci drawing
3. Place the top price where you would normally end your fibonacci drawing
4. Set your alert syntax "buy alert message" and "sell alert message" Should be replaced with webhook configurations or something better.
5. Fibonacci values > 1 (ie. 0.382, 0.5, 0.618) are recognized as retracements and work well as buying opportunities. When the price crosses one of these levels the "buy alert message" alert will be immediately triggered ONCE per BAR (I may update this in the future so it can only trigger ONCE ever to avoid multiple orders)
6. Fibonacci values < 1 (ie . -0.113, -0.27) are recognized as extensions levels and work well as selling opportunities. When the price crosses one of these levels the "Sell alert message" alert will be triggered.
If anyone knows how to convert the fibonacci values to logarithmic values I would greatly appreciate insight.
Hotch v1.02 RSI+Fractals/VWAP Bands/Smoothed Moving Average. In this script the RSI is used the limit number of displayed fractals to only those fractals that are triggered in the RSI Overbought and Oversold areas. This helps keep the chart cleaner looking when combined with other indicators so other icons that are plotted above and below candles are not covered up.
For example if the RSI drops below 30 the next fractal would be displayed.
If the RSI stays below 30 each fractal would be displayed.
If the RSI dips below 30 and returns above 30 before there is a fractal is displayed, the next valid fractal would still be displayed.
With optimization of the RSI values this indicator can be used in confluence with the included VWAP bands and Moving average to find trend reversal entry points for trades. Also recommended is to use a divergence identifying lower indicator as a secondary confirmation of trade entry.
Example of a potential long entry using the displayed chart.
1) RSI under 30
2) Price was recently outside of your chosen VWAP multiple.
3) a fractal was triggered.
Additionaly:
4) Use other indicators or other confluences for a stronger trade signal.
5) Use your preferred method of determining entry price stop loss and take profit.
NOTE: Fractals normally paint two bars behind the current bar. In this code, with the combination of the RSI and Fractal Trigger, the fractal paints an icon on the current bar.

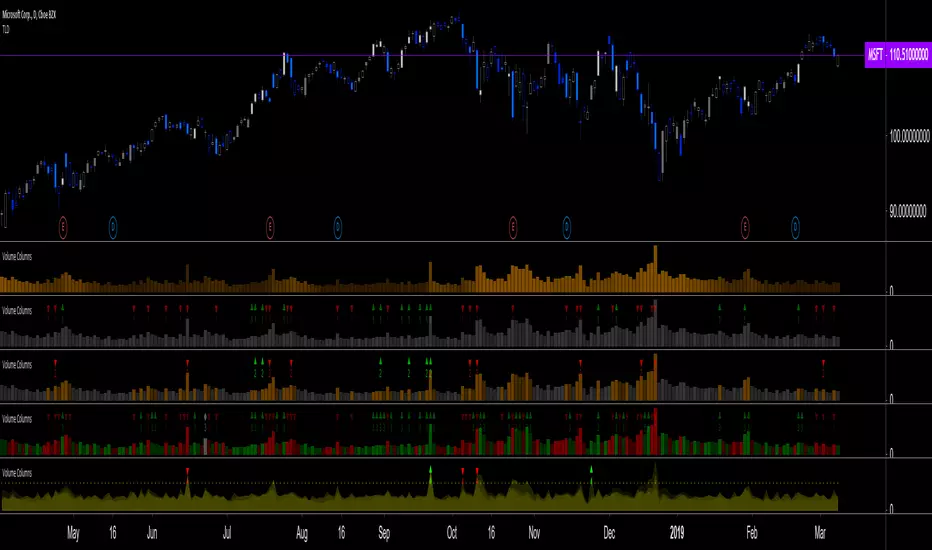
Volume Columns w. Alerts (V) [LucF]These are volume columns on steroids, for serious volume users. You can use the indicator to show volume columns or relative volume. You can define alerts using numerous conditions in both column and relative modes simultaneously. Multiple coloring schemes allow you to reveal volume columns in a much more useful light than the two-color standard.
Features
Seven Color Schemes
Plain gray.
Different color for columns above average MA.
Standard green and red.
Color gradient using the relative position of MA (default mode).
The first 3 schemes allow for highlighting increasing volume columns.
A gray column in an otherwise colored scheme indicates no change in price.
Two Modes
Column Mode: In this mode you can show the volume MA and mask the columns under it. The standard is an EMA because I think it better suits volume’s quick changes, but you can change it to the usual simple MA, as well as define its length.
Relative Volume: Calculations have been kept rudimentary. Current volume is simply compared to the previous bar’s volume. In order to compensate for this, a multiple area mode also compares current volume to 5, 15, 50 and 200 periods MAs. You can choose to view only the main relative volume value. Relative volume is capped in order to prevent the loss of detail caused by wild increases. The default cap is 10, but you can define your own. Spikes that are capped show a dot at their top. A separate threshold (its default value is the standard 2) is included for relative volume; it is used to generate relative volume markers.
Four Markers
Bumps (marker 1): A bump occurs when an increasing volume column is above its MA and the candle’s close is above/below the previous close.
Double Bumps (marker 2): A double bump occurs when 2 bumps are present in the last 3 bars.
Volume Over MA (marker 3): Triggers whenever volume is above MA. This is the noisiest of the markers.
Relative Volume (marker 4): This event occurs when relative volume crosses the pre-defined threshold.
You can choose to only show long or short markers.
Two Backgrounds
You can choose to highlight the background on bumps and double bumps.
Alerts
You can define alerts on any combination of markers you configure. After defining the markers you want the alert to trigger on, make sure you are on the interval you want the alert to be monitoring at, then create the alert, select V, use the default “Configured Markers” alert condition and choose your triggering window (usually “Once Per Bar Close”). Once the alert is created, you can change the indicator's inputs with no effect on the alert.
No worthwhile price movement exists without volume. It thus makes sense to define alerts on volume if you want to monitor markets. I use the markers to define two types of alerts. For general market scanning, I use markers 2 and 4 on high time frames. When I have identified a good opportunity for entry and am waiting for confirmation, I will often setup a custom alert for that market at a shorter time interval using markers 1 and 4.
Notes
Until we have access to delta volume information on TradingView, this indicator tries to get the most out of volume columns without using security calls at inside intervals to get more resolution on volume, because it slows things down considerably.
The chart shows different combinations of color schemes and markers, along with my TLD indicator on the chart.
Structure Pivot (LL-HL / HH-LH)Structure Pivot (LL-HL / HH-LH) - Indicator Guide
This indicator scans for market structure pivot patterns—specifically the bullish Higher Low (LL–HL) and the bearish Lower High (HH–LH) —across multiple lengths simultaneously.
It automatically selects the most optimal pattern based on a "Priority Mode" and plots the structure and breakout/breakdown levels on the chart.
1. Basic Calculation Method
The indicator builds upon TradingView’s ta.pivotlow and ta.pivothigh functions to identify structural points.
Bullish Structure (LL–HL)
1.LL (Lowest Low): A standard Pivot Low is identified.
2.HL (Higher Low): A subsequent Pivot Low forms higher than the previous LL. This completes the setup.
3.Pivot Line (Resistance): The indicator finds the highest price (High) that occurred between the LL and the HL. This level becomes the breakout trigger.
Bearish Structure (HH–LH)
1.HH (Highest High): A standard Pivot High is identified.
2.LH (Lower High): A subsequent Pivot High forms lower than the previous HH. This completes the setup.
3.Pivot Line (Support): The indicator finds the lowest price (Low) that occurred between the HH and the LH. This level becomes the breakdown trigger.
2. Multi-Length Scanning
Unlike standard indicators that use a single fixed length (e.g., Length = 5), this indicator scans a range of lengths simultaneously.
・Settings: Defined by Min Length and Max Length.
・Mechanism: If set to Min=2 and Max=10, the indicator internally runs 9 separate calculations (Length 2 through 10) in parallel.
This allows it to capture everything from small, short-term pullbacks to larger, significant structural pivots without manual adjustment.
3. Priority Mode System
Since multiple lengths are scanned, multiple valid patterns may appear at the same time. The Priority Mode determines which single pattern is the "winner" and gets displayed.
A. Tightest Structure (Default)
・For Bullish (Long): Selects the pattern with the lowest Pivot Line (Resistance).
・For Bearish (Short): Selects the pattern with the highest Pivot Line (Support).
・Advantage: It finds the "tightest" contraction (like a VCP). This offers the entry point closest to the stop-loss level, providing the best Risk/Reward ratio.
B. Longest Length
・Selects the pattern detected by the longest length setting.
・Advantage: Focuses on major structural points, filtering out short-term noise. Best for trend confirmation.
C. Shortest Length
・Selects the pattern detected by the shortest length setting.
・Advantage: Extremely sensitive. Best for scalping or catching immediate micro-pullbacks.
4. Real-Time Logic & Features
Structure Invalidation (Failure)
・Bullish: If the current price drops below the HL (the support of the structure), the setup is considered failed.
・Bearish: If the current price rises above the LH (the resistance of the structure), the setup is considered failed.
・Result: All lines and labels for that structure are immediately deleted to keep the chart clean.
Pivot Line Extension
・As long as the structure remains valid (price hasn't violated the HL or LH), the Pivot Line extends to the right, acting as a live reference for breakouts or breakdowns.
Alerts
・Bullish Breakout: Triggered when the Close price crosses over the Pivot Line.
・Bearish Breakdown: Triggered when the Close price crosses under the Pivot Line.

Trend Following $BTC - Multi-Timeframe Structure + ReversTREND FOLLOWING STRATEGY - MULTI-TIMEFRAME STRUCTURE BREAKOUT SYSTEM
Strategy Overview
This is an enhanced Turtle Trading system designed for cryptocurrency spot trading. It combines Donchian Channel breakouts with multi-timeframe structure filtering and ATR-based dynamic risk management. The strategy trades both long and short positions using reverse signal exits to maximize trend capture.
Core Features
Multi-Timeframe Structure Filtering
The strategy uses Swing High/Low analysis to identify market structure trends. You can customize the structure timeframe (default: 3 minutes) to match your trading style. Only enters trades aligned with the identified trend direction, avoiding counter-trend positions that often lead to losses.
Reverse Signal Exit System
Instead of using fixed stop-losses or time-based exits, this strategy exits positions only when a reverse entry signal triggers. This approach maximizes trend profits and reduces premature exits during normal market retracements.
ATR Dynamic Pyramiding
Automatically adds positions when price moves 0.5 ATR in your favor. Supports up to 2 units maximum (adjustable). This pyramid scaling enhances profitability during strong trends while maintaining disciplined risk management.
Complete Risk Management
Fixed position sizing at 5000 USD per unit. Includes realistic commission fees of 0.06% (Binance spot rate). Initial capital set at 10,000 USD. All backtest parameters reflect real-world trading conditions.
Trading Logic
Entry Conditions
Long Entry: Close price breaks above the 20-period high AND structure trend is bullish (price breaks above Swing High)
Short Entry: Close price breaks below the 20-period low AND structure trend is bearish (price breaks below Swing Low)
Position Scaling
Long positions: Add when price rises 0.5 ATR or more
Short positions: Add when price falls 0.5 ATR or more
Maximum 2 units including initial entry
Exit Conditions
Long Exit: Triggers when short entry signal appears (price breaks 20-period low + structure turns bearish)
Short Exit: Triggers when long entry signal appears (price breaks 20-period high + structure turns bullish)
Default Parameters
Channel Settings
Entry Channel Period: 20 (Donchian Channel breakout period)
Exit Channel Period: 10 (reserved parameter)
ATR Settings
ATR Period: 20
Stop Loss ATR Multiplier: 2.0
Add Position ATR Multiplier: 0.5
Structure Filter
Swing Length: 300 (Swing High/Low calculation period)
Structure Timeframe: 3 minutes
Adjust these based on your trading timeframe and asset volatility
Position Management
Maximum Units: 2 (including initial entry)
Capital Per Unit: 5000 USD
Visualization Features
Background Colors
Light Green: Bullish market structure
Light Red: Bearish market structure
Dark Green: Long position entry
Dark Red: Short position entry
Optional Display Elements (Default: OFF)
Entry and exit channel lines
Structure high/low reference lines
ATR stop-loss indicator
Next position add level
Entry/exit labels
Alert Message Format
The strategy sends notifications with the following format:
Entry: "5m Long EP:90450.50"
Add Position: "15m Add Long 2/2 EP:91000.25"
Exit: "5m Close Long Reverse Signal"
Where the first part shows your current chart timeframe and EP indicates Entry Price
Backtest Settings
Capital Allocation
Initial Capital: 10,000 USD
Per Entry: 5,000 USD (split into 2 potential entries)
Leverage: 0x (spot trading only)
Trading Costs
Commission: 0.06% (Binance spot VIP0 rate)
Slippage: 0 (adjust based on your experience)
Best Use Cases
Ideal Scenarios
Trending markets with clear directional movement
Moderate to high volatility assets
Timeframes from 1-minute to 4-hour charts
Best suited for major cryptocurrencies with good liquidity
Not Recommended For
Highly volatile choppy/ranging markets
Low liquidity small-cap coins
Extreme market conditions or black swan events
Usage Recommendations
Timeframe Guidelines
1-5 minute charts: Use for scalping, consider Swing Length 100-160
15-30 minute charts: Good for short-term trading, Swing Length 50-100
1-4 hour charts: Suitable for swing trading, Swing Length 20-50
Optimization Tips
Always backtest on historical data before live trading
Adjust swing length based on asset volatility and your timeframe
Different cryptocurrencies may require different parameter settings
Enable visualization options initially to understand entry/exit points
Monitor win rate and drawdown during backtesting
Technical Details
Built on Pine Script v6
No repainting - uses proper bar referencing with offset
Prevents lookahead bias with lookahead=off parameter
Strategy mode with accurate commission and slippage modeling
Multi-timeframe security function for structure analysis
Proper position state tracking to avoid duplicate signals
Risk Disclaimer
This strategy is provided for educational and research purposes only. Past performance does not guarantee future results. Backtesting results may differ from live trading due to slippage, execution delays, and changing market conditions. The strategy performs best in trending markets and may experience drawdowns during ranging conditions. Always practice proper risk management and never risk more than you can afford to lose. It is recommended to paper trade first and start with small position sizes when going live.
How to Use
Add the strategy to your TradingView chart
Select your desired timeframe (1m to 4h recommended)
Adjust parameters based on your risk tolerance and trading style
Review backtest results in the Strategy Tester tab
Set up alerts for automated notifications
Consider paper trading before risking real capital
Tags
Trend Following, Turtle Trading, Donchian Channel, Structure Breakout, ATR, Cryptocurrency, Spot Trading, Risk Management, Pyramiding, Multi-Timeframe Analysis
---
Strategy Name: Trend Following BTC
Version: v1.0
Pine Script Version: v6
Last Updated: December 2025

P_NQ Futures Daily Bias & Structure ProOverview The Master Sniper is a professional-grade execution system designed for high-volatility assets like NQ (Nasdaq 100) and ES (S&P 500). Unlike standard indicators that generate blind signals, this script uses a Multi-Timeframe Logic Engine to first establish a daily bias and then hunt for specific intraday triggers.
It features a Hybrid Strategy that can automatically switch between Trend Following (Smart Money Concepts) and Mean Reversion (Gap Fades), giving you a complete toolkit for any market condition.
Key Features
1. Macro Bias Engine (The Filter) Before generating any signal, the script analyzes the Daily Chart in the background:
Structure: Checks for Higher Highs/Lows vs. Lower Highs/Lows.
Momentum: Uses RSI and the 200 EMA to ensure you aren't buying the top or selling the bottom.
Result: It generates a directional bias (Bullish/Bearish) that filters out low-probability trades.
2. Hybrid Entry Logic
Trend Mode (SMC): Identifies Fair Value Gaps (FVG) within "Discount" or "Premium" zones. It only triggers if the price pulls back into a value area aligned with the Daily Bias.
Reversal Mode (Elasticity): Detects when price is over-extended (2.0 Standard Deviations from VWAP) or when a "Liquidity Sweep" occurs, signaling a snap-back trade.
Gap Rejection (Morning Fade): A dedicated engine that monitors the Opening Gap. If the market gaps significantly but fails to hold, it triggers a "Fade" trade to target the gap fill.
3. Professional Trade Management Visualizes your trade plan instantly on the chart:
Split Targets: Draws targets for Contract 1 (Scalp) and Contract 2 (Runner).
Auto-Break Even: The moment TP1 is hit, the Stop Loss line visually moves to your Entry Price, signaling a "Risk-Free" trade.
Infinite Target Lines: Extends target lines to the right until the trade concludes, keeping your chart clean.
4. Risk Filters
Range Filter: Prevents buying in the Top 1/3 or selling in the Bottom 1/3 of the daily range.
Proximity Filter: Blocks trades that are squeezing too tight against the 100-candle High/Low.
How to Use
Timeframe: Optimized for the 5-Minute (5m) chart on Futures (NQ/ES) or Tech Stocks.
Dashboard: Check the bottom-right panel. Ensure "Status" says "SCANNING" and Filters show "Active."
Execution: Wait for the alert (e.g., "🟢 ENTER LONG"). Place your orders at the Blue Line with SL at the Red Line.

Quantum Rotational Field MappingQuantum Rotational Field Mapping (QRFM):
Phase Coherence Detection Through Complex-Plane Oscillator Analysis
Quantum Rotational Field Mapping applies complex-plane mathematics and phase-space analysis to oscillator ensembles, identifying high-probability trend ignition points by measuring when multiple independent oscillators achieve phase coherence. Unlike traditional multi-oscillator approaches that simply stack indicators or use boolean AND/OR logic, this system converts each oscillator into a rotating phasor (vector) in the complex plane and calculates the Coherence Index (CI) —a mathematical measure of how tightly aligned the ensemble has become—then generates signals only when alignment, phase direction, and pairwise entanglement all converge.
The indicator combines three mathematical frameworks: phasor representation using analytic signal theory to extract phase and amplitude from each oscillator, coherence measurement using vector summation in the complex plane to quantify group alignment, and entanglement analysis that calculates pairwise phase agreement across all oscillator combinations. This creates a multi-dimensional confirmation system that distinguishes between random oscillator noise and genuine regime transitions.
What Makes This Original
Complex-Plane Phasor Framework
This indicator implements classical signal processing mathematics adapted for market oscillators. Each oscillator—whether RSI, MACD, Stochastic, CCI, Williams %R, MFI, ROC, or TSI—is first normalized to a common scale, then converted into a complex-plane representation using an in-phase (I) and quadrature (Q) component. The in-phase component is the oscillator value itself, while the quadrature component is calculated as the first difference (derivative proxy), creating a velocity-aware representation.
From these components, the system extracts:
Phase (φ) : Calculated as φ = atan2(Q, I), representing the oscillator's position in its cycle (mapped to -180° to +180°)
Amplitude (A) : Calculated as A = √(I² + Q²), representing the oscillator's strength or conviction
This mathematical approach is fundamentally different from simply reading oscillator values. A phasor captures both where an oscillator is in its cycle (phase angle) and how strongly it's expressing that position (amplitude). Two oscillators can have the same value but be in opposite phases of their cycles—traditional analysis would see them as identical, while QRFM sees them as 180° out of phase (contradictory).
Coherence Index Calculation
The core innovation is the Coherence Index (CI) , borrowed from physics and signal processing. When you have N oscillators, each with phase φₙ, you can represent each as a unit vector in the complex plane: e^(iφₙ) = cos(φₙ) + i·sin(φₙ).
The CI measures what happens when you sum all these vectors:
Resultant Vector : R = Σ e^(iφₙ) = Σ cos(φₙ) + i·Σ sin(φₙ)
Coherence Index : CI = |R| / N
Where |R| is the magnitude of the resultant vector and N is the number of active oscillators.
The CI ranges from 0 to 1:
CI = 1.0 : Perfect coherence—all oscillators have identical phase angles, vectors point in the same direction, creating maximum constructive interference
CI = 0.0 : Complete decoherence—oscillators are randomly distributed around the circle, vectors cancel out through destructive interference
0 < CI < 1 : Partial alignment—some clustering with some scatter
This is not a simple average or correlation. The CI captures phase synchronization across the entire ensemble simultaneously. When oscillators phase-lock (align their cycles), the CI spikes regardless of their individual values. This makes it sensitive to regime transitions that traditional indicators miss.
Dominant Phase and Direction Detection
Beyond measuring alignment strength, the system calculates the dominant phase of the ensemble—the direction the resultant vector points:
Dominant Phase : φ_dom = atan2(Σ sin(φₙ), Σ cos(φₙ))
This gives the "average direction" of all oscillator phases, mapped to -180° to +180°:
+90° to -90° (right half-plane): Bullish phase dominance
+90° to +180° or -90° to -180° (left half-plane): Bearish phase dominance
The combination of CI magnitude (coherence strength) and dominant phase angle (directional bias) creates a two-dimensional signal space. High CI alone is insufficient—you need high CI plus dominant phase pointing in a tradeable direction. This dual requirement is what separates QRFM from simple oscillator averaging.
Entanglement Matrix and Pairwise Coherence
While the CI measures global alignment, the entanglement matrix measures local pairwise relationships. For every pair of oscillators (i, j), the system calculates:
E(i,j) = |cos(φᵢ - φⱼ)|
This represents the phase agreement between oscillators i and j:
E = 1.0 : Oscillators are in-phase (0° or 360° apart)
E = 0.0 : Oscillators are in quadrature (90° apart, orthogonal)
E between 0 and 1 : Varying degrees of alignment
The system counts how many oscillator pairs exceed a user-defined entanglement threshold (e.g., 0.7). This entangled pairs count serves as a confirmation filter: signals require not just high global CI, but also a minimum number of strong pairwise agreements. This prevents false ignitions where CI is high but driven by only two oscillators while the rest remain scattered.
The entanglement matrix creates an N×N symmetric matrix that can be visualized as a web—when many cells are bright (high E values), the ensemble is highly interconnected. When cells are dark, oscillators are moving independently.
Phase-Lock Tolerance Mechanism
A complementary confirmation layer is the phase-lock detector . This calculates the maximum phase spread across all oscillators:
For all pairs (i,j), compute angular distance: Δφ = |φᵢ - φⱼ|, wrapping at 180°
Max Spread = maximum Δφ across all pairs
If max spread < user threshold (e.g., 35°), the ensemble is considered phase-locked —all oscillators are within a narrow angular band.
This differs from entanglement: entanglement measures pairwise cosine similarity (magnitude of alignment), while phase-lock measures maximum angular deviation (tightness of clustering). Both must be satisfied for the highest-conviction signals.
Multi-Layer Visual Architecture
QRFM includes six visual components that represent the same underlying mathematics from different perspectives:
Circular Orbit Plot : A polar coordinate grid showing each oscillator as a vector from origin to perimeter. Angle = phase, radius = amplitude. This is a real-time snapshot of the complex plane. When vectors converge (point in similar directions), coherence is high. When scattered randomly, coherence is low. Users can see phase alignment forming before CI numerically confirms it.
Phase-Time Heat Map : A 2D matrix with rows = oscillators and columns = time bins. Each cell is colored by the oscillator's phase at that time (using a gradient where color hue maps to angle). Horizontal color bands indicate sustained phase alignment over time. Vertical color bands show moments when all oscillators shared the same phase (ignition points). This provides historical pattern recognition.
Entanglement Web Matrix : An N×N grid showing E(i,j) for all pairs. Cells are colored by entanglement strength—bright yellow/gold for high E, dark gray for low E. This reveals which oscillators are driving coherence and which are lagging. For example, if RSI and MACD show high E but Stochastic shows low E with everything, Stochastic is the outlier.
Quantum Field Cloud : A background color overlay on the price chart. Color (green = bullish, red = bearish) is determined by dominant phase. Opacity is determined by CI—high CI creates dense, opaque cloud; low CI creates faint, nearly invisible cloud. This gives an atmospheric "feel" for regime strength without looking at numbers.
Phase Spiral : A smoothed plot of dominant phase over recent history, displayed as a curve that wraps around price. When the spiral is tight and rotating steadily, the ensemble is in coherent rotation (trending). When the spiral is loose or erratic, coherence is breaking down.
Dashboard : A table showing real-time metrics: CI (as percentage), dominant phase (in degrees with directional arrow), field strength (CI × average amplitude), entangled pairs count, phase-lock status (locked/unlocked), quantum state classification ("Ignition", "Coherent", "Collapse", "Chaos"), and collapse risk (recent CI change normalized to 0-100%).
Each component is independently toggleable, allowing users to customize their workspace. The orbit plot is the most essential—it provides intuitive, visual feedback on phase alignment that no numerical dashboard can match.
Core Components and How They Work Together
1. Oscillator Normalization Engine
The foundation is creating a common measurement scale. QRFM supports eight oscillators:
RSI : Normalized from to using overbought/oversold levels (70, 30) as anchors
MACD Histogram : Normalized by dividing by rolling standard deviation, then clamped to
Stochastic %K : Normalized from using (80, 20) anchors
CCI : Divided by 200 (typical extreme level), clamped to
Williams %R : Normalized from using (-20, -80) anchors
MFI : Normalized from using (80, 20) anchors
ROC : Divided by 10, clamped to
TSI : Divided by 50, clamped to
Each oscillator can be individually enabled/disabled. Only active oscillators contribute to phase calculations. The normalization removes scale differences—a reading of +0.8 means "strongly bullish" regardless of whether it came from RSI or TSI.
2. Analytic Signal Construction
For each active oscillator at each bar, the system constructs the analytic signal:
In-Phase (I) : The normalized oscillator value itself
Quadrature (Q) : The bar-to-bar change in the normalized value (first derivative approximation)
This creates a 2D representation: (I, Q). The phase is extracted as:
φ = atan2(Q, I) × (180 / π)
This maps the oscillator to a point on the unit circle. An oscillator at the same value but rising (positive Q) will have a different phase than one that is falling (negative Q). This velocity-awareness is critical—it distinguishes between "at resistance and stalling" versus "at resistance and breaking through."
The amplitude is extracted as:
A = √(I² + Q²)
This represents the distance from origin in the (I, Q) plane. High amplitude means the oscillator is far from neutral (strong conviction). Low amplitude means it's near zero (weak/transitional state).
3. Coherence Calculation Pipeline
For each bar (or every Nth bar if phase sample rate > 1 for performance):
Step 1 : Extract phase φₙ for each of the N active oscillators
Step 2 : Compute complex exponentials: Zₙ = e^(i·φₙ·π/180) = cos(φₙ·π/180) + i·sin(φₙ·π/180)
Step 3 : Sum the complex exponentials: R = Σ Zₙ = (Σ cos φₙ) + i·(Σ sin φₙ)
Step 4 : Calculate magnitude: |R| = √
Step 5 : Normalize by count: CI_raw = |R| / N
Step 6 : Smooth the CI: CI = SMA(CI_raw, smoothing_window)
The smoothing step (default 2 bars) removes single-bar noise spikes while preserving structural coherence changes. Users can adjust this to control reactivity versus stability.
The dominant phase is calculated as:
φ_dom = atan2(Σ sin φₙ, Σ cos φₙ) × (180 / π)
This is the angle of the resultant vector R in the complex plane.
4. Entanglement Matrix Construction
For all unique pairs of oscillators (i, j) where i < j:
Step 1 : Get phases φᵢ and φⱼ
Step 2 : Compute phase difference: Δφ = φᵢ - φⱼ (in radians)
Step 3 : Calculate entanglement: E(i,j) = |cos(Δφ)|
Step 4 : Store in symmetric matrix: matrix = matrix = E(i,j)
The matrix is then scanned: count how many E(i,j) values exceed the user-defined threshold (default 0.7). This count is the entangled pairs metric.
For visualization, the matrix is rendered as an N×N table where cell brightness maps to E(i,j) intensity.
5. Phase-Lock Detection
Step 1 : For all unique pairs (i, j), compute angular distance: Δφ = |φᵢ - φⱼ|
Step 2 : Wrap angles: if Δφ > 180°, set Δφ = 360° - Δφ
Step 3 : Find maximum: max_spread = max(Δφ) across all pairs
Step 4 : Compare to tolerance: phase_locked = (max_spread < tolerance)
If phase_locked is true, all oscillators are within the specified angular cone (e.g., 35°). This is a boolean confirmation filter.
6. Signal Generation Logic
Signals are generated through multi-layer confirmation:
Long Ignition Signal :
CI crosses above ignition threshold (e.g., 0.80)
AND dominant phase is in bullish range (-90° < φ_dom < +90°)
AND phase_locked = true
AND entangled_pairs >= minimum threshold (e.g., 4)
Short Ignition Signal :
CI crosses above ignition threshold
AND dominant phase is in bearish range (φ_dom < -90° OR φ_dom > +90°)
AND phase_locked = true
AND entangled_pairs >= minimum threshold
Collapse Signal :
CI at bar minus CI at current bar > collapse threshold (e.g., 0.55)
AND CI at bar was above 0.6 (must collapse from coherent state, not from already-low state)
These are strict conditions. A high CI alone does not generate a signal—dominant phase must align with direction, oscillators must be phase-locked, and sufficient pairwise entanglement must exist. This multi-factor gating dramatically reduces false signals compared to single-condition triggers.
Calculation Methodology
Phase 1: Oscillator Computation and Normalization
On each bar, the system calculates the raw values for all enabled oscillators using standard Pine Script functions:
RSI: ta.rsi(close, length)
MACD: ta.macd() returning histogram component
Stochastic: ta.stoch() smoothed with ta.sma()
CCI: ta.cci(close, length)
Williams %R: ta.wpr(length)
MFI: ta.mfi(hlc3, length)
ROC: ta.roc(close, length)
TSI: ta.tsi(close, short, long)
Each raw value is then passed through a normalization function:
normalize(value, overbought_level, oversold_level) = 2 × (value - oversold) / (overbought - oversold) - 1
This maps the oscillator's typical range to , where -1 represents extreme bearish, 0 represents neutral, and +1 represents extreme bullish.
For oscillators without fixed ranges (MACD, ROC, TSI), statistical normalization is used: divide by a rolling standard deviation or fixed divisor, then clamp to .
Phase 2: Phasor Extraction
For each normalized oscillator value val:
I = val (in-phase component)
Q = val - val (quadrature component, first difference)
Phase calculation:
phi_rad = atan2(Q, I)
phi_deg = phi_rad × (180 / π)
Amplitude calculation:
A = √(I² + Q²)
These values are stored in arrays: osc_phases and osc_amps for each oscillator n.
Phase 3: Complex Summation and Coherence
Initialize accumulators:
sum_cos = 0
sum_sin = 0
For each oscillator n = 0 to N-1:
phi_rad = osc_phases × (π / 180)
sum_cos += cos(phi_rad)
sum_sin += sin(phi_rad)
Resultant magnitude:
resultant_mag = √(sum_cos² + sum_sin²)
Coherence Index (raw):
CI_raw = resultant_mag / N
Smoothed CI:
CI = SMA(CI_raw, smoothing_window)
Dominant phase:
phi_dom_rad = atan2(sum_sin, sum_cos)
phi_dom_deg = phi_dom_rad × (180 / π)
Phase 4: Entanglement Matrix Population
For i = 0 to N-2:
For j = i+1 to N-1:
phi_i = osc_phases × (π / 180)
phi_j = osc_phases × (π / 180)
delta_phi = phi_i - phi_j
E = |cos(delta_phi)|
matrix_index_ij = i × N + j
matrix_index_ji = j × N + i
entangle_matrix = E
entangle_matrix = E
if E >= threshold:
entangled_pairs += 1
The matrix uses flat array storage with index mapping: index(row, col) = row × N + col.
Phase 5: Phase-Lock Check
max_spread = 0
For i = 0 to N-2:
For j = i+1 to N-1:
delta = |osc_phases - osc_phases |
if delta > 180:
delta = 360 - delta
max_spread = max(max_spread, delta)
phase_locked = (max_spread < tolerance)
Phase 6: Signal Evaluation
Ignition Long :
ignition_long = (CI crosses above threshold) AND
(phi_dom > -90 AND phi_dom < 90) AND
phase_locked AND
(entangled_pairs >= minimum)
Ignition Short :
ignition_short = (CI crosses above threshold) AND
(phi_dom < -90 OR phi_dom > 90) AND
phase_locked AND
(entangled_pairs >= minimum)
Collapse :
CI_prev = CI
collapse = (CI_prev - CI > collapse_threshold) AND (CI_prev > 0.6)
All signals are evaluated on bar close. The crossover and crossunder functions ensure signals fire only once when conditions transition from false to true.
Phase 7: Field Strength and Visualization Metrics
Average Amplitude :
avg_amp = (Σ osc_amps ) / N
Field Strength :
field_strength = CI × avg_amp
Collapse Risk (for dashboard):
collapse_risk = (CI - CI) / max(CI , 0.1)
collapse_risk_pct = clamp(collapse_risk × 100, 0, 100)
Quantum State Classification :
if (CI > threshold AND phase_locked):
state = "Ignition"
else if (CI > 0.6):
state = "Coherent"
else if (collapse):
state = "Collapse"
else:
state = "Chaos"
Phase 8: Visual Rendering
Orbit Plot : For each oscillator, convert polar (phase, amplitude) to Cartesian (x, y) for grid placement:
radius = amplitude × grid_center × 0.8
x = radius × cos(phase × π/180)
y = radius × sin(phase × π/180)
col = center + x (mapped to grid coordinates)
row = center - y
Heat Map : For each oscillator row and time column, retrieve historical phase value at lookback = (columns - col) × sample_rate, then map phase to color using a hue gradient.
Entanglement Web : Render matrix as table cell with background color opacity = E(i,j).
Field Cloud : Background color = (phi_dom > -90 AND phi_dom < 90) ? green : red, with opacity = mix(min_opacity, max_opacity, CI).
All visual components render only on the last bar (barstate.islast) to minimize computational overhead.
How to Use This Indicator
Step 1 : Apply QRFM to your chart. It works on all timeframes and asset classes, though 15-minute to 4-hour timeframes provide the best balance of responsiveness and noise reduction.
Step 2 : Enable the dashboard (default: top right) and the circular orbit plot (default: middle left). These are your primary visual feedback tools.
Step 3 : Optionally enable the heat map, entanglement web, and field cloud based on your preference. New users may find all visuals overwhelming; start with dashboard + orbit plot.
Step 4 : Observe for 50-100 bars to let the indicator establish baseline coherence patterns. Markets have different "normal" CI ranges—some instruments naturally run higher or lower coherence.
Understanding the Circular Orbit Plot
The orbit plot is a polar grid showing oscillator vectors in real-time:
Center point : Neutral (zero phase and amplitude)
Each vector : A line from center to a point on the grid
Vector angle : The oscillator's phase (0° = right/east, 90° = up/north, 180° = left/west, -90° = down/south)
Vector length : The oscillator's amplitude (short = weak signal, long = strong signal)
Vector label : First letter of oscillator name (R = RSI, M = MACD, etc.)
What to watch :
Convergence : When all vectors cluster in one quadrant or sector, CI is rising and coherence is forming. This is your pre-signal warning.
Scatter : When vectors point in random directions (360° spread), CI is low and the market is in a non-trending or transitional regime.
Rotation : When the cluster rotates smoothly around the circle, the ensemble is in coherent oscillation—typically seen during steady trends.
Sudden flips : When the cluster rapidly jumps from one side to the opposite (e.g., +90° to -90°), a phase reversal has occurred—often coinciding with trend reversals.
Example: If you see RSI, MACD, and Stochastic all pointing toward 45° (northeast) with long vectors, while CCI, TSI, and ROC point toward 40-50° as well, coherence is high and dominant phase is bullish. Expect an ignition signal if CI crosses threshold.
Reading Dashboard Metrics
The dashboard provides numerical confirmation of what the orbit plot shows visually:
CI : Displays as 0-100%. Above 70% = high coherence (strong regime), 40-70% = moderate, below 40% = low (poor conditions for trend entries).
Dom Phase : Angle in degrees with directional arrow. ⬆ = bullish bias, ⬇ = bearish bias, ⬌ = neutral.
Field Strength : CI weighted by amplitude. High values (> 0.6) indicate not just alignment but strong alignment.
Entangled Pairs : Count of oscillator pairs with E > threshold. Higher = more confirmation. If minimum is set to 4, you need at least 4 pairs entangled for signals.
Phase Lock : 🔒 YES (all oscillators within tolerance) or 🔓 NO (spread too wide).
State : Real-time classification:
🚀 IGNITION: CI just crossed threshold with phase-lock
⚡ COHERENT: CI is high and stable
💥 COLLAPSE: CI has dropped sharply
🌀 CHAOS: Low CI, scattered phases
Collapse Risk : 0-100% scale based on recent CI change. Above 50% warns of imminent breakdown.
Interpreting Signals
Long Ignition (Blue Triangle Below Price) :
Occurs when CI crosses above threshold (e.g., 0.80)
Dominant phase is in bullish range (-90° to +90°)
All oscillators are phase-locked (within tolerance)
Minimum entangled pairs requirement met
Interpretation : The oscillator ensemble has transitioned from disorder to coherent bullish alignment. This is a high-probability long entry point. The multi-layer confirmation (CI + phase direction + lock + entanglement) ensures this is not a single-oscillator whipsaw.
Short Ignition (Red Triangle Above Price) :
Same conditions as long, but dominant phase is in bearish range (< -90° or > +90°)
Interpretation : Coherent bearish alignment has formed. High-probability short entry.
Collapse (Circles Above and Below Price) :
CI has dropped by more than the collapse threshold (e.g., 0.55) over a 5-bar window
CI was previously above 0.6 (collapsing from coherent state)
Interpretation : Phase coherence has broken down. If you are in a position, this is an exit warning. If looking to enter, stand aside—regime is transitioning.
Phase-Time Heat Map Patterns
Enable the heat map and position it at bottom right. The rows represent individual oscillators, columns represent time bins (most recent on left).
Pattern: Horizontal Color Bands
If a row (e.g., RSI) shows consistent color across columns (say, green for several bins), that oscillator has maintained stable phase over time. If all rows show horizontal bands of similar color, the entire ensemble has been phase-locked for an extended period—this is a strong trending regime.
Pattern: Vertical Color Bands
If a column (single time bin) shows all cells with the same or very similar color, that moment in time had high coherence. These vertical bands often align with ignition signals or major price pivots.
Pattern: Rainbow Chaos
If cells are random colors (red, green, yellow mixed with no pattern), coherence is low. The ensemble is scattered. Avoid trading during these periods unless you have external confirmation.
Pattern: Color Transition
If you see a row transition from red to green (or vice versa) sharply, that oscillator has phase-flipped. If multiple rows do this simultaneously, a regime change is underway.
Entanglement Web Analysis
Enable the web matrix (default: opposite corner from heat map). It shows an N×N grid where N = number of active oscillators.
Bright Yellow/Gold Cells : High pairwise entanglement. For example, if the RSI-MACD cell is bright gold, those two oscillators are moving in phase. If the RSI-Stochastic cell is bright, they are entangled as well.
Dark Gray Cells : Low entanglement. Oscillators are decorrelated or in quadrature.
Diagonal : Always marked with "—" because an oscillator is always perfectly entangled with itself.
How to use :
Scan for clustering: If most cells are bright, coherence is high across the board. If only a few cells are bright, coherence is driven by a subset (e.g., RSI and MACD are aligned, but nothing else is—weak signal).
Identify laggards: If one row/column is entirely dark, that oscillator is the outlier. You may choose to disable it or monitor for when it joins the group (late confirmation).
Watch for web formation: During low-coherence periods, the matrix is mostly dark. As coherence builds, cells begin lighting up. A sudden "web" of connections forming visually precedes ignition signals.
Trading Workflow
Step 1: Monitor Coherence Level
Check the dashboard CI metric or observe the orbit plot. If CI is below 40% and vectors are scattered, conditions are poor for trend entries. Wait.
Step 2: Detect Coherence Building
When CI begins rising (say, from 30% to 50-60%) and you notice vectors on the orbit plot starting to cluster, coherence is forming. This is your alert phase—do not enter yet, but prepare.
Step 3: Confirm Phase Direction
Check the dominant phase angle and the orbit plot quadrant where clustering is occurring:
Clustering in right half (0° to ±90°): Bullish bias forming
Clustering in left half (±90° to 180°): Bearish bias forming
Verify the dashboard shows the corresponding directional arrow (⬆ or ⬇).
Step 4: Wait for Signal Confirmation
Do not enter based on rising CI alone. Wait for the full ignition signal:
CI crosses above threshold
Phase-lock indicator shows 🔒 YES
Entangled pairs count >= minimum
Directional triangle appears on chart
This ensures all layers have aligned.
Step 5: Execute Entry
Long : Blue triangle below price appears → enter long
Short : Red triangle above price appears → enter short
Step 6: Position Management
Initial Stop : Place stop loss based on your risk management rules (e.g., recent swing low/high, ATR-based buffer).
Monitoring :
Watch the field cloud density. If it remains opaque and colored in your direction, the regime is intact.
Check dashboard collapse risk. If it rises above 50%, prepare for exit.
Monitor the orbit plot. If vectors begin scattering or the cluster flips to the opposite side, coherence is breaking.
Exit Triggers :
Collapse signal fires (circles appear)
Dominant phase flips to opposite half-plane
CI drops below 40% (coherence lost)
Price hits your profit target or trailing stop
Step 7: Post-Exit Analysis
After exiting, observe whether a new ignition forms in the opposite direction (reversal) or if CI remains low (transition to range). Use this to decide whether to re-enter, reverse, or stand aside.
Best Practices
Use Price Structure as Context
QRFM identifies when coherence forms but does not specify where price will go. Combine ignition signals with support/resistance levels, trendlines, or chart patterns. For example:
Long ignition near a major support level after a pullback: high-probability bounce
Long ignition in the middle of a range with no structure: lower probability
Multi-Timeframe Confirmation
Open QRFM on two timeframes simultaneously:
Higher timeframe (e.g., 4-hour): Use CI level to determine regime bias. If 4H CI is above 60% and dominant phase is bullish, the market is in a bullish regime.
Lower timeframe (e.g., 15-minute): Execute entries on ignition signals that align with the higher timeframe bias.
This prevents counter-trend trades and increases win rate.
Distinguish Between Regime Types
High CI, stable dominant phase (State: Coherent) : Trending market. Ignitions are continuation signals; collapses are profit-taking or reversal warnings.
Low CI, erratic dominant phase (State: Chaos) : Ranging or choppy market. Avoid ignition signals or reduce position size. Wait for coherence to establish.
Moderate CI with frequent collapses : Whipsaw environment. Use wider stops or stand aside.
Adjust Parameters to Instrument and Timeframe
Crypto/Forex (high volatility) : Lower ignition threshold (0.65-0.75), lower CI smoothing (2-3), shorter oscillator lengths (7-10).
Stocks/Indices (moderate volatility) : Standard settings (threshold 0.75-0.85, smoothing 5-7, oscillator lengths 14).
Lower timeframes (5-15 min) : Reduce phase sample rate to 1-2 for responsiveness.
Higher timeframes (daily+) : Increase CI smoothing and oscillator lengths for noise reduction.
Use Entanglement Count as Conviction Filter
The minimum entangled pairs setting controls signal strictness:
Low (1-2) : More signals, lower quality (acceptable if you have other confirmation)
Medium (3-5) : Balanced (recommended for most traders)
High (6+) : Very strict, fewer signals, highest quality
Adjust based on your trade frequency preference and risk tolerance.
Monitor Oscillator Contribution
Use the entanglement web to see which oscillators are driving coherence. If certain oscillators are consistently dark (low E with all others), they may be adding noise. Consider disabling them. For example:
On low-volume instruments, MFI may be unreliable → disable MFI
On strongly trending instruments, mean-reversion oscillators (Stochastic, RSI) may lag → reduce weight or disable
Respect the Collapse Signal
Collapse events are early warnings. Price may continue in the original direction for several bars after collapse fires, but the underlying regime has weakened. Best practice:
If in profit: Take partial or full profit on collapse
If at breakeven/small loss: Exit immediately
If collapse occurs shortly after entry: Likely a false ignition; exit to avoid drawdown
Collapses do not guarantee immediate reversals—they signal uncertainty .
Combine with Volume Analysis
If your instrument has reliable volume:
Ignitions with expanding volume: Higher conviction
Ignitions with declining volume: Weaker, possibly false
Collapses with volume spikes: Strong reversal signal
Collapses with low volume: May just be consolidation
Volume is not built into QRFM (except via MFI), so add it as external confirmation.
Observe the Phase Spiral
The spiral provides a quick visual cue for rotation consistency:
Tight, smooth spiral : Ensemble is rotating coherently (trending)
Loose, erratic spiral : Phase is jumping around (ranging or transitional)
If the spiral tightens, coherence is building. If it loosens, coherence is dissolving.
Do Not Overtrade Low-Coherence Periods
When CI is persistently below 40% and the state is "Chaos," the market is not in a regime where phase analysis is predictive. During these times:
Reduce position size
Widen stops
Wait for coherence to return
QRFM's strength is regime detection. If there is no regime, the tool correctly signals "stand aside."
Use Alerts Strategically
Set alerts for:
Long Ignition
Short Ignition
Collapse
Phase Lock (optional)
Configure alerts to "Once per bar close" to avoid intrabar repainting and noise. When an alert fires, manually verify:
Orbit plot shows clustering
Dashboard confirms all conditions
Price structure supports the trade
Do not blindly trade alerts—use them as prompts for analysis.
Ideal Market Conditions
Best Performance
Instruments :
Liquid, actively traded markets (major forex pairs, large-cap stocks, major indices, top-tier crypto)
Instruments with clear cyclical oscillator behavior (avoid extremely illiquid or manipulated markets)
Timeframes :
15-minute to 4-hour: Optimal balance of noise reduction and responsiveness
1-hour to daily: Slower, higher-conviction signals; good for swing trading
5-minute: Acceptable for scalping if parameters are tightened and you accept more noise
Market Regimes :
Trending markets with periodic retracements (where oscillators cycle through phases predictably)
Breakout environments (coherence forms before/during breakout; collapse occurs at exhaustion)
Rotational markets with clear swings (oscillators phase-lock at turning points)
Volatility :
Moderate to high volatility (oscillators have room to move through their ranges)
Stable volatility regimes (sudden VIX spikes or flash crashes may create false collapses)
Challenging Conditions
Instruments :
Very low liquidity markets (erratic price action creates unstable oscillator phases)
Heavily news-driven instruments (fundamentals may override technical coherence)
Highly correlated instruments (oscillators may all reflect the same underlying factor, reducing independence)
Market Regimes :
Deep, prolonged consolidation (oscillators remain near neutral, CI is chronically low, few signals fire)
Extreme chop with no directional bias (oscillators whipsaw, coherence never establishes)
Gap-driven markets (large overnight gaps create phase discontinuities)
Timeframes :
Sub-5-minute charts: Noise dominates; oscillators flip rapidly; coherence is fleeting and unreliable
Weekly/monthly: Oscillators move extremely slowly; signals are rare; better suited for long-term positioning than active trading
Special Cases :
During major economic releases or earnings: Oscillators may lag price or become decorrelated as fundamentals overwhelm technicals. Reduce position size or stand aside.
In extremely low-volatility environments (e.g., holiday periods): Oscillators compress to neutral, CI may be artificially high due to lack of movement, but signals lack follow-through.
Adaptive Behavior
QRFM is designed to self-adapt to poor conditions:
When coherence is genuinely absent, CI remains low and signals do not fire
When only a subset of oscillators aligns, entangled pairs count stays below threshold and signals are filtered out
When phase-lock cannot be achieved (oscillators too scattered), the lock filter prevents signals
This means the indicator will naturally produce fewer (or zero) signals during unfavorable conditions, rather than generating false signals. This is a feature —it keeps you out of low-probability trades.
Parameter Optimization by Trading Style
Scalping (5-15 Minute Charts)
Goal : Maximum responsiveness, accept higher noise
Oscillator Lengths :
RSI: 7-10
MACD: 8/17/6
Stochastic: 8-10, smooth 2-3
CCI: 14-16
Others: 8-12
Coherence Settings :
CI Smoothing Window: 2-3 bars (fast reaction)
Phase Sample Rate: 1 (every bar)
Ignition Threshold: 0.65-0.75 (lower for more signals)
Collapse Threshold: 0.40-0.50 (earlier exit warnings)
Confirmation :
Phase Lock Tolerance: 40-50° (looser, easier to achieve)
Min Entangled Pairs: 2-3 (fewer oscillators required)
Visuals :
Orbit Plot + Dashboard only (reduce screen clutter for fast decisions)
Disable heavy visuals (heat map, web) for performance
Alerts :
Enable all ignition and collapse alerts
Set to "Once per bar close"
Day Trading (15-Minute to 1-Hour Charts)
Goal : Balance between responsiveness and reliability
Oscillator Lengths :
RSI: 14 (standard)
MACD: 12/26/9 (standard)
Stochastic: 14, smooth 3
CCI: 20
Others: 10-14
Coherence Settings :
CI Smoothing Window: 3-5 bars (balanced)
Phase Sample Rate: 2-3
Ignition Threshold: 0.75-0.85 (moderate selectivity)
Collapse Threshold: 0.50-0.55 (balanced exit timing)
Confirmation :
Phase Lock Tolerance: 30-40° (moderate tightness)
Min Entangled Pairs: 4-5 (reasonable confirmation)
Visuals :
Orbit Plot + Dashboard + Heat Map or Web (choose one)
Field Cloud for regime backdrop
Alerts :
Ignition and collapse alerts
Optional phase-lock alert for advance warning
Swing Trading (4-Hour to Daily Charts)
Goal : High-conviction signals, minimal noise, fewer trades
Oscillator Lengths :
RSI: 14-21
MACD: 12/26/9 or 19/39/9 (longer variant)
Stochastic: 14-21, smooth 3-5
CCI: 20-30
Others: 14-20
Coherence Settings :
CI Smoothing Window: 5-10 bars (very smooth)
Phase Sample Rate: 3-5
Ignition Threshold: 0.80-0.90 (high bar for entry)
Collapse Threshold: 0.55-0.65 (only significant breakdowns)
Confirmation :
Phase Lock Tolerance: 20-30° (tight clustering required)
Min Entangled Pairs: 5-7 (strong confirmation)
Visuals :
All modules enabled (you have time to analyze)
Heat Map for multi-bar pattern recognition
Web for deep confirmation analysis
Alerts :
Ignition and collapse
Review manually before entering (no rush)
Position/Long-Term Trading (Daily to Weekly Charts)
Goal : Rare, very high-conviction regime shifts
Oscillator Lengths :
RSI: 21-30
MACD: 19/39/9 or 26/52/12
Stochastic: 21, smooth 5
CCI: 30-50
Others: 20-30
Coherence Settings :
CI Smoothing Window: 10-14 bars
Phase Sample Rate: 5 (every 5th bar to reduce computation)
Ignition Threshold: 0.85-0.95 (only extreme alignment)
Collapse Threshold: 0.60-0.70 (major regime breaks only)
Confirmation :
Phase Lock Tolerance: 15-25° (very tight)
Min Entangled Pairs: 6+ (broad consensus required)
Visuals :
Dashboard + Orbit Plot for quick checks
Heat Map to study historical coherence patterns
Web to verify deep entanglement
Alerts :
Ignition only (collapses are less critical on long timeframes)
Manual review with fundamental analysis overlay
Performance Optimization (Low-End Systems)
If you experience lag or slow rendering:
Reduce Visual Load :
Orbit Grid Size: 8-10 (instead of 12+)
Heat Map Time Bins: 5-8 (instead of 10+)
Disable Web Matrix entirely if not needed
Disable Field Cloud and Phase Spiral
Reduce Calculation Frequency :
Phase Sample Rate: 5-10 (calculate every 5-10 bars)
Max History Depth: 100-200 (instead of 500+)
Disable Unused Oscillators :
If you only want RSI, MACD, and Stochastic, disable the other five. Fewer oscillators = smaller matrices, faster loops.
Simplify Dashboard :
Choose "Small" dashboard size
Reduce number of metrics displayed
These settings will not significantly degrade signal quality (signals are based on bar-close calculations, which remain accurate), but will improve chart responsiveness.
Important Disclaimers
This indicator is a technical analysis tool designed to identify periods of phase coherence across an ensemble of oscillators. It is not a standalone trading system and does not guarantee profitable trades. The Coherence Index, dominant phase, and entanglement metrics are mathematical calculations applied to historical price data—they measure past oscillator behavior and do not predict future price movements with certainty.
No Predictive Guarantee : High coherence indicates that oscillators are currently aligned, which historically has coincided with trending or directional price movement. However, past alignment does not guarantee future trends. Markets can remain coherent while prices consolidate, or lose coherence suddenly due to news, liquidity changes, or other factors not captured by oscillator mathematics.
Signal Confirmation is Probabilistic : The multi-layer confirmation system (CI threshold + dominant phase + phase-lock + entanglement) is designed to filter out low-probability setups. This increases the proportion of valid signals relative to false signals, but does not eliminate false signals entirely. Users should combine QRFM with additional analysis—support and resistance levels, volume confirmation, multi-timeframe alignment, and fundamental context—before executing trades.
Collapse Signals are Warnings, Not Reversals : A coherence collapse indicates that the oscillator ensemble has lost alignment. This often precedes trend exhaustion or reversals, but can also occur during healthy pullbacks or consolidations. Price may continue in the original direction after a collapse. Use collapses as risk management cues (tighten stops, take partial profits) rather than automatic reversal entries.
Market Regime Dependency : QRFM performs best in markets where oscillators exhibit cyclical, mean-reverting behavior and where trends are punctuated by retracements. In markets dominated by fundamental shocks, gap openings, or extreme low-liquidity conditions, oscillator coherence may be less reliable. During such periods, reduce position size or stand aside.
Risk Management is Essential : All trading involves risk of loss. Use appropriate stop losses, position sizing, and risk-per-trade limits. The indicator does not specify stop loss or take profit levels—these must be determined by the user based on their risk tolerance and account size. Never risk more than you can afford to lose.
Parameter Sensitivity : The indicator's behavior changes with input parameters. Aggressive settings (low thresholds, loose tolerances) produce more signals with lower average quality. Conservative settings (high thresholds, tight tolerances) produce fewer signals with higher average quality. Users should backtest and forward-test parameter sets on their specific instruments and timeframes before committing real capital.
No Repainting by Design : All signal conditions are evaluated on bar close using bar-close values. However, the visual components (orbit plot, heat map, dashboard) update in real-time during bar formation for monitoring purposes. For trade execution, rely on the confirmed signals (triangles and circles) that appear only after the bar closes.
Computational Load : QRFM performs extensive calculations, including nested loops for entanglement matrices and real-time table rendering. On lower-powered devices or when running multiple indicators simultaneously, users may experience lag. Use the performance optimization settings (reduce visual complexity, increase phase sample rate, disable unused oscillators) to improve responsiveness.
This system is most effective when used as one component within a broader trading methodology that includes sound risk management, multi-timeframe analysis, market context awareness, and disciplined execution. It is a tool for regime detection and signal confirmation, not a substitute for comprehensive trade planning.
Technical Notes
Calculation Timing : All signal logic (ignition, collapse) is evaluated using bar-close values. The barstate.isconfirmed or implicit bar-close behavior ensures signals do not repaint. Visual components (tables, plots) render on every tick for real-time feedback but do not affect signal generation.
Phase Wrapping : Phase angles are calculated in the range -180° to +180° using atan2. Angular distance calculations account for wrapping (e.g., the distance between +170° and -170° is 20°, not 340°). This ensures phase-lock detection works correctly across the ±180° boundary.
Array Management : The indicator uses fixed-size arrays for oscillator phases, amplitudes, and the entanglement matrix. The maximum number of oscillators is 8. If fewer oscillators are enabled, array sizes shrink accordingly (only active oscillators are processed).
Matrix Indexing : The entanglement matrix is stored as a flat array with size N×N, where N is the number of active oscillators. Index mapping: index(row, col) = row × N + col. Symmetric pairs (i,j) and (j,i) are stored identically.
Normalization Stability : Oscillators are normalized to using fixed reference levels (e.g., RSI overbought/oversold at 70/30). For unbounded oscillators (MACD, ROC, TSI), statistical normalization (division by rolling standard deviation) is used, with clamping to prevent extreme outliers from distorting phase calculations.
Smoothing and Lag : The CI smoothing window (SMA) introduces lag proportional to the window size. This is intentional—it filters out single-bar noise spikes in coherence. Users requiring faster reaction can reduce the smoothing window to 1-2 bars, at the cost of increased sensitivity to noise.
Complex Number Representation : Pine Script does not have native complex number types. Complex arithmetic is implemented using separate real and imaginary accumulators (sum_cos, sum_sin) and manual calculation of magnitude (sqrt(real² + imag²)) and argument (atan2(imag, real)).
Lookback Limits : The indicator respects Pine Script's maximum lookback constraints. Historical phase and amplitude values are accessed using the operator, with lookback limited to the chart's available bar history (max_bars_back=5000 declared).
Visual Rendering Performance : Tables (orbit plot, heat map, web, dashboard) are conditionally deleted and recreated on each update using table.delete() and table.new(). This prevents memory leaks but incurs redraw overhead. Rendering is restricted to barstate.islast (last bar) to minimize computational load—historical bars do not render visuals.
Alert Condition Triggers : alertcondition() functions evaluate on bar close when their boolean conditions transition from false to true. Alerts do not fire repeatedly while a condition remains true (e.g., CI stays above threshold for 10 bars fires only once on the initial cross).
Color Gradient Functions : The phaseColor() function maps phase angles to RGB hues using sine waves offset by 120° (red, green, blue channels). This creates a continuous spectrum where -180° to +180° spans the full color wheel. The amplitudeColor() function maps amplitude to grayscale intensity. The coherenceColor() function uses cos(phase) to map contribution to CI (positive = green, negative = red).
No External Data Requests : QRFM operates entirely on the chart's symbol and timeframe. It does not use request.security() or access external data sources. All calculations are self-contained, avoiding lookahead bias from higher-timeframe requests.
Deterministic Behavior : Given identical input parameters and price data, QRFM produces identical outputs. There are no random elements, probabilistic sampling, or time-of-day dependencies.
— Dskyz, Engineering precision. Trading coherence.

Multi-Condition Alert Builder⚡ Multi-Condition Alert Builder — Modular Alert Framework
The Multi-Condition Alert Builder is a powerful, code-free alert engine for TradingView. It allows traders to build complex multi-condition Buy/Sell alerts using simple dropdown menus — no Pine Script experience required.
Combine up to five separate conditions per side and trigger alerts based on your own custom logic.
🧠 How It Works
Each “Buy” and “Sell” side includes up to five configurable slots, where you can define:
Two data sources (indicators, price, or custom inputs)
A comparison or crossover condition
A static value (optional)
Once your slots are defined, the script combines these individual conditions according to your chosen mode:
Any – triggers when any enabled condition is true
All – same bar – triggers only when all enabled conditions occur on the same bar
All – within bars – allows conditions to complete within a user-defined lookback window
This gives traders fine-grained control to design powerful, adaptive alert logic directly in the chart — no coding required.
⚙️ Key Features
🧩 Up to 5 Buy and 5 Sell Slots – Fully customizable condition slots
🧠 Combine Logic Modes – Any / All / Within Bars flexibility
🔔 Custom Alerts – Generates separate Buy, Sell, or combined alert events
⏱️ Close-Bar Confirmation Option – Avoids premature signals on open candles
💡 Visual Signals – Plots arrows on chart for clear alert visualization
🔄 Indicator-Agnostic – Works with any sources or indicators available in your chart
🧮 Combine Logic Modes Explained
Mode Description
Any Triggers an alert if any active condition is met
All – same bar Requires all active slots to confirm on the same candle
All – within bars Conditions may complete within a set lookback window
🧭 Example Use Cases
Combine RSI, MACD, and MA crossovers for precision entries
Create alert triggers for momentum confluence setups
Build “stacked signal” logic (e.g., RSI < 30 and MACD crossover within 3 bars)
Quickly prototype and test multi-factor alert conditions
🧠 Usage Tip
Once your conditions are set, simply add TradingView alerts tied to:
“BUY↟” for long signals
“SELL↡” for short signals
“ANY ALERT” to trigger on either event
The Alert Builder becomes especially powerful when combined with your favorite custom indicators — enabling smart, automated alerts without extra coding.
⚡ In Short
Build. Combine. Alert.
The Multi-Condition Alert Builder gives you total flexibility to design complex alert logic — visually, intuitively, and efficiently — right on your chart.
Smart Money Concept v1Smart Money Concept Indicator – Visual Interpretation Guide
What Happens When Liquidity Lines Are Broken
🟩 Green Line Broken (Buy-Side Liquidity Pool Swept)
- Indicates price has dipped below a previous swing low where sell stops are likely placed.
- Market Makers may be triggering these stops to accumulate long positions.
- Often followed by a bullish reversal.
- Trader Actions:
• Look for a bullish candle close after the sweep.
• Confirm with nearby Bullish Order Block or Fair Value Gap.
• Consider entering a Buy trade (SLH entry).
- If price continues falling: Indicates trend continuation and invalidation of the buy-side liquidity zone.
🟥 Red Line Broken (Sell-Side Liquidity Pool Swept)
- Indicates price has moved above a previous swing high where buy stops are likely placed.
- Market Makers may be triggering these stops to accumulate short positions.
- Often followed by a bearish reversal.
- Trader Actions:
• Look for a bearish candle close after the sweep.
• Confirm with nearby Bearish Order Block or Fair Value Gap.
• Consider entering a Sell trade (SLH entry).
- If price continues rising: Indicates trend continuation and invalidation of the sell-side liquidity zone.
Chart-Based Interpretation of Green Line Breaks
In the provided DOGE/USD 15-minute chart image:
- Green lines represent buy-side liquidity zones.
- If these lines are broken:
• It may be a stop hunt before a bullish continuation.
• Or a false Break of Structure (BOS) leading to deeper retracement.
- Confirmation is needed from candle structure and nearby OB/FVG zones.
Is the Pink Zone a Valid Bullish Order Block?
To validate the pink zone as a Bullish OB:
- It should be formed by a strong down-close candle followed by a bullish move.
- Price should have rallied from this zone previously.
- If price is now retesting it and showing bullish reaction, it confirms validity.
- If formed during low volume or price never rallied from it, it may not be valid.
Smart Money Concept - Liquidity Line Breaks Explained
This document explains how traders should interpret the breaking of green (buy-side) and red (sell-side) liquidity lines when using the Smart Money Concept indicator. These lines represent key liquidity pools where stop orders are likely placed.
🟩 Green Line Broken (Buy-Side Liquidity Pool Swept)
When the green line is broken, it indicates:
• - Price has dipped below a previous swing low where sell stops were likely placed.
• - Market Makers have triggered those stops to accumulate long positions.
• - This is often followed by a bullish reversal.
Trader Actions:
• - Look for a bullish candle close after the sweep.
• - Confirm with a nearby Bullish Order Block or Fair Value Gap.
• - Consider entering a Buy trade (SLH entry).
🟥 Red Line Broken (Sell-Side Liquidity Pool Swept)
When the red line is broken, it indicates:
• - Price has moved above a previous swing high where buy stops were likely placed.
• - Market Makers have triggered those stops to accumulate short positions.
• - This is often followed by a bearish reversal.
Trader Actions:
• - Look for a bearish candle close after the sweep.
• - Confirm with a nearby Bearish Order Block or Fair Value Gap.
• - Consider entering a Sell trade (SLH entry).
📌 Additional Notes
• - If price continues beyond the liquidity line without reversal, it may indicate a trend continuation rather than a stop hunt.
• - Always confirm with Higher Time Frame bias, Institutional Order Flow, and price reaction at the zone.

Intelligent Currency Breakout ChannelIndicator: Intelligent Currency Breakout Channel
This document provides a detailed explanation of the "Intelligent Currency Breakout Channel" indicator for TradingView.
1. Overview
The Intelligent Currency Breakout Channel is an advanced technical analysis tool designed to identify periods of price consolidation and signal potential breakouts. It automatically draws channels around ranging price action and utilizes sophisticated volume analysis to provide deeper insights into market sentiment. The indicator also includes a built-in logarithmic regression screener to help traders align their breakout signals with the broader market trend.
2. Key Features
Automatic Channel Detection: The indicator identifies periods of low volatility and automatically draws a containing channel (box) around the price action.
Breakout Signals: It generates clear visual alerts (▲ for bullish, ▼ for bearish) when the price closes decisively outside of a channel.
In-Depth Volume Analysis: Within each channel, the indicator plots volume as candlestick-like bars, offering three distinct modes: Total Volume, Buy/Sell Comparison, and Volume Delta. This helps traders gauge the strength and conviction behind price movements.
Real-time Sentiment Gauge: When a channel is active, a dynamic color-graded gauge appears on the right side of the chart. It visualizes the current volume delta momentum relative to its recent range, offering an at-a-glance sentiment reading.
Integrated Trend Screener: A secondary analysis tool based on logarithmic regression is included to determine the underlying trend direction (Up, Down, or Neutral), which can be used to filter breakout signals.
Fully Customizable: Users can extensively customize all parameters, from calculation lengths and breakout sensitivity to the visual appearance of every component.
3. How to Use
Channel Formation: Watch for the indicator to draw a new channel. This signifies that the market is in a consolidation or ranging phase. The formation of a channel itself can be an alertable event.
Volume Interpretation: Observe the volume bars inside the channel. An increase in volume as the price approaches the channel's upper or lower boundary can foreshadow a potential breakout. Use the Volume Display Mode to analyze if buying pressure (Comparison, Delta) or selling pressure is building.
Breakout Confirmation: A bullish breakout signal (▲) appears when the price closes above the channel's upper boundary. A bearish breakout signal (▼) appears when the price closes below the lower boundary. For higher-quality signals, enable the Strong Closes Only option.
Trend Confirmation (Screener): Use the screener's plot and background color to confirm the broader trend. For instance, you might choose to only take bullish breakout signals when the screener indicates an uptrend (green background) and bearish signals when it indicates a downtrend (red background).
Sentiment Gauge: The pointer on the gauge indicates current momentum. A pointer in the upper (green) section suggests bullish pressure, while a pointer in the lower (red) section suggests bearish pressure. This can provide additional confluence for a trade decision.
4. Settings and Inputs
Main Settings
Overlap Channels: If enabled, allows multiple channels to be drawn on the chart simultaneously, even if they overlap. When disabled, a new channel will only form if it doesn't intersect with an existing one.
Strong Closes Only: If enabled, a breakout is only triggered if the midpoint of the candle's body (average of open and close) is outside the channel. This helps filter out false signals caused by long wicks. If disabled, any close outside the channel triggers a breakout.
Normalization Length: The lookback period (in bars) used for price normalization. A higher value creates a more stable normalization but may be slower to react to recent price changes.
Box Detection Length: The lookback period used to detect the channel formation pattern. A lower value will result in more frequent channels but may be more sensitive to noise. A higher value will result in fewer, but potentially more significant, channels.
Volume Analysis
Show Volume Analysis: Toggles the visibility of the candlestick-like volume bars inside the channel.
Volume Display Mode:
Volume: Displays total volume as symmetrical bars around the channel's midline.
Comparison: Shows buying volume (green) above the midline and selling volume (red) below it.
Delta: Shows the net difference between buying and selling volume. Positive delta is shown above the midline, and negative delta is shown below.
Volume Delta Timeframe Source: The timeframe from which to source volume data for calculations. Using a lower timeframe can provide a more granular view of volume dynamics.
Volume Scaling: A multiplier that adjusts the vertical size of the volume bars relative to the channel's height.
Appearance
Volume Text Size: Sets the size of the volume data text displayed in the corners of the channel. Options: Tiny, Small, Medium, Large.
Bullish Color: The primary color for all bullish visual elements, including breakout signals and positive volume bars.
Bearish Color: The primary color for all bearish visual elements, including breakout signals and negative volume bars.
Screener Settings
Lookback Period: The number of bars used for the logarithmic regression calculation to determine the trend.
Screener Type:
Log Regression Channel: The signal is based on the slope of the entire regression channel over the lookback period. An upward sloping channel is bullish (1), and a downward sloping one is bearish (-1).
Logarithmic Regression: The signal is based on the most recent value of the regression line compared to its value 3 bars ago. This provides a more responsive measure of the immediate trend.
5. Alerts
You can set up the following alerts through the TradingView alerts panel:
New Channel Formed: Triggers when a new price consolidation channel is detected and drawn on the chart.
Bullish Breakout: Triggers when the price breaks out and closes above the upper boundary of a channel.
Bearish Breakout: Triggers when the price breaks out and closes below the lower boundary of a channel.
Is In Channel: Triggers on every bar that the price is currently trading inside an active channel.
Signal UP: Triggers when the Screener's signal turns bullish (1).
Signal DOWN: Triggers when the Screener's signal turns bearish (-1).

Inside Candle DivergenceStudy Material: Inside Candle Divergence Indicator (aiTrendview)
1. Introduction
The Inside Candle Divergence Indicator is a custom tool built on TradingView using Pine Script. It is designed to help traders identify potential reversal points or trend continuations using a mix of candlestick analysis, RSI (Relative Strength Index), VWAP (Volume Weighted Average Price), Pivot Points, and Volume analytics. The tool also provides a dashboard table on the chart, summarizing all key values in a single glance for traders and analysts.
This indicator is not just a signal generator but also an educational framework—explaining how different concepts in technical analysis combine to build a systematic approach for market entries and exits.
________________________________________
2. Core Concepts Behind the Tool
A. Inside Candle Pattern
An Inside Candle forms when the current candle’s high is lower than or equal to the previous candle’s high, and the low is higher than or equal to the previous candle’s low.
• This means the entire price action of the current candle is "inside" the range of the previous candle.
• A bullish inside candle occurs when the close is higher than the open.
• A bearish inside candle occurs when the close is lower than the open.
This pattern shows market indecision but also sets up potential breakouts or trend reversals.
________________________________________
B. RSI (Relative Strength Index)
The indicator calculates RSI using the formula from the ta.rsi() function in TradingView. RSI helps measure momentum in the market.
• A low RSI (below 25) signals an oversold zone → possible buy.
• A high RSI (above 75) signals an overbought zone → possible sell.
By combining RSI with the Inside Candle, the indicator ensures that signals are triggered only when momentum and price patterns confirm each other.
________________________________________
C. Buy & Sell Signals
• Buy Signal: Triggered when RSI < Buy Level (default 25) and a bullish inside candle forms.
• Sell Signal: Triggered when RSI > Sell Level (default 75) and a bearish inside candle forms.
When triggered, the chart displays a BUY (green label below candle) or SELL (red label above candle) marker. The indicator also saves the entry price and signal bar for future reference inside the dashboard.
________________________________________
D. VWAP (Volume Weighted Average Price)
VWAP is calculated using the typical price (H+L+C)/3 and weighting it by volume.
• VWAP shows the average trading price weighted by volume, widely used by institutions.
• The tool calculates the distance of price from VWAP in % terms.
• If price is far above VWAP, the market may be overheated (overbought). If far below, it may be undervalued (oversold).
________________________________________
E. Volume Analysis
The tool splits volume into Buy Volume and Sell Volume:
• Buy Volume: If close > open.
• Sell Volume: If close ≤ open.
• Cumulative totals are maintained, and percentages are calculated to show what proportion of total market volume is bullish vs bearish.
• A progress bar style visual (using blocks █) shows the dominance of buyers or sellers.
This allows traders to quickly measure whether buyers or sellers are controlling the market trend.
________________________________________
F. Daily Pivot Points
Pivot Points are calculated using the previous day’s high, low, and close:
• Pivot = (High + Low + Close) / 3
• R1, S1, R2, S2, R3, S3 levels are derived from this pivot.
• These levels act as support and resistance zones.
The script plots Pivot, R1, and S1 lines on the chart for easy reference.
________________________________________
G. Trend Direction
The indicator checks where the price is compared to R1 and S1:
• If price > R1 → Bullish Trend
• If price < S1 → Bearish Trend
• Otherwise → Neutral Trend
The trend direction is displayed in the dashboard with arrows (↑, ↓, →).
________________________________________
H. Price Change Calculation
The tool calculates:
• Price Change = Current Close – Previous Close
• Percentage Change = (Change / Previous Close) × 100
• Displays ▲ (green upward) or ▼ (red downward) with the exact percentage.
This gives traders a quick snapshot of intraday price movement.
________________________________________
I. Dashboard Table
One of the most powerful features is the real-time dashboard table shown on the chart. It contains:
1. Symbol & Price Info (Current ticker, price, change %)
2. RSI Reading (with color coding: green for oversold, red for overbought)
3. VWAP and Distance from VWAP
4. Volume Analysis with Progress Bar (Buy vs Sell %)
5. Pivot Levels (Pivot, R1, S1)
6. Trend Direction (Bullish, Bearish, Neutral)
7. Signal Status (Last Buy/Sell signal with entry price)
This reduces the need for multiple indicators and gives traders a command-center view directly on the chart.
________________________________________
J. Alerts
The tool generates alerts whenever a Buy or Sell condition is met. Traders can set up TradingView alerts to be notified instantly when:
• Buy Signal Alert → RSI oversold + Bullish inside candle
• Sell Signal Alert → RSI overbought + Bearish inside candle
This ensures no opportunity is missed even if you’re not actively monitoring the chart.
________________________________________
K. Background Highlights
The chart background also changes faintly (light green or light red) when a Buy or Sell condition is triggered. This gives traders visual confirmation along with signals and alerts.
________________________________________
3. Practical Use of This Tool
• Scalpers & Intraday Traders can use it for quick momentum-based entries.
• Swing Traders can use the RSI + Inside Candle + Pivot Points to find medium-term reversals.
• Analysts can use the dashboard for real-time summaries in reports.
• Volume Analysis helps understand institutional activity.
Remember: This is not a standalone holy grail. It must be used with proper risk management and confirmation from higher timeframes.
________________________________________
4. Strict Disclaimer (aiTrendview)
⚠️ Disclaimer from aiTrendview:
This indicator is designed for educational and analytical purposes only. It is not financial advice or a guaranteed trading strategy. Markets are inherently risky and unpredictable; past performance of indicators does not ensure future results. Trading involves risk of financial loss, and traders must use proper risk management, stop-loss, and independent judgment.
aiTrendview strictly follows TradingView.com rules and compliance guidelines.
Any misuse of this tool, its code, or analytical features for unauthorized commercial purposes, false promises, or misleading activities is strictly discouraged. The creators of this script and aiTrendview will not be responsible for any losses, damages, or misuse arising from its application. Always trade responsibly and only with money you can afford to lose.
________________________________________
