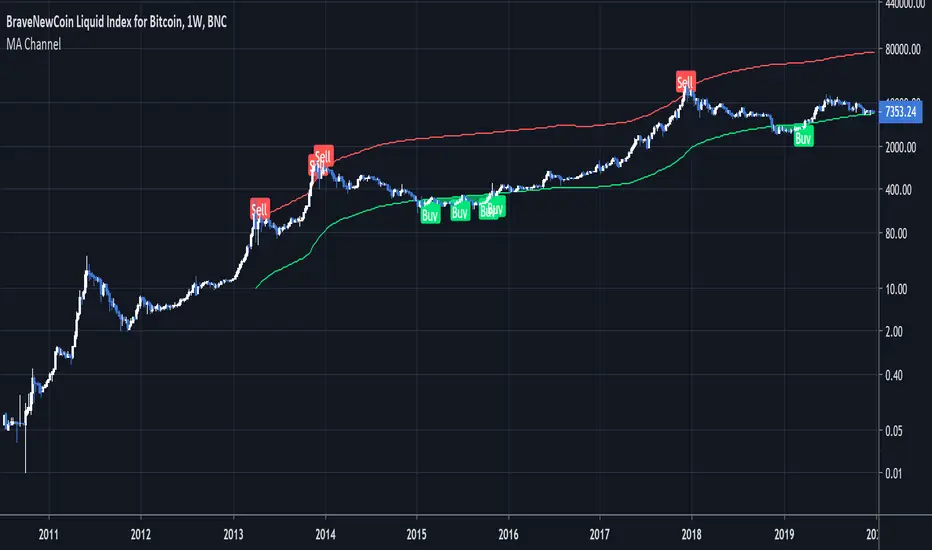
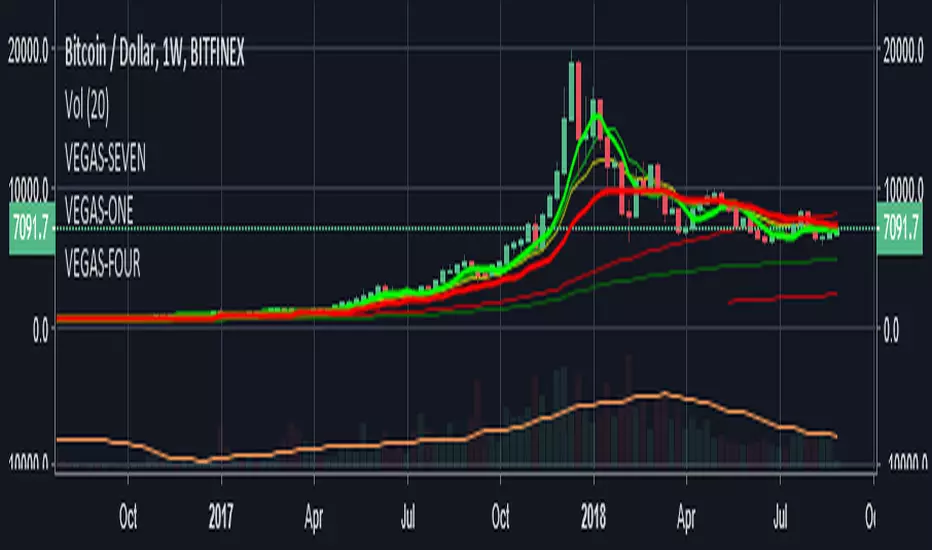
Moving Average ChannelIntended for use on BTC long term (BNC:BLX Weekly) with Logarithmic charts only
As Bitcoin is adopted, it moves through market cycles. These are created by periods where market participants are over-excited causing the price to over-extend, and periods where they are overly pessimistic where the price over-contracts. Identifying and understanding these periods can be beneficial to the long term investor. This long term investment tool is a simple and effective way to highlight those periods.
Buying Bitcoin when the price drops below the green line has historically generated outsized returns. Selling Bitcoin when price goes above the red line has been historically effective for taking profits.
NOTE: 144 Week = 2¾ Years. 104 Weeks = 2 Years. Originally created by Philip Swift
Search in scripts for "weekly"

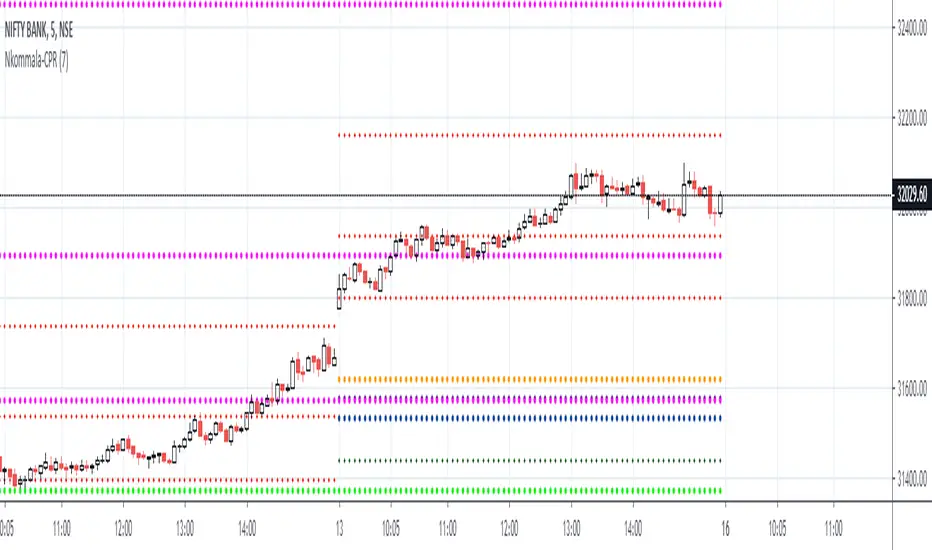
camarilla - Daily,Weekly,Monthly by Ganeshcamarilla - Daily,Weekly,Monthly levels in one chart for support and resitance

che_trader - Monthly, weekly and daily levelsI share with you my version of the most important high time frame levels in a version pleasant to the eye and with several options.
This indicator contains:
Current levels:
The possibility to change from green to red depending on whether the price is above or below the level.
Available for:
current daily open
current weekly open
current monthly open
The indicator shows the open, low and high for each default level.
It is also possible through the menu to add the levels for the last days, weeks or months, disabled by default.
This script is free to use!
Enjoy!
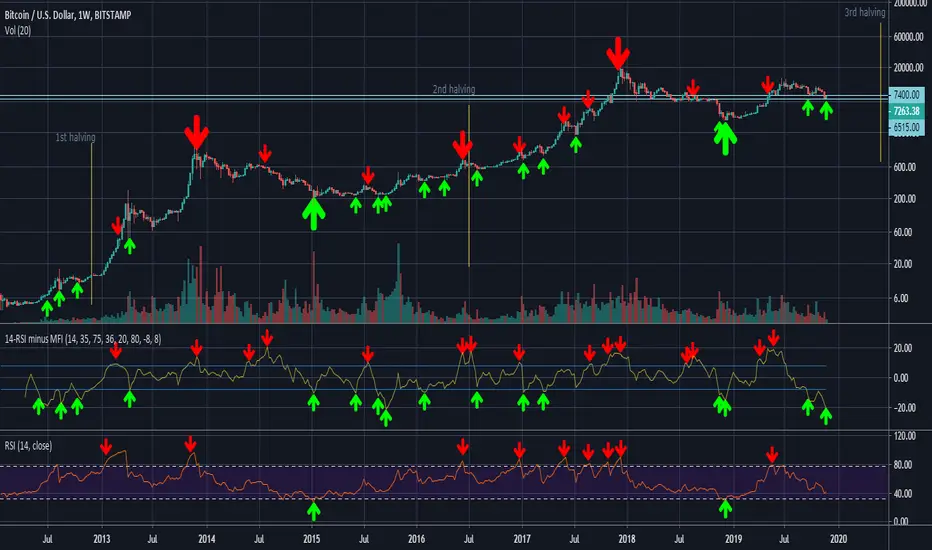
14-RSI minus 36-MFI (weekly)On the weekly chart of BTC/USD, the difference between the 14-RSI and the 36-MFI, combined with the 14-RSI alone, gives good buy and sell signals.
sma 50 100 200 multi Timframes actual daily weekly monthlysma 50-100-200
Just 3 sma from actual,daily,weekly and monthly timeframe
Moving Average Daily (& Weekly) 50,100,200Free to use Moving Average indicator for 50, 100 and 200 days that displays both the daily and weekly Moving Averages on the same chart - revealing key support and resistance lines that might otherwise be overlooked. Please ensure to view in daily view only.
What is a Moving Average?
Smooths out the price across each period to reveal short, medium and long term trends and their relationship to each other. In principal, when the price is above a moving average the trend is up, when the price is below a moving average the trend is down.
When a short term MA crosses above a long term MA (a "golden cross") it is a strong buy signal. Conversely when a short term MA crosses below a long term MA (a "death cross") it is a strong sell signal. However, a death cross is usually only critical when both MAs are moving downwards.
Note that Moving Averages represent historical data and therefore are not strictly predictive in nature, but show trends that may be in action. Notably the 200 MA will often be particularly respected as support or resistance.
This tool is for educational purposes only and not a recommendation to buy or sell. Always do your own research before trading.

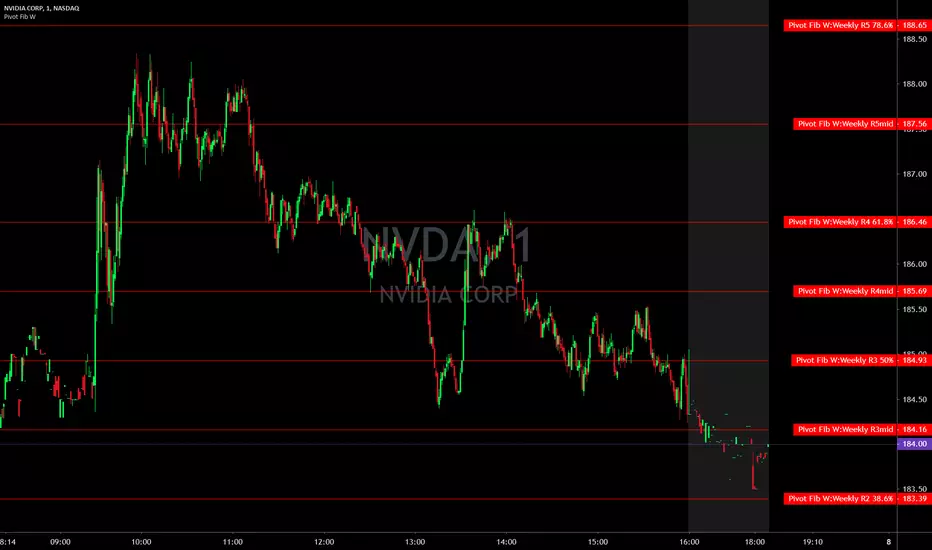
Pivot Points with Fibonacci WeeklyPivot Points with Fibonacci
Weekly only
What is a Pivot Point?
A pivot point is a technical analysis indicator, or calculations, used to determine the overall trend of the market over different time frames. The pivot point itself is simply the average of the high, low and closing prices from the previous trading day. On the subsequent day, trading above the pivot point is thought to indicate ongoing bullish sentiment, while trading below the pivot point indicates bearish sentiment.
The pivot point is the basis for the indicator, but it also includes other support and resistance levels that are projected based on the pivot point calculation. All these levels help traders see where the price could experience support or resistance. Similarly, if the price moves through these levels it lets the trader know the price is trending in that direction.
When the price of an asset is trading above the pivot point , it indicates the day is bullish or positive.
When the price of an asset is trading below the pivot point , it indicates the day is bearish or negative.
The indicator typically includes four additional levels: S1, S2, R1, and R2. These stand for support one and two, and resistance one and two.
Support and resistance one and two may cause reversals, but they may also be used to confirm the trend. For example, if the price is falling and moves below S1, it helps confirm the downtrend and indicate a possible continuation to S2.
This Script includes the Mid Pivot Points , All levels are based on Fibonacci

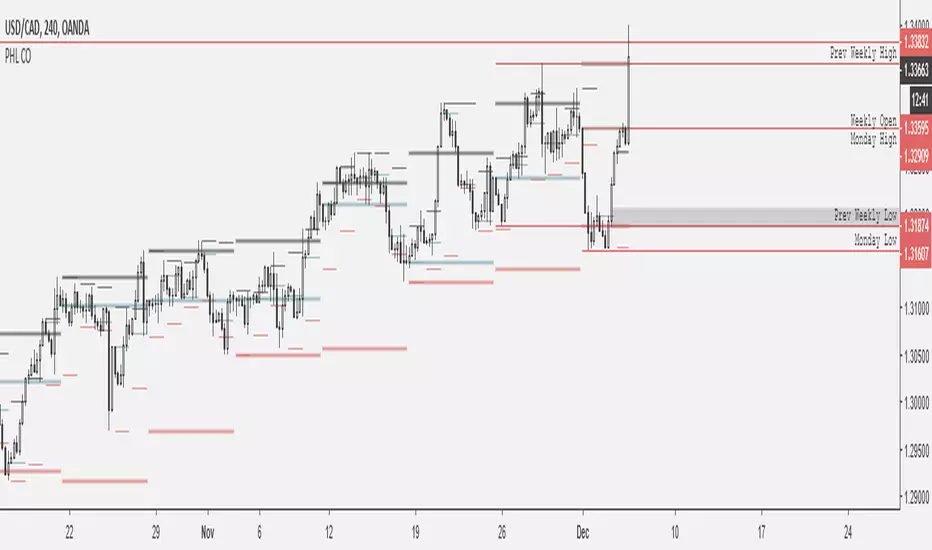
X0_Trading_levelsScript which marks out the trading ranges I often like to have mapped out on the charts:
Mondays Trading range - open, high, low
Daily open, high, low
Weekly open
Monthly open.
Can change all colours


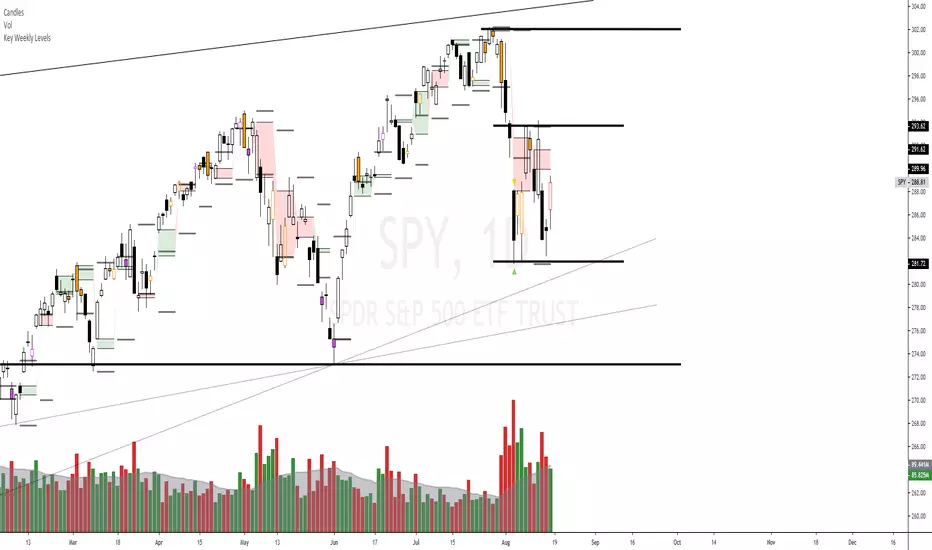
Key Weekly LevelsIncluded is the current weekly open, previous high, Low, Close, and the gap is highlighted.
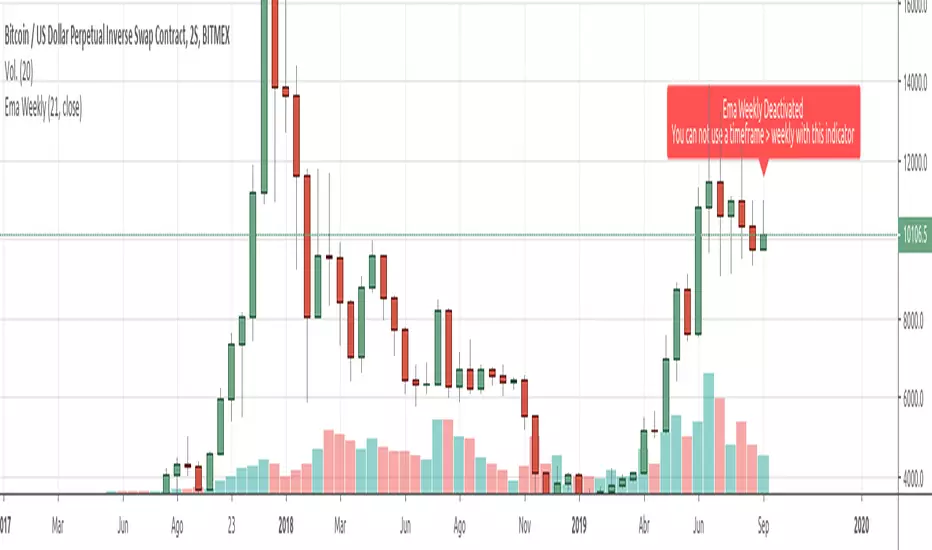
Ema Weekly In current TimeframeThis simple indicator shows the Ema with data extracted from weekly timeframe in your current displayed timeframe.
Due to Tradingview working restrictions, this indicator only works if is used in a timeframe lower (or equal) to one week, otherways shows an error red label showing this error.
All my scripts:
es.tradingview.com
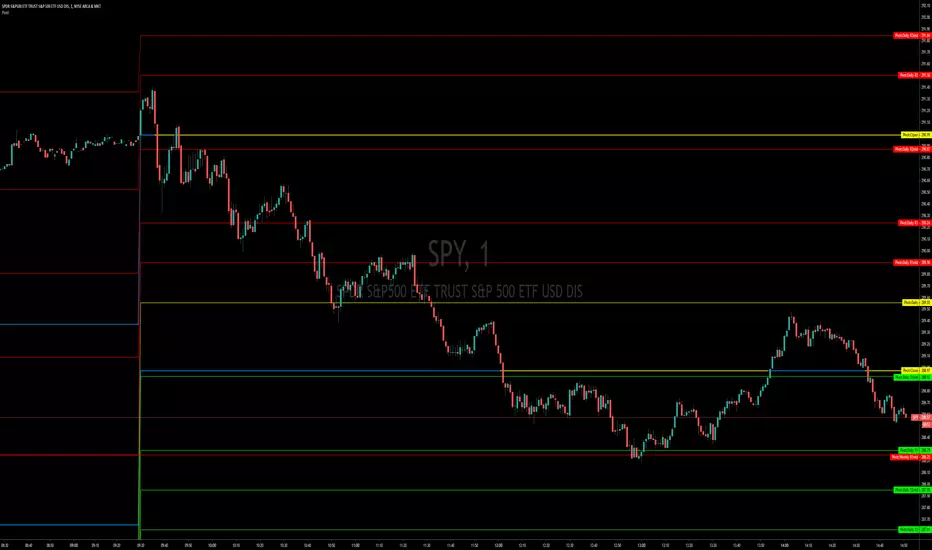
Pivot Points, Daily, Weekly, Open and Close lines What is a Pivot Point?
A pivot point is a technical analysis indicator, or calculations, used to determine the overall trend of the market over different time frames. The pivot point itself is simply the average of the high, low and closing prices from the previous trading day. On the subsequent day, trading above the pivot point is thought to indicate ongoing bullish sentiment, while trading below the pivot point indicates bearish sentiment.
The pivot point is the basis for the indicator, but it also includes other support and resistance levels that are projected based on the pivot point calculation. All these levels help traders see where the price could experience support or resistance. Similarly, if the price moves through these levels it lets the trader know the price is trending in that direction.
When the price of an asset is trading above the pivot point, it indicates the day is bullish or positive.
When the price of an asset is trading below the pivot point, it indicates the day is bearish or negative.
The indicator typically includes four additional levels: S1, S2, R1, and R2. These stand for support one and two, and resistance one and two.
Support and resistance one and two may cause reversals, but they may also be used to confirm the trend. For example, if the price is falling and moves below S1, it helps confirm the downtrend and indicate a possible continuation to S2.
This Script includes the Mid Pivot Points, Open and Close levels
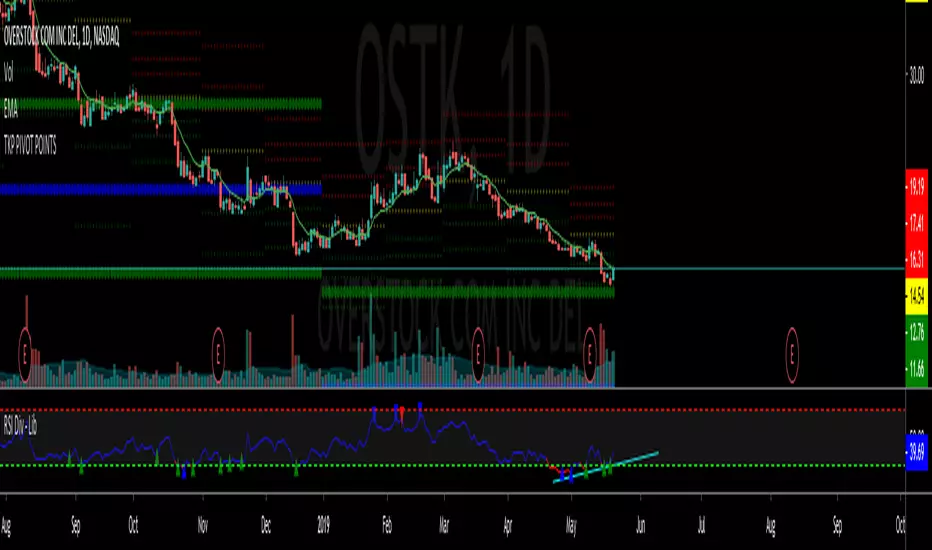
TKP Weekly, Monthly and Yearly Fib Pivot PointsThis script allows you to plot Weekly, Monthly and Yearly Fibonacci Pivot Points. I used templates from others I found on TradingView, special thanks given in the Script. I prefer Longer time frames, especially yearly Pivots, to predict reversals and places to trim risk, so this was tailored to my needs. Hope this helps!
Anas crypto auto regrission channel weekly crypto auto regression channel for weekly period , recommend to be used on 4 hours time frame , this will not work on any thing else , only crypto or any 24 hours/7(days) charts , other charts 24/5 , 8/5 , 16/5 will not work .
enjoy and don't forget to like :)

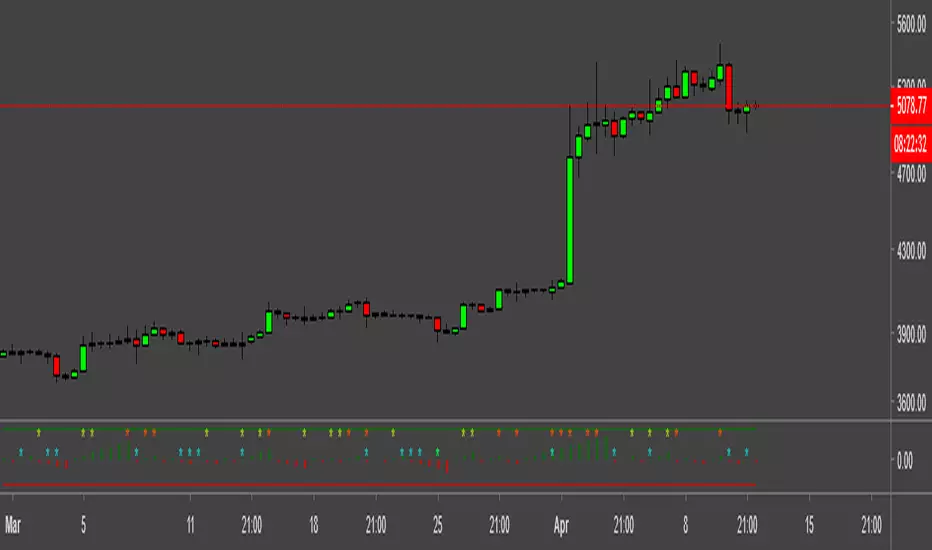
Bars Counter + Daily/Weekly Highs/Low highlight.Hey!
This script is a remake from other's devs scripts.
The * makes a signal if there is a higher high or lower low , RED( I don't know why looks orange )/LIME for WEEKLY and AQUA/YELLOW for a 36 hs WINDOW.
You can change this parameter as u wish.
The bar counter is simple.
Let me know ur feedback.
MWD_XO_OPENSCreated by TraderX0 & Stingray
Helps you plot the Monthly, Weekly, and Daily Opens quickly on your chart; Open the options menu to adjust colors and toggle time-frames(M/W/D) on/off.

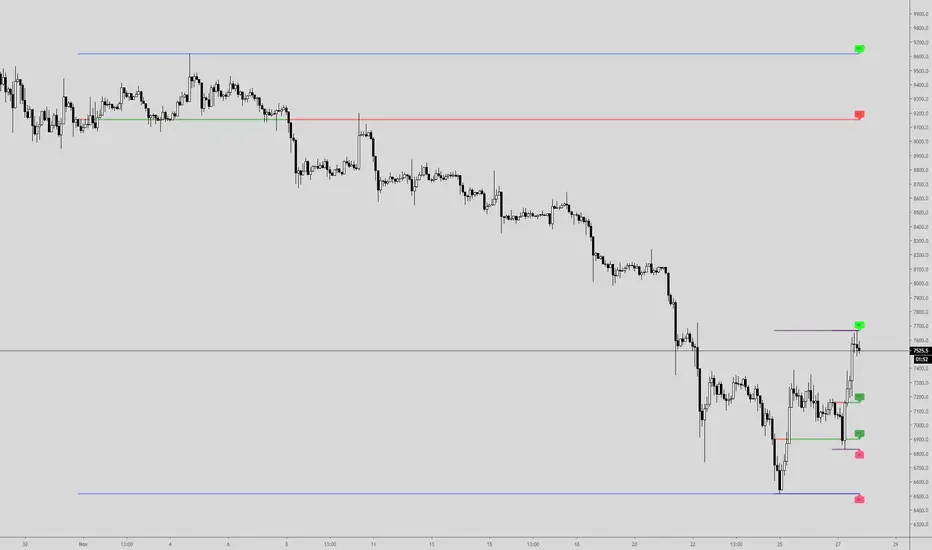
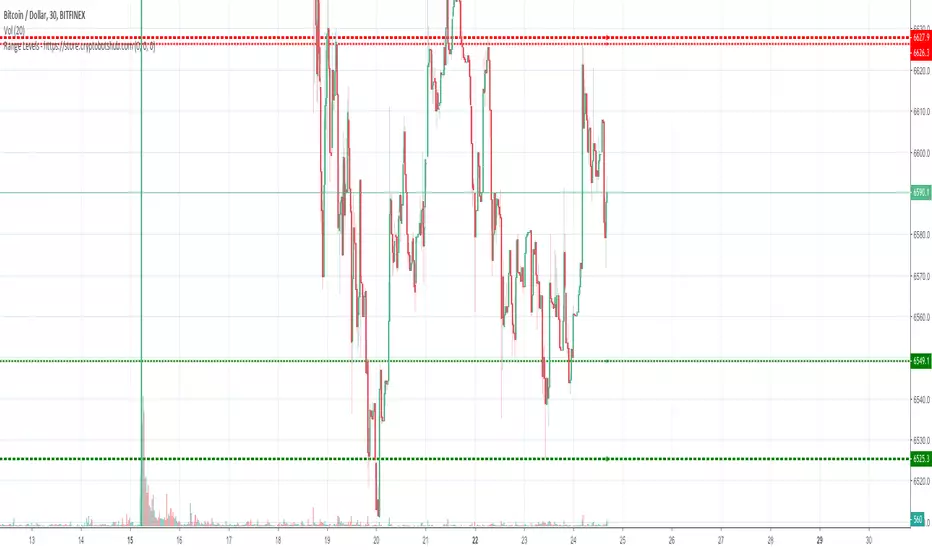
Range Levels - High and Low of Daily, Weekly, and Montly RangesThis is a great free script for the current ranging crypto markets.
You can see the daily, weekly, and monthly high and low of ranges. It also has alerts that you can enable in the settings and then setup in your TradingView alerts for when the price crosses these levels.
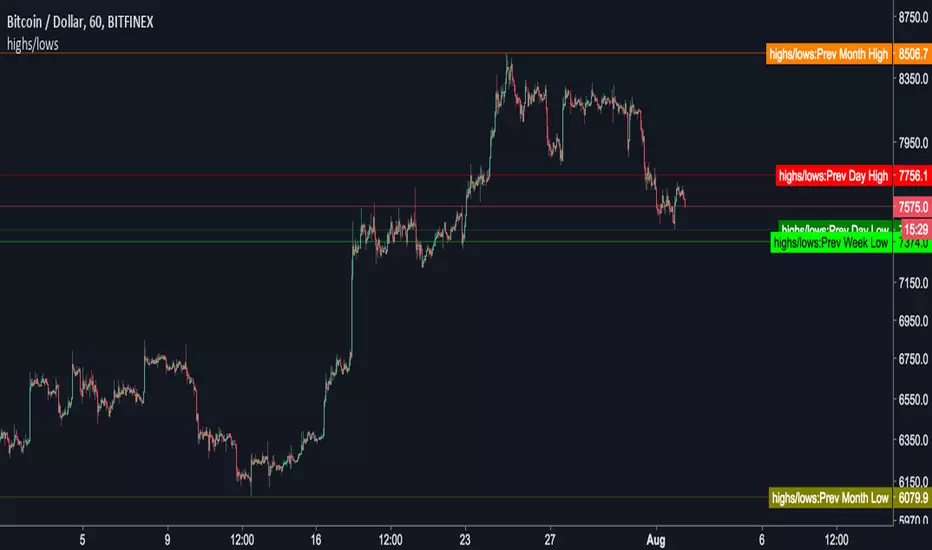
Instabots previous highs and lowsAdds previous daily, weekly and monthly highs and lows to the chart.
By default it just adds the price line to the chart. Change the default option to plot the highs and lows onto the chart, like below...