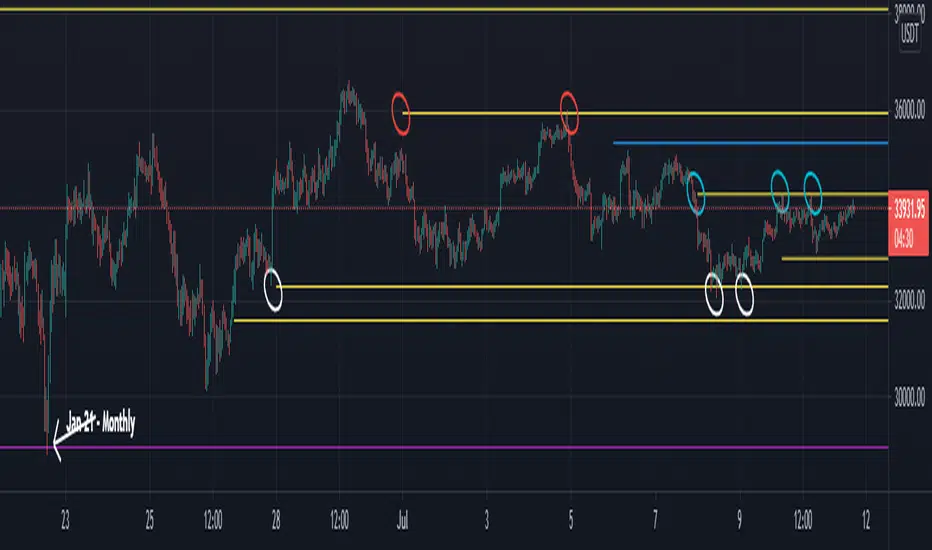
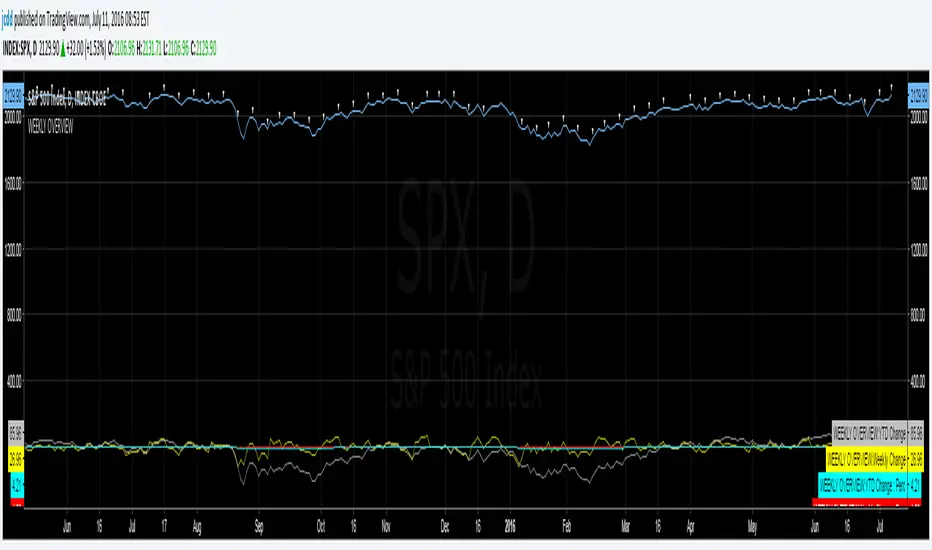
High/Low/Open/Close Daily, Weekly, Monthly Line
I wrote this for the purpose of saving time while marking up charts by automating the process of drawing and labeling lines at areas of interest on larger
timeframes while still having the option to change the style and size of the lines and labels to adjust for any timeframe and avoid a messy chart.
I also used this as an exercise in menu organization giving users every imaginable option and producing clean readable code.
- This indicator draws a line on the Daily, Weekly, and Monthly bar at the High, Low, Open and Close of each bar as price
tends to react when revisiting these areas.
- Each set of bars has an optional identifying label with its own color set that can be shown with or without the lines
price value, and has drop down menus for size and style of each set of labels.
- Each set of lines has inputs for line/text color, line width and style, and can be hidden if the user doesn't have the need for any particular timeframe.
- Lines and Labels with delete when a new line is created.
- I recommend going into Chart Settings/Status Line and turning off indicator arguments OR moving the script to the top
of the indicator list to avoid an obstructed chart view with this indicators arguments. When Pine allows, I will update it to hide them.
Contains some public domain code from T.V. manuals and tutorial for creating drop down input menus for options.
/ ~For My Pal Jittery~
~ Who likes his clean chart and custom colors~
Search in scripts for "weekly"

Key Levels (Time Frames - Weekly,Monthly,Quarterly,Yearly)This indicator plots the 4h, Daily, Weekly, Monthly, Quarterly, Yearly Open High, Low and Mids.
You can watch how these institutional trading levels work as support and resistance.
Most Important you can add alerts to these levels with a few clicks.
Just add/remove unnecessary levels for scaling problems.
For any error/suggestion/improvement just let me know.

Naked - Daily Weekly MonthlyUser request for Naked Daily Weekly Monthly Opens.
This indicator plots the Daily Weekly Opens (the day after day after creation), they then will stay on the chart until a candle close is completed on the other side of the plot.
In the above chart picture you can see how previous monthly and daily opens have acted as support and resistance.
Thanks go to:
StackOverFlow Bjorn Mistiaen
Day Selectable Weekly Anchor VWAPSimple script to anchor VWAP on selected day of the week.
It is very useful when you want to anchor VWAP from a particular day instead of default Monday when you use weekly VWAP
Please note that this is a weekly VWAP and not daily or monthly vwap.
Example use case:
Lets say I want to anchor VWAP on specific day like Friday instead of Monday, I would just select the Friday from the drop down window and voila!

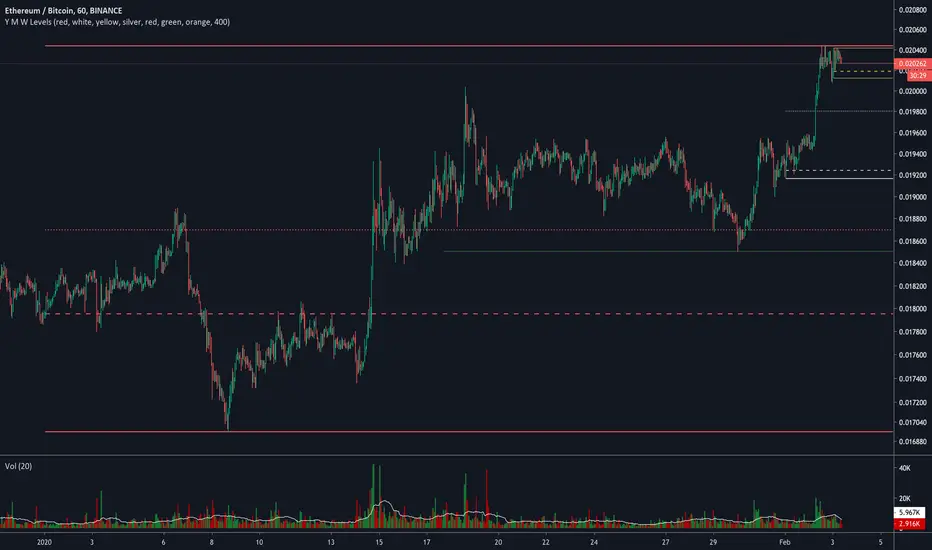
Yearly Weekly Monthly Monday Levels This script displays the Open, High, Low and Mid ranges for Yearly levels, Monthly levels, Weekly levels, and Monday range levels (useful support and resistance levels)
Opens are displayed in dashed lines, and mid-levels in dotted lines. Other lines (highs and lows) are in plain lines.
Each color represent a time horizon:
- Red: Yearly levels
- White: Monthly levels
- Yellow: Weekly levels
Colors are changeable (even though color inputs are not still available in Version 4 of TradingView PineScript).

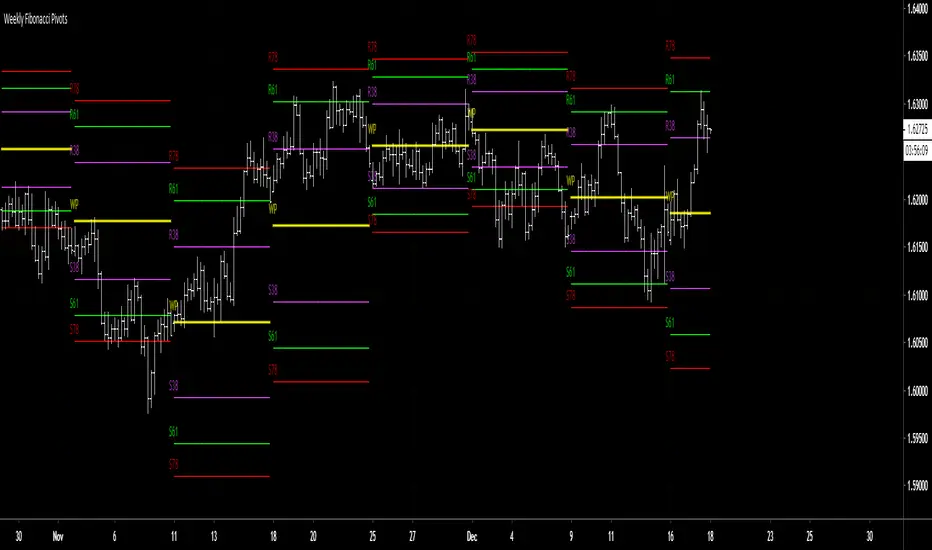
RVC-Weekly-Pivots-GANN-LevelsPurpose:
Weekly - Fibonacci pivot levels and Gann levels calculation and marking on Chart automatically.
Mainly expected to use for trading on NIFTY and BankNifty
Kindly share your comments and suggestions to improve

Yearly Weekly Monthly Monday LevelsThis script displays the Open, High, Low and Mid ranges for Yearly levels, Monthly levels, Weekly levels, and Monday range levels (useful support and resistance levels)
Opens are displayed in dashed lines, and mid-levels in dotted lines. Other lines (highs and lows) are in plain lines.
Colors are selectable (even though color inputs are not still available in Version 4 of TradingView PineScript).
Let me know your username in the comment below if you want to have access.
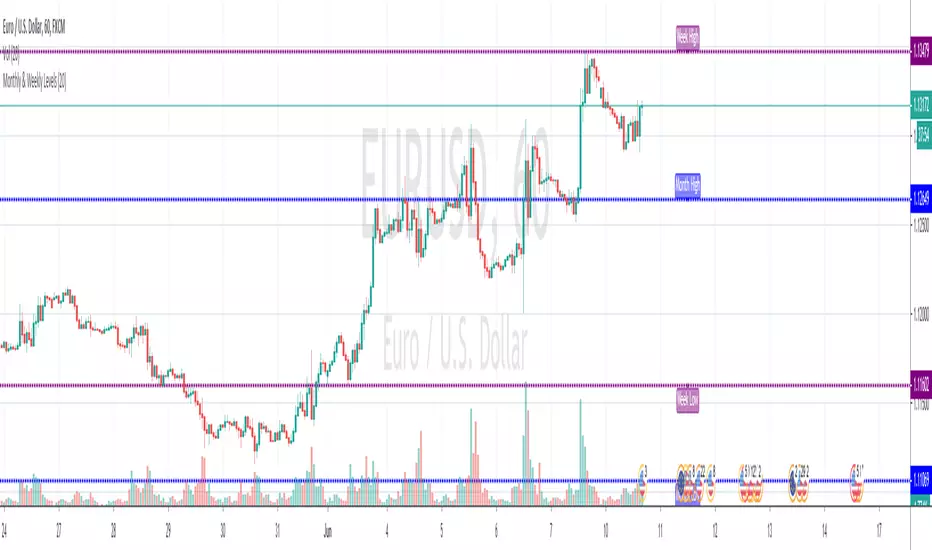
Monthly & Weekly LevelsShows and labels the previous monthly and weekly highs and lows, which are generally great areas to trade off. Loads quick and there's an option to hide the labels if they don't float your boat
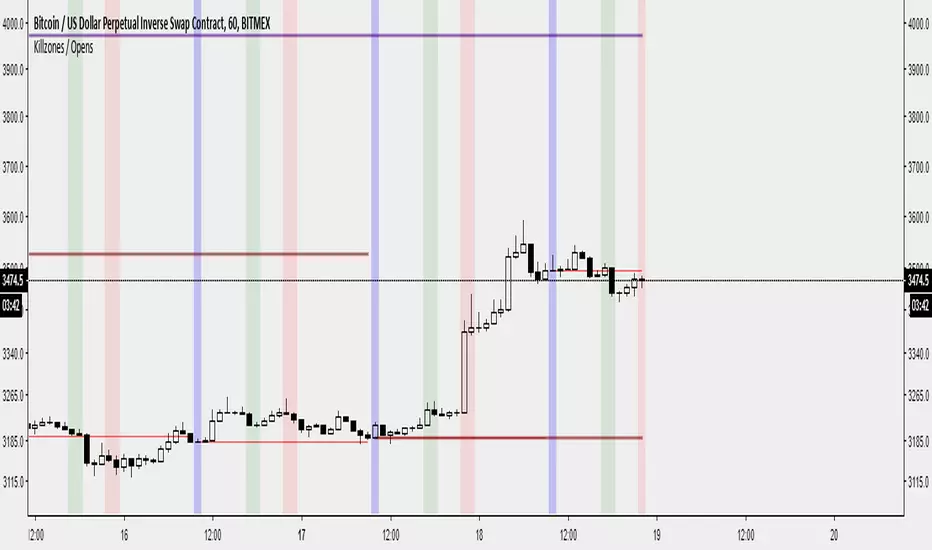
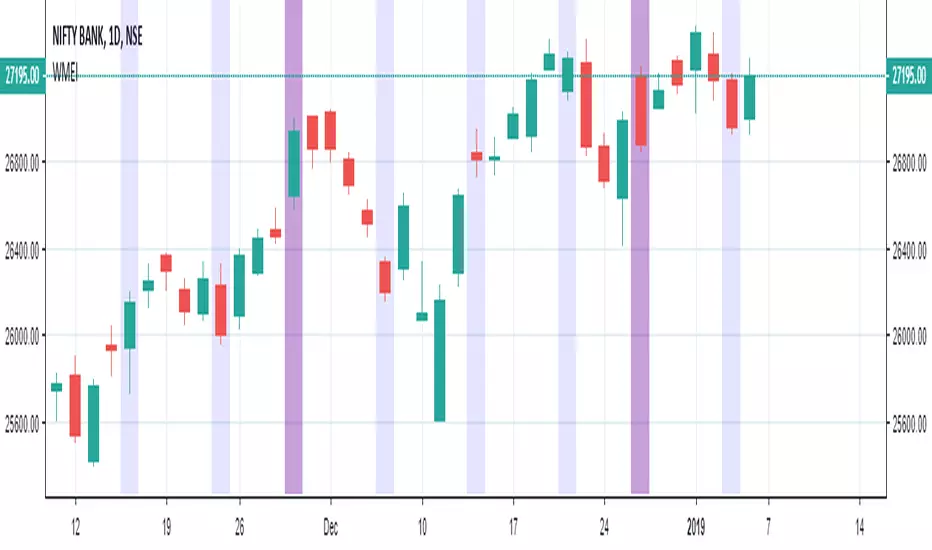
Killzones / Daily Open / Weekly Open / Monthly Open by @bartbtcI've created an indicator that :
- Displays the previous day's, week's, month's open on the current period's price action.
- Displays a vertical bar at the daily open. (The first 30-60 minutes from the daily open is commonly where the high/low of the day is made)
- Displays London/NY opens as vertical bars (london close is an option, but I have disabled it by default. I have removed Asia as I believe it is not useful - deal with it!)
Features:
- Displays daily data/killzones only on timeframes lower than 60minutes (you can modify this in the settings as you wish)
- Displays weekly open only on timeframes lower than weekly
- Displays monthly open only on timeframes lower than monthly
Let me know on Twitter on @bartbtc if there's any issues or if you have any other features you think might be useful.
Weekly Percentiles ZoneWeekly Percentiles Zone
Shows the distance of price from the 200-week EMA and classifies it into historical percentiles (P25, P50, P65, P76). Helps identify whether the asset is cheap, fair value, acceptable, risky, or very expensive compared to its long-term trend.

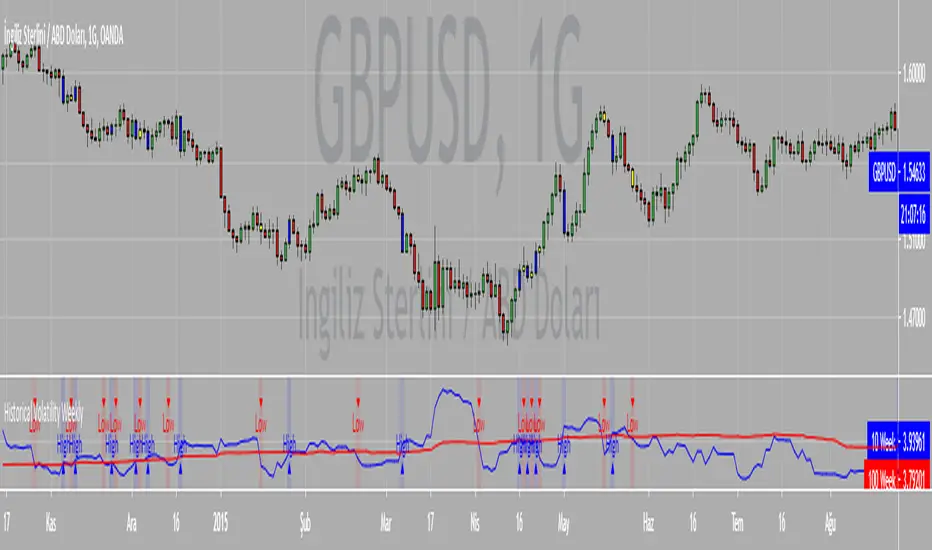
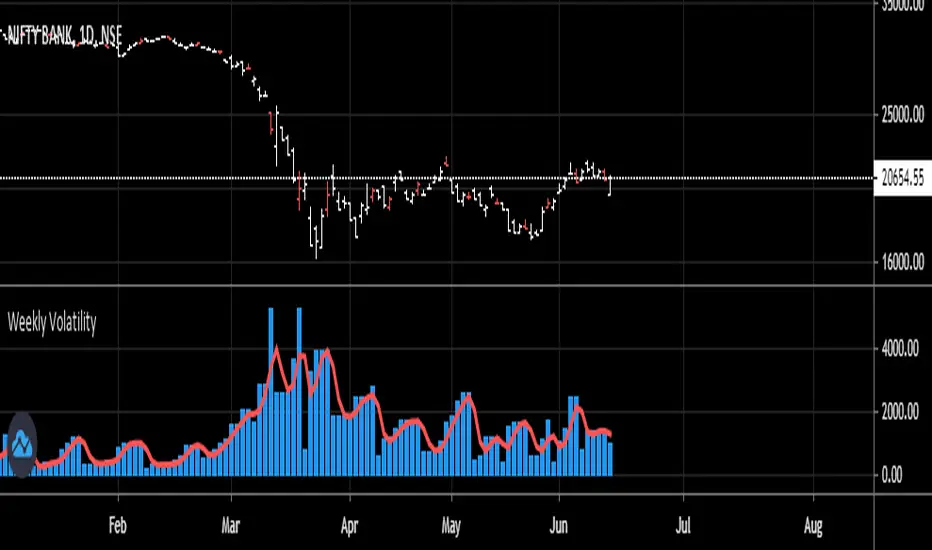
Weekly Range & Trend (Signed)Weekly Trend & Range is basically calculated every week.
It helps to get a broad idea whether coming week market can be directional , volatile or range bound action. So this helps me to get a hint which style of approach should be given more important on positional basis like directional or non-directional.
I mostly track in NSE:BANKNIFTY , NSE:NIFTY , BSE:SENSEX
For example:
Average range difference of past 4 weeks is bigger in compare to current week range difference means good chance for directional opportunities.
Average range difference of past 4 weeks is lesser in compare to current week range difference means good chance for non-directional opportunities.
Directional or Non-directional hint is been shown in terms of probability . So based on this i plan my week and trades.

Weekly BiasWeekly Bias
For H1 time frame and below.
Horizontal Line Plots every week.
Condition for line is 12am EST on Monday.
Price above, line is green~ potential bullishness.
Price below, line is red~ potential bearishness.
This line gives us potential sentiment for any given week on any given forex market.
If you have any questions, or want access to other indicators, please message me.

Weekly OHLC with Thursday closingWeekly timeframe on Tradingview show OHLC candles from Monday to Friday. NSE has index expiry dates on Thursday instead of Friday though. This script allows to plot OHLC candles with open on every Friday of the week and close on every Thursday of the week.

Weekly and Monthly Expiry IndicatorWeekly and Monthly Expiry Indicator highlights the candle which can be useful for analysis of expiry week or month daily chart.

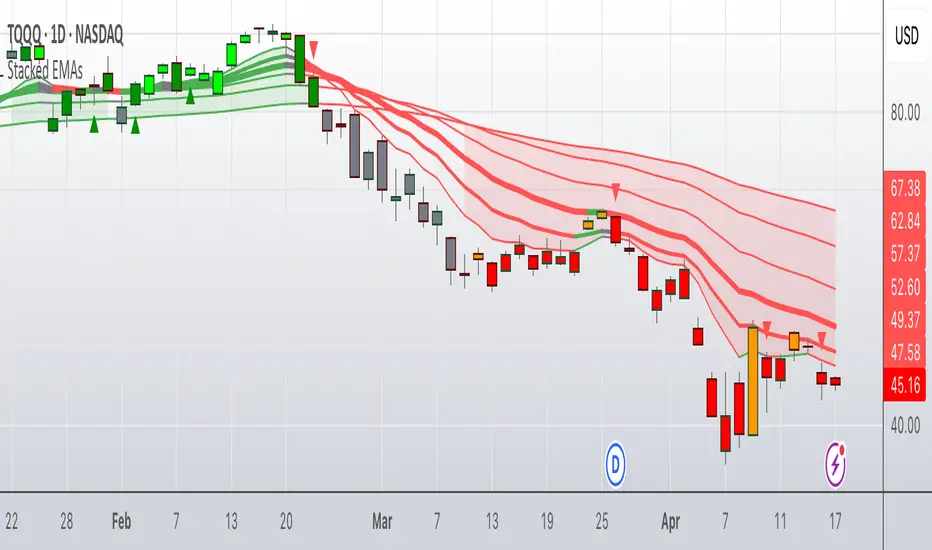
Colored Stacked EMA RibbonThis script is my interpretation of an idea from John Carter in his interview with Richard Moglen.
The idea of moving average ribbons or simply multiple moving averages has been around since moving averages were created. But many of these ideas, such as the Guppy Multiple Moving Averages focus on price closes above a moving average (or multiple moving averages).
In this version, the idea is that the EMAs are compared to each other from shortest to longest. In a completely bullish alignment, the EMAs are referred to as "stacked" in which, for example, the 8 EMA > 13 EMA, the 13 EMA > 21 EMA and so on. When the EMAs are "stacked" in a fully bullish alignment, the EMA cloud is filled green. When the EMAs are "stacked" in a fully bearish alignment, the EMA cloud is filled red.
In addition, I've colored the EMA lines themselves according to if they are rising (green) or falling (red) over a user inputted lookback. The default is "1" period, but it is adjustable. (Generally, I use "1" for the lookback.)
When the EMA lines flip from mixed (rising/falling) to all rising, a green triangle is drawn under the bar/candle. Similarly, when the EMA lines flip from mixed (falling/rising) to all falling, a red triangle is drawn over the bar/candle. This gives the user another potential entry in the context of a stacked EMA cloud. It also can give early signals for entry in a neutral cloud.
Candles/bars are colored according to the EMA cloud & EMA line status. So, for example, a bullish stacked EMA cloud (green) and all EMA lines green, will result in a bright green candle color. IF the cloud is green, but the EMA lines are mixed (red/green), this will result in a dark green candle. Similar logic applies to the bearish conditions which result in red (most bearish) or orange (still bearish) candle colors. IF the EMA cloud is neither bullishly stacked or bearishly stacked, then those candles will appear as gray (neutral).
There are many ways to use this script, but it excels in a trending market. John Carter often sets limit buys in an area near the 21D EMA in names that are trending & he wants to get in. The 13D EMA linewidth is set at 2 and the 21D EMA linewidth is set a 3 to easily identify this area. Now, you can "buy the dip" or "short the rip" within the context of a trending market (which the script identifies with green or red EMA clouds). Or you can wait for some confirmation via the green triangle (or something else like a candle stick pattern or trendline break). Remember to set stops in case price goes against you.
1 final note this is not a "magic bullet", but for a single indicator it does alot of work & personally I've found it to be very useful on multiple time frames. I do recommend combining it with volume (or a volume-based indicator).
Update #1: This updated version allows the user to adjust candle colors, forces the script to wait for bar closes on intraday charts (if conditions are met) before plotting triangles, and removes a link to YT. In addition, non-intraday charts (daily, weekly, etc) will flash a triangle intraday (if conditions are met) before updating completely at the close.
Weekly Range Bias Panel — Ace v1.6 (1st Target)Perfect, we’ll keep the script exactly as it is and just make the “user manual” super simple.
---
## 1. What this script does (one sentence)
It tells you **what kind of week we just had** (TIGHT / NORMAL / WIDE),
marks **Last Week’s High/Low + CE**,
and gives you a **simple first target idea** for this week.
---
## 2. What each panel row means
### Row 0 – Title
`WEEKLY RANGE BIAS`
> Just the header.
---
### Row 1 – “Last Week: TIGHT / NORMAL / WIDE”
It compares **last week’s range** to the **average range of the last X weeks**.
* **TIGHT**
* Last week’s range was **smaller than usual**.
* Market is “coiled”.
* Expect **expansion** – a raid of LWH or LWL is more likely.
* **WIDE**
* Last week’s range was **bigger than usual**.
* Market already “spent a lot of energy”.
* Expect **cooling / consolidation / controlled continuation**.
* **NORMAL**
* Range was about average.
* Nothing special – treat it as a standard week.
---
### Row 2 – Hunt/Build + “1st tgt”
Example text:
`HUNT (expect a raid of LWH/LWL) | 1st tgt: LWH first`
* **HUNT** (when TIGHT)
* Look for **a raid of one side of the weekly range**.
* Script tells you which side is more likely **first**:
* `1st tgt: LWH first` → bias towards **taking out last week’s high** first.
* `1st tgt: LWL first` → bias towards **taking out last week’s low** first.
* **BUILD/COOL** (when WIDE)
* Last week was huge.
* `1st tgt: CE / mean reversion` → expect price to **respect or return to CE** more, instead of running to new extremes right away.
* **NEUTRAL** (when NORMAL)
* No special edge from range size.
* Use levels mainly as **reference / targets**, not as a strong bias.
---
### Row 3 – Range numbers
Example:
`LW Range: 480.00 | Avg(6): 520.00`
* **LW Range** = last week’s high – low (in points).
* **Avg(6)** = average range of the **last 6 weeks** (you set this with `lookback`).
You don’t need to overthink this. It’s just to **see the size** quickly.
---
### Row 4 – Price vs Weekly CE
Example:
`Above Weekly CE (premium of last week)`
* **Above Weekly CE**
* Price is trading in **premium** vs last week’s middle.
* For shorts, you want **sweeps / setups above CE**.
* **Below Weekly CE**
* Price is in **discount** vs last week’s middle.
* For longs, you want **sweeps / setups below CE**.
* **At Weekly CE**
* Market is sitting near the middle of last week’s range = **no big edge** from location alone.
---
### Row 5 – Exact levels
Example:
`LWH: 25850.00 | LWL: 25200.00 | CE: 25525.00`
* Exact prices for:
* **LWH** – Last Week’s High
* **LWL** – Last Week’s Low
* **CE** – middle of that range
You can use these as **targets, alerts, and liquidity pools.**
---
## 3. The lines on the chart
If `Plot LWH / LWL / Weekly CE` is ON:
* **Grey line** at **LWH**
* **Grey line** at **LWL**
* **Brown line** at **Weekly CE**
They extend to the right, so **this whole week** you see:
* Where last week’s extremes are.
* Where last week’s mid (CE) is.
You can use them on **any timeframe** (Daily, 1H, 15M, 5M, etc).
They are always based on **weekly data**.
---
## 4. Simple trading use-case (your style)
### Step 1 – Weekly bias (Sunday night / Monday)
Look at **Row 1–2**:
* **If TIGHT + HUNT + “1st tgt: LWH first”**
* Expect **weekly expansion up**.
* Intraday you’ll watch for **longs** that aim for **LWH** as first big target.
* **If TIGHT + “1st tgt: LWL first”**
* Same idea but **down** → look for shorts towards **LWL**.
* **If WIDE + “1st tgt: CE / mean reversion”**
* Favor **mean reversion** plays:
* If above CE → bias to **shorts back to CE** (with proper intraday confirmation).
* If below CE → bias to **longs back to CE**.
* **If NORMAL**
* No special push from weekly range.
* Use LWH/LWL as **big liquidity targets**, but let your Purge/MMXM model be the main driver.
---
### Step 2 – Intraday execution (Purge / MMXM)
Use the weekly info as **context**, not a signal:
* Treat **LWH/LWL** as **big liquidity pools**.
* Treat **Weekly CE** as **mean point / magnet**.
Example combo:
1. Script says:
* `Last Week: TIGHT`
* `HUNT (expect a raid) | 1st tgt: LWH first`
2. Price is **below CE**, building a base.
3. In your killzone, you see:
* **Sweep of intraday low**,
* **Shift in structure up**,
* Return to a 15M/5M OB/FVG.
→ You now have **HTF reason to believe upside expansion is likely**,
and your **intraday trigger** tells you where to enter.
---
## 5. Alerts (optional, but powerful)
The script already has:
* `Weekly Range = TIGHT` → tells you a **coil week** just closed.
* `Weekly Range = WIDE` → tells you a **big expansion week** just closed.
* `Raid LWH` → price traded above last week’s high.
* `Raid LWL` → price traded below last week’s low.
You can set these as **heads up alerts** on Sunday / Monday so you don’t miss the context shift.
---
If you want, next step we can add a **tiny “GO / WAIT / NO-GO” line** to the panel based on:
* TIGHT vs WIDE
* your position vs CE
* and whether LWH/LWL has already been raided this week.

Weekly High/Low Weekday Stats by [M1rage]Патч: условная статистика по дню недельного экстремума
Добавлена новая функция, позволяющая строить условное распределение по дням недели.
Что нового.
Два новых параметра в настройках:
Condition: Weekly High on — зафиксировать день недели, в который сформировался недельный High.
Condition: Weekly Low on — зафиксировать день недели, в который сформировался недельный Low.
Таблица автоматически перестраивается:
Левая колонка показывает — вероятности минимума недели при выбранном дне максимума.
Правая колонка показывает — вероятности максимума недели при выбранном дне минимума.
В заголовках колонок появляется подпись формата:
Weekly Low | High=Tue
Weekly High | Low=Thu
---------------------------------------------------------------------------------------------------------------------
Patch: Conditional Statistics by Day of the Weekly Extremum
A new feature has been added that builds a conditional distribution by weekdays.
What’s new
Two new settings:
Condition: Weekly High on — fix the weekday on which the weekly High formed.
Condition: Weekly Low on — fix the weekday on which the weekly Low formed.
The table updates automatically:
Left column — probabilities of the weekly Low given the selected day of the High.
Right column — probabilities of the weekly High given the selected day of the Low.
Column headers now display labels in the format:
Weekly Low | High=Tue
Weekly High | Low=Thu
Weekly Open (Current Week Only)📘 Indicator Name: Weekly Open (Current Week Only)
📝 Description:
This indicator plots a horizontal line representing the weekly open price, visible only during the current trading week. At the beginning of each new week (based on TradingView’s weekly time segmentation), the indicator captures the open price of the first candle and draws a constant line across the chart until the week ends. Once the new week begins, the line resets and updates with the new weekly open.
🎯 How to Use – ICT Concepts Integration (Weekly Profile):
This tool is designed to complement ICT (Inner Circle Trader) trading strategies, particularly within the weekly profile framework, by offering a clear and persistent visual of the weekly open, which is a critical reference point in ICT’s market structure theory.
✅ Use Cases:
Directional Bias:
According to ICT concepts, price trading above the weekly open suggests a bullish bias for the week, while trading below it implies bearish conditions.
Traders can use the weekly open line to align their intraweek trades with higher timeframe directional bias.
Dealing Ranges:
Weekly open helps frame the weekly dealing range, especially when combined with other levels like weekly high/low or previous week’s range.
It allows traders to identify potential liquidity pools or areas where price may seek to rebalance.
Mean Reversion Entries:
Price often reverts to or reacts from the weekly open. Traders may use this as a target or entry level, particularly during Monday/Tuesday setups.
Works well in conjunction with concepts like OTE (Optimal Trade Entry) and Judas Swings.
Risk Management:
Acts as a clean and visual anchor to structure stop losses or take-profits based on weekly bias shifts.
