Outside pattern di Larry WilliamsOggi condivido con voi questo fantastico pattern, trovato sul libro "I segreti del trading di breve termine", che potete inserire anche voi sui vostri grafici cercando tra gli indicatori "Outside pattern Larry Williams {lucaBono}". Secondo quanto descritto da Larry, contrariamente a come si pensa, quando troviamo sul grafico un outside con chiusura oltre il massimo o minimo del giorno precedente e la successiva apertura sopra o sotto la chiusura (dipende se outside positivo o negativo) abbiamo un segnale di ingresso long se l'outside è negativo e short se l'outside è positivo.
In questo script ho fatto in modo che quando le condizioni sono soddisfatte compare, sulla candela in cui effettuare l'ingresso, una freccia con direzione verso l'ingresso che si deve effettuare e la scritta "outsideL" per indicare ingressi long e la scritta "OutsideS" per gli ingressi short. Lui utilizza questo pattern sull'indice S&P500 e secondo le sue statistiche ha una percentuale di successo dell'85%. Mostrando il grafico del FTSEMIB possiamo notare che entrando in prossimità dell'apertura, quindi nel momento in cui vediamo spuntare l'indicazione sul grafico, abbiamo buone probabilità di successo nel breve termine, inoltre può dare un buon punto di partenza per un trade da tenere tramite trailing stop spostandosi su timeframe più bassi dopo l'ingresso.Generalmente come possiamo notare dal grafico quando vediamo comparire il segnale vuol dire che siamo vicini ad una zona di massimo o minimo di breve.
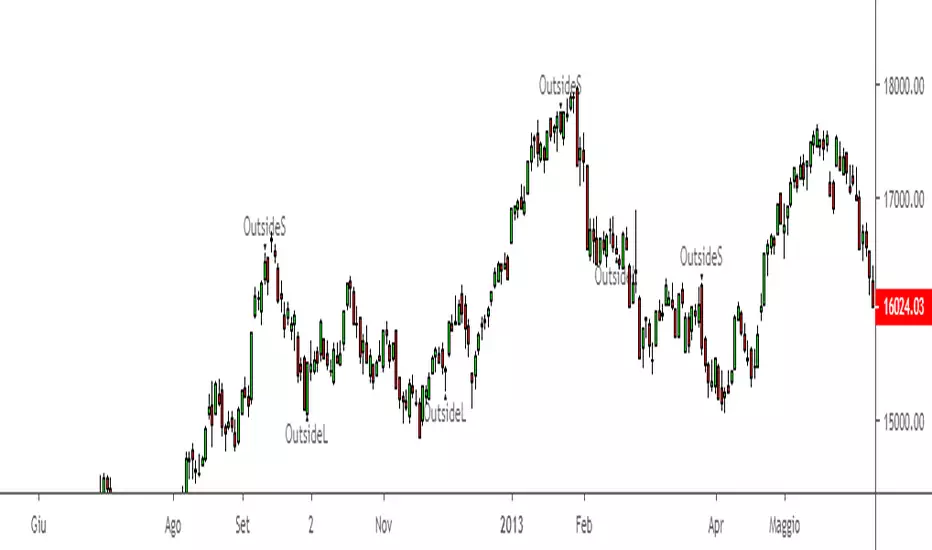
Today I share with you this fantastic pattern, found on the book "The secrets of short-term trading", which you can also insert on your charts. As described by Larry, contrary to how we think, when we find on the graph an outside with closing beyond the maximum or minimum of the previous day and the subsequent opening above or below the closure (depends on whether positive or negative outside) we have an input signal long if the outside is negative and short if the outside is positive.
In this script I made sure that when the conditions are met, an arrow appears with the direction of the entrance on the candle where you want to enter and the word "outsideL" to indicate long inputs and the word " OutsideS "for short entries. He used (or uses, I don't know) this pattern on the S & P500 index and according to his statistics has an 85% success rate. Showing the graph of the FTSEMIB we can see that entering near the opening, so when we see the indication on the graph tick, we have a good chance of success in the short term, also can give a good starting point for a trade to be held by trailing stop moving to lower timeframe after entry.Generally as we can see from the graph when we see the signal appear, it means that we are close to a zone of maximum or minimum of short.
Search in scripts for "williams"
Pretty Williams FractalsThis script adds Williams Fractals that are more visually pleasing than TradingView's built-in version.

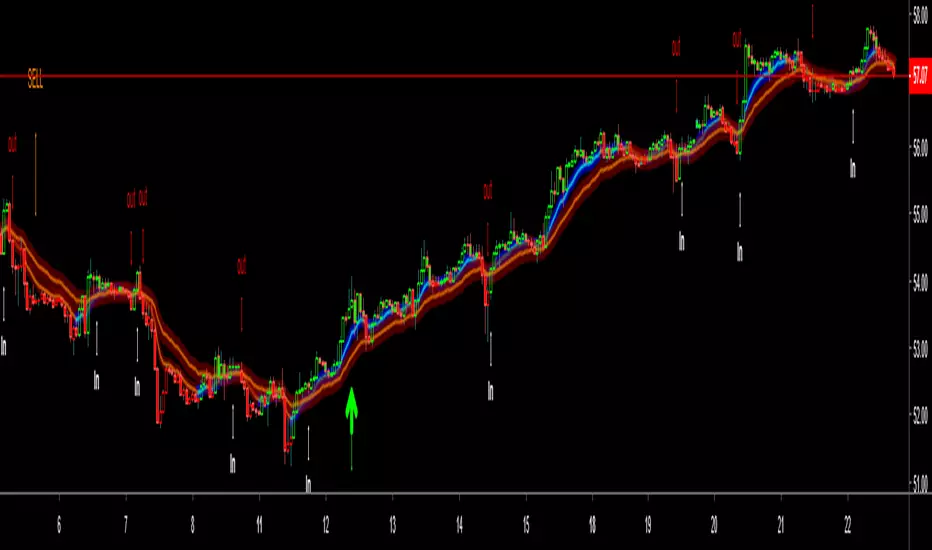
PpSignal Williams %R SmoothWe have smoothed out and modified Williams' Percent R to make it a better and more usable trading vehicle.
in blu you can see the smooth w%, yellow normal w%.

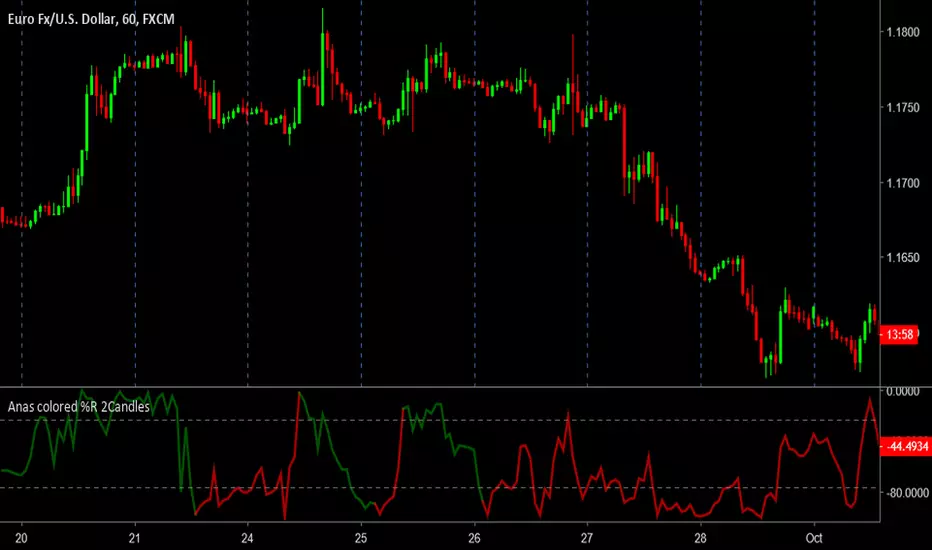
Anas Williams %R 2 candles confirmation from Larry R. Williams description to confirm trend continuity by waiting for candles after crossing the upper and lower bands
if the color changed green this means uptrend probability take long positions and if the color changed red this means down trend probability and take short positions
if the oscillator crosses the band and color not changed and bounced back bellow 50 % this is signal as the oscillator line color
if green and bounced from lower band buy , if red and bounced from upper band sell .
2xIchimoku Cloud + 4xMA + Williams FractalUpdated version of the previously published multi-indicator which includes
4x Moving Averages
2x Ichimoku Clouds
Bill Williams Fractals
Changes:
-Toggle switches for each indicator on input tab for easy on/off
-MA Type Selector (EMA/SMA/WMA/VWMA)
-Various default style change
Many thanks to both redwraith and jedireza for helping me work out the MA section
www.tradingview.com
www.tradingview.com
Next improvements: Ichimoku settings
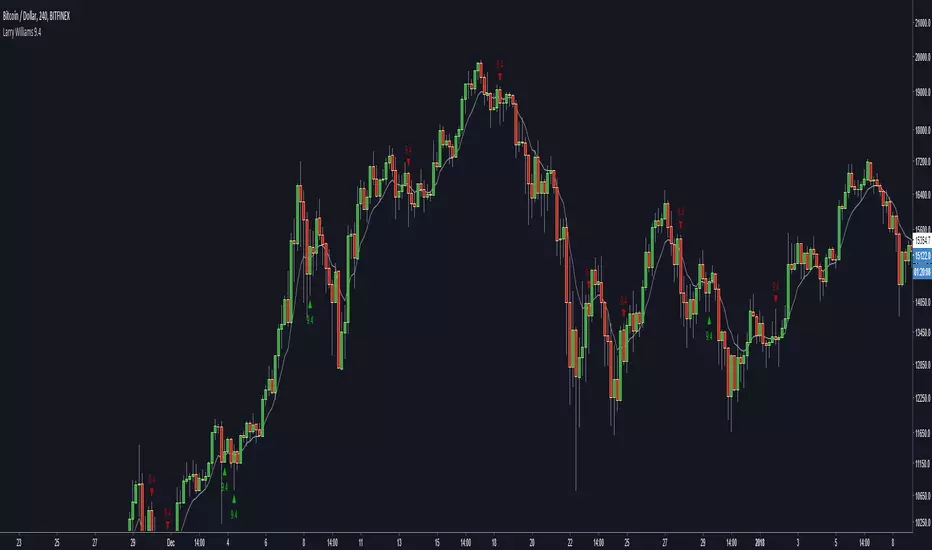
Larry Williams 9.4 [zauoyds]This script was made to find in real time the setup 9.4, made by trader Larry Williams .
This indicator just help to find the entries described by setup 9.4.
You need to know the setup and use this indicador as helper.
The indicator shows when the 9.4 is configured. The trigger to go long is the next candle high is higher than previus candle high. To go short, the low needs to be lower than previus low.
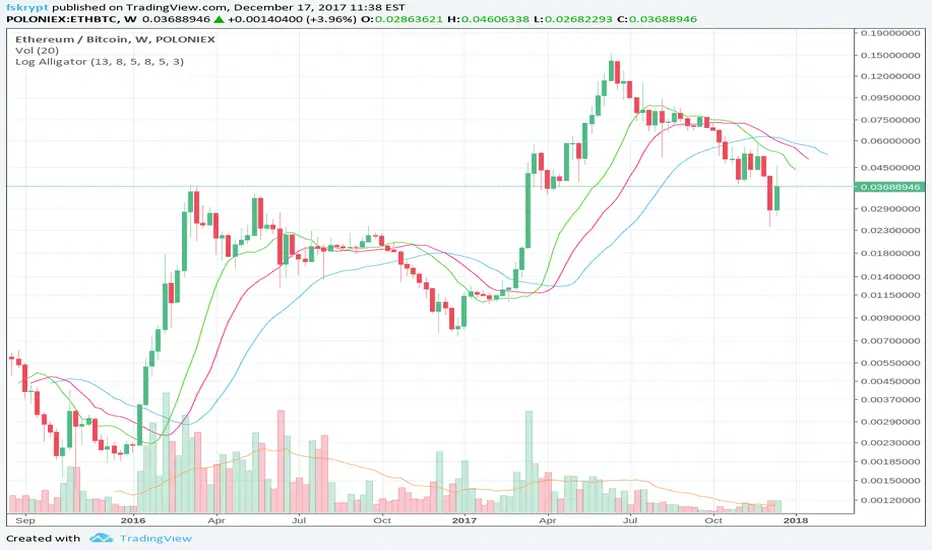
Log-space Williams AlligatorMake Williams Alligator usable for looking at weekly and high-volatility crypto charts.
The built-in indicator may have some problems with these charts, as in example below:
True Williams Alligator (Timeframe Multiplier)Modified version of the true alligator indicator (ie SMMA) that features a timeframe multiplier so that you can monitor the elliott wave of higher timeframes. (See original "True Williams Alligator" for more details.)
Note: First script submission. Didn't mean to use this chart. Also this is a duplicate post -- oops.

True Williams Alligator (SMMA)The built-in implementation of the alligator is incorrect. It uses SMA with altered input parameters to approximate the true alligator indicator.
The alligator was created with a supercomputer to model the elliott wave - it's very apart from other MA techniques. The built-in approximation (and similar techniques) and the true alligator yield very different conclusions. Hence the need for this, a true and exact implementation of "The Mighty Alligator" (Bill Williams, Trading Chaos 1, New Trading Dimensions, Trading Chaos 2).
Note: First script submission. Didn't mean to use this chart. Ugly and messy. Oops.

Market Structure RangesI have written a script for determining the BIAS.
It uses fractals of 3 for the highs and lows.
It works as follows:
If a range high is broken (!!!candelclose!!!), the last fractal low is selected as the new low point. The Rangelow is determined from this low point.
If a fractal high now occurs, the range high is set at this point.
This Range between the low range and high range is called "Dealing range" , this is divided at the centre - into premium and discount.
The range stays the same, until we see a body close outside this range!
The same applies to a short scenario, only in reverse.
In the indicator, the higher timeframe is selected, which determines the input for the dealing range. Then the dealing range from the higher timeframe is displayed in each timeframe that we want to use for our trades.
The indicator should be used to trade with the trend: for example, the last higher timeframe break is bullish (displayed in the table) -- called kMS
and on the other hand that we only want to take tades that are in the lower part of the range, i.e. in the discount area for buy trades.
This indicator therefore serves as a filter for the higher timeframe trend and higher timeframe premium/discount ranges.

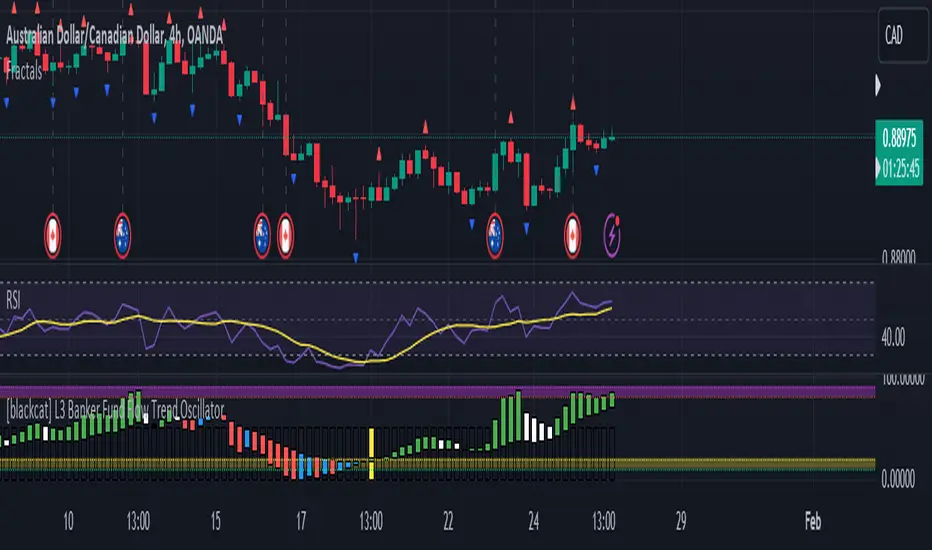
Obbar
in case you don’t know what fractal is fractal is a way of a trading by finding critical price levels those critical price levels formed every five candle The middle candle is the critical one, The high or low of this candle is considered support or resistant at the current moment.
The current implementation of fractals indicators across many platforms, tradingview one of them not that Great although it undefined the fractals however at least the hard bar for your brain to process you need to link these factors together to form a trend line , has no directions for the trend and for sure it doesn’t show you the trigger candle.
I have been working for the best three years in a new way to trade fractals A new ecosystem that has it all, support and resistance level showing the trend and also show you the trigger candle where are you can but your buy or sell order. and I call it Obbar.
Identifying the trade:
now let’s see how you can trade this indicator, first let’s identify the trend because you know trend is your friend, and since fractal does not tell you the trend, Will use OBV for this task by applying fractals concepts to OBV we can easily see in which level buyer or seller appeal, since that level is important we should also see a huge volume on those levels, and by applying this concepts we have three area bluish The green one where you should only look for buy signal, a bearish area the red one where you should only look for sell signal, indecision area the blue where are you should just ignore the market.
The trigger candle:
it’s yellow when it’s buying signal don’t forget the trend of course so if the trend is bluish and you have yellow candle The trigger candle will be buying candle.
it’s red when it’s a sell signal added to the trend you should only sell when the trend is bearish of course.
hope this indicator improve your fractal trading, have fun

MarketStructureBreakThe Script is called a MSB/MarketStructureBreak
This script is meant to teach you on how the 2 candles are responsible for the breakout and shows you patience
The best way to use this indicator is by putting the "SMA 50 SMA 200" settings helps filter out the false calls
As well, if you use this in a bigger time frame like 1 HOUR, 4 HOUR, Daily, and Weekly it will call the best buy and sell Signals


FractalsMLCombine 2 Fractals into one indicator with default left and right bars are 6 and 24 respectively.
It's for Forex Traders Vietnam group.


Fractals V9 ModifiedSo taking Ricardo Santos script for fractals V9 -I change the time function of the high TF fractal to non repainting one
adding daily fib levels
This hybrid seems to look nice . I have to admit that all credit to Ricardo Santos for his exelent script.
thi work it hybrid work and not so much original work....
The main improvment is the signals which are not reapinting as we remove security from that.
Security function exist for daily fib but it has nothing to do wih signal generation so i did not touch it


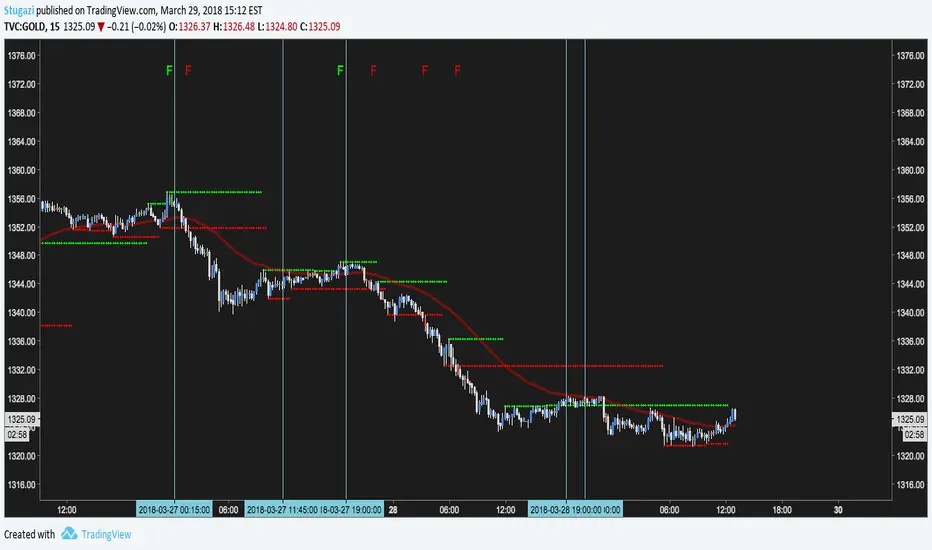
Fractal Support ResistanceTroubleshooting this script.
The vertical lines are when the alerts fired in TradingView. Along the top a green F is LONG signal and red F is SHORT. Signals fire only after CLOSING for two consecutive bars above or below a fractal. Also there is a min delay of 12 bars between signals.
The alerts are configured identical to the F character plots. Not sure why the alerts are randomly firing. =(