Search in scripts for "墨尔本胜利vs墨尔本城"

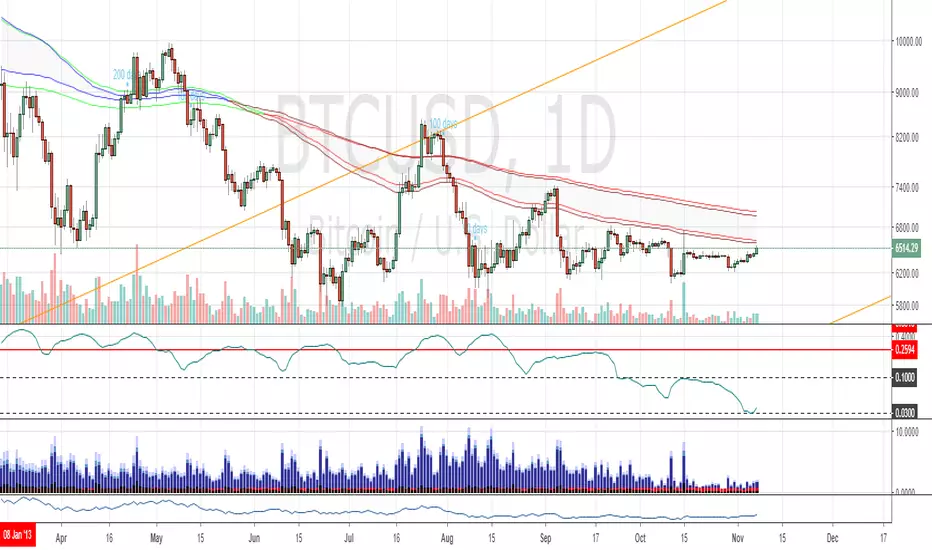
200/100 vs 190/80 EMA [jarederaj]Track the 200/100 EMA cross Vs the 180/90 EMA cross. Also, see the dates when these periods start on the chart.
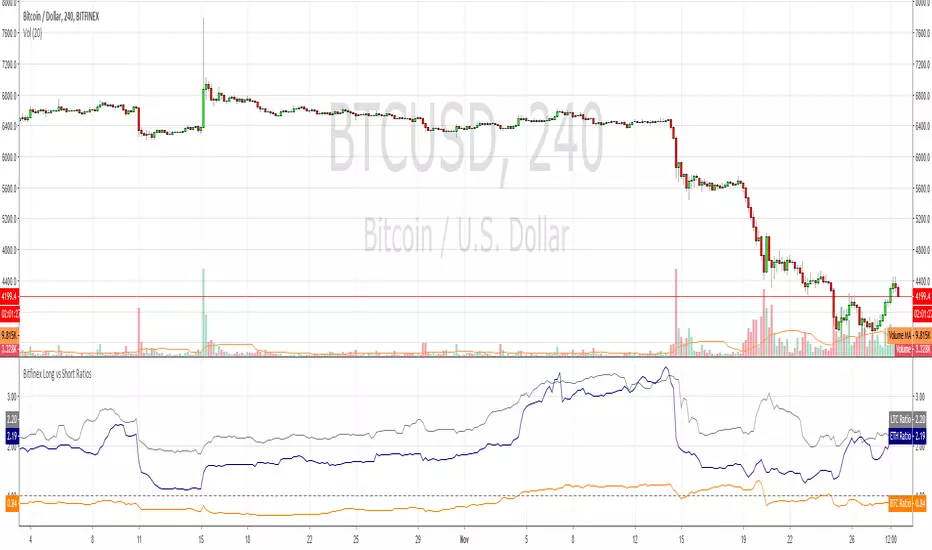
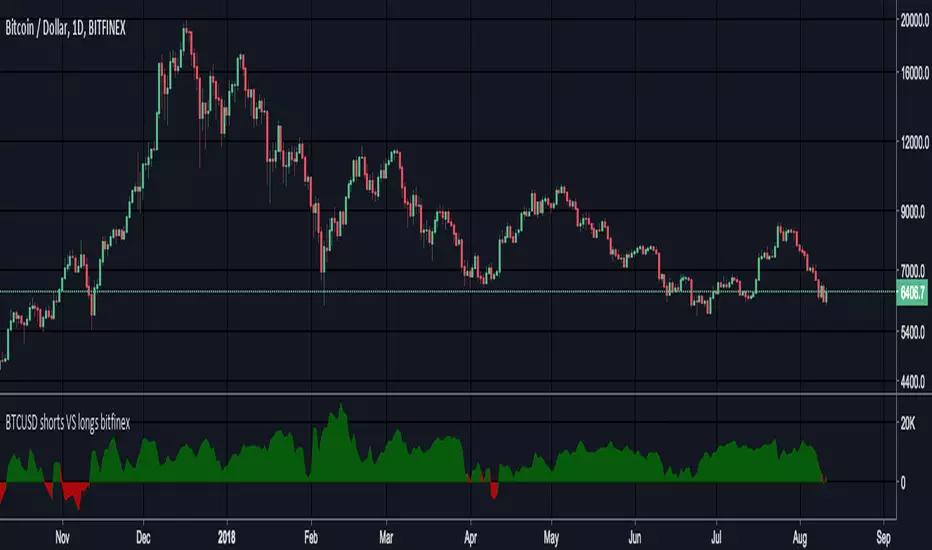
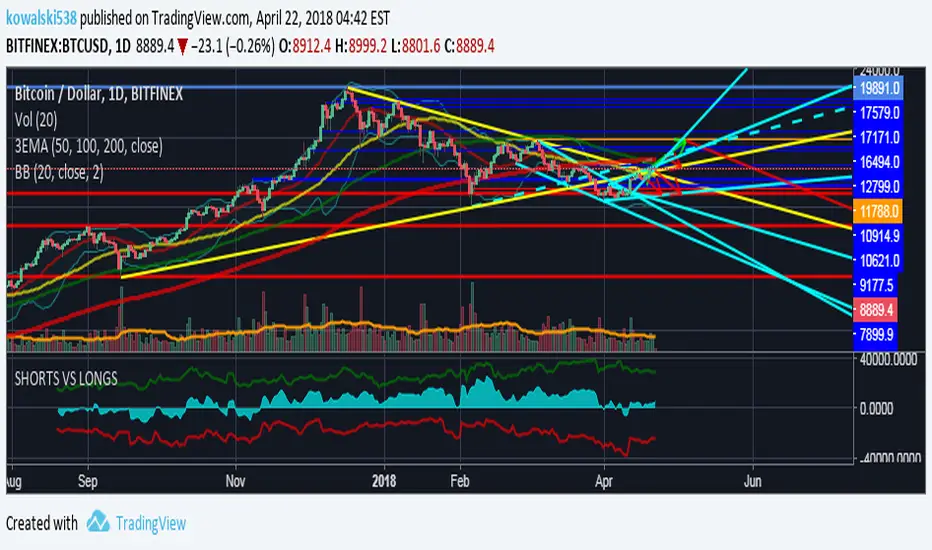
Bitfinex Long vs Short RatiosWas impressed with the 'Longs vs Shorts Ratio' idea from the tweet below so I coded an indicator, enjoy.
twitter.com
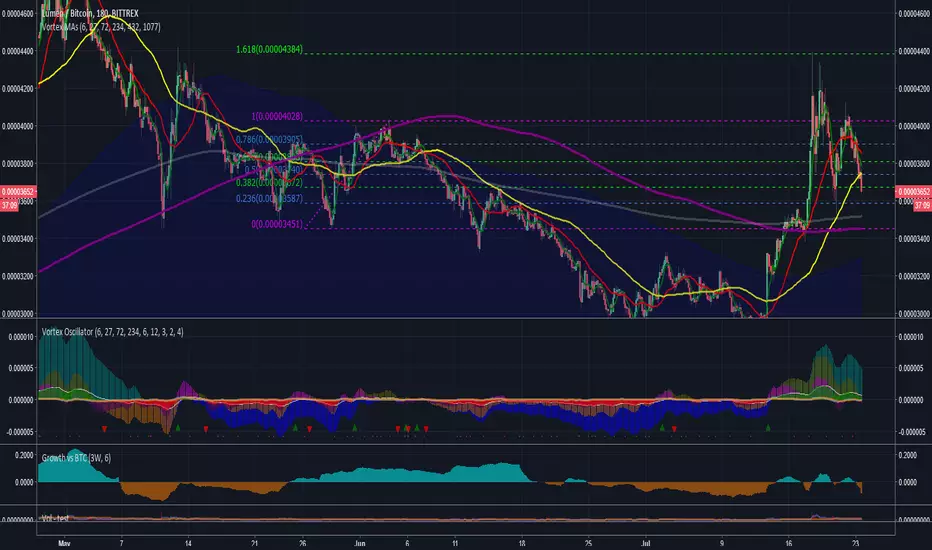
Compare - Oscillator vs BTC momentumI've made a simple indicator to compare the momentum of a trading pair against the momentum of BTC to the dollar. I use it to see how a pair is affected by BTC's momentum... I wouldnt use it to trade off alone, but it can be a useful tool alongside other indicators.
The time range can be adjusted, but I wouldnt reccomend setting it to anything over 12M, or under 1W.... as I'm not sure if it would work.
Any feedback is welcome!
This is an idea I had after looking at a wonderful visualisation made by BarclayJames, link below:
www.tradingview.com
비트코인 한국 프리미엄 캔들 차트 (Bithumb vs Bitfinex) by 호재박스 슈퍼스타지표명: 비트코인 한국 프리미엄 캔들 차트 (Bithumb vs Bitfinex)
제작자: 호재박스 슈퍼스타
홈페이지: hozaebox.com


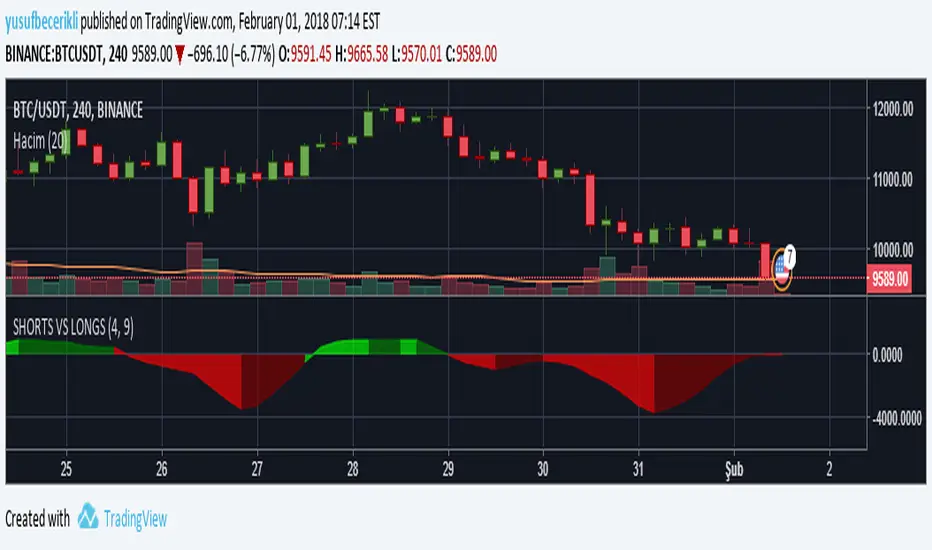
BTCUSD long vs short ratio+rsiJust a script I want to share with friends on a discord
orange/green line : longs vs short ratio (100 = only longs, 0 = only shorts)
purple line : RSI of (longs-shorts)

Bitcoin Exchanges Premium (Incl Int & GBTC) vs GdaxShows the exchange premiums internationally (Hong Kong, Luxembourg, Korea, Japan, China) vs Gdax. Also includes GBTC Trust price (adjusted).
Index Vs Futures v4.0 (dashed edition)Generalized script of
Originally designed for bitcoin, but can be used to compare between futures and index (or any two symbol expressions).
Conventions:
- green background := futures deviates 'way above' index
- red background := futures deviates 'way below' index

VS Score [SpiritualHealer117]An experimental indicator that uses historical prices and readings of technical indicators to give the probability that stock and crypto prices will be in a certain range on the next close. This indicator may be helpful for options traders or for traders who want to see the probability of a move.
It classifies returns into five categories:
Extreme Rise - Over 2 standard deviations above normal returns
Rise - Between 0.5 standard deviations and 2 standard deviations above normal returns
Flat - Falling in the range of +/- 0.5 standard deviations of normal returns
Fall - Between 0.5 standard deviations and 2 standard deviations below normal returns
Extreme Fall - Over 2 standard deviations below normal returns
It is an adaptive probability model, which trains on the previous 1000 data points, and is calculated by creating probability vectors for the current reading of the PPO, MA, volume histogram, and previous return, and combining them into one probability vector.


Advanced Correlation Monitor📊 Advanced Correlation Monitor - Pine Script v6
🎯 What does this indicator do?
Monitors real-time correlations between 13 different asset pairs and alerts you when historically strong correlations break, indicating potential trading opportunities or changes in market dynamics.
🚀 Key Features
✨ Multi-Market Monitoring
7 Forex Pairs (GBPUSD/DXY, EURUSD/GBPUSD, etc.)
6 Index/Stock Pairs (SPY/S&P500, DAX/NASDAQ, TSLA/NVDA, etc.)
Fully configurable - change any pair from inputs
📈 Dual Correlation Analysis
Long Period (90 bars): Identifies historically strong correlations
Short Period (6 bars): Detects recent breakdowns
Pearson Correlation using Pine Script v6 native functions
🎨 Intuitive Visualization
Real-time table with 6 information columns
Color coding: Green (correlated), Red (broken), Gray (normal)
Visual states: 🟢 OK, 🔴 BROKEN, ⚫ NORMAL
🚨 Smart Alert System
Only alerts previously correlated pairs (>80% historical)
Detects breakdowns when short correlation <80%
Consolidated alert with all affected pairs
🛠️ Flexible Configuration
Adjustable Parameters:
📅 Periods: Long (30-500), Short (2-50)
🎯 Threshold: 50%-99% (default 80%)
🎨 Table: Configurable position and size
📊 Symbols: All pairs are configurable
Default Pairs:
FOREX: INDICES/STOCKS:
- GBPUSD vs DXY • SPY vs S&P500
- EURUSD vs GBPUSD • DAX vs S&P500
- EURUSD vs DXY • DAX vs NASDAQ
- USDCHF vs DXY • TSLA vs NVDA
- GBPUSD vs USDCHF • MSFT vs NVDA
- EURUSD vs USDCHF • AAPL vs NVDA
- EURUSD vs EURCAD
💡 Practical Use Cases
🔄 Pairs Trading
Detects when strong correlations break for:
Statistical arbitrage
Mean reversion trading
Divergence opportunities
🛡️ Risk Management
Identifies when "safe" assets start moving independently:
Portfolio diversification
Smart hedging
Regime change detection
📊 Market Analysis
Understand underlying market structure:
Forex/DXY correlations
Tech sector rotation
Regional market disconnection
🎓 Results Interpretation
Reading Example:
EURUSD vs DXY: -98.57% → -98.27% | 🟢 OK
└─ Perfect negative correlation maintained (EUR rises when DXY falls)
TSLA vs NVDA: 78.12% → 0% | ⚫ NORMAL
└─ Lost tech correlation (divergence opportunity)
Trading Signals:
🟢 → 🔴: Broken correlation = Possible opportunity
Large difference: Indicates correlation tension
Multiple breaks: Market regime change

Super EMA PrismThis script implements the Binary Trade Logic (BTL) algorithm to calculate two distinct scores that range from 0 to 7. One score is calculated assigning a power of 2 weight to the positive sign of 3 Phi^3 distant Moving Average (MA) slopes. The other score is calculated assigning a power of 2 weight to the sign of the difference between the price and the value of 3 Phi^3 distant Moving Average (MA).
For the first score, hereafter called as the angle score (AS), the largest MA slope positive sign receives weight 4, the middle length MA slope positive sign receives weight 2 and the shortest MA slope positive sign receives weight 1. The positive sign of an MA is defined as 1 if the slope of the MA is positive and 0, otherwise. Therefore, for MAs 305, 72 and 17, if slope(MA305) > 0, slope(MA72) < 0 and slope(MA17) > 0, then score will be 4*1 + 2*0 + 1*1 = 5. Up to my knowledge, this score was first proposed by Bo Williams and named by him as Prisma.
For the second score, hereafter called as the value score (VS), if the price > largest MA, it receives weight 4. If the price > the middle length MA, it receives weight 2 and if the price > the the shortest MA, it receives weight 1. Therefore, for MAs 305, 72 and 17, if price < MA305, price > MA72 and price > MA17, then score will be 4*0 + 2*1 + 1*1 = 3. Up to my knowledge, this score was first proposed by Bo Williams and named by him as Prisma.
Both AS and VS are calculated for Phi^3 lengths (610, 144, 34) and for Phi^3/2 lengths (305, 72, 17). The scores of the same kind calculated for each set of length are combined multiplying the Phi^3 length score by 10 and adding with with the Phi^3/2 score, therefore providing a 2 digit score ranging from 0 to 77. For instance, if we have AS(610, 144, 34) = 7 and AS(305, 72, 17) = 5, we have AS=75. At the same time, if we have VS(610, 144, 34) = 6 and VS(305, 72, 17) = 4, we have VS=64.
VS score is plotted by default in black, but it can be on white for dark themes. AS is plotted with the color of the longest MA used.
Chart background is colored according to the range of values for AS and VS, checked in the following order:
if AS >= 13 and VS <= 13 then back color = red
if AS >= 13 or VS <= 13 then back color = orange
if AS >= 64 and VS >= 64 then back color = green
if AS >= 64 or VS >= 64 then back color = blue
otherwise back color = none (white o black)

Cross-Correlation Lead/Lag AnalyzerCross-Correlation Lead/Lag Analyzer (XCorr)
Discover which instrument moves first with advanced cross-correlation analysis.
This indicator analyzes the lead/lag relationship between any two financial instruments using rolling cross-correlation at multiple time offsets. Perfect for pairs trading, market timing, and understanding inter-market relationships.
Key Features:
Universal compatibility - Works with any two symbols (stocks, futures, forex, crypto, commodities)
Multi-timeframe analysis - Automatically adjusts lag periods based on your chart timeframe
Real-time correlation table - Shows current correlation values for all lag scenarios
Visual lead/lag detection - Color-coded plots make it easy to spot which instrument leads
Smart "Best" indicator - Automatically identifies the strongest relationship
How to Use:
Set your symbols in the indicator settings (default: NQ1! vs RTY1!)
Adjust correlation length (default: 20 periods for smooth but responsive analysis)
Watch the colored lines:
• Red/Orange: Symbol 2 leads Symbol 1 by 1-2 periods
• Blue: Instruments move simultaneously
• Green/Purple: Symbol 1 leads Symbol 2 by 1-2 periods
Check the table for exact correlation values and the "Best" relationship
Interpreting Results:
Correlation > 0.7: Strong positive relationship
Correlation 0.3-0.7: Moderate relationship
Correlation < 0.3: Weak/no relationship
Highest line indicates the optimal timing relationship
Popular Use Cases:
Index Futures : NQ vs ES, RTY vs IWM
Sector Rotation : XLF vs XLK, QQQ vs SPY
Commodities : GC vs SI, CL vs NG
Currency Pairs : EURUSD vs GBPUSD
Crypto : BTC vs ETH correlation analysis
Technical Notes:
Cross-correlation measures linear relationships between two time series at different time lags. This implementation uses Pearson correlation with adjustable periods, calculating correlations from -2 to +2 period offsets to detect leading/lagging behavior.
Perfect for quantitative analysts, pairs traders, and anyone studying inter-market relationships.

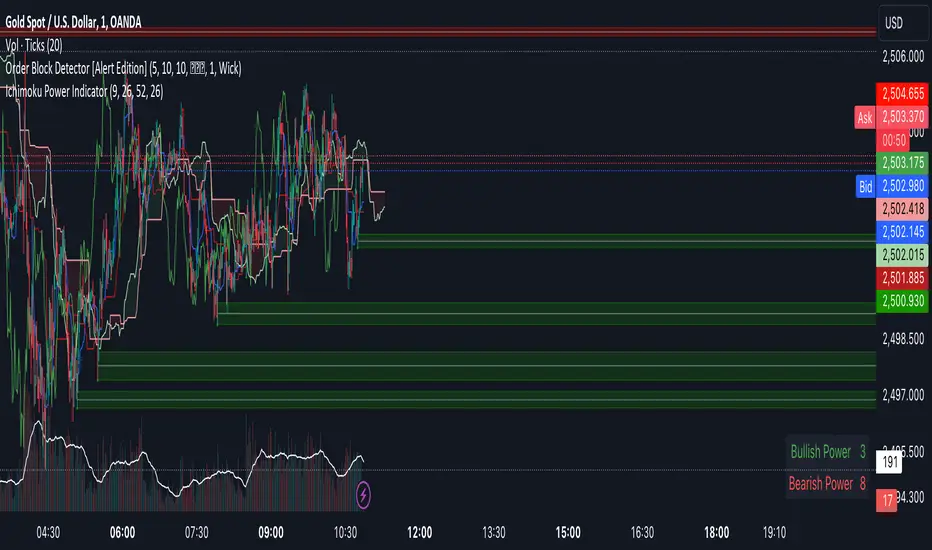
Ichimoku Power Indicator# Ichimoku Power Indicator
## Overview
The Ichimoku Power Indicator is an advanced tool that combines the traditional Ichimoku Cloud system with a unique power ranking mechanism. This indicator provides traders with a comprehensive view of market trends and potential reversal points, all while quantifying the strength of bullish and bearish signals.
## Key Features
1. **Full Ichimoku Cloud Visualization:** Displays all components of the Ichimoku Cloud system, including Conversion Line (Tenkan-sen), Base Line (Kijun-sen), Leading Span A and B (Kumo), and Lagging Span (Chikou Span).
2. **Power Ranking System:** Calculates and displays a bullish and bearish power score based on 11 different Ichimoku-derived conditions.
3. **Real-time Updates:** Power scores are updated in real-time as market conditions change.
4. **Easy-to-Read Display:** A clear, color-coded table shows the current bullish and bearish power scores.
5. **Customizable Parameters:** Allows adjustment of key Ichimoku settings to suit different trading styles and timeframes.
## How It Works
The indicator evaluates 11 different conditions derived from Ichimoku Cloud components:
1. Cloud color
2. Price position relative to the cloud
3. Tenkan-sen vs Kijun-sen
4. Price vs Tenkan-sen
5. Price vs Kijun-sen
6. Tenkan-sen vs Cloud
7. Kijun-sen vs Cloud
8. Chikou Span vs Cloud
9. Chikou Span vs Tenkan-sen
10. Chikou Span vs Kijun-sen
11. Chikou Span vs Price
Each bullish condition adds a point to the bullish power score, while each bearish condition adds a point to the bearish power score. The maximum score for each is 11.
## Interpretation
- Higher bullish scores suggest stronger upward trends or potential bullish reversals.
- Higher bearish scores indicate stronger downward trends or potential bearish reversals.
- When scores are close, it may indicate a period of consolidation or uncertainty.
## Use Cases
- Trend Confirmation: Use in conjunction with price action to confirm the strength of current trends.
- Reversal Detection: Watch for changes in power scores as early indicators of potential trend reversals.
- Entry and Exit Signals: High power scores can be used to identify optimal entry or exit points.
- Market Analysis: Gain a quick overview of market conditions across multiple assets or timeframes.
## Note
This indicator is designed to complement your existing trading strategy. Always use it in conjunction with other forms of analysis and proper risk management techniques.
Experiment with different timeframes and settings to find the configuration that best suits your trading style and the assets you trade.
Happy trading!
Price Divergence IndicatorThis Price Divergence Indicator indicator modifies the standard Divergence Indicator to look for price divergences between the current chart and any other selected TradingView chart.
The thesis that this indicator is built upon:
Prices on assets or indices that are normally correlated move in lock step. Where there are deviations between the confirmed highs or lows of two assets or indices it is likely that they will "catch up" in the near future.
By default it will load the price data for the SPX and look for price divergences on the current chart timeframe. Any TradingView Symbol can be selected as the 'Comparison Source' and any timeframe. Some of the options I've been trying out include:
SPX vs NDQ
XAO vs SPX
UK100 vs NDQM
MSFT vs NDQM
GOOG vs NDQM
AMZN vs MSFT
BTC vs ETH
BTC vs NDQ
BTC vs DXY
I've found looking for divergences on a longer timeframe can be useful and don't expect any meaningful results if you set it to shorter than chart timeframes.
Alerts can be created based on any of the divergences and the 'Backtest Buy Signal' can be used to send notification to a backtester (bull = 2, hidden bull = 1, neutral = 0, hidden bear = -1, bear = -2), this is plotted to display.none, so enable it in Settings - Style and disable all other plots to see it.
Divergences are measured between the CONFIRMED peaks of the two charts. The confirmation timeframe is set using 'Pivot Lookback Right'. The lower the lookback the quicker the signal and the more likely it is to not have hit an actual peak, a higher lookback will give a much more dependable signal but the move may be finished by the time the alert actually fires. The "Plot When Alerts Fire" option should give you an idea (top and bottom triangles) of what to expect, but you should watch bar replays to understand how your setting will impact when alerts are created and potential false positives.

MACD Overlay v1 [JopAlgo]Meet the MACD you can trade directly from the chart.
MACD Overlay v1 doesn’t just plot an oscillator somewhere below—
it puts value, momentum, and participation on your candles, and it refuses to fire inside chop.
When a triangle prints, it’s because energy released (expansion), not because the chart looked cute.
What it is:
An execution-ready MACD overlay with phase gating (Expansion-Only), participation gating (Weakness-Lite), and one-click Classic vs VW-MACD Compare—all adaptive, with minimal inputs.
What’s in v1 (feature set)
Overlay ribbon on price: Fast/Slow MACD value rendered as a price-level ribbon with contextual fill and optional candle tint.
Dual value model: Classic MA-MACD (EMA/SMA) and VW-MACD (Rolling VWAP fast/slow).
Compare mode: A/B Classic vs VW-MACD with a VW ghost ribbon.
Weakness-Lite (1-bar, adaptive): Gates/fades low-participation crosses using
RVOL deficit, Effort-vs-Result failure, and over-extension vs value/ATR (Strict adds wick pressure).
Expansion-Only (Impulse/Squeeze): Triangles print only when a cross coincides with a true-range burst and a histogram-slope ignition out of compression.
Signal hygiene: ±1-bar proximity around crosses, slope awareness, 2-bar debounce.
Explainable filtering: Tiny gray dots show crosses that were intentionally filtered (weak and/or no expansion).
How to use:
Use defaults: Mode Classic, Gate by Weakness ON, Expansion-Only ON, Sensitivity Auto.
Read signals fast:
Solid triangle = cross + expansion confirmed (+ not weak if gate is ON).
Faded triangle = cross + expansion but weak participation (visible only when gate is OFF).
Gray dot = there was a cross, but it was filtered (no genuine expansion or weak & gated).
Validate quickly: Flip Compare to check VW-MACD agreement. Classic + VW alignment usually improves confidence.
Why overlay > sub-pane oscillator
You see where the cross occurs: relative to value, local structure, and S/R, right on price.
The ribbon exposes regime shifts; tint hints expansion vs contraction at a glance.
Execution becomes more context-aware and less “signal-in-a-vacuum.”
Signals & visuals
Triangles (solid): MACD crossed Signal and market showed expansion out of compression; if Gate by Weakness is ON, triangle prints only with acceptable participation.
Triangles (faded): Same as above but weak (shown only when you turn the gate OFF).
Gray dots: Crosses that were filtered (no expansion and/or Weakness gate).
Ribbon: Fast vs Slow value (Classic or VW, according to Mode). Fill and candle tint reflect expansion/contraction.
Inputs
Calculation Mode: Classic | VW | Compare
VW uses Rolling VWAP fast/slow.
Compare: Classic is primary; VW shows as a ghost ribbon for A/B checks.
Gate triangles by Weakness: ON/OFF
Uses RVOL, Effort-vs-Result, extension vs value/ATR (Strict adds wick-pressure).
Sensitivity: Off / Auto / Strict (default Auto).
Expansion-Only (Impulse/Squeeze): ON/OFF
Requires compression → release: tight ribbon + flat momentum, then TR/ATR burst with hist slope flip / cross proximity.
Display: Ribbon / Candle Tint / Weakness Markers.
Advanced (optional): Evaluate Weakness only near signals, Channel (k × |MACD|), Style Preset.
No numeric thresholds to tune—all filters self-calibrate from rolling stats.
Best practices
4H crypto: Defaults are strong—Auto, Gate ON, Expansion-Only ON.
Clean trends: If you feel you miss some tidy resumptions, briefly toggle Expansion-Only OFF.
Choppy regimes: Set Sensitivity → Strict to cut more noise without adding lag.
Confirmation: Use Compare; Classic + VW alignment typically yields better follow-through.
Alerts
MACD Signal Cross Up/Down — execution-grade (use Once per bar close).
Weakness-Lite Flag — optional context alert to help audit filtered crosses.
Attribution & License
Attribution: Based on the algorithmic concept of TradingView’s built-in MACD (fast MA – slow MA, signal, histogram).
No original TradingView source code is redistributed; overlay rendering, VW-MACD, Weakness-Lite, Expansion-Only, gating visuals, and UX are new work.
License: MPL-2.0. Educational purposes only—not financial advice.
