ORB_RDORB_RD - Opening Range Box (Ryan DeBraal)
This indicator automatically draws a high/low box for the first portion of
each trading day, automatically stepping the range window from 15, 30, 45,
up to 60 minutes after the session starts. The box updates live as the range
forms, then optionally extends across the rest of the session.
FEATURES
-----------------------------------------------------------------------------
• Opening Range Detection
- Automatically ladders the range window: 0–15, 0–30, 0–45, 0–60 minutes
- Automatic reset at each new trading day
- Live high/low updates while inside the 0–60 minute window
• Auto-Drawing Range Box
- Draws a dynamic rectangle as the range forms
- Top and bottom update with every new high/low
- Extends sideways in real time during formation
- Optional full-day extension after the 60-minute range finalizes
• Customizable Visuals
- Adjustable fill transparency
- Mild green tint by default for clarity
PURPOSE
-----------------------------------------------------------------------------
This tool highlights the evolving opening range, a widely used intraday
reference for breakout traders, mean-reversion setups, and session structure
analysis. Ideal for:
• Identifying early support and resistance
• Framing breakout and pullback decisions
• Tracking intraday trend bias after the morning range
Search in scripts for "机械革命无界15+时不时闪屏"

Multi-Tool VWAP + EMAs (Multi-Timeframe) + Key LevelsDescription
This indicator combines several commonly used technical analysis tools into a single script, especially useful for traders using the free version of TradingView or anyone looking to reduce the number of indicators on their chart.
The goal is to provide clear visual references for trend, structure, and key levels—without generating buy/sell signals or automated trading functions.
Included Features
1. VWAP (session-anchored)
Source: HLC3
Purple line, thickness 2
Useful as a reference for daily institutional average price.
2. EMAs of the current timeframe
EMA 200 (red, thickness 3)
EMA 9 (green, thickness 1)
These EMAs help visualize long-term trend and short-term momentum.
3. Dynamic EMAs (MTF – Multi-Timeframe)
The indicator displays the 200 EMA from higher timeframes as dynamic horizontal levels:
5 minutes
15 minutes
30 minutes
1 hour
4 hours
1 day
Each level includes a descriptive label such as “15 min EMA 200”.
These EMAs serve as reference points for potential support/resistance areas coming from higher timeframes.
4. Automatic Key Levels
The indicator plots several important price levels:
Previous day:
PDH (Previous Day High)
PDL (Previous Day Low)
Previous Day 50% Fibonacci level
Pre-market (04:00–09:30 exchange time):
PMH (Pre-Market High)
PML (Pre-Market Low)
Current session:
Open (session opening price)
Previous Close (prior day’s closing price)
Purpose and Scope
This script is designed to provide basic visual reference points to support discretionary analysis.
It does not generate signals or trading suggestions, and it is not intended to predict future price movements.
How to Use It
Enable or disable each block in the Inputs section according to your analysis style.
Observe how the levels, EMAs, and VWAP interact with market structure.
Use it as a visual complement to your personal technical analysis.
Limitations
This indicator is not a trading system and does not guarantee results.
It does not include alerts, backtesting, or entry/exit logic.
Some values (such as PMH/PML) depend on the symbol’s exchange trading hours.
Credits
Designed as an educational and analytical tool for traders seeking to simplify their charts without losing key information.

Dual TF Bearish Divergence (Working)//@version=6
indicator("Dual TF Bearish Divergence (Working)", overlay=true)
// ----------------- SIMPLE BEARISH DIVERGENCE FUNCTION -------------------
bearDiv(src, rsiLen, lookbackMin, lookbackMax) =>
r = ta.rsi(src, rsiLen)
ph = ta.pivothigh(src, lookbackMin, lookbackMin)
ph_rsi = ta.pivothigh(r, lookbackMin, lookbackMin)
ph2 = ph
ph2_rsi = ph_rsi
priceHH = not na(ph) and not na(ph2) and ph > ph2
rsiLH = not na(ph_rsi) and not na(ph2_rsi) and ph_rsi < ph2_rsi
barsOk = lookbackMin >= lookbackMin and lookbackMin <= lookbackMax
priceHH and rsiLH and barsOk
// ----------------- TF CALLS -------------------
b60 = request.security(syminfo.tickerid, "60", bearDiv(close, 14, 10, 15))
b240 = request.security(syminfo.tickerid, "240", bearDiv(close, 14, 10, 15))
dual = b60 and b240
// ----------------- PLOT -------------------
plotshape(dual, title="Dual Bear Div", style=shape.labeldown,
color=color.red, size=size.small, text="🔻BearDiv")
// ----------------- ALERT -------------------
alertcondition(dual, "Dual Bearish Div 60+240",
"Bearish Divergence on both 60m & 240m")

EMA Market Structure [BOSWaves]EMA Market Structure - Trend-Driven Structural Mapping with Adaptive Swing Detection
Overview
The EMA Market Structure indicator provides an advanced framework for visualizing market structure through dynamically filtered trend and swing analysis.
Unlike conventional EMA overlays, which merely indicate average price direction, this model integrates trend acceleration, swing highs/lows, and break-of-structure (BOS) logic into a unified, visually intuitive display.
Each element adapts in real time to price movement, offering traders a living map of support, resistance, and trend bias that reacts fluidly to market momentum.
The result is a comprehensive, trend-aware representation of price structure.
EMA slope and acceleration guide trend perception, while swing points identify key inflection zones.
Breaks of prior highs or lows are highlighted with visual BOS labels and stop-loss projections, giving traders actionable context for continuation or reversal setups.
Unlike static lines or simple moving averages, the EMA Market Structure indicator fuses dynamic trend analysis with structural awareness to provide a clear picture of market bias and potential turning points.
Theoretical Foundation
The EMA Market Structure builds on principles of momentum filtering and structural analysis.
Standard moving averages track average price but ignore acceleration and context; this indicator captures both the directional slope of the EMA and its rate of change, providing a proxy for trend strength.
Simultaneously, swing detection identifies statistically significant highs and lows, while BOS logic flags decisive breaks in structure, aligned with trend direction.
At its core are three interacting components:
EMA Trend & Acceleration : Smooths price data while highlighting acceleration changes, producing gradient-driven color cues for trend momentum.
Swing Detection Engine : Identifies swing highs and lows over configurable bar lengths, ensuring key turning points are captured with minimal clutter.
Break-of-Structure Logic : Detects price breaches of previous swings and aligns them with EMA trend for actionable BOS signals, including projected stop-loss levels for tactical decision-making.
By integrating these elements, the system scales effectively across timeframes and assets, maintaining structural clarity while visualizing trend dynamics in real time. Traders receive both macro and micro perspectives of market movement, with clear cues for trend continuation or reversal.
How It Works
The EMA Market Structure indicator operates through layered processing stages:
EMA Slope & Acceleration : Calculates the EMA and its rate of change, normalizing via ATR and a smoothing function to produce gradient color coding. This allows instant visual identification of bullish or bearish momentum.
Swing Identification : Swing highs and lows are computed using configurable left/right bar lengths, filtered through a cool-off mechanism to prevent redundant signals and maintain chart clarity.
Structural Lines & Zones : Swing points are connected with lines, and shaded zones are drawn between successive highs/lows to highlight key support and resistance regions.
Break-of-Structure Detection : BOS events occur when price breaches a prior swing in alignment with the EMA trend. Bullish and bearish BOS signals include enhanced label effects and projected stop-loss lines and zones, providing immediate tactical reference.
Dynamic Background Mapping : The chart background adapts to EMA trend direction, reinforcing trend context with subtle visual cues.
Through these processes, the indicator creates a living, adaptive map of market structure that reflects both trend strength and swing-based inflection points.
Interpretation
The EMA Market Structure reframes market reading from simple trend following to structured awareness of price behavior:
Uptrend Phases : EMA is rising with positive acceleration, swings confirm higher lows, and BOS events occur above prior highs, signaling trend continuation.
Downtrend Phases : EMA slope is negative, swings form lower highs, and BOS events occur below prior lows, confirming bearish bias.
Trend Reversals : Flat or decelerating EMA with BOS failures may indicate impending structural change.
Critical Zones : Swing-based lines and shaded zones highlight areas where price may pause, reverse, or accelerate, providing high-probability decision points.
Visually, EMA color gradients, structural lines, and BOS labels combine to provide both statistical trend confirmation and actionable structural cues.
Strategy Integration
EMA Market Structure integrates seamlessly into trend-following and swing-based trading systems:
Trend Alignment : Confirm higher-timeframe EMA slope before entering continuation trades.
BOS Entry Triggers : Use BOS events aligned with EMA trend for tactical entries and stop placement.
Support/Resistance Mapping : Swing lines and zones help define areas for scaling, exits, or reversals.
Volatility Context : ATR-based smoothing and stop-loss buffers accommodate varying market volatility, ensuring robustness across conditions.
Multi-Timeframe Coordination : Combine higher-timeframe EMA trend and swings with lower-timeframe structural events for precision entries.
Technical Implementation Details
Core Engine : EMA slope and ATR-normalized acceleration for gradient-driven trend visualization.
Swing Framework : Pivot-based high/low detection with configurable bar lengths and cool-off intervals.
Structural Visualization : Lines, zones, and labels for high-fidelity mapping of support/resistance and BOS events.
BOS Engine : Detects structural breaks aligned with EMA trend, automatically plotting stop-loss lines and visual cues.
Performance Profile : Lightweight, optimized for real-time responsiveness across multiple timeframes.
Optimal Application Parameters
Timeframe Guidance:
1 - 5 min : Ideal for intraday swing spotting and microstructure trend tracking.
15 - 60 min : Medium-range structural analysis and BOS-driven entries.
4H - Daily : Macro trend mapping and key swing-based support/resistance identification.
Suggested Configuration:
EMA Length : 50
Swing Length : 5
Swing Cooloff : 10 bars
BOS Cooloff : 15 bars
SL Buffer : 0.1%
These suggested parameters should be used as a baseline; their effectiveness depends on the asset volatility, liquidity, and preferred entry frequency, so fine-tuning is expected for optimal performance.
Performance Characteristics
High Effectiveness:
Trending markets with defined swings and structural consistency.
Markets where EMA slope and acceleration reliably indicate momentum changes.
Reduced Effectiveness:
Choppy or sideways markets with minimal swing definition.
Random walk assets lacking clear structural anchors.
Integration Guidelines
Confluence Framework : Combine with volume, momentum, or BOSWaves structural indicators
to validate entries.
Directional Control: Follow EMA slope and BOS alignment for high-conviction trades.
Risk Calibration: Use SL projections for disciplined exposure management.
Multi-Timeframe Synergy: Confirm higher-timeframe trend before executing lower-timeframe structural trades.
Disclaimer
The EMA Market Structure is a professional-grade trend and structure visualization tool. It is not predictive or guaranteed profitable; performance depends on parameter tuning, market regime, and disciplined execution. BOSWaves recommends using it as part of a comprehensive analytical stack integrating trend, liquidity, and structural context.

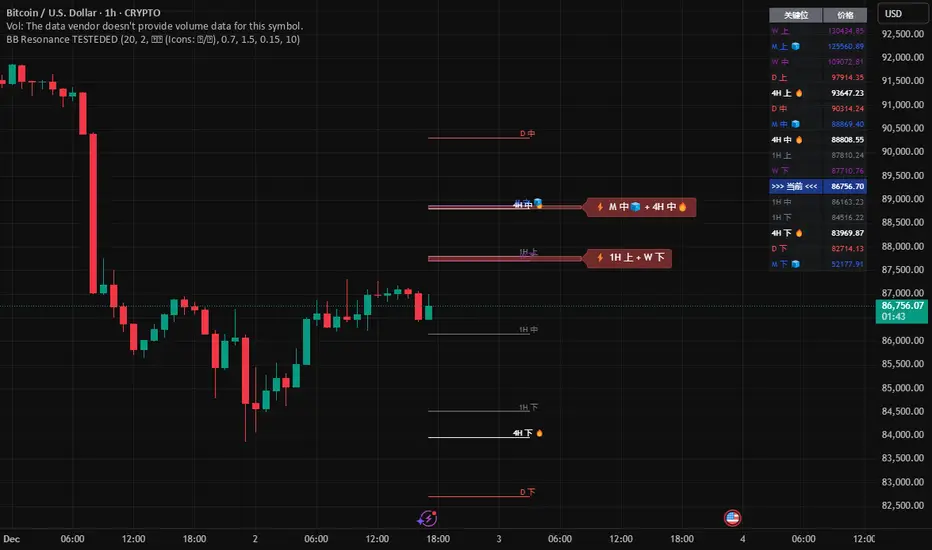
Global BB Resonance [by TESTEDED]📈 Global BB Resonance Hunter
1. Design Philosophy: Dimensional Reduction
In modern trading, "Information Overload" is the enemy. Traders often clutter their charts with 15+ Bollinger Band lines across 1H, 4H, Daily, and Weekly timeframes, resulting in a "spaghetti chart" that is impossible to read quickly.
The core logic of this indicator is "Dimensional Reduction." Instead of drawing every single line, this script runs a background algorithm to detect "Confluence" (Resonance).
The Thesis: A single Bollinger line (e.g., 1H Upper) is easily broken. However, when multiple dimensions overlap (e.g., 1H Upper + Daily Mid + Weekly Low) at the exact same price level, a "Market Consensus" is formed. These are the critical "Walls" of the market.
The Solution: We sort all data by Price, not Time. If lines cluster together within a specific threshold (e.g., 0.15%), the script draws a single Resonance Box instead of multiple confusing lines.
2. Key Features
🛡️ Multi-Timeframe Monitoring: Simultaneously monitors 1H, 4H, Daily, Weekly, and Monthly Bollinger Bands in the background, regardless of your chart's current timeframe.
⚡ Smart Resonance Detection: Automatically groups overlapping levels into "Resonance Boxes."
⚡ (2-Line Confluence): Watch closely.
⚡⚡ (3-Line Confluence): Strong Support/Resistance.
⚡⚡⚡ (4+ Lines): "Iron Wall" Resonance.
📊 Volatility State Perception: Detects if the bands are Squeezing (accumulating energy) or Expanding (trending).
Style Options: Choose between Icons (🧊/🔥) or Geek Symbols (>.< / <^>).
🧘 Focus Mode (Sniper View): A unique feature that hides all individual lines, leaving only the Resonance Boxes and the Dashboard. This keeps your chart clean and distraction-free.
🔔 Smart Alerts: Get notified immediately when Price touches a Resonance Box or when a Squeeze occurs.
3. Visual Guide
A. The Symbols (State Indicators)
You can switch styles in the settings.
B. The Resonance Boxes
Red Box: Resistance Zone (Above Price).
Green Box: Support Zone (Below Price).
Label: E.g., ⚡⚡ 1H Up + D Mid. This tells you exactly which levels are overlapping.
4. Usage Strategy
The "Reversal" Setup: Look for a Green Resonance Box below price with High Confluence (⚡⚡). Ensure the state is NOT Expanding (<^> or 🔥).
The "Breakout" Setup: Look for the Squeeze Symbol (>.< or 🧊) on the dashboard. If price approaches a Resonance Box while Squeezing, expect a breakout.
The "Sniper" Method: Turn on Focus Mode. Set Alerts. Only look at the chart when price hits a "Wall."
How to use: youtu.be
📈 布林带多维共振捕猎者
1. 设计哲学:降维打击
在现代交易中,“信息过载”是最大的敌人。交易者经常在图表上叠加 1H、4H、日线、周线等 15 条以上的布林带线条,导致图表像“盘丝洞”一样难以阅读。
本指标的核心逻辑是“降维打击”与“数据可视化”。 我们不再画出每一条线,而是在后台运行算法来捕捉**“共振”(Confluence)**。
核心理念:单一周期的布林线(如 1H 上轨)很容易被刺破。但是,当多个维度的力量(如 1H 上轨 + 日线中轨 + 周线下轨)在同一个价格水平重叠时,就形成了**“市场合力”**。这些位置才是市场真正的“铜墙铁壁”。
解决方案:系统按价格而非时间对数据进行排序。如果多条线在特定阈值(如 0.15%)内聚集,脚本会画出一个**“共振框”**,而不是无数条混乱的线。
2. 核心功能
🛡️ 全维幽灵监控:无论当前图表周期如何,脚本都会在后台实时监控 1H, 4H, 日线, 周线, 月线 的数据。
⚡ 智能共振雷达:自动检测并合并重叠的关键位。
⚡ (2线共振):值得关注。
⚡⚡ (3线共振):强力支撑/阻力。
⚡⚡⚡ (4线以上):核弹级/铁壁共振。
📊 波动率状态感知:自动识别布林带是处于 挤压蓄势 还是 扩张爆发 阶段。
风格切换:支持 图标模式 (🧊/🔥) 或 极客符号模式 (>.< / <^>)。
🧘 专注模式 (Focus Mode):一键隐藏所有单线,只保留共振框和仪表盘。让您的图表瞬间清空,像狙击手一样只关注目标。
🔔 智能警报:当价格触及共振框,或出现极度压缩信号时,立即发送警报。
3. 视觉指南
A. 状态符号说明
您可以在设置中切换显示风格。
B. 共振框说明
红色方框:上方阻力区 (Resistance)。
绿色方框:下方支撑区 (Support)。
标签示例:⚡⚡ 1H Up + D Mid —— 明确告知您是哪几条线发生了共振。
4. 实战策略
“反转”交易:寻找价格下方的绿色共振框,且具有高星级 (⚡⚡)。前提是当前状态不是扩张状态 (<^> 或 🔥)。
“突破”交易:在仪表盘上看到 挤压符号 (>.< 或 🧊)。如果价格在挤压状态下逼近共振框,不要逆势阻挡,大概率会发生强力突破。
“狙击”模式:开启 专注模式。设置好警报。不要盯着 K 线波动,直到价格撞上“墙壁”触发警报时再介入。
使用说明: youtu.be
MTF RSI Stacked + AI + Gradient MTF RSI Stacked + AI + Gradient
Quick-start guide & best-practice rules
What the indicator does
Multi-Time-Frame RSI in one pane
• 10 time-frames (1 m → 1 M) are stacked 100 points apart (0, 100, 200 … 900).
• Each RSI is plotted with a smooth red-yellow-green gradient:
– Red = RSI below 30 (oversold)
– Yellow = RSI near 50
– Green = RSI above 70 (overbought)
• Grey 30-70 bands are drawn for every TF so you can see extremities at a glance.
Built-in AI (KNN) signal
• On every close of the chosen AI-time-frame the script:
– Takes the last 14-period RSI + normalised ATR as “features”
– Compares them to the last N bars (default 1 000)
– Votes of the k = 5 closest neighbours → BUY / SELL / NEUTRAL
• Confidence % is shown in the badge (top-right).
• A thick vertical line (green/red) is printed once when the signal flips.
How to read it
• Gradient colour tells you instantly which TFs are overbought/obove sold.
• When all or most gradients are green → broad momentum up; look for shorts only on lower-TF pullbacks.
• When most are red → broad momentum down; favour longs only on lower-TF bounces.
• Use the AI signal as a confluence filter, not a stand-alone entry:
– If AI = BUY and 3+ higher-TF RSIs just crossed > 50 → consider long.
– If AI = SELL and 3+ higher-TF RSIs just crossed < 50 → consider short.
• Divergences: price makes a higher high but 1 h/4 h RSI (gradient) makes a lower high → possible reversal.
Settings you can tweak
AI timeframe – leave empty = same as chart, or pick a higher TF (e.g. “15” or “60”) to slow the signal down.
Training bars – 500-2 000 is the sweet spot; bigger = slower but more stable.
K neighbours – 3-7; lower = more signals, higher = smoother.
RSI length – 14 is standard; 9 gives earlier turns, 21 gives fewer false swings.
Practical trading workflow
Open the symbol on your execution TF (e.g. 5 m).
Set AI timeframe to 3-5× execution TF (e.g. 15 m or 30 m) so the signal survives market noise.
Wait for AI signal to align with gradient extremes on at least one higher TF.
Enter on the first gradient reversal inside the 30-70 band on the execution TF.
Place stop beyond the swing that caused the gradient flip; target next opposing 70/30 level on the same TF or trail with structure.
Colour cheat-sheet
Bright green → RSI ≥ 70 (overbought)
Bright red → RSI ≤ 30 (oversold)
Muted colours → RSI near 50 (neutral, momentum pause)
That’s it—one pane, ten time-frames, colour-coded extremes and an AI confluence layer.
Keep the chart clean, use price action for precise entries, and let the gradient tell you when the wind is at your back.

Trend Trader//@version=6
indicator("Trend Trader", shorttitle="Trend Trader", overlay=true)
// User-defined input for moving averages
shortMA = input.int(10, minval=1, title="Short MA Period")
longMA = input.int(100, minval=1, title="Long MA Period")
// User-defined input for the instrument selection
instrument = input.string("US30", title="Select Instrument", options= )
// Set target values based on selected instrument
target_1 = instrument == "US30" ? 50 :
instrument == "NDX100" ? 25 :
instrument == "GER40" ? 25 :
instrument == "GOLD" ? 5 : 5 // default value
target_2 = instrument == "US30" ? 100 :
instrument == "NDX100" ? 50 :
instrument == "GER40" ? 50 :
instrument == "GOLD" ? 10 : 10 // default value
// User-defined input for the start and end times with default values
startTimeInput = input.int(12, title="Start Time for Session (UTC, in hours)", minval=0, maxval=23)
endTimeInput = input.int(17, title="End Time Session (UTC, in hours)", minval=0, maxval=23)
// Convert the input hours to minutes from midnight
startTime = startTimeInput * 60
endTime = endTimeInput * 60
// Function to convert the current exchange time to UTC time in minutes
toUTCTime(exchangeTime) =>
exchangeTimeInMinutes = exchangeTime / 60000
// Adjust for UTC time
utcTime = exchangeTimeInMinutes % 1440
utcTime
// Get the current time in UTC in minutes from midnight
utcTime = toUTCTime(time)
// Check if the current UTC time is within the allowed timeframe
isAllowedTime = (utcTime >= startTime and utcTime < endTime)
// Calculating moving averages
shortMAValue = ta.sma(close, shortMA)
longMAValue = ta.sma(close, longMA)
// Plotting the MAs
plot(shortMAValue, title="Short MA", color=color.blue)
plot(longMAValue, title="Long MA", color=color.red)
// MACD calculation for 15-minute chart
= request.security(syminfo.tickerid, "15", ta.macd(close, 12, 26, 9))
macdColor = macdLine > signalLine ? color.new(color.green, 70) : color.new(color.red, 70)
// Apply MACD color only during the allowed time range
bgcolor(isAllowedTime ? macdColor : na)
// Flags to track if a buy or sell signal has been triggered
var bool buyOnce = false
var bool sellOnce = false
// Tracking buy and sell entry prices
var float buyEntryPrice_1 = na
var float buyEntryPrice_2 = na
var float sellEntryPrice_1 = na
var float sellEntryPrice_2 = na
if not isAllowedTime
buyOnce :=false
sellOnce :=false
// Logic for Buy and Sell signals
buySignal = ta.crossover(shortMAValue, longMAValue) and isAllowedTime and macdLine > signalLine and not buyOnce
sellSignal = ta.crossunder(shortMAValue, longMAValue) and isAllowedTime and macdLine <= signalLine and not sellOnce
// Update last buy and sell signal values
if (buySignal)
buyEntryPrice_1 := close
buyEntryPrice_2 := close
buyOnce := true
if (sellSignal)
sellEntryPrice_1 := close
sellEntryPrice_2 := close
sellOnce := true
// Apply background color for entry candles
barcolor(buySignal or sellSignal ? color.yellow : na)
/// Creating buy and sell labels
if (buySignal)
label.new(bar_index, low, text="BUY", style=label.style_label_up, color=color.green, textcolor=color.white, yloc=yloc.belowbar)
if (sellSignal)
label.new(bar_index, high, text="SELL", style=label.style_label_down, color=color.red, textcolor=color.white, yloc=yloc.abovebar)
// Creating labels for 100-point movement
if (not na(buyEntryPrice_1) and close >= buyEntryPrice_1 + target_1)
label.new(bar_index, high, text=str.tostring(target_1), style=label.style_label_down, color=color.green, textcolor=color.white, yloc=yloc.abovebar)
buyEntryPrice_1 := na // Reset after label is created
if (not na(buyEntryPrice_2) and close >= buyEntryPrice_2 + target_2)
label.new(bar_index, high, text=str.tostring(target_2), style=label.style_label_down, color=color.green, textcolor=color.white, yloc=yloc.abovebar)
buyEntryPrice_2 := na // Reset after label is created
if (not na(sellEntryPrice_1) and close <= sellEntryPrice_1 - target_1)
label.new(bar_index, low, text=str.tostring(target_1), style=label.style_label_up, color=color.red, textcolor=color.white, yloc=yloc.belowbar)
sellEntryPrice_1 := na // Reset after label is created
if (not na(sellEntryPrice_2) and close <= sellEntryPrice_2 - target_2)
label.new(bar_index, low, text=str.tostring(target_2), style=label.style_label_up, color=color.red, textcolor=color.white, yloc=yloc.belowbar)
sellEntryPrice_2 := na // Reset after label is created

Ultimate_Price_Action_Tool_V2 by chaitu50cUltimate_Price_Action_Tool_V2 by chaitu50c — Session-Based SR Box Engine
This indicator builds clean, session-aware support and resistance “zones” from pure price action. It is designed for intraday and positional traders who want objective, rule-based zones instead of manual drawing.
Core Logic
Price-action based MAIN zones
Detects bullish and bearish breakouts using a strict body-structure:
Single-candle and double-candle breakout patterns.
Breakouts are confirmed only when closes break beyond previous highs/lows.
From each valid breakout, the tool builds a MAIN Support or MAIN Resistance box:
For bullish breaks, the zone is created from a combined low to the nearest open/close in the breakout combo.
For bearish breaks, the zone is created from a combined high to the nearest open/close in the breakout combo.
Optional first-box logic:
Can create the very first MAIN zone in a session from a simple opposite-color pair (without a full breakout), if enabled.
SUB zones on break
When price breaks a MAIN Support downwards with a red candle, the MAIN box is removed/frozen and:
A new SUB Resistance box is created above, using the current bar’s structure.
When price breaks a MAIN Resistance upwards with a green candle:
A new SUB Support box is created below.
SUB zones are optional and can be fully disabled if the user prefers a clean MAIN-only view.
Session Handling
The script is fully session-aware and can work in different market structures:
Session Mode options
Clock Session
Uses a fixed time window (e.g., 09:15–15:30).
Zones can be shown only inside the session or kept visible outside, depending on settings.
New Day
Each new trading day is treated as a fresh session.
Auto Gap
A new session starts whenever the time gap between candles exceeds a user-defined threshold (in minutes).
Session IDs and history
Each new session gets its own ID.
You can display zones for the last N sessions (including current).
Older sessions fade out visually but remain internally tracked to control visibility.
Main Features & Options
Initial Right Offset
Every new zone is projected to the right by a configurable number of bars.
All active boxes continuously extend with this offset, keeping zones clearly projected into the future.
Single MAIN per side (per session)
Optional constraint to have only:
One active MAIN Support and
One active MAIN Resistance
per session on the chart.
This prevents overcrowding and focuses on the most recent key structure.
MAIN vs SUB Overlap Control
When a new MAIN zone overlaps an existing SUB zone, you can choose:
Suppress MAIN (ignore the new MAIN if it clashes with a SUB),
Remove SUB (delete overlapping SUB zones and keep the new MAIN), or
Allow Both (plot everything and let the trader decide).
Vertical overlap is evaluated using a configurable minimum overlap percentage.
SUB suppression under MAIN
SUB boxes that overlap strongly with active MAIN zones can be auto-suppressed to avoid redundant clutter.
This suppression uses the same percent-based overlap logic.
Broken MAIN box handling
When a MAIN zone is broken:
Option 1: Fully delete it (classic behavior).
Option 2: Convert it into a 1-bar “marker” box at its origin, so you still see where the original zone formed without extending into the future.
Break candle coloring
The candle that breaks a MAIN zone can be optionally painted:
Red when breaking support.
Green when breaking resistance.
Helps visually confirm genuine breaks vs. simple intrabar tests.
Visual & Styling Controls
Separate style controls for:
MAIN Support / MAIN Resistance
Independent fill and border colors.
SUB Support / SUB Resistance
Independent fill and border colors.
Opacity and border colors are internally managed so that:
Recent sessions are clearly visible.
Older sessions are softly faded to maintain context without noise.
Typical Use Cases
Intraday traders looking for:
Clean, rule-based supply and demand zones.
Zones that respect actual session structure (clock, daily, or gap-based).
Swing traders who:
Want to track how current price reacts to the most recent 1–N sessions’ zones.
Price action traders who:
Prefer breakout-based zones rather than indicator-driven levels.
Need automatic zone management (creation, extension, break handling, and suppression).
This tool is built to be modular and configurable: you can run it minimal (only MAIN zones, single side per session) or fully featured (MAIN + SUB, multi-session history, overlap handling, and break paints). All logic is strictly price-action based with no dependency on volume or external indicators.

Dark VectorThe Dark Vector is a professional-grade trend-following system designed to solve the two most common causes of trading losses: over-trading during chop and exiting trends too early.
Unlike standard indicators that continuously recalculate based on every price tick, this system operates on a strict "State Machine" logic. This means it tracks the current market phase and refuses to issue conflicting signals. If the system is Long, it mathematically cannot issue another Long signal until the previous trend has concluded.
The system relies on three core engines:
1. The Trend Architecture (Modified SuperTrend) The backbone of the system is an ATR-based trailing stop mechanism. It creates a dynamic trend line that adjusts to volatility. When volatility expands, the line widens to prevent premature stop-outs during market noise. When volatility contracts, the line tightens to protect profits.
2. The Noise Gate (Choppiness Index) This is the system's safety filter. It measures the fractal efficiency of the market—essentially determining if price is moving in a clear direction or moving sideways. When the market enters a consolidation phase (sideways chop), the Noise Gate activates, turning the candles gray and physically blocking all new entry signals. This prevents the user from entering trades in low-probability environments.
3. The Singularity State Machine This internal logic enforces trading discipline. It treats the trend as a binary state (Bullish or Bearish). It forces an alternating signal pattern, ensuring that you are only alerted to the specific moment a major trend reversal occurs, rather than being bombarded with repetitive signals during a long run.
Best Way to Use This System
To maximize profitability and minimize false positives, it is recommended to use the "Regime & Alignment" methodology outlined below.
1. The Traffic Light Rule
Before placing any trade, observe the color of the candlesticks on the chart:
Green Candles: The market is in a confirmed Bullish Impulse. You should only look for Long entries or hold existing positions. Shorting is statistically dangerous here.
Red Candles: The market is in a confirmed Bearish Impulse. You should only look for Short entries or hold cash. Buying the dip here is high-risk.
Gray Candles: The market is in a Chop/Squeeze regime. The Noise Gate is active. Do not open new positions. This indicates indecision, and the market is likely to destroy option premiums or stop out tight leverage. Wait for the candles to return to Green or Red before acting.
2. The Entry Trigger
Enter a trade only when a text label (LONG or SHORT) appears.
Long Signal: Occurs when price closes above the Trend Line AND the market is not in a Chop zone.
Short Signal: Occurs when price closes below the Trend Line AND the market is not in a Chop zone.
3. The Exit Strategy
There are two ways to manage the trade once active:
The Trend Follower (Conservative): Hold the position until the Trend Line flips color. This captures the maximum duration of the move but may give back some profit at the very end.
The Stop Loss (Active): The Trend Line (the white value in your dashboard) acts as your Trailing Stop. If a candle closes beyond this line, the trend is technically invalidated. You should exit immediately.
4. Multi-Timeframe Alignment (The Golden Rule)
The highest win rates are achieved when your trading timeframe aligns with the higher-order trend.
Step 1: Check the 4-Hour chart. Is the Trend Line Green?
Step 2: Switch to the 15-Minute chart.
Step 3: Only take the LONG signals on the 15-Minute chart. Ignore all Short signals.
Reasoning: Counter-trend trades often fail. By trading only in the direction of the higher timeframe, you are swimming with the current, not against it.
Recommended Settings by Style
Swing Trading (Daily/4H): Keep the Trend Factor at 4.0. This ignores daily noise and keeps you in the trade for weeks or months.
Day Trading (1H/15m): Lower the Trend Factor to 3.0. This makes the system more reactive to intraday reversals.
Scalping (5m): Lower the Trend Factor to 2.0 and the ATR Length to 7. This is aggressive and requires strict adherence to the Stop Loss.
Disclaimer
This indicator is for educational and informational purposes only. It does not constitute financial advice, investment advice, or a recommendation to buy or sell any asset. Trading cryptocurrencies, stocks, and futures involves a high degree of risk and the potential for significant financial loss. The user assumes all responsibility for their trading decisions. Past performance of any system or indicator is not indicative of future results. Always practice risk management and never trade with money you cannot afford to lose.

Regime Filter [BigBeluga]🔵 OVERVIEW
Regime Filter is a dual-factor trend condition tool combining price trend momentum and volume expansion into a single, easy-to-read visual framework. It quantifies recent trend direction and volume shifts, then shows them as:
Two oscillator plots for Trend and Volume regimes
Dynamic candle coloring for trend clarity
A quadrant scatter map in your chart corner for immediate regime recognition.
This filter helps traders quickly detect when a trend is healthy & confirmed by strong volume, or weakening & vulnerable due to low volume.
🔵 CONCEPTS
Trend Oscillator: A loop-based trend value calculated by comparing the current smoothed price (HMA of HLC3) against its own trailing history. Positive values indicate trend-up regimes, negative values signal trend-down phases.
Volume Oscillator: Similar loop logic but on smoothed volume (HMA of Volume) — highlighting whether trading activity is expanding or contracting relative to past bars.
hma = ta.hma(hlc3, 15)
vol = ta.hma(volume, 15)
for i = 0 to len
if hma > hma
trend += 1
else
trend -= 1
for i = 0 to len
if vol > vol
voltrend += 1
else
voltrend -= 1
Regime Map Scatter Plot: A unique 2D quadrant displayed in the bottom-right corner. This shows where the market is sitting:
> Top Right (green): Trend ↑ and Volume ↑ → strong confirmed up trend.
> Top Left (red): Trend ↓ but Volume ↑ → strong sell momentum.
> Bottom Right (blue): Trend ↑ but Volume ↓ → uptrend losing steam.
> Bottom Left (yellow): Trend ↓ and Volume ↓ → weak bearish drift.
Dynamic Candle Coloring: Candles are colored by trend only: green for uptrends, red for downtrends, and orange near reversals.
Threshold Fills: The oscillator region is shaded green above +10 (healthy uptrend) and red below -10 (strong downtrend) for instant confidence.
🔵 FEATURES
Normalized trend and volume values adapt automatically to your lookback length.
Candlestick color overrides highlight current trend state in real-time.
Clear zero-line and fill bands help you gauge strength vs. noise.
Scatter regime dashboard updates live to track when trend and volume align or decouple.
Color gradients show intensification or cooling in both oscillators and the regime map.
🔵 HOW TO USE
Look for sustained positive trend and volume values to confirm strong directional moves.
Watch for the scatter dot in the green square (top right) for high-confidence breakouts.
If the dot drops to bottom right, uptrend may be tiring — possible exit zone.
If the dot jumps top left, bearish drive is reinforced by heavy volume — caution on longs.
Use the orange trend coloring as an early warning that trend pressure may be shifting.
Combine with breakout levels or moving averages for a robust regime filter system.
🔵 CONCLUSION
The Regime Filter distills price trend and volume dynamics into an actionable multi-mode display: oscillators, color-coded candles, and an intuitive scatter map. This all-in-one layout helps traders visually read market regime strength and spot fading trends before they turn — perfect for swing traders, intraday scalpers, and macro trend followers alike.

Every Hour 1st/Last FVG vTDL OVERVIEW - Shoutout to Micheal J. Huddleston aka ICT
This indicator identifies the first Fair Value Gap (FVG) that forms within each trading hour, providing traders with potential entry zones, reversal points, and unmitigated gap targets. Based on the concept that the first presented FVG of each hour represents a significant price delivery array where institutional order flow occurred.
The indicator detects FVGs on a lower timeframe (1-minute default) and displays them as boxes on your chart, tracking which gaps get filled and which remain open as potential draw-on-liquidity targets.
WHAT IS A FAIR VALUE GAP
A Fair Value Gap is a 3-candle price pattern representing an imbalance between buyers and sellers:
Bullish FVG: Forms when candle 3's low is above candle 1's high, leaving a gap
Bearish FVG: Forms when candle 3's high is below candle 1's low, leaving a gap
These gaps often act as magnets for price, which tends to return and "fill" the imbalance before continuing. They function as dynamic support and resistance zones.
KEY FEATURES
Detection Types
FVG: Standard fair value gap detection with volume imbalance expansion
Suspension FVG Blocks: Requires outside prints on both sides for more refined signals
Hourly Display Modes
First Only: Shows whichever FVG appears first each hour (bullish or bearish)
Show Both: Shows first bullish AND first bearish FVG independently each hour
Last FVG Tracking
Optionally display the last FVG of each hour
Useful for comparing how the hour developed
Can extend into the next hour for continued tracking
Breakaway Gap Detection
Gaps not traded into during their formation hour extend forward
Extended gaps display labels showing formation time and date
These unmitigated gaps become price targets and reversal zones
Gap Fill Modes
Touch Box: Marks filled when price enters the gap
Touch Midpoint: Marks filled when price reaches the 50 percent level
Fill Completely: Marks filled when price fills the entire gap with visual progress
HOW TO USE
Entry Points
The first FVG of each hour provides potential entry zones based on price reaction:
When price returns to an FVG and shows rejection, enter in the direction of rejection
The gap zone represents where institutional orders likely reside
Use the boundaries of the gap for stop loss placement
A clean rejection of the zone confirms it as valid support or resistance
Reversal Points
Unmitigated gaps that extend beyond their formation hour are high-probability reaction zones:
Extended boxes with labels indicate unfilled gaps
When price finally reaches these zones, expect a reaction
The longer a gap remains unfilled, the stronger the expected response
These zones act as magnets drawing price back to them
Price Targets
Use unmitigated gaps as draw-on-liquidity targets:
Look for extended boxes above or below current price
Price tends to seek out and fill imbalances
The midpoint line often serves as a minimum target
Multiple unfilled gaps in one direction suggest strong momentum potential
FRAMING DIRECTIONAL BIAS
The first presented FVG of each hour acts as a support or resistance zone. The direction of the FVG itself does not determine bias - it is how price reacts to that FVG that reveals the true market intention.
Reading Price Reaction
Price respects a bullish FVG as support and bounces higher = bullish bias confirmed
Price respects a bearish FVG as resistance and rejects lower = bearish bias confirmed
Price fails to hold a bullish FVG and breaks through = potential inversion, look for shorts
Price fails to hold a bearish FVG and breaks through = potential inversion, look for longs
Inversion Fair Value Gaps (IFVG)
When price trades through an FVG and closes beyond it, that gap can invert its role:
A bullish FVG that fails becomes resistance - use it as a short entry zone
A bearish FVG that fails becomes support - use it as a long entry zone
The inversion signals a shift in control from one side to the other
Watch for price to retest the inverted gap before continuing
Support and Resistance Framework
Think of each hourly first FVG as a key level:
Price above the FVG: the gap acts as potential support
Price below the FVG: the gap acts as potential resistance
Watch how price behaves when it returns to the gap zone
A clean rejection confirms the level; a break through signals inversion
SHORT-TERM SCALPING APPLICATION
These FVGs provide scalping opportunities each hour:
Identify the first FVG of the hour as your key level
Wait for price to trade away from it and return
Observe the reaction at the gap zone
Enter in the direction of the reaction with tight risk
Target the next FVG, midpoint, or nearby liquidity
Trade Management
Use the opposite side of the FVG box as your stop loss zone
The midpoint of the gap often provides first target or decision point
Scale out at nearby unmitigated gaps or key levels
If the gap inverts, flip your bias and look for entries in the new direction
MULTI-HOUR CONTEXT
If price consistently respects FVGs as support across hours = uptrend context
If price consistently respects FVGs as resistance across hours = downtrend context
If FVGs keep inverting = choppy or transitional market
Use higher timeframe direction to filter which reactions to trade
Compare first and last FVG of each hour to see how momentum developed
SESSION FILTERING
The indicator automatically excludes unreliable periods:
4 PM to 5 PM New York time (market close hours 16-17)
Weekend closed periods (Saturday and Sunday before 6 PM)
All timestamps use New York timezone for consistency with futures market hours.
SETTINGS GUIDE
Detection Settings
Detection Type: Choose between standard FVG or Suspension FVG Blocks
Lower Timeframe: 15 seconds, 1 minute, or 5 minutes for gap detection
Min FVG Size: Minimum gap size in ticks to filter noise
Display Settings
Hourly Display Mode: First Only shows one gap per hour; Show Both shows first bull and bear
Show First FVG: Toggle visibility of first FVG boxes
Show Last FVG: Toggle visibility of last FVG boxes
Show Midpoint Lines: Display the 50 percent level of each gap
Show Unfilled Breakaway Gaps: Extend boxes until price fills them
Show Only Today: Reduce clutter by hiding older hourly boxes
Gap Fill Detection Mode
Touch Box: Gap marked filled when price enters the zone
Touch Midpoint: Gap marked filled when price reaches 50 percent level
Fill Completely: Gap marked filled only when fully closed, shows visual fill progress
Recommended Settings by Style
Scalping: 1 minute LTF, 4 tick minimum, Show Both mode, Touch Box fill
Day Trading: 1 minute LTF, 4-8 tick minimum, First Only mode, Touch Midpoint fill
Swing Context: 5 minute LTF, Show Unfilled Gaps enabled, Fill Completely mode
COLOR CODING
Blue boxes: First bullish FVG of the hour
Red boxes: First bearish FVG of the hour
Green boxes: Last bullish FVG of the hour
Orange boxes: Last bearish FVG of the hour
Black midpoint lines: 50 percent level of each gap
Filled portion overlay: Shows visual progress in Fill Completely mode
All colors are fully customizable in the settings menu.
PRACTICAL TIPS
The first FVG of each hour is a hidden PD array - treat it as a significant level
Not every gap produces a tradeable reaction - wait for confirmation
Gaps that remain unfilled for multiple hours carry more weight
Use the Show Both mode to see both bullish and bearish opportunities each hour
When multiple gaps cluster in one zone, that area becomes even more significant
Inversions are powerful signals - a failed level often leads to acceleration
NOTES
Works on any instrument and timeframe
Best used on intraday charts (1 minute to 15 minute) viewing 1 minute LTF gaps
Combine with higher timeframe analysis for confluence
These are probability zones, not guarantees - always use proper risk management
The indicator handles HTF to LTF data fetching automatically

DarkPool's Gann High Low Activator DarkPool's Gann High-Low Activator.
It enhances the traditional trend-following logic by integrating Heikin Ashi smoothing, Multi-Timeframe (MTF) analysis, and volatility filtering. It is designed to filter out market noise and provide clearer trend signals during volatile conditions.
Underlying Concepts
Heikin Ashi Smoothing: Standard price candles can produce erratic signals due to wicks and short-term volatility. This script includes a "Calculation Mode" setting that allows the Gann logic to run on Heikin Ashi average prices. This smoothes out price data, helping traders stay in trends longer by ignoring temporary pullbacks.
Gann High-Low Logic: The core algorithm tracks the Simple Moving Average (SMA) of Highs and Lows over a user-defined period.
Bullish Trend: Price closes above the trailing SMA of Highs.
Bearish Trend: Price closes below the trailing SMA of Lows.
Volatility & Trend Filtering: To reduce false signals during sideways markets, this tool employs two filters:
ADX Filter (Choppiness): Uses the Average Directional Index to detect low-volatility environments. If the ADX is below the defined threshold (default 20), the indicator identifies the market as "choppy" and suppresses signals to preserve capital.
EMA Filter (Baseline): An optional Exponential Moving Average filter ensures trades are only taken in the direction of the longer-term trend (e.g., Longs only above the 200 EMA).
Features
Dual Calculation Modes: Switch between Standard price logic and Heikin Ashi smoothing logic.
Multi-Timeframe (MTF): Calculate the trend based on a higher timeframe (e.g., 4-Hour) while viewing a lower timeframe chart (e.g., 15-Minute).
Automated JSON Alerts: Generates machine-readable JSON alert payloads compatible with external trading bots and webhooks.
Live Dashboard: A data table displaying the current Trend State, Calculation Mode, ADX Value, and risk percentage.
How to Use
Buy Signal: Generated when the trend flips Bullish, provided the ADX indicates sufficient momentum and the price satisfies the EMA filter (if enabled).
Sell Signal: Generated when the trend flips Bearish, subject to the same momentum and trend filters.
Neutral State (Gray Cloud): When the cloud fill turns gray, the market is in consolidation. It is recommended to avoid entering new positions during this state.
Trailing Stop: The Gann Line serves as a dynamic trailing stop-loss level. A close beyond this line invalidates the current trend.
Settings Configuration
Calculation Mode: Select "Standard" for raw price action or "Heikin Ashi" for smoothed trend following.
Gann Length: Lower values (3-5) are suitable for short-term scalping; higher values (10+) are better for swing trading.
MTF Mode: Enable to lock the calculation to a specific higher timeframe.
ADX Threshold: Adjust based on asset volatility. Recommended: 20-25 for Crypto, 15-20 for Forex/Indices.
Disclaimer
This source code and the information presented here are for educational purposes only. This script does not constitute financial advice, trading recommendations, or a solicitation to buy or sell any financial instruments. Trading in financial markets involves a high degree of risk and may not be suitable for all investors. Past performance is not indicative of future results. The author assumes no responsibility for any losses incurred while using this indicator. Use this tool at your own discretion and risk.

Session Open Range, Breakout & Trap Framework - TrendPredator OBSession Open Range, Breakout & Trap Framework — TrendPredator Open Box
Stacey Burke’s trading approach combines concepts from George Douglas Taylor, Tony Crabel, Steve Mauro, and Robert Schabacker. His framework focuses on reading price behaviour across daily templates and identifying how markets move through recurring cycles of expansion, contraction, and reversal. While effective, much of this analysis requires real-time interpretation of session-based behaviour, which can be demanding for traders working on lower intraday timeframes.
The TrendPredator indicators formalize parts of this methodology by introducing mechanical rules for multi-timeframe bias tracking and session structure analysis. They aim to present the key elements of the system—bias, breakouts, fakeouts, and range behaviour—in a consistent and objective way that reduces discretionary interpretation.
The Open Box indicator focuses specifically on the opening behaviour of major trading sessions. It builds on principles found in classical Open Range Breakout (ORB) techniques described by Tony Crabel, where a defined time window around the session open forms a structural reference range. Price behaviour relative to this range—breaking out, failing back inside, or expanding—can highlight developing session bias, potential trap formation, and directional conviction.
This indicator applies these concepts throughout the major equity sessions. It automatically maps the session’s initial range (“Open Box”) and tracks how price interacts with it as liquidity and volatility increase. It also incorporates related structural references such as:
* the first-hour high and low of the futures session
* the exact session open level
* an anchored VWAP starting at the session open
* automated expansion levels projected from the Open Box
In combination, these components provide a unified view of early session activity, including breakout attempts, fakeouts, VWAP reactions, and liquidity targeting. The Open Box offers a structured lens for observing how price transitions through the major sessions (Asia → London → New York) and how these behaviours relate to higher-timeframe bias defined in the broader TrendPredator framework.
Core Features
Open Box (Session Structure)
The indicator defines an initial session range beginning at the selected session open. This “Open Box” represents a fixed time window—commonly the first 30 minutes, or any user-defined duration—that serves as a structural reference for analysing early session behaviour.
The range highlights whether price remains inside the box, breaks out, or rejects the boundaries, providing a consistent foundation for interpreting early directional tendencies and recognising breakout, continuation, or fakeout characteristics.
How it works:
* At the session open, the indicator calculates the high and low over the specified time window.
* This range is plotted as the initial structure of the session.
* Price behaviour at the boundaries can illustrate emerging bias or potential trap formation.
* An optional secondary range (e.g., 15-minute high/low) can be enabled to capture early volatility with additional precision.
Inputs / Options:
* Session specifications (Tokyo, London, New York)
* Open Box start and end times (e.g., equity open + first 30 minutes, or any custom length)
* Open Box colour and label settings
* Formatting options for Open Box high and low lines
* Optional secondary range per session (e.g., 15-minute high/low)
* Forward extension of Open Box high/low lines
* Number of historic Open Boxes to display
Session VWAPs
The indicator plots VWAPs for each major trading session—Asia, London, and New York—anchored to their respective session opens. These session-specific VWAPs assist in tracking how value develops through the day and how price interacts with session-based volume distributions.
How it works:
* At each session open, a VWAP is anchored to the open price.
* The VWAP updates throughout the session as new volume and price data arrive.
* Deviations above or below the VWAP may indicate balance, imbalance, or directional control.
* Viewed together, session VWAPs help identify transitions in value across sessions.
Inputs / Options:
* Enable or disable VWAP per session
* Adjustable anchor and end times (optionally to end of day)
* Line styling and label settings
* Number of historic VWAPs to draw
First Hour High/Low Extensions
The indicator marks the high and low formed during the first hour of each session. These reference points often function as early control levels and provide context for assessing whether the session is establishing bias, consolidating, or exhibiting reversal behaviour.
How it works:
* After the session starts, the indicator records the highest and lowest prices during the first hour.
* These levels are plotted and extended across the session.
* They provide a visual reference for observing reactions, targets, or rejection zones.
Inputs / Options:
* Enable or disable for each session
* Line style, colour, and label visibility
* Number of historic sessions displayed
EQO Levels (Equity Open)
The indicator plots the opening price of each configured session. These “Equity Open” levels represent short-term reference points that can attract price early in the session.
Once the level is revisited after the Open Box has formed, it is automatically cut to avoid clutter. If not revisited, the line remains as an untested reference, similar to a naked point of control.
How it works:
* At session open, the open price is recorded.
* The level is plotted as a local reference.
* If price interacts with the level after the Open Box completes, the line is cut.
* Untested EQOs extend forward until interacted with.
Inputs / Options:
* Enable/disable per session
* Line style and label settings
* Optional extension into the next day
* Option for cutting vs. hiding on revisit
* Number of historic sessions displayed
OB Range Expansions (Automatic)
Range expansions are calculated from the height of the Open Box. These levels provide structured reference zones for identifying potential continuation or exhaustion areas within a session.
How it works:
* After the Open Box is formed, multiples of the range (e.g., 1×, 2×, 3×) are projected.
* These expansion levels are plotted above and below the range.
* Price reactions near these areas can illustrate continuation, hesitation, or potential reversal.
Inputs / Options:
* Enable or disable per session
* Select number of multiples
* Line style, colour, and label settings
* Extension length into the session
Stacey Burke 12-Candle Window Marker
The indicator can highlight the 12-candle window often referenced in Stacey Burke’s session methodology. This window represents the key active period of each session where breakout attempts, volatility shifts, and reversal signatures often occur.
How it works:
* A configurable window (default 12 candles) is highlighted from each session open.
* This window acts as a guide for observing active session behaviour.
* It remains visible throughout the session for structural context.
Inputs / Options:
* Enable/disable per session
* Configurable window duration (default: 3 hours)
* Colour and transparency controls
Concept and Integration
The Open Box is built around the same multi-timeframe logic that underpins the broader TrendPredator framework.
While higher-timeframe tools track bias and setups across the H8–D–W–M levels, the Open Box focuses on the H1–M30 domain to define session structure and observe how early intraday behaviour aligns with higher-timeframe conditions.
The indicator integrates with the TrendPredator FO (Breakout, Fakeout & Trend Switch Detector), which highlights microstructure signals on lower timeframes (M15/M5). Together they form a layered workflow:
* Higher timeframes: context, bias, and developing setups
* TrendPredator OB: intraday and intra-session structure
* TrendPredator FO: microstructure confirmation (e.g., FOL/FOH, switches)
This alignment provides a structured way to observe how daily directional context interacts with intraday behaviour.
See the public open source indicator TP FO here (click on it for access):
Practical Application
Before Session Open
* Review previous session Open Box, Open level, and VWAPs
* Assess how higher-timeframe bias aligns with potential intraday continuation or reversal
* Note untested EQO levels or VWAPs that may function as liquidity attractors
During Session Open
* Observe behaviour around the first-hour high/low and higher-timeframe reference levels
* Monitor how the M15 and 30-minute ranges close
* Track reactions relative to the session open level and the session VWAP
After the Open Box completes
* Assess price interaction with Open Box boundaries and first-hour levels
* Use microstructure signals (e.g., FOH/FOL, switches) for potential confirmation
* Refer to expansion levels as reference zones for management or target setting
After Session
* Review how price behaved relative to the Open Box, EQO levels, VWAPs, and expansion zones
* Analyse breakout attempts, fakeouts, and whether intraday structure aligned with the broader daily move
Example Workflow and Trade
1. Higher-timeframe analysis signals a Daily Fakeout Low Continuation (bullish context).
2. The New York session forms an Open Box; price breaks above and holds above the first-hour high.
3. A Fakeout Low + Switch Bar appears on M5 (via FO), after retesting the session VWAP triggering the entry.
4. 1x expansion level serves as reference targets for take profit.
Relation to the TrendPredator Ecosystem
The Open Box is part of the TrendPredator Indicator Family, designed to apply multi-timeframe logic consistently across:
* higher-timeframe context and setups
* intraday and session structure (OB)
* microstructure confirmation (FO)
Together, these modules offer a unified structure for analysing how daily and intraday cycles interact.
Disclaimer
This indicator is for educational purposes only and does not guarantee profits.
It does not provide buy or sell signals but highlights structural and behavioural areas for analysis.
Users are solely responsible for their trading decisions and outcomes.

Sniper Entry AU - AYUSHThis indicator combines EMA 9, EMA 15, and VWAP to identify trend direction and intraday strength. EMA 9 and EMA 15 show short-term momentum and crossover signals, while VWAP acts as an institutional reference point for fair value. Together, they help traders spot trend continuation, pullbacks, and high-quality entry zones during intraday sessions.

EMA 12-26-100 Momentum Strategy# Triple EMA Multi-Signal Momentum Strategy
## 📊 Overview
**Triple EMA Multi-Signal** is a comprehensive trend-following momentum strategy designed specifically for cryptocurrency markets. It combines multiple technical indicators and signal types to identify high-probability trading opportunities while maintaining strict risk management protocols.
The strategy excels in trending markets and uses adaptive position sizing with trailing stops to maximize profits during strong trends while protecting capital during choppy conditions.
## 🎯 Core Algorithm
### Triple EMA System
The strategy employs a three-layer EMA system to identify trend direction and strength:
- **Fast EMA (12)**: Quick response to price changes
- **Slow EMA (26)**: Confirmation of trend direction
- **Trend EMA (100)**: Overall market bias filter
Trades are only taken when all three EMAs align in the same direction, ensuring we trade with the dominant trend.
### Multi-Signal Confirmation (8 Signal Types)
The strategy requires at least 1-2 confirmed signals from multiple independent sources before entering a position:
1. **EMA Crossover** - Fast EMA crossing Slow EMA (primary signal)
2. **MACD Cross** - MACD line crossing signal line (momentum confirmation)
3. **RSI Reversal** - RSI bouncing from oversold/overbought zones
4. **Price Action** - Strong bullish/bearish candles (>60% of range)
5. **Volume Spike** - Above-average volume confirmation
6. **Breakout** - Price breaking 20-period high/low with volume
7. **Pullback to EMA** - Trend continuation after healthy retracement
8. **Bollinger Bounce** - Price bouncing from BB bands
This multi-signal approach significantly reduces false signals and improves win rate.
## 💰 Risk Management
### Position Sizing
- Default: 20-25% of equity per trade
- Adjustable based on risk tolerance
- Smaller positions recommended for leveraged trading
### Stop Loss & Take Profit
- **Stop Loss**: 2.0% (tight control of risk)
- **Take Profit**: 5.5% (2.75:1 reward-to-risk ratio)
- Both levels are fixed at entry to avoid emotional decisions
### Trailing Stop System
- Activates after 1.8% profit
- Trails at 1.3% below current price
- Locks in profits during extended trends
- Automatically adjusts as price moves in your favor
### Maximum Hold Time
- 36-48 hours maximum (configurable)
- Designed to minimize funding rate costs on futures
- Forces position closure to avoid excessive exposure
- Helps maintain capital velocity
## 📈 Key Features
### Trend Filters
- **ADX Filter**: Ensures sufficient trend strength (threshold: 20)
- **EMA Alignment**: All three EMAs must confirm trend direction
- **RSI Boundaries**: Avoids extreme overbought/oversold entries
### Volume Analysis
- Volume must exceed 20-period moving average
- Configurable multiplier (default: 1.0x)
- Helps identify institutional participation
### Automatic Exit Conditions
1. Take Profit target reached
2. Stop Loss triggered
3. Trailing stop activated
4. Trend reversal (EMA cross in opposite direction)
5. Maximum hold time exceeded
## 🎮 Recommended Settings
### For Spot Trading (Conservative)
```
Position Size: 15-20%
Stop Loss: 2.5%
Take Profit: 6.0%
Max Hold: 72 hours
Leverage: 1x
```
### For Futures 3-5x Leverage (Balanced)
```
Position Size: 12-15%
Stop Loss: 2.0%
Take Profit: 5.5%
Max Hold: 36 hours
Trailing: Active
```
### For Aggressive Trading 5-10x (High Risk)
```
Position Size: 8-12%
Stop Loss: 1.5%
Take Profit: 4.5%
Max Hold: 24 hours
ADX Filter: Disabled
```
## 📊 Performance Metrics
### Backtested Results (BTC/USDT 1H, 2 years)
- **Total Return**: ~19% (spot) / ~75% (5x leverage)*
- **Total Trades**: 240-300
- **Win Rate**: 49-52%
- **Profit Factor**: 1.25-1.50
- **Max Drawdown**: ~18-22%
- **Average Trade**: 0.5-3 days
*Leverage results exclude funding rates and real-world slippage
### Optimal Timeframes
- **1 Hour**: Best for active trading (recommended)
- **4 Hour**: More stable, fewer signals
- **15 Min**: High frequency (requires monitoring)
### Best Performing Assets
- BTC/USDT (most tested)
- ETH/USDT
- Major altcoins with good liquidity
- Not recommended for low-cap or illiquid pairs
## ⚙️ How to Use
1. **Add to Chart**: Apply strategy to 1H BTC/USDT chart
2. **Adjust Settings**: Configure risk parameters based on your preference
3. **Review Signals**: Green = Long, Red = Short, labels show signal count
4. **Monitor Performance**: Check strategy tester for detailed statistics
5. **Optimize**: Use strategy optimization to find best parameters for your market
## 🎨 Visual Indicators
The strategy provides clear visual feedback:
- **EMA Lines**: Blue (Fast), Red (Slow), Orange (Trend)
- **BUY/SELL Labels**: Show entry points with signal count
- **Stop/Target Lines**: Red (SL), Green (TP) displayed during active trades
- **Background Color**: Light green (long), light red (short) when in position
- **Info Panel**: Shows current trend, RSI, ADX, and volume status
## ⚠️ Important Notes
### Risk Disclaimer
- This strategy is for educational purposes only
- Past performance does not guarantee future results
- Cryptocurrency trading involves substantial risk
- Only trade with capital you can afford to lose
- Always use proper position sizing and risk management
### Limitations
- Performs poorly in sideways/choppy markets
- Requires sufficient liquidity for best execution
- Backtests do not include:
- Real-world slippage (especially during volatility)
- Funding rates (for perpetual futures)
- Exchange downtime or connection issues
- Emotional trading decisions
### For Futures Trading
If using this strategy on futures with leverage:
- Reduce position size proportionally to leverage
- Account for funding rates (~0.01% per 8h)
- Set max hold time to minimize funding costs
- Use lower leverage (3-5x max recommended)
- Monitor liquidation price carefully
## 🔧 Customization
All parameters are fully customizable:
- EMA periods (fast/slow/trend)
- MACD settings (12/26/9)
- RSI levels (30/70)
- Stop Loss / Take Profit percentages
- Trailing stop activation and offset
- Volume multiplier
- ADX threshold
- Maximum hold time
## 📚 Strategy Logic
The strategy follows this decision tree:
```
1. Check Trend Direction (EMA alignment)
↓
2. Scan for Entry Signals (8 types)
↓
3. Confirm with Filters (ADX, Volume, RSI)
↓
4. Enter Position with Fixed SL/TP
↓
5. Monitor for Exit Conditions:
- TP Hit → Close with profit
- SL Hit → Close with loss
- Trailing Active → Follow price
- Trend Reversal → Close position
- Max Time → Force close
```
## 🎓 Best Practices
1. **Start Conservative**: Use smaller position sizes initially
2. **Track Performance**: Monitor actual vs backtested results
3. **Optimize Regularly**: Market conditions change, adapt parameters
4. **Combine with Analysis**: Don't rely solely on automated signals
5. **Manage Emotions**: Stick to the system, avoid manual overrides
6. **Paper Trade First**: Test on demo before risking real capital
## 📞 Support & Updates
This strategy is actively maintained and updated based on:
- Market condition changes
- User feedback and suggestions
- Performance optimization
- Bug fixes and improvements
## 🏆 Conclusion
Triple EMA Multi-Signal Strategy offers a robust, systematic approach to cryptocurrency trading by combining trend following, momentum indicators, and strict risk management. Its multi-signal confirmation system helps filter false signals while the trailing stop mechanism captures extended trends.
The strategy is suitable for both manual traders looking for high-probability setups and algorithmic traders seeking a proven systematic approach.
**Remember**: No strategy wins 100% of the time. Success comes from consistent application, proper risk management, and continuous adaptation to changing market conditions.
---
*Version: 1.0*
*Last Updated: November 2025*
*Tested on: BTC/USDT, ETH/USDT (1H, 4H timeframes)*
*Recommended Capital: $5,000+ for optimal position sizing*

Hybrid Flow Master📊 Hybrid Flow Master - Professional Trading Indicator
Overview
Hybrid Flow Master is an advanced all-in-one trading indicator that combines Smart Money Concepts, institutional order flow analysis, and multi-timeframe confluence scoring to identify high-probability trade setups. Designed for both scalpers and swing traders across all markets (Forex, Crypto, Stocks, Indices).
🎯 Key Features
1. Intelligent Confluence System (0-100% Scoring) Proprietary scoring algorithm that weighs multiple factors Only signals when minimum confidence threshold is met
Real-time probability calculations for each setup Signal quality grading: A+, A, B, C ratings
2. Smart Money Concepts (SMC)
Automatic Order Block detection (bullish/bearish) Fair Value Gap (FVG) identification
Market structure analysis (Higher Highs, Lower Lows) Swing high/low tracking with visual markers
3. Multi-Timeframe Analysis
Higher timeframe trend filter for confluence Customizable HTF periods (1H, 4H, Daily, etc.)
Prevents counter-trend trades Aligns entries with major trends
4. Volume Flow Analysis
Volume spike detection with customizable thresholds Volume delta calculations (buying vs selling pressure) Institutional footprint identification Background highlighting for high-volume bars
5. Advanced Risk Management
ATR-based stop loss calculation Automatic take profit levels Customizable risk/reward ratios (1:1, 1:2, 1:3+) Visual SL/TP lines on chart Position sizing guidance
6. Professional Dashboard
Real-time HUD displaying:
Market bias (Bullish/Bearish/Neutral)
Higher timeframe trend status
Current confluence percentage
Volume status (Normal/High)
RSI reading with color coding
ATR volatility measure
Signal quality grade
7. Smart Alert System
Bullish confluence signals
Bearish confluence signals
Volume spike notifications
Customizable alert messages
Works with mobile app notifications
📈 What Makes It Unique?
✅ No Repainting - All signals are confirmed and final
✅ Probability-Based - Shows confidence level, not just binary signals
✅ Multi-Factor Confluence - Combines structure, volume, momentum, and HTF analysis
✅ Clean Interface - Toggle individual components on/off
✅ Works on All Timeframes - From 1-minute scalping to daily swing trading
✅ Universal Markets - Forex, Crypto, Stocks, Indices, Commodities
🎨 Customization Options
Adjustable swing detection length
Volume threshold settings
Minimum confluence score filter
Custom color schemes
Dashboard position (4 corners)
Show/hide individual components
Risk/reward ratio adjustment
ATR multiplier for stops
📊 Best Used For:
✔️ Scalping (1m - 15m charts)
✔️ Day Trading (15m - 1H charts)
✔️ Swing Trading (4H - Daily charts)
✔️ Trend Following
✔️ Reversal Trading
✔️ Breakout Trading
💡 How to Use:
Add indicator to chart - Works immediately with default settings Set your timeframe - Choose your trading style Wait for signals - Green BUY or Red SELL labels with confidence %
Check confluence score - Higher % = better quality setup Review dashboard - Confirm market bias and HTF trend Manage risk - Use provided SL/TP levels or adjust to your preference
Set alerts - Get notified of high-probability setups
⚙️ Recommended Settings:
For Scalping (1m-5m):
Swing Length: 5-7
Min Confluence: 70%
HTF: 15m or 1H
For Day Trading (15m-1H):
Swing Length: 10-15
Min Confluence: 60%
HTF: 4H or Daily
For Swing Trading (4H-Daily):
Swing Length: 15-20
Min Confluence: 50-60%
HTF: Weekly
📚 Indicator Components:
✦ Market Structure Detection
✦ Order Block Identification
✦ Fair Value Gaps (FVG)
✦ Volume Analysis
✦ RSI (14)
✦ MACD (12, 26, 9)
✦ ATR (14)
✦ Multi-Timeframe Trend
✦ Confluence Scoring Algorithm
🚀 Performance Notes:
Optimized for speed and efficiency Minimal CPU usage Clean chart presentation
Limited drawing objects (no chart clutter) Works on all TradingView plans
⚠️ Important Notes:
This indicator is a tool to assist trading decisions, not financial advice Always use proper risk management (1-2% per trade recommended) Backtest on your preferred market and timeframe
Combine with your own analysis and strategy Past performance does not guarantee future results
🔔 Alert Setup:
Right-click indicator name → "Add Alert" → Choose:
"Bullish Confluence Signal" for buy setups
"Bearish Confluence Signal" for sell setups
"Volume Spike Alert" for unusual activity
💬 Support:
For questions, suggestions, or custom modifications, feel free to message me directly through TradingView.

NIFTY Options Breakout StrategyThis strategy trades NIFTY 50 Options (CALL & PUT) using 5-minute breakout logic, strict trend filters, expiry-based symbol validation, and a dynamic trailing-profit engine.
1️⃣ Entry Logic
Only trades NIFTY 50 options, filtered automatically by symbol.
Trades only between 10:00 AM – 2:15 PM (5m bars).
Breakout trigger:
Price enters the buy breakout zone (high of last boxLookback bars ± buffer).
Trend filter:
Price must be above EMA50 or EMA200,
AND EMA50 ≥ EMA100 (to avoid weak conditions).
Optional strengthening:
EMA20>EMA50 OR EMA50>EMA100 recent cross can be enforced.
Higher-timeframe trend check:
EMA50 > EMA200 (bullish regime only).
Start trading options only after expiry–2 months (auto-parsed).
2️⃣ One Trade Per Day
Maximum 1 long trade per day.
No shorting (long-only strategy).
3️⃣ Risk Management — SL, TP & Trailing
Includes three types of exits:
🔹 A) Hard SL/TP
Hard Stop-Loss: -15%
Hard Take-Profit: +40%
🔹 B) Step-Ladder Trailing Profit
As the option price rises, trailing activates:
Max Profit Reached Exit Trigger When Falls To
≥ 35% ≤ 30%
≥ 30% ≤ 25%
≥ 25% ≤ 20%
≥ 20% ≤ 15%
≥ 15% ≤ 10%
≥ 5% ≤ 0%
🔹 C) Loss-Recovery Exit
If loss reaches –10% but then recovers to 0%, exit at breakeven.
4️⃣ Trend-Reversal Exit
If price closes below 5m EMA50, the long is exited instantly.
5️⃣ Optional Intraday Exit
EOD square-off at 3:15 PM.
6️⃣ Alerts for Automation
The strategy provides alerts for:
BUY entry
TP/SL/Trailing exit
EMA50 reversal exit
EOD exit

Market Energy & Direction DashboardMarket Energy & Direction Dashboard - Daytrading
Overview
A comprehensive real-time market internals dashboard that combines NYSE TICK, NYSE Advance-Decline (ADD) momentum, VIX direction, and relative volume into a single visual traffic light system with intelligent signal synthesis. Designed for active daytraders who need instant confirmation of market direction and energy based on momentum alignment across all major internals.
What It Does
This indicator synthesizes multiple market internals using directional momentum analysis rather than static thresholds to provide clear, actionable signals:
• Traffic Light System: Single glance confirmation of market state
o Bright Green: Maximum bullish - all internals aligned (TICK + ADD rising + VIX falling + volume)
o Bright Red: Maximum bearish - all internals aligned (TICK + ADD falling + VIX rising + volume)
o Yellow: Exhaustion warning - TICK at extremes, potential reversal imminent
o Moderate Colors: Partial alignment - some confirmation but not complete
o Gray: Choppy, neutral, or conflicting signals
• Real-Time Dashboard displays:
o Current TICK value with exhaustion warnings
o Current ADD with directional momentum indicator (↑ rising = breadth improving, ↓ falling = breadth deteriorating, ± compression)
o VIX level with directional indicator (↓ declining = bullish, ↑ rising = bearish, ± compression = neutral)
o Relative volume (current vs 20-period average)
o Composite status message synthesizing all data into clear directional summary
Key Features
✓ Momentum-based analysis - all indicators show direction/change, not just levels ✓ Intelligent signal hierarchy from "Maximum" to "Moderate" based on internal alignment ✓ ADD directional momentum - catches breadth shifts early, works in all market conditions ✓ VIX directional analysis - shows if fear is increasing, decreasing, or stagnant ✓ Color-coded traffic light for instant decision making ✓ Detects TICK/ADD divergences (conflicting signals = caution) ✓ Exhaustion warnings at extreme TICK levels (±1000+) ✓ Composite status messages - "Maximum Bull", "Strong Bull", "Moderate Bull", etc. ✓ Customizable thresholds for all parameters ✓ Moveable dashboard (9 position options) ✓ Built-in alerts for all signal strengths, exhaustion, and divergences
How To Use
Setup:
1. Add indicator to your main trading chart (SPY, ES, NQ, etc.)
2. Default settings work well for most traders, but you can customize:
o TICK Extreme Level (default 1000)
o ADD Compression Threshold (default 100 - detects when breadth is stagnant)
o VIX Elevated Level (default 20)
o VIX Compression Threshold (default 2% - detects low volatility)
o Volume Threshold (default 1.5x average)
3. Position dashboard wherever convenient on your chart
Reading The Signals:
Signal Hierarchy (Strongest to Weakest):
MAXIMUM SIGNALS ⭐ (Brightest colors - All 4 internals aligned)
• "✓ MAXIMUM BULL": TICK bullish + ADD rising (↑) + VIX falling (↓) + Volume elevated
o This is the holy grail setup - all momentum aligned, highest conviction longs
• "✓ MAXIMUM BEAR": TICK bearish + ADD falling (↓) + VIX rising (↑) + Volume elevated
o Perfect storm bearish - all momentum aligned, highest conviction shorts
STRONG SIGNALS (Bright colors - Core internals aligned)
• "✓ STRONG BULL": TICK bullish + ADD rising (↑)
o Strong confirmation even without VIX/volume - breadth supporting the move
• "✓ STRONG BEAR": TICK bearish + ADD falling (↓)
o Strong confirmation - both momentum and breadth deteriorating
MODERATE SIGNALS (Faded colors - Partial confirmation)
• "MODERATE BULL": TICK bullish but ADD not confirming direction
o Proceed with caution - momentum present but breadth questionable
• "MODERATE BEAR": TICK bearish but ADD not confirming direction
o Proceed with caution - selling but breadth not fully participating
WARNING SIGNALS
• "⚠ EXHAUSTION" (Yellow): TICK at ±1000+ extremes
o Potential reversal zone - prepare to fade or take profits
o Often marks blow-off tops or capitulation bottoms
NEUTRAL/AVOID
• "CHOPPY/NEUTRAL" (Gray): Conflicting signals or low conviction
o Stay out or reduce size significantly
Individual Indicator Interpretation:
TICK:
• Green: Bullish momentum (>+300)
• Red: Bearish momentum (<-300)
• Yellow: Exhaustion (±1000+)
• Gray: Neutral
ADD (Advance-Decline):
• Green (↑): Breadth improving - more stocks participating in the move
• Red (↓): Breadth deteriorating - fewer stocks participating
• Gray (±): Breadth stagnant - no clear participation trend
VIX:
• Green (↓): Fear declining - healthy environment for rallies
• Red (↑): Fear rising - risk-off mode, supports downward moves
• Gray (±): Volatility compression - often precedes explosive moves
Volume:
• Green: High conviction (>1.5x average)
• Gray: Low conviction
Trading Strategy:
1. Wait for "MAXIMUM" or "STRONG" signals for highest probability entries
o Maximum signals = go full size with confidence
o Strong signals = good conviction, normal position sizing
2. Confirm directional alignment:
o For longs: Want ADD ↑ (rising) and VIX ↓ (falling)
o For shorts: Want ADD ↓ (falling) and VIX ↑ (rising)
3. Use exhaustion warnings (yellow) to:
o Take profits on existing positions
o Prepare counter-trend entries
o Tighten stops
4. Avoid "MODERATE" signals unless you have strong conviction from other analysis
o These work best as confirmation for existing setups
o Not strong enough to initiate new positions alone
5. Never trade "CHOPPY/NEUTRAL" signals
o Gray means stay out - preserve capital
o Wait for clear alignment
6. Watch for divergences:
o Price making new highs but ADD ↓ (falling) = distribution warning
o Price making new lows but ADD ↑ (rising) = potential bottom
o Divergence alert will notify you
Best Practices:
• Use on 1-5 minute charts for daytrading
• Combine with your price action or technical setup (support/resistance, trendlines, patterns)
• The dashboard confirms when to take your setup, not what setup to take
• Most effective during regular market hours (9:30 AM - 4:00 PM ET) when volume is present
• The strongest edge comes from "MAXIMUM" signals - wait for these for best risk/reward
• Pay special attention to ADD direction - it's the most predictive breadth indicator
• VIX compression (gray ±) often signals upcoming volatility expansion - prepare for bigger moves
Customization Option
All thresholds are adjustable in settings:
• TICK Extreme: Higher = fewer exhaustion warnings (try 1200-1500 for less sensitivity)
• ADD Compression Threshold: Change detection sensitivity
o Default 100 = balanced
o Lower (50) = more sensitive to small breadth changes
o Higher (200-300) = only shows major breadth shifts
• VIX Elevated: Adjust for current volatility regime (15-25 typical range)
• VIX Compression Threshold:
o Default 2% = balanced
o Lower (0.5-1%) = catches subtle VIX changes
o Higher (3-5%) = only shows significant VIX moves
• Volume Threshold: Lower for quieter stocks/times, higher for more confirmation
Alerts Available
• Maximum Bullish: All 4 internals aligned bullish (TICK + ADD↑ + VIX↓ + Volume)
• Maximum Bearish: All 4 internals aligned bearish (TICK + ADD↓ + VIX↑ + Volume)
• Strong Bullish: TICK bullish + ADD rising
• Strong Bearish: TICK bearish + ADD falling
• Exhaustion Warning: TICK at extreme levels
• Divergence Warning: TICK and ADD directions conflicting
Understanding the Signal Synthesis
The indicator uses intelligent logic to combine all internals:
"MAXIMUM" Signals require:
• TICK direction (bullish/bearish)
• ADD momentum (rising/falling) in same direction
• VIX direction (falling for bulls, rising for bears)
• Volume elevated (>1.5x average)
"STRONG" Signals require:
• TICK direction (bullish/bearish)
• ADD momentum (rising/falling) in same direction
• (VIX and volume are bonuses but not required)
"MODERATE" Signals:
• TICK showing direction
• But ADD not confirming or contradicting
• Weakest actionable signal
This hierarchy ensures you know exactly how much conviction the market has behind any move.
Technical Details
• Pulls real-time data from NYSE TICK (USI:TICK), NYSE ADD (USI:ADD), and CBOE VIX
• ADD direction calculated using bar-to-bar change with compression detection
• VIX direction calculated using bar-to-bar percentage change
• Volume calculation uses 20-period simple moving average
• Dashboard updates every bar
• No repainting - all calculations based on closed bar data
Who This Is For
• Active daytraders of stocks, futures (ES/NQ), and options
• Scalpers needing quick directional confirmation with multiple internal alignment
• Swing traders looking to time intraday entries with maximum confluence
• Volatility traders who monitor VIX behavior
• Market makers and professionals who trade based on breadth and internals
• Anyone who monitors market internals but wants intelligent synthesis vs raw data
Tips For Success
Trading Philosophy:
• Quality over quantity - wait for "MAXIMUM" signals for best results
• One "MAXIMUM" signal trade is worth five "MODERATE" signal trades
• Gray/neutral is not a sign of missing opportunity - it's protecting your capital
Signal Confidence Levels:
1. MAXIMUM (95%+ confidence) - Trade these aggressively with full size
2. STRONG (80-85% confidence) - Trade these with normal position sizing
3. MODERATE (60-70% confidence) - Only if confirmed by strong technical setup
4. CHOPPY/NEUTRAL - Do not trade, wait for clarity
Advanced Techniques:
• Breadth divergences: Watch for price making new highs while ADD shows ↓ (falling) = major warning
• VIX/Price divergences: Rallies with rising VIX (↑) are usually false moves
• Volume confirmation: "MAXIMUM" signals with 2x+ volume are the absolute best
• Compression zones: When both ADD and VIX show compression (±), expect explosive breakout soon
• Sequential signals: Back-to-back "MAXIMUM" signals in same direction = strong trending day
Common Patterns:
• Opening surge with "MAXIMUM BULL" that shifts to "EXHAUSTION" (yellow) = fade the high
• Selloff with "MAXIMUM BEAR" followed by ADD ↑ (rising) divergence = potential reversal
• Choppy morning followed by "MAXIMUM" signal afternoon = best trending opportunity
Example Scenarios
Perfect Bull Entry:
• Bright green signal box
• TICK: +650
• ADD: +1200 (↑)
• VIX: 18.30 (↓)
• Volume: 2.3x
• Status: "✓ MAXIMUM BULL" → ALL SYSTEMS GO - Take aggressive long positions
Strong Bull (Good Confidence):
• Green signal box (slightly less bright)
• TICK: +500
• ADD: +800 (↑)
• VIX: 19.50 (±)
• Volume: 1.2x
• Status: "✓ STRONG BULL" → Good long setup - breadth confirming even without VIX/volume
Caution Bull (Moderate):
• Faded green signal box
• TICK: +400
• ADD: +900 (↓)
• VIX: 20.10 (↑)
• Volume: 0.9x
• Status: "MODERATE BULL" → CAUTION - TICK bullish but breadth deteriorating and VIX rising = weak rally
Exhaustion Warning:
• Yellow signal box
• TICK: +1350 ⚠
• ADD: +2100 (↑)
• VIX: 17.20 (↓)
• Volume: 1.8x
• Status: "⚠ EXHAUSTION" → Take profits or prepare to fade - TICK overextended despite good internals
Divergence Setup (Potential Reversal):
• Faded green signal
• TICK: +300
• ADD: +1800 (↓)
• VIX: 21.50 (↑)
• Volume: 1.6x
• Status: "MODERATE BULL" → WARNING - Price rallying but breadth collapsing and fear rising = distribution
Perfect Bear Entry:
• Bright red signal box
• TICK: -780
• ADD: -1600 (↓)
• VIX: 24.80 (↑)
• Volume: 2.5x
• Status: "✓ MAXIMUM BEAR" → Perfect short setup - all momentum bearish with conviction
Compression (Wait Mode):
• Gray signal box
• TICK: +50
• ADD: -200 (±)
• VIX: 16.40 (±)
• Volume: 0.7x
• Status: "CHOPPY/NEUTRAL" → STAY OUT - Volatility compression, no conviction, await breakout
Performance Optimization
Best Market Conditions:
• Works excellent in trending markets (up or down)
• Particularly powerful during high-volume sessions (first/last hours)
• "MAXIMUM" signals most reliable during 9:45-11:00 AM and 2:00-3:30 PM ET
Less Effective During:
• Lunch period (11:30 AM - 1:30 PM) - lower volume reduces signal quality
• Low-volatility environments - compression signals dominate
• Major news events in first 5 minutes - wait for internals to stabilize
Recommended Use Cases:
• Scalping: Trade only "MAXIMUM" signals for quick 5-15 minute moves
• Daytrading: Use "MAXIMUM" and "STRONG" signals for position entries
• Swing entries: Use "MAXIMUM" signals for optimal intraday entry timing
• Exit timing: Use "EXHAUSTION" (yellow) warnings to take profits
________________________________________
Pro Tip: Create a dedicated workspace with this indicator on SPY/ES/NQ charts. Set alerts for "MAXIMUM BULL", "MAXIMUM BEAR", and "EXHAUSTION" signals. Most professional traders only trade the "MAXIMUM" setups and ignore everything else - this alone can dramatically improve win rates.

ULTIMATE ORDER FLOW SYSTEM🔥 ULTIMATE ORDER FLOW SYSTEM
Overview
This comprehensive order flow analysis tool combines **Volume Profile**, **Cumulative Delta**, and **Large Order Detection** to identify high-probability trading setups. The script analyzes institutional order flow patterns and volume distribution to pinpoint key levels where price is likely to react.
📊 Core Components & Methodology
🔥 ULTIMATE ORDER FLOW SYSTEM
Overview
This comprehensive order flow analysis tool combines Volume Profile, Cumulative Delta, and Large Order Detection to identify high-probability trading setups. The script analyzes institutional order flow patterns and volume distribution to pinpoint key levels where price is likely to react.
________________________________________
📊 Core Components & Methodology
1. Volume Profile Analysis
The script constructs a horizontal volume profile by:
• Dividing the price range into configurable rows (default: 20)
• Accumulating volume at each price level over a lookback period (default: 50 bars)
• Separating buy volume (green bars close > open) from sell volume (red bars)
• Identifying three critical levels:
o POC (Point of Control): Price level with highest traded volume - acts as a strong magnet
o VAH/VAL (Value Area High/Low): Contains 70% of total volume - defines fair value zone
o HVN (High Volume Nodes): Resistance zones where institutions accumulated positions
o LVN (Low Volume Nodes): Thin zones that price moves through quickly - ideal targets
Why This Matters: Institutional traders leave footprints through volume. HVN zones show where large players defended levels, making them reliable support/resistance.
________________________________________
2. Cumulative Delta (Order Flow)
Tracks the running total of buying vs selling pressure:
• Bar Delta: Difference between buy and sell volume per candle
• Cumulative Delta: Sum of all bar deltas - shows net directional pressure
• Delta Moving Average: Smoothed delta (20-period) to identify trend
• Delta Divergences:
o Bullish: Price makes lower low, but delta makes higher low (absorption at bottom)
o Bearish: Price makes higher high, but delta makes lower high (exhaustion at top)
How It Works: When cumulative delta trends up while price consolidates, it signals accumulation. Delta divergences reveal when smart money is positioned opposite to retail expectations.
________________________________________
3. Large Order Detection
Identifies institutional-sized orders in real-time:
• Compares current bar volume to 20-period moving average
• Flags orders exceeding 2.5x average volume (configurable multiplier)
• Distinguishes bullish (green circles below) vs bearish (red circles above) large orders
Rationale: Sudden volume spikes at key levels indicate institutional participation - the "fuel" needed for breakouts or reversals.
________________________________________
🎯 Trading Signal Logic
Combined Setup Criteria
The script generates SHORT and LONG signals when multiple conditions align:
SHORT Signal Requirements:
1. Price reaches an HVN resistance zone (within 0.2%)
2. Large sell order detected (volume spike + red candle)
3. Cumulative delta is bearish OR bearish divergence present
4. 10-bar cooldown between signals (prevents overtrading)
LONG Signal Requirements:
1. Price reaches an HVN support zone
2. Large buy order detected (volume spike + green candle)
3. Cumulative delta is bullish OR bullish divergence present
4. 10-bar cooldown enforced
________________________________________
🔧 Customization Options
Setting - Purpose - Recommendation
Volume Profile Rows - Granularity of level detection - 20 (balanced)
Lookback Period - Historical data analyzed - 50 bars (intraday), 200 (swing)
Large Order Multiplier - Sensitivity to volume spikes - 2.5x (standard), 3.5x (conservative)
HVN Threshold - Resistance zone detection - 1.3 (default)
LVN Threshold - Target zone identification - 0.6 (default)
Divergence Lookback - Pivot detection period - 5 bars (responsive)
________________________________________
📈 Dashboard Indicators
The real-time panel displays:
• POC: Current Point of Control price
• Location: Whether price is at HVN resistance
• Orders: Current large buy/sell activity
• Cumulative Δ: Net order flow value + trend direction
• Divergence: Active bullish/bearish divergences
• Bar Strength: % of candle volume that's directional (>65% = strong)
• SETUP: Current trade signal (LONG/SHORT/WAIT)
________________________________________
🎨 Visual System
• Yellow POC Line: Highest volume level - primary pivot
• Blue Value Area Box: Fair value zone (VAH to VAL)
• Red HVN Zones: Resistance/support from institutional accumulation
• Green LVN Zones: Low-liquidity targets for quick moves
• Volume Bars: Green (buy pressure) vs Red (sell pressure) distribution
• Triangles: LONG (green up) and SHORT (red down) entry signals
• Diamonds: Divergence warnings (cyan=bullish, fuchsia=bearish)
________________________________________
💡 How This Script Is Unique
Unlike standalone volume profile or delta indicators, this script:
1. Synthesizes three complementary methods - volume structure, order flow momentum, and liquidity detection
2. Requires multi-factor confirmation - signals only trigger when price, volume, and delta align at key zones
3. Adapts to market regime - delta filters ensure you're trading with the dominant order flow direction
4. Provides context, not just signals - the dashboard helps you understand why a setup is forming
________________________________________
⚙️ Best Practices
Timeframes:
• 5-15 min: Scalping (use 30-50 bar lookback)
• 1-4 hour: Swing trading (use 100-200 bar lookback)
Risk Management:
• Enter on signal candle close
• Stop loss: Beyond nearest HVN/LVN zone
• Target 1: Next LVN level
• Target 2: Opposite value area boundary
Filters:
• Avoid signals during major news events
• Require bar delta strength >65% for aggressive entries
• Wait for delta MA cross confirmation in ranging markets
________________________________________
🚨 Alerts Available
• Long Setup Trigger
• Short Setup Trigger
• Bullish/Bearish Divergence Detection
• Large Buy/Sell Order Execution
________________________________________
📚 Educational Context
This methodology is based on principles used by professional order flow traders:
• Market Profile Theory: Volume distribution reveals fair value
• Tape Reading: Large orders show institutional intent
• Auction Theory: Price seeks areas of liquidity imbalance (LVN zones)
The script automates pattern recognition that discretionary traders spend years learning to identify manually.
________________________________________
⚠️ Disclaimer
This indicator is a trading tool, not a trading system. It identifies high-probability setups based on order flow analysis but requires proper risk management, market context, and trader discretion. Past performance does not guarantee future results.
________________________________________
Version: 6 (Pine Script)
Type: Overlay + Separate Pane (Delta Panel)
Resource Usage: Moderate (500 bars history, 500 lines/boxes)
________________________________________
For questions or support, please comment below. If you find this script valuable, please boost and favorite! 🚀
1. Volume Profile Analysis
The script constructs a horizontal volume profile by:
- Dividing the price range into configurable rows (default: 20)
- Accumulating volume at each price level over a lookback period (default: 50 bars)
- Separating buy volume (green bars close > open) from sell volume (red bars)
- Identifying three critical levels:
- POC (Point of Control): Price level with highest traded volume - acts as a strong magnet
- VAH/VAL (Value Area High/Low): Contains 70% of total volume - defines fair value zone
- HVN (High Volume Nodes): Resistance zones where institutions accumulated positions
- LVN (Low Volume Nodes): Thin zones that price moves through quickly - ideal targets
Why This Matters: Institutional traders leave footprints through volume. HVN zones show where large players defended levels, making them reliable support/resistance.
---
2. Cumulative Delta (Order Flow)
Tracks the running total of buying vs selling pressure:
- **Bar Delta**: Difference between buy and sell volume per candle
- **Cumulative Delta**: Sum of all bar deltas - shows net directional pressure
- **Delta Moving Average**: Smoothed delta (20-period) to identify trend
- **Delta Divergences**:
- **Bullish**: Price makes lower low, but delta makes higher low (absorption at bottom)
- **Bearish**: Price makes higher high, but delta makes lower high (exhaustion at top)
**How It Works**: When cumulative delta trends up while price consolidates, it signals accumulation. Delta divergences reveal when smart money is positioned opposite to retail expectations.
---
### 3. **Large Order Detection**
Identifies **institutional-sized orders** in real-time:
- Compares current bar volume to 20-period moving average
- Flags orders exceeding 2.5x average volume (configurable multiplier)
- Distinguishes bullish (green circles below) vs bearish (red circles above) large orders
**Rationale**: Sudden volume spikes at key levels indicate institutional participation - the "fuel" needed for breakouts or reversals.
---
## 🎯 Trading Signal Logic
### Combined Setup Criteria
The script generates **SHORT** and **LONG** signals when multiple conditions align:
**SHORT Signal Requirements:**
1. Price reaches an HVN resistance zone (within 0.2%)
2. Large sell order detected (volume spike + red candle)
3. Cumulative delta is bearish OR bearish divergence present
4. 10-bar cooldown between signals (prevents overtrading)
**LONG Signal Requirements:**
1. Price reaches an HVN support zone
2. Large buy order detected (volume spike + green candle)
3. Cumulative delta is bullish OR bullish divergence present
4. 10-bar cooldown enforced
---
## 🔧 Customization Options
| Setting | Purpose | Recommendation |
|---------|---------|----------------|
| **Volume Profile Rows** | Granularity of level detection | 20 (balanced) |
| **Lookback Period** | Historical data analyzed | 50 bars (intraday), 200 (swing) |
| **Large Order Multiplier** | Sensitivity to volume spikes | 2.5x (standard), 3.5x (conservative) |
| **HVN Threshold** | Resistance zone detection | 1.3 (default) |
| **LVN Threshold** | Target zone identification | 0.6 (default) |
| **Divergence Lookback** | Pivot detection period | 5 bars (responsive) |
---
## 📈 Dashboard Indicators
The real-time panel displays:
- **POC**: Current Point of Control price
- **Location**: Whether price is at HVN resistance
- **Orders**: Current large buy/sell activity
- **Cumulative Δ**: Net order flow value + trend direction
- **Divergence**: Active bullish/bearish divergences
- **Bar Strength**: % of candle volume that's directional (>65% = strong)
- **SETUP**: Current trade signal (LONG/SHORT/WAIT)
---
## 🎨 Visual System
- **Yellow POC Line**: Highest volume level - primary pivot
- **Blue Value Area Box**: Fair value zone (VAH to VAL)
- **Red HVN Zones**: Resistance/support from institutional accumulation
- **Green LVN Zones**: Low-liquidity targets for quick moves
- **Volume Bars**: Green (buy pressure) vs Red (sell pressure) distribution
- **Triangles**: LONG (green up) and SHORT (red down) entry signals
- **Diamonds**: Divergence warnings (cyan=bullish, fuchsia=bearish)
---
## 💡 How This Script Is Unique
Unlike standalone volume profile or delta indicators, this script:
1. **Synthesizes three complementary methods** - volume structure, order flow momentum, and liquidity detection
2. **Requires multi-factor confirmation** - signals only trigger when price, volume, and delta align at key zones
3. **Adapts to market regime** - delta filters ensure you're trading with the dominant order flow direction
4. **Provides context, not just signals** - the dashboard helps you understand *why* a setup is forming
---
## ⚙️ Best Practices
**Timeframes:**
- 5-15 min: Scalping (use 30-50 bar lookback)
- 1-4 hour: Swing trading (use 100-200 bar lookback)
**Risk Management:**
- Enter on signal candle close
- Stop loss: Beyond nearest HVN/LVN zone
- Target 1: Next LVN level
- Target 2: Opposite value area boundary
**Filters:**
- Avoid signals during major news events
- Require bar delta strength >65% for aggressive entries
- Wait for delta MA cross confirmation in ranging markets
---
## 🚨 Alerts Available
- Long Setup Trigger
- Short Setup Trigger
- Bullish/Bearish Divergence Detection
- Large Buy/Sell Order Execution
---
## 📚 Educational Context
This methodology is based on principles used by professional order flow traders:
- **Market Profile Theory**: Volume distribution reveals fair value
- **Tape Reading**: Large orders show institutional intent
- **Auction Theory**: Price seeks areas of liquidity imbalance (LVN zones)
The script automates pattern recognition that discretionary traders spend years learning to identify manually.
---
## ⚠️ Disclaimer
This indicator is a **trading tool, not a trading system**. It identifies high-probability setups based on order flow analysis but requires proper risk management, market context, and trader discretion. Past performance does not guarantee future results.
---
**Version**: 6 (Pine Script)
**Type**: Overlay + Separate Pane (Delta Panel)
**Resource Usage**: Moderate (500 bars history, 500 lines/boxes)
---
*For questions or support, please comment below. If you find this script valuable, please boost and favorite!* 🚀

NICHI Beta (NuwenPham's Ichimoku)# **NuwenPham’s Ichimoku (NICHI)**
**Version BETA.251123a.3.1.2 – Pine Script v6**
**Author:** NuwenPham
**Forked from:** Donovan Wall
**Contributors:** Claude (Anthropic)
**License:** MPL 2.0
---
# **Overview**
**NICHI (Nuwen’s Ichimoku)** is a next-generation Ichimoku system that merges the classical Hosoda Ichimoku with a modular adaptive-smoothing engine, enhanced Kumo logic, directional trend counters, and multi-mode bar coloring.
The indicator includes **two completely separate Ichimoku engines**:
* **Standard Ichimoku** – Traditional Donchian-based Tenkan, Kijun, Senkou A/B, and Chikou
* **Advanced Ichimoku** – Fully customizable Ichimoku using 15+ moving-average filters and enhanced logic
NICHI is designed for modern markets—especially **futures and volatile instruments** (NG, CL, ES, NQ, crypto).
---
# **Key Features**
## **1. Dual Ichimoku Systems**
* **Standard Mode:**
Classic Donchian Ichimoku with Tenkan, Kijun, Senkou A/B, and Chikou.
Clean, faithful implementation.
* **Advanced Mode:**
Every Ichimoku line uses a **selected smoothing filter** (EMA, KAMA, FRAMA, Hull, McGinley, etc.).
Includes directional persistence tracking, enhanced cloud logic, and adaptive bar coloring.
---
## **2. Advanced Filter Engine (15+ Smooth Types)**
Use any of the following for Tenkan, Kijun, Senkou B, or Chikou:
* EMA
* DEMA
* SMA
* SMMA (RMA)
* WMA
* VWMA
* Hull MA
* ALMA
* LSMA (Linear Regression)
* McGinley Dynamic
* KAMA
* FRAMA
* COVWMA
* Moving Median
* 50th Percentile (Nearest Rank)
This transforms Ichimoku into an **adaptive trend system**.
---
## **3. Enhanced Cloud (Kumo) Modeling**
* Independent forward offsets for Span A & Span B
* Cloud colors adapt based on strength, direction, and filter behavior
* Cloud thickness reflects volatility
* Neutral cloud state available when spans disagree
---
## **4. Directional Persistence Counters**
NICHI tracks the **trend streak** of each main component:
* Tenkan rising/falling
* Kijun rising/falling
* Span A rising/falling
* Span B rising/falling
These counters make cloud and line colors more accurate and stable.
---
## **5. Regime-Based Bar Coloring (3 Modes)**
NICHI includes three built-in trading frameworks:
### **Mode 1: Kumo-Based**
Bar color reflects price relative to the cloud:
* Green = Above Kumo
* Red = Below Kumo
* Orange = Inside Kumo
Ideal for **trend-following** and **market regime detection**.
---
### **Mode 2: Tenkan/Kijun-Based**
Bar color reflects momentum structure:
* Green = Price above both Tenkan & Kijun
* Red = Price below both
Designed for **momentum entries and TK breakouts**.
---
### **Mode 3: Chikou-Based**
Bars reflect historical confirmation:
* Green = Chikou > price (offset period)
* Red = Chikou < price
Excellent for **confirmation-first strategies** where accuracy matters most.
---
## **6. Multi-MA Overlay System**
Up to **four optional moving averages**:
* SMA, EMA, SMMA, WMA, HMA, VWMA
* Independent lengths, widths, colors
* Useful for bias, confluence, trend filters
Default: **SMA 200** enabled.
---
## **7. TK Cross Signals**
Both systems show TK crosses:
* Standard TK Cross (classic)
* Advanced TK Cross (filtered version)
Crosses appear with clear markers for entry/exit logic.
---
# **How to Use NICHI**
## **1. Choose Your Engine**
* **Standard:** Clean, classic Ichimoku
* **Advanced:** Adaptive, filter-driven Ichimoku
* **Both:** Comparative analysis
---
## **2. Select Your Filter Type (Advanced Mode)**
Suggested filters:
| Market | Filter Type | Notes |
| ---------------- | ---------------- | -------------------------- |
| Natural Gas (NG) | KAMA or FRAMA | Handles extreme volatility |
| Crude Oil (CL) | McGinley Dynamic | Smooths spikes |
| ES / NQ | SMMA or WMA | Balanced response |
| Crypto | Hull or ALMA | Handles momentum bursts |
| FX | EMA or SMMA | Classic, stable |
---
## **3. Choose a Bar-Color Strategy**
* **Kumo-Based:** Trend following
* **TK-Based:** Momentum and breakouts
* **Chikou-Based:** Highest confirmation/accuracy
Each strategy is valid and intentionally distinct.
---
## **4. Reading the Cloud**
* **Bullish Cloud:** Span A > Span B
* **Bearish Cloud:** Span A < Span B
* **Neutral Cloud:** Disagreement between spans
* **Thick Cloud:** High volatility / stronger structure
* **Thin Cloud:** Weak trend / potential twist
---
## **5. Entry & Exit Concepts**
### **Entries**
* **Momentum Entry:** TK cross with price above the cloud
* **Reversal Entry:** TK cross before a cloud twist
* **Confirmation Entry:** Chikou breaks cleanly above/below past price
### **Exits**
* Price falling through Kijun
* Re-entering the cloud
* Opposite TK cross
* Cloud flipping against position
---
# **Recommended Trading Approaches**
## **Kumo-Based Trend Strategy**
* Long above cloud, short below
* Avoid signals inside cloud
Best for swing/position trading.
---
## **TK-Based Momentum Strategy**
* Enter on Tenkan/Kijun breakout
* Bar color confirms momentum
* Cloud filter optional but helps
Great for high-velocity markets.
---
## **Chikou-Based Confirmation Strategy**
* Enter only when Chikou confirms structure
* Highest accuracy, fewest trades
* Ideal for volatile markets (NG, CL)
---
# **Closing Notes**
NICHI is a **research-grade Ichimoku framework** designed to handle modern volatility where traditional Ichimoku often fails.
It supports scalpers, swing traders, and system developers alike.
Experiment with:
* Filter types
* Cloud offsets
* Bar-color modes
* MA overlays
to match your strategy and market.
Time-Decay Liquidity Zones [BackQuant]Time-Decay Liquidity Zones
A dynamic liquidity map that turns single-bar exhaustion events into fading, color-graded zones, so you can see where trapped traders and unfinished business still matter, and when those areas have finally stopped pulling price.
What this is
This indicator detects unusually strong impulsive moves into wicks, converts them into supply or demand “zones,” then lets those zones decay over time. Each zone carries a strength score that fades bar by bar. Zones that stop attracting or rejecting price are gradually de-emphasized and eventually removed, while the most relevant areas stay bright and obvious.
Instead of static rectangles that live forever, you get a living liquidity map where:
Zones are born from objective criteria: volatility, wick size, and optional volume spikes.
Zones “age” using a configurable decay factor and maximum lifetime.
Zone color and opacity reflect current relative strength on a unified clear → green → red gradient.
Zones freeze when broken, so you can distinguish “active reaction areas” from “historical levels that have already given way”.
Conceptual idea
Large wicks with strong volatility often mark areas where aggressive orders met hidden liquidity and got absorbed. Price may revisit these areas to test leftover interest or to relieve trapped positions. However, not every wick matters for long. As time passes and more bars print, the market “forgets” some areas.
Time-Decay Liquidity Zones turns that idea into a rule-based system:
Find bars that likely reflect strong aggressive flows into liquidity.
Mark a zone around the wick using ATR-based thickness.
Assign a strength score of 1.0 at birth.
Each bar, reduce that score by a decay factor and remove zones that fall below a threshold or live too long.
Color all surviving zones from weak to strong using a single gradient scale and a visual legend.
How events are detected
Detection lives in the Event Detection group. The script combines range, wick size, and optional volume filters into simple rules.
Volatility filter
ATR Length — computes a rolling ATR over your chosen window. This is the volatility baseline.
Min range in ATRs — bar range (High–Low) must exceed this multiple of ATR for an event to be considered. This avoids tiny bars triggering zones.
Wick filters
For each bar, the script splits the candle into body and wicks:
Upper wick = High minus the max(Open, Close).
Lower wick = min(Open, Close) minus Low.
Then it tests:
Upper wick condition — upper wick must be larger than Min wick size in ATRs × ATR.
Lower wick condition — lower wick must be larger than Min wick size in ATRs × ATR.
Only bars with a sufficiently long wick relative to volatility qualify as candidate “liquidity events”.
Volume filter
Optionally, the script requires a volume spike:
Use volume filter — if enabled, volume must exceed a rolling volume SMA by a configurable multiplier.
Volume SMA length — period for the volume average.
Volume spike multiplier — how many times above the SMA current volume needs to be.
This lets you focus only on “heavy” tests of liquidity and ignore quiet bars.
Event types
Putting it together:
Upper event (potential supply / long liquidation, etc.)
Occurs when:
Upper wick is large in ATR terms.
Full bar range is large in ATR terms.
Volume is above the spike threshold (if enabled).
Lower event (potential demand / short liquidation, etc.)
Symmetric conditions using the lower wick.
How zones are constructed
Zone geometry lives in Zone Geometry .
When an event is detected, the script builds a rectangular box that anchors to the wick and extends in the appropriate direction by an ATR-based thickness.
For upper (supply-type) zones
Bottom of the zone = event bar high.
Top of the zone = event bar high + Zone thickness in ATRs × ATR.
The zone initially spans only the event bar on the x-axis, but is extended to the right as new bars appear while the zone is active.
For lower (demand-type) zones
Top of the zone = event bar low.
Bottom of the zone = event bar low − Zone thickness in ATRs × ATR.
Same extension logic: box starts on the event bar and grows rightward while alive.
The result is a band around the wick that scales with volatility. On high-ATR charts, zones are thicker. On calm charts, they are narrower and more precise.
Zone lifecycle, decay, and removal
All lifecycle logic is controlled by the Decay & Lifetime group.
Each zone carries:
Score — a floating-point “importance” measure, starting at 1.0 when created.
Direction — +1 for upper zones, −1 for lower zones.
Birth index — bar index at creation time.
Active flag — whether the zone is still considered unbroken and extendable.
1) Active vs broken
Each confirmed bar, the script checks:
For an upper zone , the zone is counted as “broken” when the close moves above the top of the zone.
For a lower zone , the zone is counted as “broken” when the close moves below the bottom of the zone.
When a zone breaks:
Its right edge is frozen at the previous bar (no further extension).
The zone remains on the chart, but is no longer updated by price interaction. It still decays in score until removal.
This lets you see where a major level was overrun, while naturally fading its influence over time.
2) Time decay
At each confirmed bar:
Score := Score × Score decay per bar .
A decay value close to 1.0 means very slow decay and long-lived zones.
Lower values (closer to 0.9) mean faster forgetting and more current-focused zones.
You are controlling how quickly the market “forgets” past events.
3) Age and score-based removal
Zones are removed when either:
Age in bars exceeds Max bars a zone can live .
This is a hard lifetime cap.
Score falls below Minimum score before removal .
This trims zones that have decayed into irrelevance even if their age is still within bounds.
When a zone is removed, its box is deleted and all associated state is freed to keep performance and visuals clean.
Unified gradient and color logic
Color control lives in Gradient & Color . The indicator uses a single continuous gradient for all zones, above and below price, so you can read strength at a glance without guessing what palette means what.
Base colors
You set:
Mid strength color (green) — used for mid-level strength zones and as the “anchor” in the gradient.
High strength color (red) — used for the strongest zones.
Max opacity — the maximum visual opacity for the solid part of the gradient. Lower values here mean more solid; higher values mean more transparent.
The script then defines three internal points:
Clear end — same as mid color, but with a high alpha (close to transparent).
Mid end — mid color at the strongest allowed opacity.
High end — high color at the strongest allowed opacity.
Strength normalization
Within each update:
The script finds the maximum score among all existing zones.
Each zone’s strength is computed as its score divided by this maximum.
Strength is clamped into .
This means a zone with strength 1.0 is currently the strongest zone on the chart. Other zones are colored relative to that.
Piecewise gradient
Color is assigned in two stages:
For strength between 0.0 and 0.5: interpolate from “clear” green to solid green.
Weak zones are barely visible, mid-strength zones appear as solid green.
For strength between 0.5 and 1.0: interpolate from solid green to solid red.
The strongest zones shift toward the red anchor, clearly separating them from everything else.
Strength scale legend
To make the gradient readable, the indicator draws a vertical legend on the right side of the chart:
About 15 cells from top (Strong) to bottom (Weak).
Each cell uses the same gradient function as the zones themselves.
Top cell is labeled “Strong”; bottom cell is labeled “Weak”.
This legend acts as a fixed reference so you can instantly map a zone’s color to its approximate strength rank.
What it plots
At a glance, the indicator produces:
Upper liquidity zones above price, built from large upper wick events.
Lower liquidity zones below price, built from large lower wick events.
All zones colored by relative strength using the same gradient.
Zones that freeze when price breaks them, then fade out via decay and removal.
A strength scale legend on the right to interpret the gradient.
There are no extra lines, labels, or clutter. The focus is the evolving structure of liquidity zones and their visual strength.
How to read the zones
Bright red / bright green zones
These are your current “major” liquidity areas. They have high scores relative to other zones and have not yet decayed. Expect meaningful reactions, absorption attempts, or spillover moves when price interacts with them.
Faded zones
Pale, nearly transparent zones are either old, decayed, or minor. They can still matter, but priority is lower. If these are in the middle of a long consolidation, they often become background noise.
Broken but still visible zones
Zones whose extension has stopped have been overrun by closing price. They show where a key level gave way. You can use them as context for regime shifts or failed attempts.
Absence of zones
A chart with few or no zones means that, under your current thresholds, there have not been strong enough liquidity events recently. Either tighten the filters or accept that recent price action has been relatively balanced.
Use cases
1) Intraday liquidity hunting
Run the indicator on lower timeframes (e.g., 1–15 minute) with moderately fast decay.
Use the upper zones as potential sell reaction areas, the lower zones as potential buy reaction areas.
Combine with order flow, CVD, or footprint tools to see whether price is absorbing or rejecting at each zone.
2) Swing trading context
Increase ATR length and range/wick multipliers to focus only on major spikes.
Set slower decay and higher max lifetime so zones persist across multiple sessions.
Use these zones as swing inflection areas for larger setups, for example anticipating re-tests after breakouts.
3) Stop placement and invalidation
For longs, place invalidation beyond a decaying lower zone rather than in the middle of noise.
For shorts, place invalidation beyond strong upper zones.
If price closes through a strong zone and it freezes, treat that as additional evidence your prior bias may be wrong.
4) Identifying trapped flows
Upper zones formed after violent spikes up that quickly fail can mark trapped longs.
Lower zones formed after violent spikes down that quickly reverse can mark trapped shorts.
Watching how price behaves on the next touch of those zones can hint at whether those participants are being rescued or squeezed.
Settings overview
Event Detection
Use volume filter — enable or disable the volume spike requirement.
Volume SMA length — rolling window for average volume.
Volume spike multiplier — how aggressive the volume spike filter is.
ATR length — period for ATR, used in all size comparisons.
Min wick size in ATRs — minimum wick size threshold.
Min range in ATRs — minimum bar range threshold.
Zone Geometry
Zone thickness in ATRs — vertical size of each liquidity zone, scaled by ATR.
Decay & Lifetime
Score decay per bar — multiplicative decay factor for each zone score per bar.
Max bars a zone can live — hard cap on lifetime.
Minimum score before removal — score cut-off at which zones are deleted.
Gradient & Color
Mid strength color (green) — base color for mid-level zones and the lower half of the gradient.
High strength color (red) — target color for the strongest zones.
Max opacity — controls the most solid end of the gradient (0 = fully solid, 100 = fully invisible).
Tuning guidance
Fast, session-only liquidity
Shorter ATR length (e.g., 20–50).
Higher wick and range multipliers to focus only on extreme events.
Decay per bar closer to 0.95–0.98 and moderate max lifetime.
Volume filter enabled with a decent multiplier (e.g., 1.5–2.0).
Slow, structural zones
Longer ATR length (e.g., 100+).
Moderate wick and range thresholds.
Decay per bar very close to 1.0 for slow fading.
Higher max lifetime and slightly higher min score threshold so only very weak zones disappear.
Noisy, high-volatility instruments
Increase wick and range ATR multipliers to avoid over-triggering.
Consider enabling the volume filter with stronger settings.
Keep decay moderate to avoid the chart getting overloaded with old zones.
Notes
This is a structural and contextual tool, not a complete trading system. It does not account for transaction costs, execution slippage, or your specific strategy rules. Use it to:
Highlight where liquidity has recently been tested hard.
Rank these areas by decaying strength.
Guide your attention when layering in separate entry signals, risk management, and higher-timeframe context.
Time-Decay Liquidity Zones is designed to keep your chart focused on where the market has most recently “cared” about price, and to gradually forget what no longer matters. Adjust the detection, geometry, decay, and gradient to fit your product and timeframe, and let the zones show you which parts of the tape still have unfinished business.

Advanced Triple Strategy ScalperHere are the three scalping strategies presented in the video "3 Scalping Strategies That Work Every Day (Backtested & Proven)" by Asia Forex Mentor – Ezekiel Chew:
### Scalper’s Trend Filter (Triple EMA)
This strategy uses three EMAs (25, 50, 100) on the 5-minute chart to filter high-probability trades aligned with momentum .
- Only trade when all three EMAs are angled in the same direction and clearly separated (no crossing or tangling) .
- Enter when price pulls back toward the 25 or 50 EMA and then bounces back toward the 25 EMA, but do not enter if price closes below the 100 EMA .
- Set stop-loss just below the 50 EMA or swing low and aim for a risk-to-reward ratio of 1:1.5 .
### Flip Zone Trap (Reversal Catching)
This method identifies precise reversal moments where market structure shifts from weakness to strength .
- Use the 15-min chart to locate key support or resistance zones where price previously reacted .
- Wait for price to stop making lower lows and begin making higher highs (or vice versa for shorts); confirm with a trendline break AND follow-through (higher lows & highs within 5-7 candles) .
- Use confirmation candles (bullish engulfing, pin bar rejection) at the zone before entry .
### Liquidity Shift Trigger (Smart Money Trap)
This system leverages institutional stop hunts and liquidity sweeps at key zones for sniper entries .
- Start with a 15-min chart to identify structure breaks and points of interest (order blocks, flip zones, demand zones) .
- Drop to 1-min chart and wait for price to enter the refined zone and sweep liquidity (sharp wick/spike below/above key level) .
- Once liquidity is swept, wait for a clean structure shift (break of most recent internal high or low) within 5–6 candles—if confirmed, refine entry to the candle that caused the break and enter when price returns to that candle with a strong reaction .
***
### Practical Application
- These strategies are systematic, rule-based, and designed to cut out fake moves, avoid early stop-outs, and align entries with momentum and institutional activity .
- Perfect for short timeframes and volatile pairs like XAUUSD, especially if paired with additional confirmation from other technical analysis tools .
All three strategies emphasize filtering noise, waiting for momentum/trend confirmation, and avoiding impulsive entries—key principles for consistent scalping success

Kripto Fema ind/ This Pine Script™ code is subject to the terms of the Mozilla Public License 2.0 at mozilla.org
// © Femayakup
//@version=5
indicator(title = "Kripto Fema ind", shorttitle="Kripto Fema ind", overlay=true, format=format.price, precision=2,max_lines_count = 500, max_labels_count = 500, max_bars_back=500)
showEma200 = input(true, title="EMA 200")
showPmax = input(true, title="Pmax")
showLinreg = input(true, title="Linreg")
showMavilim = input(true, title="Mavilim")
showNadaray = input(true, title="Nadaraya Watson")
ma(source, length, type) =>
switch type
"SMA" => ta.sma(source, length)
"EMA" => ta.ema(source, length)
"SMMA (RMA)" => ta.rma(source, length)
"WMA" => ta.wma(source, length)
"VWMA" => ta.vwma(source, length)
//Ema200
timeFrame = input.timeframe(defval = '240',title= 'EMA200 TimeFrame',group = 'EMA200 Settings')
len200 = input.int(200, minval=1, title="Length",group = 'EMA200 Settings')
src200 = input(close, title="Source",group = 'EMA200 Settings')
offset200 = input.int(title="Offset", defval=0, minval=-500, maxval=500,group = 'EMA200 Settings')
out200 = ta.ema(src200, len200)
higherTimeFrame = request.security(syminfo.tickerid,timeFrame,out200 ,barmerge.gaps_on,barmerge.lookahead_on)
ema200Plot = showEma200 ? higherTimeFrame : na
plot(ema200Plot, title="EMA200", offset=offset200)
//Linreq
group1 = "Linreg Settings"
lengthInput = input.int(100, title="Length", minval = 1, maxval = 5000,group = group1)
sourceInput = input.source(close, title="Source")
useUpperDevInput = input.bool(true, title="Upper Deviation", inline = "Upper Deviation", group = group1)
upperMultInput = input.float(2.0, title="", inline = "Upper Deviation", group = group1)
useLowerDevInput = input.bool(true, title="Lower Deviation", inline = "Lower Deviation", group = group1)
lowerMultInput = input.float(2.0, title="", inline = "Lower Deviation", group = group1)
group2 = "Linreg Display Settings"
showPearsonInput = input.bool(true, "Show Pearson's R", group = group2)
extendLeftInput = input.bool(false, "Extend Lines Left", group = group2)
extendRightInput = input.bool(true, "Extend Lines Right", group = group2)
extendStyle = switch
extendLeftInput and extendRightInput => extend.both
extendLeftInput => extend.left
extendRightInput => extend.right
=> extend.none
group3 = "Linreg Color Settings"
colorUpper = input.color(color.new(color.blue, 85), "Linreg Renk", inline = group3, group = group3)
colorLower = input.color(color.new(color.red, 85), "", inline = group3, group = group3)
calcSlope(source, length) =>
max_bars_back(source, 5000)
if not barstate.islast or length <= 1
else
sumX = 0.0
sumY = 0.0
sumXSqr = 0.0
sumXY = 0.0
for i = 0 to length - 1 by 1
val = source
per = i + 1.0
sumX += per
sumY += val
sumXSqr += per * per
sumXY += val * per
slope = (length * sumXY - sumX * sumY) / (length * sumXSqr - sumX * sumX)
average = sumY / length
intercept = average - slope * sumX / length + slope
= calcSlope(sourceInput, lengthInput)
startPrice = i + s * (lengthInput - 1)
endPrice = i
var line baseLine = na
if na(baseLine) and not na(startPrice) and showLinreg
baseLine := line.new(bar_index - lengthInput + 1, startPrice, bar_index, endPrice, width=1, extend=extendStyle, color=color.new(colorLower, 0))
else
line.set_xy1(baseLine, bar_index - lengthInput + 1, startPrice)
line.set_xy2(baseLine, bar_index, endPrice)
na
calcDev(source, length, slope, average, intercept) =>
upDev = 0.0
dnDev = 0.0
stdDevAcc = 0.0
dsxx = 0.0
dsyy = 0.0
dsxy = 0.0
periods = length - 1
daY = intercept + slope * periods / 2
val = intercept
for j = 0 to periods by 1
price = high - val
if price > upDev
upDev := price
price := val - low
if price > dnDev
dnDev := price
price := source
dxt = price - average
dyt = val - daY
price -= val
stdDevAcc += price * price
dsxx += dxt * dxt
dsyy += dyt * dyt
dsxy += dxt * dyt
val += slope
stdDev = math.sqrt(stdDevAcc / (periods == 0 ? 1 : periods))
pearsonR = dsxx == 0 or dsyy == 0 ? 0 : dsxy / math.sqrt(dsxx * dsyy)
= calcDev(sourceInput, lengthInput, s, a, i)
upperStartPrice = startPrice + (useUpperDevInput ? upperMultInput * stdDev : upDev)
upperEndPrice = endPrice + (useUpperDevInput ? upperMultInput * stdDev : upDev)
var line upper = na
lowerStartPrice = startPrice + (useLowerDevInput ? -lowerMultInput * stdDev : -dnDev)
lowerEndPrice = endPrice + (useLowerDevInput ? -lowerMultInput * stdDev : -dnDev)
var line lower = na
if na(upper) and not na(upperStartPrice) and showLinreg
upper := line.new(bar_index - lengthInput + 1, upperStartPrice, bar_index, upperEndPrice, width=1, extend=extendStyle, color=color.new(colorUpper, 0))
else
line.set_xy1(upper, bar_index - lengthInput + 1, upperStartPrice)
line.set_xy2(upper, bar_index, upperEndPrice)
na
if na(lower) and not na(lowerStartPrice) and showLinreg
lower := line.new(bar_index - lengthInput + 1, lowerStartPrice, bar_index, lowerEndPrice, width=1, extend=extendStyle, color=color.new(colorUpper, 0))
else
line.set_xy1(lower, bar_index - lengthInput + 1, lowerStartPrice)
line.set_xy2(lower, bar_index, lowerEndPrice)
na
showLinregPlotUpper = showLinreg ? upper : na
showLinregPlotLower = showLinreg ? lower : na
showLinregPlotBaseLine = showLinreg ? baseLine : na
linefill.new(showLinregPlotUpper, showLinregPlotBaseLine, color = colorUpper)
linefill.new(showLinregPlotBaseLine, showLinregPlotLower, color = colorLower)
// Pearson's R
var label r = na
label.delete(r )
if showPearsonInput and not na(pearsonR) and showLinreg
r := label.new(bar_index - lengthInput + 1, lowerStartPrice, str.tostring(pearsonR, "#.################"), color = color.new(color.white, 100), textcolor=color.new(colorUpper, 0), size=size.normal, style=label.style_label_up)
//Mavilim
group4 = "Mavilim Settings"
mavilimold = input(false, title="Show Previous Version of MavilimW?",group=group4)
fmal=input(3,"First Moving Average length",group = group4)
smal=input(5,"Second Moving Average length",group = group4)
tmal=fmal+smal
Fmal=smal+tmal
Ftmal=tmal+Fmal
Smal=Fmal+Ftmal
M1= ta.wma(close, fmal)
M2= ta.wma(M1, smal)
M3= ta.wma(M2, tmal)
M4= ta.wma(M3, Fmal)
M5= ta.wma(M4, Ftmal)
MAVW= ta.wma(M5, Smal)
col1= MAVW>MAVW
col3= MAVWpmaxsrc ? pmaxsrc-pmaxsrc : 0
vdd1=pmaxsrc
ma = 0.0
if mav == "SMA"
ma := ta.sma(pmaxsrc, length)
ma
if mav == "EMA"
ma := ta.ema(pmaxsrc, length)
ma
if mav == "WMA"
ma := ta.wma(pmaxsrc, length)
ma
if mav == "TMA"
ma := ta.sma(ta.sma(pmaxsrc, math.ceil(length / 2)), math.floor(length / 2) + 1)
ma
if mav == "VAR"
ma := VAR
ma
if mav == "WWMA"
ma := WWMA
ma
if mav == "ZLEMA"
ma := ZLEMA
ma
if mav == "TSF"
ma := TSF
ma
ma
MAvg=getMA(pmaxsrc, length)
longStop = Normalize ? MAvg - Multiplier*atr/close : MAvg - Multiplier*atr
longStopPrev = nz(longStop , longStop)
longStop := MAvg > longStopPrev ? math.max(longStop, longStopPrev) : longStop
shortStop = Normalize ? MAvg + Multiplier*atr/close : MAvg + Multiplier*atr
shortStopPrev = nz(shortStop , shortStop)
shortStop := MAvg < shortStopPrev ? math.min(shortStop, shortStopPrev) : shortStop
dir = 1
dir := nz(dir , dir)
dir := dir == -1 and MAvg > shortStopPrev ? 1 : dir == 1 and MAvg < longStopPrev ? -1 : dir
PMax = dir==1 ? longStop: shortStop
plot(showsupport ? MAvg : na, color=#fbff04, linewidth=2, title="EMA9")
pALL=plot(PMax, color=color.new(color.red, transp = 0), linewidth=2, title="PMax")
alertcondition(ta.cross(MAvg, PMax), title="Cross Alert", message="PMax - Moving Avg Crossing!")
alertcondition(ta.crossover(MAvg, PMax), title="Crossover Alarm", message="Moving Avg BUY SIGNAL!")
alertcondition(ta.crossunder(MAvg, PMax), title="Crossunder Alarm", message="Moving Avg SELL SIGNAL!")
alertcondition(ta.cross(pmaxsrc, PMax), title="Price Cross Alert", message="PMax - Price Crossing!")
alertcondition(ta.crossover(pmaxsrc, PMax), title="Price Crossover Alarm", message="PRICE OVER PMax - BUY SIGNAL!")
alertcondition(ta.crossunder(pmaxsrc, PMax), title="Price Crossunder Alarm", message="PRICE UNDER PMax - SELL SIGNAL!")
buySignalk = ta.crossover(MAvg, PMax)
plotshape(buySignalk and showsignalsk ? PMax*0.995 : na, title="Buy", text="Buy", location=location.absolute, style=shape.labelup, size=size.tiny, color=color.new(color.green, transp = 0), textcolor=color.white)
sellSignallk = ta.crossunder(MAvg, PMax)
plotshape(sellSignallk and showsignalsk ? PMax*1.005 : na, title="Sell", text="Sell", location=location.absolute, style=shape.labeldown, size=size.tiny, color=color.new(color.red, transp = 0), textcolor=color.white)
// buySignalc = ta.crossover(pmaxsrc, PMax)
// plotshape(buySignalc and showsignalsc ? PMax*0.995 : na, title="Buy", text="Buy", location=location.absolute, style=shape.labelup, size=size.tiny, color=#0F18BF, textcolor=color.white)
// sellSignallc = ta.crossunder(pmaxsrc, PMax)
// plotshape(sellSignallc and showsignalsc ? PMax*1.005 : na, title="Sell", text="Sell", location=location.absolute, style=shape.labeldown, size=size.tiny, color=#0F18BF, textcolor=color.white)
// mPlot = plot(ohlc4, title="", style=plot.style_circles, linewidth=0,display=display.none)
longFillColor = highlighting ? (MAvg>PMax ? color.new(color.green, transp = 90) : na) : na
shortFillColor = highlighting ? (MAvg math.exp(-(math.pow(x, 2)/(h * h * 2)))
//-----------------------------------------------------------------------------}
//Append lines
//-----------------------------------------------------------------------------{
n = bar_index
var ln = array.new_line(0)
if barstate.isfirst and repaint
for i = 0 to 499
array.push(ln,line.new(na,na,na,na))
//-----------------------------------------------------------------------------}
//End point method
//-----------------------------------------------------------------------------{
var coefs = array.new_float(0)
var den = 0.
if barstate.isfirst and not repaint
for i = 0 to 499
w = gauss(i, h)
coefs.push(w)
den := coefs.sum()
out = 0.
if not repaint
for i = 0 to 499
out += src * coefs.get(i)
out /= den
mae = ta.sma(math.abs(src - out), 499) * mult
upperN = out + mae
lowerN = out - mae
//-----------------------------------------------------------------------------}
//Compute and display NWE
//-----------------------------------------------------------------------------{
float y2 = na
float y1 = na
nwe = array.new(0)
if barstate.islast and repaint
sae = 0.
//Compute and set NWE point
for i = 0 to math.min(499,n - 1)
sum = 0.
sumw = 0.
//Compute weighted mean
for j = 0 to math.min(499,n - 1)
w = gauss(i - j, h)
sum += src * w
sumw += w
y2 := sum / sumw
sae += math.abs(src - y2)
nwe.push(y2)
sae := sae / math.min(499,n - 1) * mult
for i = 0 to math.min(499,n - 1)
if i%2 and showNadaray
line.new(n-i+1, y1 + sae, n-i, nwe.get(i) + sae, color = upCss)
line.new(n-i+1, y1 - sae, n-i, nwe.get(i) - sae, color = dnCss)
if src > nwe.get(i) + sae and src < nwe.get(i) + sae and showNadaray
label.new(n-i, src , '▼', color = color(na), style = label.style_label_down, textcolor = dnCss, textalign = text.align_center)
if src < nwe.get(i) - sae and src > nwe.get(i) - sae and showNadaray
label.new(n-i, src , '▲', color = color(na), style = label.style_label_up, textcolor = upCss, textalign = text.align_center)
y1 := nwe.get(i)
//-----------------------------------------------------------------------------}
//Dashboard
//-----------------------------------------------------------------------------{
var tb = table.new(position.top_right, 1, 1
, bgcolor = #1e222d
, border_color = #373a46
, border_width = 1
, frame_color = #373a46
, frame_width = 1)
if repaint
tb.cell(0, 0, 'Repainting Mode Enabled', text_color = color.white, text_size = size.small)
//-----------------------------------------------------------------------------}
//Plot
//-----------------------------------------------------------------------------}
// plot(repaint ? na : out + mae, 'Upper', upCss)
// plot(repaint ? na : out - mae, 'Lower', dnCss)
//Crossing Arrows
// plotshape(ta.crossunder(close, out - mae) ? low : na, "Crossunder", shape.labelup, location.absolute, color(na), 0 , text = '▲', textcolor = upCss, size = size.tiny)
// plotshape(ta.crossover(close, out + mae) ? high : na, "Crossover", shape.labeldown, location.absolute, color(na), 0 , text = '▼', textcolor = dnCss, size = size.tiny)
//-----------------------------------------------------------------------------}
//////////////////////////////////////////////////////////////////////////////////
enableD = input (true, "DIVERGANCE ON/OFF" , group="INDICATORS ON/OFF")
//DIVERGANCE
prd1 = input.int (defval=5 , title='PIVOT PERIOD' , minval=1, maxval=50 , group="DIVERGANCE")
source = input.string(defval='HIGH/LOW' , title='SOURCE FOR PIVOT POINTS' , options= , group="DIVERGANCE")
searchdiv = input.string(defval='REGULAR/HIDDEN', title='DIVERGANCE TYPE' , options= , group="DIVERGANCE")
showindis = input.string(defval='FULL' , title='SHOW INDICATORS NAME' , options= , group="DIVERGANCE")
showlimit = input.int(1 , title='MINIMUM NUMBER OF DIVERGANCES', minval=1, maxval=11 , group="DIVERGANCE")
maxpp = input.int (defval=20 , title='MAXIMUM PIVOT POINTS TO CHECK', minval=1, maxval=20 , group="DIVERGANCE")
maxbars = input.int (defval=200 , title='MAXIMUM BARS TO CHECK' , minval=30, maxval=200 , group="DIVERGANCE")
showlast = input (defval=false , title='SHOW ONLY LAST DIVERGANCE' , group="DIVERGANCE")
dontconfirm = input (defval=false , title="DON'T WAIT FOR CONFORMATION" , group="DIVERGANCE")
showlines = input (defval=false , title='SHOW DIVERGANCE LINES' , group="DIVERGANCE")
showpivot = input (defval=false , title='SHOW PIVOT POINTS' , group="DIVERGANCE")
calcmacd = input (defval=true , title='MACD' , group="DIVERGANCE")
calcmacda = input (defval=true , title='MACD HISTOGRAM' , group="DIVERGANCE")
calcrsi = input (defval=true , title='RSI' , group="DIVERGANCE")
calcstoc = input (defval=true , title='STOCHASTIC' , group="DIVERGANCE")
calccci = input (defval=true , title='CCI' , group="DIVERGANCE")
calcmom = input (defval=true , title='MOMENTUM' , group="DIVERGANCE")
calcobv = input (defval=true , title='OBV' , group="DIVERGANCE")
calcvwmacd = input (true , title='VWMACD' , group="DIVERGANCE")
calccmf = input (true , title='CHAIKIN MONEY FLOW' , group="DIVERGANCE")
calcmfi = input (true , title='MONEY FLOW INDEX' , group="DIVERGANCE")
calcext = input (false , title='CHECK EXTERNAL INDICATOR' , group="DIVERGANCE")
externalindi = input (defval=close , title='EXTERNAL INDICATOR' , group="DIVERGANCE")
pos_reg_div_col = input (defval=#ffffff , title='POSITIVE REGULAR DIVERGANCE' , group="DIVERGANCE")
neg_reg_div_col = input (defval=#00def6 , title='NEGATIVE REGULAR DIVERGANCE' , group="DIVERGANCE")
pos_hid_div_col = input (defval=#00ff0a , title='POSITIVE HIDDEN DIVERGANCE' , group="DIVERGANCE")
neg_hid_div_col = input (defval=#ff0015 , title='NEGATIVE HIDDEN DIVERGANCE' , group="DIVERGANCE")
reg_div_l_style_ = input.string(defval='SOLID' , title='REGULAR DIVERGANCE LINESTYLE' , options= , group="DIVERGANCE")
hid_div_l_style_ = input.string(defval='SOLID' , title='HIDDEN DIVERGANCE LINESTYLE' , options= , group="DIVERGANCE")
reg_div_l_width = input.int (defval=2 , title='REGULAR DIVERGANCE LINEWIDTH' , minval=1, maxval=5 , group="DIVERGANCE")
hid_div_l_width = input.int (defval=2 , title='HIDDEN DIVERGANCE LINEWIDTH' , minval=1, maxval=5 , group="DIVERGANCE")
showmas = input.bool (defval=false , title='SHOW MOVING AVERAGES (50 & 200)', inline='MA' , group="DIVERGANCE")
cma1col = input.color (defval=#ffffff , title='' , inline='MA' , group="DIVERGANCE")
cma2col = input.color (defval=#00def6 , title='' , inline='MA' , group="DIVERGANCE")
//PLOTS
plot(showmas ? ta.sma(close, 50) : na, color=showmas ? cma1col : na)
plot(showmas ? ta.sma(close, 200) : na, color=showmas ? cma2col : na)
var reg_div_l_style = reg_div_l_style_ == 'SOLID' ? line.style_solid : reg_div_l_style_ == 'DASHED' ? line.style_dashed : line.style_dotted
var hid_div_l_style = hid_div_l_style_ == 'SOLID' ? line.style_solid : hid_div_l_style_ == 'DASHED' ? line.style_dashed : line.style_dotted
rsi = ta.rsi(close, 14)
= ta.macd(close, 12, 26, 9)
moment = ta.mom(close, 10)
cci = ta.cci(close, 10)
Obv = ta.obv
stk = ta.sma(ta.stoch(close, high, low, 14), 3)
maFast = ta.vwma(close, 12)
maSlow = ta.vwma(close, 26)
vwmacd = maFast - maSlow
Cmfm = (close - low - (high - close)) / (high - low)
Cmfv = Cmfm * volume
cmf = ta.sma(Cmfv, 21) / ta.sma(volume, 21)
Mfi = ta.mfi(close, 14)
var indicators_name = array.new_string(11)
var div_colors = array.new_color(4)
if barstate.isfirst and enableD
array.set(indicators_name, 0, showindis == "DON'T SHOW" ? '' : '')
array.set(indicators_name, 1, showindis == "DON'T SHOW" ? '' : '')
array.set(indicators_name, 2, showindis == "DON'T SHOW" ? '' : '')
array.set(indicators_name, 3, showindis == "DON'T SHOW" ? '' : '')
array.set(indicators_name, 4, showindis == "DON'T SHOW" ? '' : '')
array.set(indicators_name, 5, showindis == "DON'T SHOW" ? '' : '')
array.set(indicators_name, 6, showindis == "DON'T SHOW" ? '' : '')
array.set(indicators_name, 7, showindis == "DON'T SHOW" ? '' : '')
array.set(indicators_name, 8, showindis == "DON'T SHOW" ? '' : '')
array.set(indicators_name, 9, showindis == "DON'T SHOW" ? '' : '')
array.set(indicators_name, 10, showindis == "DON'T SHOW" ? '' : '')
array.set(div_colors, 0, pos_reg_div_col)
array.set(div_colors, 1, neg_reg_div_col)
array.set(div_colors, 2, pos_hid_div_col)
array.set(div_colors, 3, neg_hid_div_col)
float ph1 = ta.pivothigh(source == 'CLOSE' ? close : high, prd1, prd1)
float pl1 = ta.pivotlow(source == 'CLOSE' ? close : low, prd1, prd1)
plotshape(ph1 and showpivot, text='H', style=shape.labeldown, color=color.new(color.white, 100), textcolor=#00def6, location=location.abovebar, offset=-prd1)
plotshape(pl1 and showpivot, text='L', style=shape.labelup, color=color.new(color.white, 100), textcolor=#ffffff, location=location.belowbar, offset=-prd1)
var int maxarraysize = 20
var ph_positions = array.new_int(maxarraysize, 0)
var pl_positions = array.new_int(maxarraysize, 0)
var ph_vals = array.new_float(maxarraysize, 0.)
var pl_vals = array.new_float(maxarraysize, 0.)
if ph1
array.unshift(ph_positions, bar_index)
array.unshift(ph_vals, ph1)
if array.size(ph_positions) > maxarraysize
array.pop(ph_positions)
array.pop(ph_vals)
if pl1
array.unshift(pl_positions, bar_index)
array.unshift(pl_vals, pl1)
if array.size(pl_positions) > maxarraysize
array.pop(pl_positions)
array.pop(pl_vals)
positive_regular_positive_hidden_divergence(src, cond) =>
divlen = 0
prsc = source == 'CLOSE' ? close : low
if dontconfirm or src > src or close > close
startpoint = dontconfirm ? 0 : 1
for x = 0 to maxpp - 1 by 1
len = bar_index - array.get(pl_positions, x) + prd1
if array.get(pl_positions, x) == 0 or len > maxbars
break
if len > 5 and (cond == 1 and src > src and prsc < nz(array.get(pl_vals, x)) or cond == 2 and src < src and prsc > nz(array.get(pl_vals, x)))
slope1 = (src - src ) / (len - startpoint)
virtual_line1 = src - slope1
slope2 = (close - close ) / (len - startpoint)
virtual_line2 = close - slope2
arrived = true
for y = 1 + startpoint to len - 1 by 1
if src < virtual_line1 or nz(close ) < virtual_line2
arrived := false
break
virtual_line1 -= slope1
virtual_line2 -= slope2
virtual_line2
if arrived
divlen := len
break
divlen
negative_regular_negative_hidden_divergence(src, cond) =>
divlen = 0
prsc = source == 'CLOSE' ? close : high
if dontconfirm or src < src or close < close
startpoint = dontconfirm ? 0 : 1
for x = 0 to maxpp - 1 by 1
len = bar_index - array.get(ph_positions, x) + prd1
if array.get(ph_positions, x) == 0 or len > maxbars
break
if len > 5 and (cond == 1 and src < src and prsc > nz(array.get(ph_vals, x)) or cond == 2 and src > src and prsc < nz(array.get(ph_vals, x)))
slope1 = (src - src ) / (len - startpoint)
virtual_line1 = src - slope1
slope2 = (close - nz(close )) / (len - startpoint)
virtual_line2 = close - slope2
arrived = true
for y = 1 + startpoint to len - 1 by 1
if src > virtual_line1 or nz(close ) > virtual_line2
arrived := false
break
virtual_line1 -= slope1
virtual_line2 -= slope2
virtual_line2
if arrived
divlen := len
break
divlen
//CALCULATIONS
calculate_divs(cond, indicator_1) =>
divs = array.new_int(4, 0)
array.set(divs, 0, cond and (searchdiv == 'REGULAR' or searchdiv == 'REGULAR/HIDDEN') ? positive_regular_positive_hidden_divergence(indicator_1, 1) : 0)
array.set(divs, 1, cond and (searchdiv == 'REGULAR' or searchdiv == 'REGULAR/HIDDEN') ? negative_regular_negative_hidden_divergence(indicator_1, 1) : 0)
array.set(divs, 2, cond and (searchdiv == 'HIDDEN' or searchdiv == 'REGULAR/HIDDEN') ? positive_regular_positive_hidden_divergence(indicator_1, 2) : 0)
array.set(divs, 3, cond and (searchdiv == 'HIDDEN' or searchdiv == 'REGULAR/HIDDEN') ? negative_regular_negative_hidden_divergence(indicator_1, 2) : 0)
divs
var all_divergences = array.new_int(44)
array_set_divs(div_pointer, index) =>
for x = 0 to 3 by 1
array.set(all_divergences, index * 4 + x, array.get(div_pointer, x))
array_set_divs(calculate_divs(calcmacd , macd) , 0)
array_set_divs(calculate_divs(calcmacda , deltamacd) , 1)
array_set_divs(calculate_divs(calcrsi , rsi) , 2)
array_set_divs(calculate_divs(calcstoc , stk) , 3)
array_set_divs(calculate_divs(calccci , cci) , 4)
array_set_divs(calculate_divs(calcmom , moment) , 5)
array_set_divs(calculate_divs(calcobv , Obv) , 6)
array_set_divs(calculate_divs(calcvwmacd, vwmacd) , 7)
array_set_divs(calculate_divs(calccmf , cmf) , 8)
array_set_divs(calculate_divs(calcmfi , Mfi) , 9)
array_set_divs(calculate_divs(calcext , externalindi), 10)
total_div = 0
for x = 0 to array.size(all_divergences) - 1 by 1
total_div += math.round(math.sign(array.get(all_divergences, x)))
total_div
if total_div < showlimit
array.fill(all_divergences, 0)
var pos_div_lines = array.new_line(0)
var neg_div_lines = array.new_line(0)
var pos_div_labels = array.new_label(0)
var neg_div_labels = array.new_label(0)
delete_old_pos_div_lines() =>
if array.size(pos_div_lines) > 0
for j = 0 to array.size(pos_div_lines) - 1 by 1
line.delete(array.get(pos_div_lines, j))
array.clear(pos_div_lines)
delete_old_neg_div_lines() =>
if array.size(neg_div_lines) > 0
for j = 0 to array.size(neg_div_lines) - 1 by 1
line.delete(array.get(neg_div_lines, j))
array.clear(neg_div_lines)
delete_old_pos_div_labels() =>
if array.size(pos_div_labels) > 0
for j = 0 to array.size(pos_div_labels) - 1 by 1
label.delete(array.get(pos_div_labels, j))
array.clear(pos_div_labels)
delete_old_neg_div_labels() =>
if array.size(neg_div_labels) > 0
for j = 0 to array.size(neg_div_labels) - 1 by 1
label.delete(array.get(neg_div_labels, j))
array.clear(neg_div_labels)
delete_last_pos_div_lines_label(n) =>
if n > 0 and array.size(pos_div_lines) >= n
asz = array.size(pos_div_lines)
for j = 1 to n by 1
line.delete(array.get(pos_div_lines, asz - j))
array.pop(pos_div_lines)
if array.size(pos_div_labels) > 0
label.delete(array.get(pos_div_labels, array.size(pos_div_labels) - 1))
array.pop(pos_div_labels)
delete_last_neg_div_lines_label(n) =>
if n > 0 and array.size(neg_div_lines) >= n
asz = array.size(neg_div_lines)
for j = 1 to n by 1
line.delete(array.get(neg_div_lines, asz - j))
array.pop(neg_div_lines)
if array.size(neg_div_labels) > 0
label.delete(array.get(neg_div_labels, array.size(neg_div_labels) - 1))
array.pop(neg_div_labels)
pos_reg_div_detected = false
neg_reg_div_detected = false
pos_hid_div_detected = false
neg_hid_div_detected = false
var last_pos_div_lines = 0
var last_neg_div_lines = 0
var remove_last_pos_divs = false
var remove_last_neg_divs = false
if pl1
remove_last_pos_divs := false
last_pos_div_lines := 0
last_pos_div_lines
if ph1
remove_last_neg_divs := false
last_neg_div_lines := 0
last_neg_div_lines
divergence_text_top = ''
divergence_text_bottom = ''
distances = array.new_int(0)
dnumdiv_top = 0
dnumdiv_bottom = 0
top_label_col = color.white
bottom_label_col = color.white
old_pos_divs_can_be_removed = true
old_neg_divs_can_be_removed = true
startpoint = dontconfirm ? 0 : 1
for x = 0 to 10 by 1
div_type = -1
for y = 0 to 3 by 1
if array.get(all_divergences, x * 4 + y) > 0
div_type := y
if y % 2 == 1
dnumdiv_top += 1
top_label_col := array.get(div_colors, y)
top_label_col
if y % 2 == 0
dnumdiv_bottom += 1
bottom_label_col := array.get(div_colors, y)
bottom_label_col
if not array.includes(distances, array.get(all_divergences, x * 4 + y))
array.push(distances, array.get(all_divergences, x * 4 + y))
new_line = showlines ? line.new(x1=bar_index - array.get(all_divergences, x * 4 + y), y1=source == 'CLOSE' ? close : y % 2 == 0 ? low : high , x2=bar_index - startpoint, y2=source == 'CLOSE' ? close : y % 2 == 0 ? low : high , color=array.get(div_colors, y), style=y < 2 ? reg_div_l_style : hid_div_l_style, width=y < 2 ? reg_div_l_width : hid_div_l_width) : na
if y % 2 == 0
if old_pos_divs_can_be_removed
old_pos_divs_can_be_removed := false
if not showlast and remove_last_pos_divs
delete_last_pos_div_lines_label(last_pos_div_lines)
last_pos_div_lines := 0
last_pos_div_lines
if showlast
delete_old_pos_div_lines()
array.push(pos_div_lines, new_line)
last_pos_div_lines += 1
remove_last_pos_divs := true
remove_last_pos_divs
if y % 2 == 1
if old_neg_divs_can_be_removed
old_neg_divs_can_be_removed := false
if not showlast and remove_last_neg_divs
delete_last_neg_div_lines_label(last_neg_div_lines)
last_neg_div_lines := 0
last_neg_div_lines
if showlast
delete_old_neg_div_lines()
array.push(neg_div_lines, new_line)
last_neg_div_lines += 1
remove_last_neg_divs := true
remove_last_neg_divs
if y == 0
pos_reg_div_detected := true
pos_reg_div_detected
if y == 1
neg_reg_div_detected := true
neg_reg_div_detected
if y == 2
pos_hid_div_detected := true
pos_hid_div_detected
if y == 3
neg_hid_div_detected := true
neg_hid_div_detected
if div_type >= 0
divergence_text_top += (div_type % 2 == 1 ? showindis != "DON'T SHOW" ? array.get(indicators_name, x) + '\n' : '' : '')
divergence_text_bottom += (div_type % 2 == 0 ? showindis != "DON'T SHOW" ? array.get(indicators_name, x) + '\n' : '' : '')
divergence_text_bottom
if showindis != "DON'T SHOW"
if dnumdiv_top > 0
divergence_text_top += str.tostring(dnumdiv_top)
divergence_text_top
if dnumdiv_bottom > 0
divergence_text_bottom += str.tostring(dnumdiv_bottom)
divergence_text_bottom
if divergence_text_top != ''
if showlast
delete_old_neg_div_labels()
array.push(neg_div_labels, label.new(x=bar_index, y=math.max(high, high ), color=top_label_col, style=label.style_diamond, size = size.auto))
if divergence_text_bottom != ''
if showlast
delete_old_pos_div_labels()
array.push(pos_div_labels, label.new(x=bar_index, y=math.min(low, low ), color=bottom_label_col, style=label.style_diamond, size = size.auto))
// POSITION AND SIZE
PosTable = input.string(defval="Bottom Right", title="Position", options= , group="Table Location & Size", inline="1")
SizTable = input.string(defval="Auto", title="Size", options= , group="Table Location & Size", inline="1")
Pos1Table = PosTable == "Top Right" ? position.top_right : PosTable == "Middle Right" ? position.middle_right : PosTable == "Bottom Right" ? position.bottom_right : PosTable == "Top Center" ? position.top_center : PosTable == "Middle Center" ? position.middle_center : PosTable == "Bottom Center" ? position.bottom_center : PosTable == "Top Left" ? position.top_left : PosTable == "Middle Left" ? position.middle_left : position.bottom_left
Siz1Table = SizTable == "Auto" ? size.auto : SizTable == "Huge" ? size.huge : SizTable == "Large" ? size.large : SizTable == "Normal" ? size.normal : SizTable == "Small" ? size.small : size.tiny
tbl = table.new(Pos1Table, 21, 16, border_width = 1, border_color = color.gray, frame_color = color.gray, frame_width = 1)
// Kullanıcı tarafından belirlenecek yeşil ve kırmızı zaman dilimi sayısı
greenThreshold = input.int(5, minval=1, maxval=10, title="Yeşil Zaman Dilimi Sayısı", group="Alarm Ayarları")
redThreshold = input.int(5, minval=1, maxval=10, title="Kırmızı Zaman Dilimi Sayısı", group="Alarm Ayarları")
// TIMEFRAMES OPTIONS
box01 = input.bool(true, "TF ", inline = "01", group="Select Timeframe")
tf01 = input.timeframe("1", "", inline = "01", group="Select Timeframe")
box02 = input.bool(false, "TF ", inline = "02", group="Select Timeframe")
tf02 = input.timeframe("3", "", inline = "02", group="Select Timeframe")
box03 = input.bool(true, "TF ", inline = "03", group="Select Timeframe")
tf03 = input.timeframe("5", "", inline = "03", group="Select Timeframe")
box04 = input.bool(true, "TF ", inline = "04", group="Select Timeframe")
tf04 = input.timeframe("15", "", inline = "04", group="Select Timeframe")
box05 = input.bool(false, "TF ", inline = "05", group="Select Timeframe")
tf05 = input.timeframe("30", "", inline = "05", group="Select Timeframe")
box06 = input.bool(true, "TF ", inline = "01", group="Select Timeframe")
tf06 = input.timeframe("60", "", inline = "01", group="Select Timeframe")
box07 = input.bool(false, "TF ", inline = "02", group="Select Timeframe")
tf07 = input.timeframe("120", "", inline = "02", group="Select Timeframe")
box08 = input.bool(false, "TF ", inline = "03", group="Select Timeframe")
tf08 = input.timeframe("180", "", inline = "03", group="Select Timeframe")
box09 = input.bool(true, "TF ", inline = "04", group="Select Timeframe")
tf09 = input.timeframe("240", "", inline = "04", group="Select Timeframe")
box10 = input.bool(false, "TF ", inline = "05", group="Select Timeframe")
tf10 = input.timeframe("D", "", inline = "05", group="Select Timeframe")
// indicator('Tillson FEMA', overlay=true)
length1 = input(1, 'FEMA Length')
a1 = input(0.7, 'Volume Factor')
e1 = ta.ema((high + low + 2 * close) / 4, length1)
e2 = ta.ema(e1, length1)
e3 = ta.ema(e2, length1)
e4 = ta.ema(e3, length1)
e5 = ta.ema(e4, length1)
e6 = ta.ema(e5, length1)
c1 = -a1 * a1 * a1
c2 = 3 * a1 * a1 + 3 * a1 * a1 * a1
c3 = -6 * a1 * a1 - 3 * a1 - 3 * a1 * a1 * a1
c4 = 1 + 3 * a1 + a1 * a1 * a1 + 3 * a1 * a1
FEMA = c1 * e6 + c2 * e5 + c3 * e4 + c4 * e3
tablocol1 = FEMA > FEMA
tablocol3 = FEMA < FEMA
color_1 = col1 ? color.rgb(149, 219, 35): col3 ? color.rgb(238, 11, 11) : color.yellow
plot(FEMA, color=color_1, linewidth=3, title='FEMA')
tilson1 = FEMA
tilson1a =FEMA
// DEFINITION OF VALUES
symbol = ticker.modify(syminfo.tickerid, syminfo.session)
tfArr = array.new(na)
tilson1Arr = array.new(na)
tilson1aArr = array.new(na)
// DEFINITIONS OF RSI & CCI FUNCTIONS APPENDED IN THE TIMEFRAME OPTIONS
cciNcciFun(tf, flg) =>
= request.security(symbol, tf, )
if flg and (barstate.isrealtime ? true : timeframe.in_seconds(timeframe.period) <= timeframe.in_seconds(tf))
array.push(tfArr, na(tf) ? timeframe.period : tf)
array.push(tilson1Arr, tilson_)
array.push(tilson1aArr, tilson1a_)
cciNcciFun(tf01, box01), cciNcciFun(tf02, box02), cciNcciFun(tf03, box03), cciNcciFun(tf04, box04),
cciNcciFun(tf05, box05), cciNcciFun(tf06, box06), cciNcciFun(tf07, box07), cciNcciFun(tf08, box08),
cciNcciFun(tf09, box09), cciNcciFun(tf10, box10)
// TABLE AND CELLS CONFIG
// Post Timeframe in format
tfTxt(x)=>
out = x
if not str.contains(x, "S") and not str.contains(x, "M") and
not str.contains(x, "W") and not str.contains(x, "D")
if str.tonumber(x)%60 == 0
out := str.tostring(str.tonumber(x)/60)+"H"
else
out := x + "m"
out
if barstate.islast
table.clear(tbl, 0, 0, 20, 15)
// TITLES
table.cell(tbl, 0, 0, "⏱", text_color=color.white, text_size=Siz1Table, bgcolor=#000000)
table.cell(tbl, 1, 0, "FEMA("+str.tostring(length1)+")", text_color=#FFFFFF, text_size=Siz1Table, bgcolor=#000000)
j = 1
greenCounter = 0 // Yeşil zaman dilimlerini saymak için bir sayaç
redCounter = 0
if array.size(tilson1Arr) > 0
for i = 0 to array.size(tilson1Arr) - 1
if not na(array.get(tilson1Arr, i))
//config values in the cells
TF_VALUE = array.get(tfArr,i)
tilson1VALUE = array.get(tilson1Arr, i)
tilson1aVALUE = array.get(tilson1aArr, i)
SIGNAL1 = tilson1VALUE >= tilson1aVALUE ? "▲" : tilson1VALUE <= tilson1aVALUE ? "▼" : na
// Yeşil oklar ve arka planı ayarla
greenArrowColor1 = SIGNAL1 == "▲" ? color.rgb(0, 255, 0) : color.rgb(255, 0, 0)
greenBgColor1 = SIGNAL1 == "▲" ? color.rgb(25, 70, 22) : color.rgb(93, 22, 22)
allGreen = tilson1VALUE >= tilson1aVALUE
allRed = tilson1VALUE <= tilson1aVALUE
// Determine background color for time text
timeBgColor = allGreen ? #194616 : (allRed ? #5D1616 : #000000)
txtColor = allGreen ? #00FF00 : (allRed ? #FF4500 : color.white)
if allGreen
greenCounter := greenCounter + 1
redCounter := 0
else if allRed
redCounter := redCounter + 1
greenCounter := 0
else
redCounter := 0
greenCounter := 0
// Dinamik pair değerini oluşturma
pair = "USDT_" + syminfo.basecurrency + "USDT"
// Bot ID için kullanıcı girişi
bot_id = input.int(12387976, title="Bot ID", minval=0,group ='3Comas Message', inline = '1') // Varsayılan değeri 12387976 olan bir tamsayı girişi alır
// E-posta tokenı için kullanıcı girişi
email_token = input("cd4111d4-549a-4759-a082-e8f45c91fa47", title="Email Token",group ='3Comas Message', inline = '1')
// USER INPUT FOR DELAY
delay_seconds = input.int(0, title="Delay Seconds", minval=0, maxval=86400,group ='3Comas Message', inline = '1')
// Dinamik mesajın oluşturulması
message = '{ "message_type": "bot", "bot_id": ' + str.tostring(bot_id) + ', "email_token": "' + email_token + '", "delay_seconds": ' + str.tostring(delay_seconds) + ', "pair": "' + pair + '"}'
// Kullanıcının belirlediği yeşil veya kırmızı zaman dilimi sayısına ulaşıldığında alarmı tetikle
if greenCounter >= greenThreshold
alert(message, alert.freq_once_per_bar_close)
// if redCounter >= redThreshold
// alert(message, alert.freq_once_per_bar_close)
// Kullanıcının belirlediği yeşil veya kırmızı zaman dilimi sayısına ulaşıldığında alarmı tetikle
// if greenCounter >= greenThreshold
// alert("Yeşil zaman dilimi sayısı " + str.tostring(greenThreshold) + " adede ulaştı", alert.freq_once_per_bar_close)
// if redCounter >= redThreshold
// alert("Kırmızı zaman dilimi sayısı " + str.tostring(redThreshold) + " adede ulaştı", alert.freq_once_per_bar_close)
table.cell(tbl, 0, j, tfTxt(TF_VALUE), text_color=txtColor, text_halign=text.align_left, text_size=Siz1Table, bgcolor=timeBgColor)
table.cell(tbl, 1, j, str.tostring(tilson1VALUE, "#.#######")+SIGNAL1, text_color=greenArrowColor1, text_halign=text.align_right, text_size=Siz1Table, bgcolor=greenBgColor1)
j += 1
prd = input.int(defval=10, title='Pivot Period', minval=4, maxval=30, group='Setup')
ppsrc = input.string(defval='High/Low', title='Source', options= , group='Setup')
maxnumpp = input.int(defval=20, title=' Maximum Number of Pivot', minval=5, maxval=100, group='Setup')
ChannelW = input.int(defval=10, title='Maximum Channel Width %', minval=1, group='Setup')
maxnumsr = input.int(defval=5, title=' Maximum Number of S/R', minval=1, maxval=10, group='Setup')
min_strength = input.int(defval=2, title=' Minimum Strength', minval=1, maxval=10, group='Setup')
labelloc = input.int(defval=20, title='Label Location', group='Colors', tooltip='Positive numbers reference future bars, negative numbers reference histical bars')
linestyle = input.string(defval='Dashed', title='Line Style', options= , group='Colors')
linewidth = input.int(defval=2, title='Line Width', minval=1, maxval=4, group='Colors')
resistancecolor = input.color(defval=color.red, title='Resistance Color', group='Colors')
supportcolor = input.color(defval=color.lime, title='Support Color', group='Colors')
showpp = input(false, title='Show Point Points')
float src1 = ppsrc == 'High/Low' ? high : math.max(close, open)
float src2 = ppsrc == 'High/Low' ? low : math.min(close, open)
float ph = ta.pivothigh(src1, prd, prd)
float pl = ta.pivotlow(src2, prd, prd)
plotshape(ph and showpp, text='H', style=shape.labeldown, color=na, textcolor=color.new(color.red, 0), location=location.abovebar, offset=-prd)
plotshape(pl and showpp, text='L', style=shape.labelup, color=na, textcolor=color.new(color.lime, 0), location=location.belowbar, offset=-prd)
Lstyle = linestyle == 'Dashed' ? line.style_dashed : linestyle == 'Solid' ? line.style_solid : line.style_dotted
//calculate maximum S/R channel zone width
prdhighest = ta.highest(300)
prdlowest = ta.lowest(300)
cwidth = (prdhighest - prdlowest) * ChannelW / 100
var pivotvals = array.new_float(0)
if ph or pl
array.unshift(pivotvals, ph ? ph : pl)
if array.size(pivotvals) > maxnumpp // limit the array size
array.pop(pivotvals)
get_sr_vals(ind) =>
float lo = array.get(pivotvals, ind)
float hi = lo
int numpp = 0
for y = 0 to array.size(pivotvals) - 1 by 1
float cpp = array.get(pivotvals, y)
float wdth = cpp <= lo ? hi - cpp : cpp - lo
if wdth <= cwidth // fits the max channel width?
if cpp <= hi
lo := math.min(lo, cpp)
else
hi := math.max(hi, cpp)
numpp += 1
numpp
var sr_up_level = array.new_float(0)
var sr_dn_level = array.new_float(0)
sr_strength = array.new_float(0)
find_loc(strength) =>
ret = array.size(sr_strength)
for i = ret > 0 ? array.size(sr_strength) - 1 : na to 0 by 1
if strength <= array.get(sr_strength, i)
break
ret := i
ret
ret
check_sr(hi, lo, strength) =>
ret = true
for i = 0 to array.size(sr_up_level) > 0 ? array.size(sr_up_level) - 1 : na by 1
//included?
if array.get(sr_up_level, i) >= lo and array.get(sr_up_level, i) <= hi or array.get(sr_dn_level, i) >= lo and array.get(sr_dn_level, i) <= hi
if strength >= array.get(sr_strength, i)
array.remove(sr_strength, i)
array.remove(sr_up_level, i)
array.remove(sr_dn_level, i)
ret
else
ret := false
ret
break
ret
var sr_lines = array.new_line(11, na)
var sr_labels = array.new_label(11, na)
for x = 1 to 10 by 1
rate = 100 * (label.get_y(array.get(sr_labels, x)) - close) / close
label.set_text(array.get(sr_labels, x), text=str.tostring(label.get_y(array.get(sr_labels, x))) + '(' + str.tostring(rate, '#.##') + '%)')
label.set_x(array.get(sr_labels, x), x=bar_index + labelloc)
label.set_color(array.get(sr_labels, x), color=label.get_y(array.get(sr_labels, x)) >= close ? color.red : color.lime)
label.set_textcolor(array.get(sr_labels, x), textcolor=label.get_y(array.get(sr_labels, x)) >= close ? color.white : color.black)
label.set_style(array.get(sr_labels, x), style=label.get_y(array.get(sr_labels, x)) >= close ? label.style_label_down : label.style_label_up)
line.set_color(array.get(sr_lines, x), color=line.get_y1(array.get(sr_lines, x)) >= close ? resistancecolor : supportcolor)
if ph or pl
//because of new calculation, remove old S/R levels
array.clear(sr_up_level)
array.clear(sr_dn_level)
array.clear(sr_strength)
//find S/R zones
for x = 0 to array.size(pivotvals) - 1 by 1
= get_sr_vals(x)
if check_sr(hi, lo, strength)
loc = find_loc(strength)
// if strength is in first maxnumsr sr then insert it to the arrays
if loc < maxnumsr and strength >= min_strength
array.insert(sr_strength, loc, strength)
array.insert(sr_up_level, loc, hi)
array.insert(sr_dn_level, loc, lo)
// keep size of the arrays = 5
if array.size(sr_strength) > maxnumsr
array.pop(sr_strength)
array.pop(sr_up_level)
array.pop(sr_dn_level)
for x = 1 to 10 by 1
line.delete(array.get(sr_lines, x))
label.delete(array.get(sr_labels, x))
for x = 0 to array.size(sr_up_level) > 0 ? array.size(sr_up_level) - 1 : na by 1
float mid = math.round_to_mintick((array.get(sr_up_level, x) + array.get(sr_dn_level, x)) / 2)
rate = 100 * (mid - close) / close
array.set(sr_labels, x + 1, label.new(x=bar_index + labelloc, y=mid, text=str.tostring(mid) + '(' + str.tostring(rate, '#.##') + '%)', color=mid >= close ? color.red : color.lime, textcolor=mid >= close ? color.white : color.black, style=mid >= close ? label.style_label_down : label.style_label_up))
array.set(sr_lines, x + 1, line.new(x1=bar_index, y1=mid, x2=bar_index - 1, y2=mid, extend=extend.both, color=mid >= close ? resistancecolor : supportcolor, style=Lstyle, width=linewidth))
f_crossed_over() =>
ret = false
for x = 0 to array.size(sr_up_level) > 0 ? array.size(sr_up_level) - 1 : na by 1
float mid = math.round_to_mintick((array.get(sr_up_level, x) + array.get(sr_dn_level, x)) / 2)
if close <= mid and close > mid
ret := true
ret
ret
f_crossed_under() =>
ret = false
for x = 0 to array.size(sr_up_level) > 0 ? array.size(sr_up_level) - 1 : na by 1
float mid = math.round_to_mintick((array.get(sr_up_level, x) + array.get(sr_dn_level, x)) / 2)
if close >= mid and close < mid
ret := true
ret
ret
alertcondition(f_crossed_over(), title='Resistance Broken', message='Resistance Broken')
alertcondition(f_crossed_under(), title='Support Broken', message='Support Broken')
