Noro's OverCloud v1.2 MTFAdded big timeframe
MN = 1 month
W = 1 week
D = 1 day
240 = 4 hours
180 = 3 hours
120 = 2 hours
60 = 1 hours
30 = 30 min
15 = 15 min
etc...
Search in scripts for "机械革命无界15+时不时闪屏"

Fractal Resonance BarLazyBear's WaveTrend port has been praised for highlighting trend reversals with precision and punctuality (minimal lag). But strong "3rd Wave" trends can "embed" or saturate any oscillator flashing several premature crosses while stuck overbought/oversold. This happens when the trend stretches over a longer timescale than the oscillator's averaging window or filter time constant. Our solution: monitor many timescales. With Fractal Resonance Bar's rich color codings, strong wavefronts form across timescales and jump out like an approaching line of thunderclouds!
Fractal Resonance Bar color-codes the status of eight underlying stochastic oscillators, with each row averaging over twice the time of the row above.
Fractal Resonance Bar shifts its timescales along with your choice of main chart timescale:
1 minute chart: 1 minute through 128 minute (~2 hour) oscillators.
15 minute chart: 15 minute through 1920 minute (~32 hour) oscillators.
1 hour chart: 1 hour through 128 hour (~2 week) oscillators.
Daily chart: 1 day through 128 day (~4 month) oscillators.
The color map is configured as follows:
Hot Pink: Extreme Overbought (> 100%) rolled over to sell, but oscillators probably embedded with more upside (revert to Dark Green) possible after a pause.
Deep Red: Overbought (> 75%) crossover ripe for selling (validated when red spreads to timescales below).
Brown: Minor (< 75%) crossover sell from which could bounce back green or start a plunge toward gray/black.
Gray/Black: Mature (< -75%) sells turning full black in a plunge before the dawn.
Lime Green: Extreme Oversold (< -100%) and bouncing, though may yet bottom even lower.
Green: Oversold (< -75%) crossover ripe for buy. Green spreading to all timescales below will validate bottom is in.
Dark Green/Teal: Mature buy in overbought (> 75%) range, waiting for sell crossover to Hot Pink for a pause or correction.
White Stripes are Impulsive Trend Warning
Fractal Resonance Bar warns of oscillator embedding by showing white stripes when it detects strong, early surges in the timescale rows below.The white stripes usually accompany Hot Pink warning it's too early to go short, or Lime Green warning it's too early to go long.
Heeding these warnings will probably miss the exact top or bottom, but you're less likely to get overrun in a momentum move.
Usually the market gives us a second opportunity to short very close to the top or buy very close to the bottom after the warning white stripes have subsided.
NOTE: Recently rolled over Futures contracts may not have enough history for all oscillator calculations, in which case no bar colors will appear.
Tweakable Attributes
The default Channel Length, Stochastic Ratio Length and Lag Length work reasonably well on all timescales in our experience. Minor tweaks don't hurt but this may just overfit to a particular chart history.
We don't recommend changing the 75% Overbought and 100% Extreme Overbought default levels as these are ideal numbers relative to the underlying oscillator statistic calculations. But these settings can shift the color transition levels.
Embedded attribute controls the sensitivity/conservativeness of the white strip embedding detectors. Closer to 75 increases the warning sensitivity while closer to 100 decreases the aggressiveness of blocking white stripes.
Embed Separation also affects the white stripe sensitivity.
Row width increases each row's thickness to fill the available screen height you've afforded the bar.

Trend and Entry CCI ST15This is a T3 CCI with a fast and slow line as well as extreme lines, a -15,15 filter to make zero line rejections and crosses more mechanical and help weed out whipsaw. I will probably update description in the future and get into more detail about how the indicator is used but for now if you want more info look up woodie CCI patterns :) Good Luck!!
extended session - Regular Opening-Range- JayyOpening Range and some other scripts updated to plot correctly (see comments below.) There are three variations of the fibonacci expansion beyond the opening range and retracements within the opening range of the US Market session - I have not put in the script for the other markets yet.
The three scripts have different uses and strengths:
The extended session script (with the script here below) will plot the opening range whether you are using the extended session or the regular session. (that is to say whether "ext" in the lower right hand corner is highlighted or not.). While in the extended session the opening range has some plotting issues with periods like 13 minutes or any period that is not divisible into 330 mins with a round number outcome (eg 330/60 =5.5. Therefore an hour long opening range has problems in the extended session.
The pre session script is only for the premarket. You can select any opening range period you like. I have set the opening range to be the full premarket session. If you select a different session you will have to unselect "pre open to 9:30 EST for Opening Range?" in the format section. The script defaults to 15 minutes in the "period Of Pre Opening Range?". To go back to the 4 am to 9:30 pre opening range select "pre open to 9:30 EST for Opening Range?" there is no automatic 330 minute selection.
The past days offset script only works in 5 min or 15 minute period. It will show the opening range from up to 20 days past over the current days price action. Use this for the regular session only. 0 shows the current day's opening range. Use the positive integers for number of days back ie 1, 2, 3 etc not -1, -2, -3 etc. The script is preprogrammed to use the current day (0).
Scripts updated to plot correctly: One thing they all have in common is a way of they deal with a somewhat random problem that shifts the plots 4 hours in one direction or the other ie the plot started at 9:30 EST or 1:30PM EST. This issue started to occur approximately June 22, 2015 and impacts any script that tried to use "session" times to manage a plot in my scripts. The issue now seems to have been resolved during this past week.
Just in case the problem reoccurs I have added a "Switch session plot?" to each script. If the plot looks funny check or uncheck the "Switch session plot?" and see the difference. Of course if a new issue crops up it will likely require a different fix.
I have updated all of the scripts shown on this chart. If you are using a script of mine that suffers from the compiler issue then you will find an update on this chart. You can get any and all of the scripts by clicking on the small sideways wishbone on the left middle of the chart. You will see a dialogue box. Then click "make it mine". This will import all of the scripts to your computer and you can play around with them all to decide what you want and what you don't want. This is the easiest way to get all of the scripts in one fell swoop. It is also the easiest way for me to make all of the scripts available. I do not have all of the plots visible since it is too messy and one of the scripts (pre OR) is only for the regular session. To view the scripts click on the blue eye to the right of the script title to show it on this script. If you can only use the regular session. The scripts will all (with the exception of the pre OR) work fine.
If for any reason this script seems flakey refresh the page r try a slightly different period. I have noticed that sometimes randomly the script loves to return to the 5 min OR. This is a very new issue transient issue. As always if you see an issue please let me know.
Cheers Jayy

BB 100 with Barcolors6/19/15 I added confirmation highlight bars to the code. In other words, if a candle bounced off the lower Bollinger band, it needed one more close above the previous candle to confirm a higher probability that a change in investor sentiment has reversed. Same is true for upper Bollinger band bounces. I also added confirmation highlight bars to the 100 sma (the basis). The idea is that lower and upper bands are potential points of support and resistance. The same is true of the basis if a trend is to continue. 6/28/15 I added a plotshape to identify closes above/below TLine. One thing this system points out is it operates best in a trend reversal. Consolidations will whipsaw the indicator too much. I have found that when this happens, if using daily candles, switch to hourly, 30 min, etc., to catch a better signal. Nothing moves in a straight line. As with any indicator, it is a tool to be used in conjunction with the art AND science of trading. As always, try the indicator for a time so that you are comfortable enough to use real money. This is designed to be used with "BB 25 with Barcolors".

BB 25 with Barcolors6/19/15 I added confirmation highlight bars to the code. In other words, if a candle bounced off the lower Bollinger band, it needed one more close above the previous candle to confirm a higher probability that a change in investor sentiment has reversed. Same is true for upper Bollinger band bounces. I also added confirmation highlight bars to the 100 sma (the basis). The idea is that lower and upper bands are potential points of support and resistance. The same is true of the basis if a trend is to continue. 6/28/15 I added a plotshape to identify closes above/below TLine. One thing this system points out is it operates best in a trend reversal. Consolidations will whipsaw the indicator too much. I have found that when this happens, if using daily candles, switch to hourly, 30 min, etc., to catch a better signal. Nothing moves in a straight line. As with any indicator, it is a tool to be used in conjunction with the art AND science of trading. As always, try the indicator for a time so that you are comfortable enough to use real money. This is designed to be used with "BB 100 with Barcolors".

KK_Intraday MAsHey guys,
today I was browsing through intraday Charts looking at some moving averages. Basically what I wanted to see was whether the currency pair was trading below or above the moving average of the day/week/month. For a better understanding: The daily MA on a 15 minute Forex Chart would be the 96 MA.
I encountered the problem that i always had to change the settings for my MAs when changing the Time Interval, so I coded this here up. It is pretty simple but maybe somebody else has the same problem and can put it to use.
The script has some settings as listed below:
Choice which MAs to plot, (Daily, Weekly, Monthly)
Choice which type of MA to use (Simple, Exponential, Weighted)
Neccesary Settings for the correct calculation (e.g. Number of trading hours per day). These settings depend on the instrument you are using and should always be checked before using this script.
There are a few things to Note when using this script:
This script works for intraday charts only.
The monthly MA doesn't work on any Time Interval smaller than 15 minutes. Can't do anything about it unfortunately.
This is my first published Script, use it with caution and let me know what you think about it!

Opening Range Breakout with 2 Profit Targets.Opening Range Breakout with 2 Profit Targets.
Updated Indicator now works on all Symbols with Many Different Session Options.
***Known PineScript Issue…While the Opening Range is being Formed the lines only adjust for that individual bar. Just reset Indicator after Opening Range Completes.
***All Times are Based on New York Time
Session Options Forex U.S. Banks Open (8:00), Gold U.S. Open (8:20), Oil U.S. Open (9:00), U.S. Cash Session - Stocks (9:30), NY Forex Open (17:00) , Europe Open (02:00), or if you choose Setting 0 the Session Runs from 00:00 to 00:00 (Midnight to Midnight).
***Ability to use 60 minute Opening Range, 30 minute, 15 minute, and many other options.
***However you can manually change the times in the Inputs Tab to adjust for any session you prefer. This is useful for Day Light Savings Adjustments. Also the default times work if your charts are set to EST Time. If you use A different time zone in your settings you need to Adjust the times in the inputs tab.
Initially Opening Range High and Low plot as Yellow Lines. If Price Goes Above Opening Range then Line Turns Green. If Price Goes Below Opening Range Line Turns Red.
By default the First Profit Target is 1/2 the Width of the Opening Range and the 2nd Profit Target is 1 Times the Opening Range. However these are Adjustable in the Inputs Tab.
By Default the Opening Range Length is 1 Hour. However, you can Change the Opening Range Length to 15 min, 30 min, 2 hours etc. in the Inputs Tab.
Plots a 1 Above or Below Candle when 1st Profit Target is Achieved, and a 2 when 2nd Profit Target is Achieved.

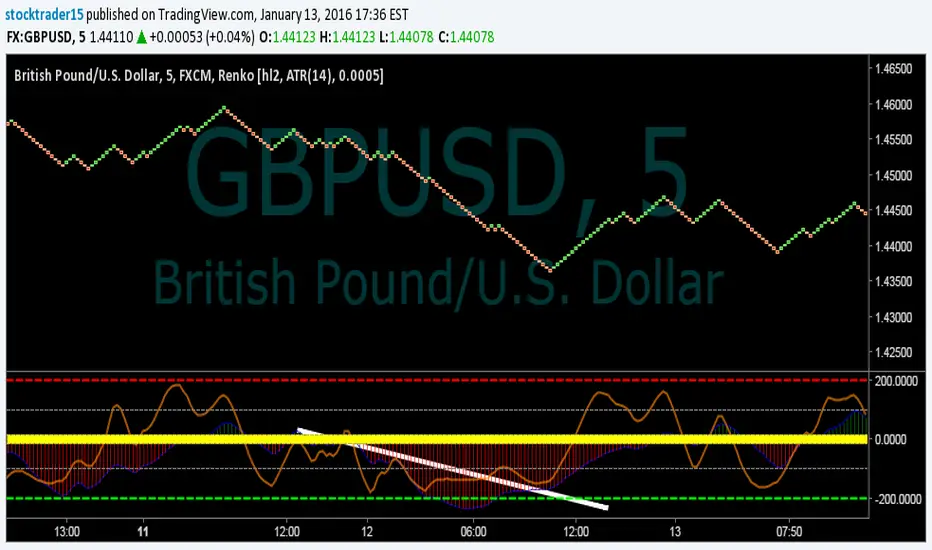
Indicator: Trend Trigger FactorIntroduced by M.H.Pee, Trend Trigger Factor is designed to keep the trader trading with the trend.
System rules according to the developer:
* If the 15-day TTF is above 100 (indicating an uptrend), you will want to be in long positions.
* If the 15-day TTF is below -100, you will want to be short.
* If it is between -100 and 100, you should remain with the current position.
More info:
Original Article by Mr.Pee: drive.google.com

猛の掟・初動スクリーナー_完成版//@version=5
indicator("猛の掟・初動スクリーナー_完成版", overlay=true)
// =============================
// 入力パラメータ
// =============================
emaLenShort = input.int(5, "短期EMA", minval=1)
emaLenMid = input.int(13, "中期EMA", minval=1)
emaLenLong = input.int(26, "長期EMA", minval=1)
macdFastLen = input.int(12, "MACD Fast", minval=1)
macdSlowLen = input.int(26, "MACD Slow", minval=1)
macdSignalLen = input.int(9, "MACD Signal", minval=1)
macdZeroTh = input.float(0.2, "MACDゼロライン近辺とみなす許容値", step=0.05)
volMaLen = input.int(5, "出来高平均日数", minval=1)
volMinRatio = input.float(1.3, "出来高倍率(初動判定しきい値)", step=0.1)
volStrongRatio = input.float(1.5, "出来高倍率(本物/三点シグナル用)", step=0.1)
highLookback = input.int(60, "直近高値の参照本数", minval=10)
pullbackMin = input.float(5.0, "押し目最小 ", step=0.5)
pullbackMax = input.float(15.0, "押し目最大 ", step=0.5)
breakLookback = input.int(15, "レジブレ後とみなす本数", minval=1)
wickBodyMult = input.float(2.0, "ピンバー:下ヒゲが実体の何倍以上か", step=0.5)
// ★ シグナル表示 ON/OFF
showMou = input.bool(true, "猛シグナルを表示")
showKaku = input.bool(true, "確シグナルを表示")
// =============================
// 基本指標計算
// =============================
emaShort = ta.ema(close, emaLenShort)
emaMid = ta.ema(close, emaLenMid)
emaLong = ta.ema(close, emaLenLong)
= ta.macd(close, macdFastLen, macdSlowLen, macdSignalLen)
volMa = ta.sma(volume, volMaLen)
volRatio = volMa > 0 ? volume / volMa : 0.0
recentHigh = ta.highest(high, highLookback)
prevHigh = ta.highest(high , highLookback)
pullbackPct = recentHigh > 0 ? (recentHigh - close) / recentHigh * 100.0 : 0.0
// ローソク足
body = math.abs(close - open)
upperWick = high - math.max(open, close)
lowerWick = math.min(open, close) - low
// =============================
// A:トレンド条件
// =============================
emaUp = emaShort > emaShort and emaMid > emaMid and emaLong > emaLong
goldenOrder = emaShort > emaMid and emaMid > emaLong
aboveEma2 = close > emaLong and close > emaLong
trendOK = emaUp and goldenOrder and aboveEma2
// =============================
// B:MACD条件
// =============================
macdGC = ta.crossover(macdLine, macdSignal)
macdNearZero = math.abs(macdLine) <= macdZeroTh
macdUp = macdLine > macdLine
macdOK = macdGC and macdNearZero and macdUp
// =============================
// C:出来高条件
// =============================
volInitOK = volRatio >= volMinRatio // 8条件用
volStrongOK = volRatio >= volStrongRatio // 三点シグナル用
volumeOK = volInitOK
// =============================
// D:ローソク足パターン
// =============================
isBullPinbar = lowerWick > wickBodyMult * body and lowerWick > upperWick and close >= open
isBullEngulf = close > open and open < close and close > open
isBigBullCross = close > emaShort and close > emaMid and open < emaShort and open < emaMid and close > open
candleOK = isBullPinbar or isBullEngulf or isBigBullCross
// =============================
// E:価格帯(押し目&レジブレ)
// =============================
pullbackOK = pullbackPct >= pullbackMin and pullbackPct <= pullbackMax
isBreakout = close > prevHigh and close <= prevHigh
barsSinceBreak = ta.barssince(isBreakout)
afterBreakZone = barsSinceBreak >= 0 and barsSinceBreak <= breakLookback
afterBreakPullbackOK = afterBreakZone and pullbackOK and close > emaShort
priceOK = pullbackOK and afterBreakPullbackOK
// =============================
// 8条件の統合
// =============================
allRulesOK = trendOK and macdOK and volumeOK and candleOK and priceOK
// =============================
// 最終三点シグナル
// =============================
longLowerWick = lowerWick > wickBodyMult * body and lowerWick > upperWick
macdGCAboveZero = ta.crossover(macdLine, macdSignal) and macdLine > 0
volumeSpike = volStrongOK
finalThreeSignal = longLowerWick and macdGCAboveZero and volumeSpike
buyConfirmed = allRulesOK and finalThreeSignal
// =============================
// 描画
// =============================
plot(emaShort, color=color.new(color.yellow, 0), title="EMA 短期(5)")
plot(emaMid, color=color.new(color.orange, 0), title="EMA 中期(13)")
plot(emaLong, color=color.new(color.blue, 0), title="EMA 長期(26)")
// シグナル表示(ON/OFF付き)
plotshape(showMou and allRulesOK, title="猛の掟 8条件クリア候補", location=location.belowbar, color=color.new(color.lime, 0), text="猛")
plotshape(showKaku and buyConfirmed, title="猛の掟 最終三点シグナル確定", location=location.belowbar, color=color.new(color.yellow, 0), text="確")
// =============================
// アラート条件
// =============================
alertcondition(allRulesOK, title="猛の掟 8条件クリア候補", message="猛の掟 8条件クリア候補シグナル発生")
alertcondition(buyConfirmed, title="猛の掟 最終三点シグナル確定", message="猛の掟 最終三点シグナル=買い確定")

specific breakout FiFTOStrategy Description: 10:14 Breakout Only
Overview This is a time-based intraday trading strategy designed to capture momentum bursts that occur specifically after the 10:14 AM candle closes. It operates on the logic that if price breaks the high of this specific candle within a short window, a trend continuation is likely.
Core Logic & Rules
The Setup Candle (10:14 AM)
The strategy waits specifically for the minute candle at 10:14 to complete.
Once this candle closes, the strategy records its High price.
Defining the Entry Level
It calculates a trigger price by taking the 10:14 High and adding a user-defined Buffer (e.g., +1 point).
Formula: Entry Level = 10:14 High + Buffer
The "Active Window" (Expiry)
The trade setup does not remain open all day. It has a strict time limit.
By default, the setup is valid from 10:15 to 10:20.
If the price does not break the Entry Level by the expiry time (default 10:20), the setup is cancelled and no trade is taken for the day.
Entry Trigger
If a candle closes above the Entry Level while the window is open, a Long (Buy) position is opened immediately.
Exits (Risk Management)
Stop Loss: A fixed number of points below the entry price.
Target: A fixed number of points above the entry price.
Visual & Automation Features
Visual Boxes: Upon entry, the strategy draws a "Long Position" style visual on the chart. A green box highlights the profit zone, and a red box highlights the loss zone. These boxes extend automatically until the trade closes.
JSON Alerts: The strategy is pre-configured to send data-rich alerts for automation (e.g., Telegram bots).
Entry Alert: Includes Symbol, Entry Price, SL, and TP.
Exit Alerts: Specific messages for "Target Hit" or "SL Hit".
Summary of User Inputs
Entry Buffer: Extra points added to the high to filter false breaks.
Fixed Stop Loss: Risk per trade in points.
Fixed Target: Reward per trade in points.
Expiry Minute: The minute (10:xx) at which the setup becomes invalid if not triggered.

MeanReversion_tradeALERTOverview The Apex Reversal Predictor v2.5 is a specialized mean reversion strategy designed for scalping high-volatility assets like NQ (Nasdaq), ES (S&P 500), and Crypto. While most indicators chase breakouts, this system hunts for "Liquidity Sweeps"—moments where the market briefly breaks a key level to trap retail traders before snapping back to the true value (VWAP).
This is not just a signal indicator; it is a full Trade Manager that calculates your Entry, Stop Loss, and Take Profit levels automatically based on volatility (ATR).
The Logic: Why This Works Markets act like a rubber band. They can only stretch so far from their average price before snapping back. This script combines three layers of logic to identify these snap-back points:
The Stretch (Sigma Score): Measures how far price is from the VWAP relative to ATR. If the score > 2.0, the "rubber band" is overextended.
The Trap (Liquidity Sweep): Identifies Pivot Highs/Lows. It waits for price to break a pivot (luring in breakout traders) and then immediately reverse (trapping them).
The Exhaustion (RSI): Confirms that momentum is Overbought/Oversold to prevent trading against a strong trend.
Key Features
Dynamic Lines: Automatically draws Blue (Entry), Red (SL), and Green (TP) lines on the chart for active trades.
Smart Targets: Two modes for taking profit:
Mean Reversion: Targets the VWAP line (High Win Rate).
Fixed Ratio: Targets a specific Risk:Reward (e.g., 1:2).
Live Dashboard: Tracks Win Rate, Net Points, and the live "Stretch Score" in the bottom right corner.
Alert Ready: Formatted JSON alerts for easy integration with Discord or trading bots.
How & When to Use (User Guide)
1. Best Timeframes
5-Minute (5m): Best for NQ and volatile stocks (TSLA, NVDA). Filters out 1-minute noise but catches the intraday reversals.
15-Minute (15m): Best for Forex or slower-moving indices (ES).
2. The Setup Checklist Before taking a trade, look at the Dashboard in the bottom right:
Step 1: Check the "Stretch (Sigma)". Is it Orange or Red? This means price is extended and ripe for a reversal. If it's Green, the market is calm—be careful.
Step 2: Wait for the Signal.
"Apex BUY" (Green Label): Price swept a low and closed green.
"Apex SELL" (Red Label): Price swept a high and closed red.
Step 3: Execute. Enter at the close of the signal candle. Set your stop loss at the Red Line provided by the script.
3. Warning / When NOT to Use
Strong Trending Days: If the market is trending heavily (e.g., creating higher highs all day without looking back), do not fight the trend.
News Events: Avoid using this during CPI, FOMC, or NFP releases. The "rubber band" logic breaks during news because volatility expands indefinitely.

EMA Market Structure [BOSWaves]// This Pine Script™ code is subject to the terms of the Mozilla Public License 2.0 at mozilla.org
// Join our channel for more free tools: t.me
// This Pine Script® code is subject to the terms of the Mozilla Public License 2.0 at mozilla.org
// © BOSWaves
//@version=6
indicator("EMA Market Structure ", overlay=true, max_lines_count=500, max_labels_count=500, max_boxes_count=500)
// ============================================================================
// Inputs
// ============================================================================
// Ema settings
emaLength = input.int(50, "EMA Length", minval=1, tooltip="Period for the Exponential Moving Average calculation")
emaSource = input.source(close, "EMA Source", tooltip="Price source for EMA calculation (close, open, high, low, etc.)")
colorSmooth = input.int(3, "Color Smoothing", minval=1, group="EMA Style", tooltip="Smoothing period for the EMA color gradient transition")
showEmaGlow = input.bool(true, "EMA Glow Effect", group="EMA Style", tooltip="Display glowing halo effect around the EMA line for enhanced visibility")
// Structure settings
swingLength = input.int(5, "Swing Detection Length", minval=2, group="Structure", tooltip="Number of bars to the left and right to identify swing highs and lows")
swingCooloff = input.int(10, "Swing Marker Cooloff (Bars)", minval=1, group="Structure", tooltip="Minimum number of bars between consecutive swing point markers to reduce visual clutter")
showSwingLines = input.bool(true, "Show Structure Lines", group="Structure", tooltip="Display lines connecting swing highs and swing lows")
showSwingZones = input.bool(true, "Show Structure Zones", group="Structure", tooltip="Display shaded zones between consecutive swing points")
showBOS = input.bool(true, "Show Break of Structure", group="Structure", tooltip="Display BOS labels and stop loss levels when price breaks structure")
bosCooloff = input.int(15, "BOS Cooloff (Bars)", minval=5, maxval=50, group="Structure", tooltip="Minimum number of bars required between consecutive BOS signals to avoid signal spam")
slExtension = input.int(20, "SL Line Extension (Bars)", minval=5, maxval=100, group="Structure", tooltip="Number of bars to extend the stop loss line into the future for visibility")
slBuffer = input.float(0.1, "SL Buffer %", minval=0, maxval=2, step=0.05, group="Structure", tooltip="Additional buffer percentage to add to stop loss level for safety margin")
// Background settings
showBG = input.bool(true, "Show Trend Background", group="EMA Style", tooltip="Display background color based on EMA trend direction")
bgBullColor = input.color(color.new(#00ff88, 96), "Bullish BG", group="EMA Style", tooltip="Background color when EMA is in bullish trend")
bgBearColor = input.color(color.new(#ff3366, 96), "Bearish BG", group="EMA Style", tooltip="Background color when EMA is in bearish trend")
// ============================================================================
// Ema trend filter with gradient color
// ============================================================================
ema = ta.ema(emaSource, emaLength)
// Calculate EMA acceleration for gradient color
emaChange = ema - ema
emaAccel = ta.ema(emaChange, colorSmooth)
// Manual tanh function for normalization
tanh(x) =>
ex = math.exp(2 * x)
(ex - 1) / (ex + 1)
accelNorm = tanh(emaAccel / (ta.atr(14) * 0.01))
// Map normalized accel to hue (60 = green, 120 = yellow/red)
hueRaw = 60 + accelNorm * 60
hue = na(hueRaw ) ? hueRaw : (hueRaw + hueRaw ) / 2
sat = 1.0
val = 1.0
// HSV to RGB conversion
hsv_to_rgb(h, s, v) =>
c = v * s
x = c * (1 - math.abs((h / 60) % 2 - 1))
m = v - c
r = 0.0
g = 0.0
b = 0.0
if (h < 60)
r := c
g := x
b := 0
else if (h < 120)
r := x
g := c
b := 0
else if (h < 180)
r := 0
g := c
b := x
else if (h < 240)
r := 0
g := x
b := c
else if (h < 300)
r := x
g := 0
b := c
else
r := c
g := 0
b := x
color.rgb(int((r + m) * 255), int((g + m) * 255), int((b + m) * 255))
emaColor = hsv_to_rgb(hue, sat, val)
emaTrend = ema > ema ? 1 : ema < ema ? -1 : 0
// EMA with enhanced glow effect using fills
glowOffset = ta.atr(14) * 0.25
emaGlow8 = plot(showEmaGlow ? ema + glowOffset * 8 : na, "EMA Glow 8", color.new(emaColor, 100), 1, display=display.none)
emaGlow7 = plot(showEmaGlow ? ema + glowOffset * 7 : na, "EMA Glow 7", color.new(emaColor, 100), 1, display=display.none)
emaGlow6 = plot(showEmaGlow ? ema + glowOffset * 6 : na, "EMA Glow 6", color.new(emaColor, 100), 1, display=display.none)
emaGlow5 = plot(showEmaGlow ? ema + glowOffset * 5 : na, "EMA Glow 5", color.new(emaColor, 100), 1, display=display.none)
emaGlow4 = plot(showEmaGlow ? ema + glowOffset * 4 : na, "EMA Glow 4", color.new(emaColor, 100), 1, display=display.none)
emaGlow3 = plot(showEmaGlow ? ema + glowOffset * 3 : na, "EMA Glow 3", color.new(emaColor, 100), 1, display=display.none)
emaGlow2 = plot(showEmaGlow ? ema + glowOffset * 2 : na, "EMA Glow 2", color.new(emaColor, 100), 1, display=display.none)
emaGlow1 = plot(showEmaGlow ? ema + glowOffset * 1 : na, "EMA Glow 1", color.new(emaColor, 100), 1, display=display.none)
emaCore = plot(ema, "EMA Core", emaColor, 3)
emaGlow1b = plot(showEmaGlow ? ema - glowOffset * 1 : na, "EMA Glow 1b", color.new(emaColor, 100), 1, display=display.none)
emaGlow2b = plot(showEmaGlow ? ema - glowOffset * 2 : na, "EMA Glow 2b", color.new(emaColor, 100), 1, display=display.none)
emaGlow3b = plot(showEmaGlow ? ema - glowOffset * 3 : na, "EMA Glow 3b", color.new(emaColor, 100), 1, display=display.none)
emaGlow4b = plot(showEmaGlow ? ema - glowOffset * 4 : na, "EMA Glow 4b", color.new(emaColor, 100), 1, display=display.none)
emaGlow5b = plot(showEmaGlow ? ema - glowOffset * 5 : na, "EMA Glow 5b", color.new(emaColor, 100), 1, display=display.none)
emaGlow6b = plot(showEmaGlow ? ema - glowOffset * 6 : na, "EMA Glow 6b", color.new(emaColor, 100), 1, display=display.none)
emaGlow7b = plot(showEmaGlow ? ema - glowOffset * 7 : na, "EMA Glow 7b", color.new(emaColor, 100), 1, display=display.none)
emaGlow8b = plot(showEmaGlow ? ema - glowOffset * 8 : na, "EMA Glow 8b", color.new(emaColor, 100), 1, display=display.none)
// Create glow layers with fills (from outermost to innermost)
fill(emaGlow8, emaGlow7, showEmaGlow ? color.new(emaColor, 97) : na)
fill(emaGlow7, emaGlow6, showEmaGlow ? color.new(emaColor, 95) : na)
fill(emaGlow6, emaGlow5, showEmaGlow ? color.new(emaColor, 93) : na)
fill(emaGlow5, emaGlow4, showEmaGlow ? color.new(emaColor, 90) : na)
fill(emaGlow4, emaGlow3, showEmaGlow ? color.new(emaColor, 87) : na)
fill(emaGlow3, emaGlow2, showEmaGlow ? color.new(emaColor, 83) : na)
fill(emaGlow2, emaGlow1, showEmaGlow ? color.new(emaColor, 78) : na)
fill(emaGlow1, emaCore, showEmaGlow ? color.new(emaColor, 70) : na)
fill(emaCore, emaGlow1b, showEmaGlow ? color.new(emaColor, 70) : na)
fill(emaGlow1b, emaGlow2b, showEmaGlow ? color.new(emaColor, 78) : na)
fill(emaGlow2b, emaGlow3b, showEmaGlow ? color.new(emaColor, 83) : na)
fill(emaGlow3b, emaGlow4b, showEmaGlow ? color.new(emaColor, 87) : na)
fill(emaGlow4b, emaGlow5b, showEmaGlow ? color.new(emaColor, 90) : na)
fill(emaGlow5b, emaGlow6b, showEmaGlow ? color.new(emaColor, 93) : na)
fill(emaGlow6b, emaGlow7b, showEmaGlow ? color.new(emaColor, 95) : na)
fill(emaGlow7b, emaGlow8b, showEmaGlow ? color.new(emaColor, 97) : na)
// ============================================================================
// Swing high/low detection
// ============================================================================
// Swing High/Low Detection
swingHigh = ta.pivothigh(high, swingLength, swingLength)
swingLow = ta.pivotlow(low, swingLength, swingLength)
// Cooloff tracking
var int lastSwingHighPlot = na
var int lastSwingLowPlot = na
// Check if cooloff period has passed
canPlotHigh = na(lastSwingHighPlot) or (bar_index - lastSwingHighPlot) >= swingCooloff
canPlotLow = na(lastSwingLowPlot) or (bar_index - lastSwingLowPlot) >= swingCooloff
// Store swing points
var float lastSwingHigh = na
var int lastSwingHighBar = na
var float lastSwingLow = na
var int lastSwingLowBar = na
// Track previous swing for BOS detection
var float prevSwingHigh = na
var float prevSwingLow = na
// Update swing highs with cooloff
if not na(swingHigh) and canPlotHigh
prevSwingHigh := lastSwingHigh
lastSwingHigh := swingHigh
lastSwingHighBar := bar_index - swingLength
lastSwingHighPlot := bar_index
// Update swing lows with cooloff
if not na(swingLow) and canPlotLow
prevSwingLow := lastSwingLow
lastSwingLow := swingLow
lastSwingLowBar := bar_index - swingLength
lastSwingLowPlot := bar_index
// ============================================================================
// Structure lines & zones
// ============================================================================
var line swingHighLine = na
var line swingLowLine = na
var box swingHighZone = na
var box swingLowZone = na
if showSwingLines
// Draw line connecting swing highs with zones
if not na(swingHigh) and canPlotHigh and not na(prevSwingHigh)
if not na(lastSwingHighBar)
line.delete(swingHighLine)
swingHighLine := line.new(lastSwingHighBar, lastSwingHigh, bar_index - swingLength, swingHigh, color=color.new(#ff3366, 0), width=2, style=line.style_solid)
// Create resistance zone
if showSwingZones
box.delete(swingHighZone)
zoneTop = math.max(lastSwingHigh, swingHigh)
zoneBottom = math.min(lastSwingHigh, swingHigh)
swingHighZone := box.new(lastSwingHighBar, zoneTop, bar_index - swingLength, zoneBottom, border_color=color.new(#ff3366, 80), bgcolor=color.new(#ff3366, 92))
// Draw line connecting swing lows with zones
if not na(swingLow) and canPlotLow and not na(prevSwingLow)
if not na(lastSwingLowBar)
line.delete(swingLowLine)
swingLowLine := line.new(lastSwingLowBar, lastSwingLow, bar_index - swingLength, swingLow, color=color.new(#00ff88, 0), width=2, style=line.style_solid)
// Create support zone
if showSwingZones
box.delete(swingLowZone)
zoneTop = math.max(lastSwingLow, swingLow)
zoneBottom = math.min(lastSwingLow, swingLow)
swingLowZone := box.new(lastSwingLowBar, zoneTop, bar_index - swingLength, zoneBottom, border_color=color.new(#00ff88, 80), bgcolor=color.new(#00ff88, 92))
// ============================================================================
// Break of structure (bos)
// ============================================================================
// Track last BOS bar for cooloff
var int lastBullishBOS = na
var int lastBearishBOS = na
// Check if cooloff period has passed
canPlotBullishBOS = na(lastBullishBOS) or (bar_index - lastBullishBOS) >= bosCooloff
canPlotBearishBOS = na(lastBearishBOS) or (bar_index - lastBearishBOS) >= bosCooloff
// Bullish BOS: Price breaks above previous swing high while EMA is bullish
bullishBOS = showBOS and canPlotBullishBOS and emaTrend == 1 and not na(prevSwingHigh) and close > prevSwingHigh and close <= prevSwingHigh
// Bearish BOS: Price breaks below previous swing low while EMA is bearish
bearishBOS = showBOS and canPlotBearishBOS and emaTrend == -1 and not na(prevSwingLow) and close < prevSwingLow and close >= prevSwingLow
// Update last BOS bars
if bullishBOS
lastBullishBOS := bar_index
if bearishBOS
lastBearishBOS := bar_index
// Plot BOS with enhanced visuals and SL at the candle wick
if bullishBOS
// Calculate SL at the low of the current candle (bottom of wick) with buffer
slLevel = low * (1 - slBuffer/100)
// BOS Label with shadow effect
label.new(bar_index, low, "BOS", style=label.style_label_up, color=color.new(#00ff88, 0), textcolor=color.black, size=size.normal, tooltip="Bullish Break of Structure\nSL: " + str.tostring(slLevel))
// Main SL line at candle low
line.new(bar_index, slLevel, bar_index + slExtension, slLevel, color=color.new(#00ff88, 0), width=2, style=line.style_dashed, extend=extend.none)
// SL zone box for visual emphasis
box.new(bar_index, slLevel + (slLevel * 0.002), bar_index + slExtension, slLevel - (slLevel * 0.002), border_color=color.new(#00ff88, 60), bgcolor=color.new(#00ff88, 85))
// S/R label
label.new(bar_index + slExtension, slLevel, "S/R", style=label.style_label_left, color=color.new(#00ff88, 0), textcolor=color.black, size=size.tiny)
if bearishBOS
// Calculate SL at the high of the current candle (top of wick) with buffer
slLevel = high * (1 + slBuffer/100)
// BOS Label with shadow effect
label.new(bar_index, high, "BOS", style=label.style_label_down, color=color.new(#ff3366, 0), textcolor=color.white, size=size.normal, tooltip="Bearish Break of Structure\nSL: " + str.tostring(slLevel))
// Main SL line at candle high
line.new(bar_index, slLevel, bar_index + slExtension, slLevel, color=color.new(#ff3366, 0), width=2, style=line.style_dashed, extend=extend.none)
// SL zone box for visual emphasis
box.new(bar_index, slLevel + (slLevel * 0.002), bar_index + slExtension, slLevel - (slLevel * 0.002), border_color=color.new(#ff3366, 60), bgcolor=color.new(#ff3366, 85))
// S/R label
label.new(bar_index + slExtension, slLevel, "S/R", style=label.style_label_left, color=color.new(#ff3366, 0), textcolor=color.white, size=size.tiny)
// ============================================================================
// Dynamic background zones
// ============================================================================
bgcolor(showBG and emaTrend == 1 ? bgBullColor : showBG and emaTrend == -1 ? bgBearColor : na)
// ============================================================================
// Alerts
// ============================================================================
alertcondition(bullishBOS, "Bullish BOS", "Bullish Break of Structure detected!")
alertcondition(bearishBOS, "Bearish BOS", "Bearish Break of Structure detected!")
alertcondition(emaTrend == 1 and emaTrend != 1, "EMA Bullish", "EMA turned bullish")
alertcondition(emaTrend == -1 and emaTrend != -1, "EMA Bearish", "EMA turned bearish")
// ╔════════════════════════════════╗
// ║ Download at ║
// ╚════════════════════════════════╝
// ███████╗██╗███╗ ███╗██████╗ ██╗ ███████╗
// ██╔════╝██║████╗ ████║██╔══██╗██║ ██╔════╝
// ███████╗██║██╔████╔██║██████╔╝██║ █████╗
// ╚════██║██║██║╚██╔╝██║██╔═══╝ ██║ ██╔══╝
// ███████║██║██║ ╚═╝ ██║██║ ███████╗███████╗
// ╚══════╝╚═╝╚═╝ ╚═╝╚═╝ ╚══════╝╚══════╝
// ███████╗ ██████╗ ██████╗ ███████╗██╗ ██╗
// ██╔════╝██╔═══██╗██╔══██╗██╔════╝╚██╗██╔╝
// █████╗ ██║ ██║██████╔╝█████╗ ╚███╔╝
// ██╔══╝ ██║ ██║██╔══██╗██╔══╝ ██╔██╗
// ██║ ╚██████╔╝██║ ██║███████╗██╔╝ ██╗
// ╚═╝ ╚═════╝ ╚═╝ ╚═╝╚══════╝╚═╝ ╚═╝
// ████████╗ ██████╗ ██████╗ ██╗ ███████╗
// ╚══██╔══╝██╔═══██╗██╔═══██╗██║ ██╔════╝
// ██║ ██║ ██║██║ ██║██║ ███████╗
// ██║ ██║ ██║██║ ██║██║ ╚════██║
// ██║ ╚██████╔╝╚██████╔╝███████╗███████║
// ╚═╝ ╚═════╝ ╚═════╝ ╚══════╝╚══════╝
// ==========================================================================================

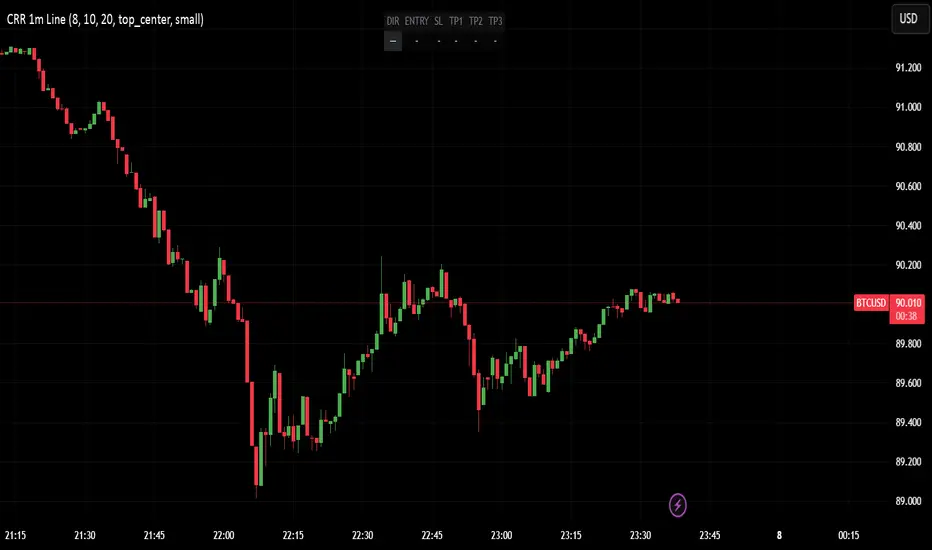
CRR - Entry SIN RETROUse in 1 minute:
EMA 15, 30, 200 → strong trend.
VWAP → institutional fair price.
RSI (8) → strength (Bull > 60, Bear < 40).
MACD → momentum direction.
Volume vs. average → ensure sufficient liquidity.
FVG (optional) → liquidity gap in your favor.
2️⃣ Signals WITHOUT PULLBACK
BUY WITHOUT PULLBACK when:
EMA15 > EMA30 > EMA200 (strong bullish trend)
MACD bullish, RSI > 60
High volume
Price above EMA15 and VWAP
(Optional) Bullish FVG in your favor
SELL WITHOUT PULLBACK when everything above is reversed (bearish).
Generate alerts:
CRR BUY 1m WITHOUT PULLBACK
CRR SELL 1m WITHOUT PULLBACK
3️⃣ Single-line HUD
When a signal appears, everything is automatically set up:
DIR: BUY / SELL / —
ENTRY: entry price
SL: 1× ATR
TP1, TP2, TP3: 1×, 2×, and 3× ATR
Everything is displayed in a compact HUD (configurable position).
🧠 In simple terms:
It's your engine for quick entries in 1M when the market is moving at full speed, without pullbacks, with everything filtered by trend, strength, volume, and FVG, and it provides you with the ENTRY–SL–TPs ready to go.
Indian Scalper 2025 – PSAR + SMA50 + RSI≤50 + High Volume (75%)Best 1-min / 2-min scalping strategy for NIFTY, BANKNIFTY, FINNIFTY & liquid stocks in 2025
✓ PSAR flip + SMA-50 trend filter
✓ RSI ≤50 (avoids chasing)
✓ Only high-volume candles (bright colour)
✓ Loud mobile alerts with price & SL
✓ 1:2+ RR with PSAR trailing
Works like magic 9:15–11:30 AM and 2–3:20 PM
Made with love for the Indian trading community ♥

Trend Gazer: Unified ICT Trading System with Signals# Trend Gazer User Guide (English)
## 📖 Table of Contents
1. (#about-this-indicator)
2. (#quick-start-guide-3-steps)
3. (#detailed-usage)
4. (#settings-customization)
5. (#why-combine-multiple-features)
6. (#faq)
---
## About This Indicator
**Trend Gazer** is an integrated trading system designed to read institutional order flow like professional traders.
### 🎯 3 Problems This Indicator Solves
#### ❌ Problem 1: Too Many Indicators = Information Overload
```
Normal: RSI + MACD + Moving Average + Bollinger Bands... → Cluttered chart
Solution: All integrated into ONE indicator → Clean & Clear
```
#### ❌ Problem 2: Single Indicators Give False Signals
```
Normal: Enter based on RSI alone → Frequent stop-outs
Solution: Structure × Zone × Momentum multi-angle confirmation → Higher win rate
```
#### ❌ Problem 3: Unclear Entry Timing
```
Normal: Know the trend but don't know WHERE to enter
Solution: LS Bounce Signal shows EXACT entry points
```
---
## Quick Start Guide (3 Steps)
### 🚀 STEP 1: Confirm Trend Direction
**Look for CHoCH (Change of Character)**
```
📍 (1.CHoCH) label = Uptrend starting
📍 (a.CHoCH) label = Downtrend starting
```
**Important**: Wait for CHoCH! No direction without it.
---
### 🎯 STEP 2: Find Entry Points
**Wait for LS Bounce Signal (green/red labels)**
```
🟢 "Long@ HL only" label → LONG (buy) candidate
🔴 "Short@ LH only" label → SHORT (sell) candidate
```
**Label text color meaning**:
- **White text**: Clean trend (high confidence)
- **Yellow text**: Trend transition (moderate caution)
---
### 🛡️ STEP 3: Final Confirmation with Bar Color
**Bar color shows market state**
```
🔴 Red bar: BUY zone (buying is favored)
🟢 Green bar: SELL zone (selling is favored)
⚪ White bar: Neutral (wait and see)
```
---
## Detailed Usage
### 📊 Understanding the Chart
#### 1. Labels (Market Structure Changes)
```
(1.CHoCH) / (a.CHoCH) : Trend reversal
(2.SiMS) / (b.SiMS) : Momentum confirmation
(3.BoMS) / (c.BoMS) : Trend continuation
```
#### 2. Boxes (Institutional Order Zones)
```
📦 Blue boxes: Bullish OB (buy orders accumulated)
📦 Red boxes: Bearish OB (sell orders accumulated)
📦 Black transparent boxes: Liquidity Sweep
```
**How to use Order Blocks**:
- Function as support/resistance
- Signals within OB have higher reliability
- Use for stop-loss placement
#### 3. Lines (Trends and Support/Resistance)
```
━━━ Red lines: EMA20, EMA50, EMA100 (short to mid-term trends)
━━━ Blue lines: 60min NPR/BB bands (support/resistance)
```
#### 4. Bar Colors (Filter 6)
```
Bar color = Real-time market state
🔴 Red: Buying is favored
🟢 Green: Selling is favored
⚪ White: Neutral
```
---
### 🎯 Practical Trading Flow
#### 📍 Preparation Phase
```
1. Open chart (recommended: 5min or 15min)
2. Add Trend Gazer to chart
3. Start in observation mode (don't enter yet)
```
#### 📍 Entry Decision
```
✅ CHoCH confirms direction → Uptrend starting
✅ LS Bounce Signal "Long@ HL only" appears
→ Entry point candidate
✅ Bar turns red → Market supports buying
→ Entry decision 🎯
✅ Place stop below nearest Order Block (blue box)
```
#### 📍 Exit Decision
```
🔴 Opposite LS Bounce Signal "Short@ LH only" appears
→ Consider taking profit
🔴 Bar turns green
→ Potential trend reversal, review position
🔴 Stop loss hit
→ Exit with loss
```
---
### 💡 Tips for Higher Win Rate
#### ✅ DO's
```
1. Enter AFTER CHoCH appears
2. Prioritize white-text LS Bounce Signals
3. Check higher timeframe (1H or Daily) trend
4. Emphasize signals within Order Blocks
5. Use bar color as final confirmation
```
#### ❌ DON'Ts
```
1. Enter before CHoCH → No clear direction
2. Enter only on yellow text → Unstable transition period
3. Ignore bar color → Trading against market state
4. Don't check Order Blocks → Unclear support/resistance
5. Enter same direction consecutively → Overtrading
```
---
## Settings Customization
### 🔧 How to Open Settings
```
1. Right-click on indicator name on chart
2. Select "Settings..."
3. Settings panel opens
```
---
### 📋 Recommended Setting Profiles
#### 🔰 Beginner Settings (Simple)
**Goal**: Reduce noise, show only important signals
```
【FILTERS】
✅ Bonus Filter: ON
✅ Filter 6 (OB/BB/NPR Zone Filter): ON
❌ Direction Filter: OFF
❌ Liquidation Reversal Filter: OFF
❌ ICT Market Structure Filter: OFF
❌ EMA Trend Filter: OFF
❌ OB/FVG Filter 1: OFF
❌ OB/FVG Filter 2: OFF
【SIGNALS】
✅ Signal 0 (Bonus): ON
✅ Signal 1 (VWC Change): ON
✅ Signal 2 (Liq Rev): ON
❌ Signal 3 (LS): OFF (complex alone)
❌ Signal 4 (LS Break): OFF
❌ Signal 5 (OB+LS NPR): OFF
❌ Signal 6 (OB+LS EMA): OFF
【LS BOUNCE SIGNAL】
✅ Exclude EMA50 from touch detection: OFF
❌ Only show when EMA fills are mixed: OFF
```
**What happens with this setup**:
- Only Bonus (black background) signals display
- LS Bounce Signals clearly visible
- Noisy signals filtered out
---
#### 💪 Intermediate Settings (Balanced)
**Goal**: Enable key filters for better accuracy
```
【FILTERS】
✅ Bonus Filter: ON
✅ Filter 6 (OB/BB/NPR Zone Filter): ON
✅ ICT Market Structure Filter: ON
❌ Direction Filter: OFF
❌ Liquidation Reversal Filter: OFF
❌ EMA Trend Filter: OFF
❌ OB/FVG Filter 1: OFF
❌ OB/FVG Filter 2: OFF
【SIGNALS】
✅ Signal 0 (Bonus): ON
✅ Signal 1 (VWC Change): ON
✅ Signal 2 (Liq Rev): ON
✅ Signal 3 (LS): ON
❌ Signal 4 (LS Break): OFF
❌ Signal 5 (OB+LS NPR): OFF
❌ Signal 6 (OB+LS EMA): OFF
【LS BOUNCE SIGNAL】
✅ Exclude EMA50 from touch detection: OFF
❌ Only show when EMA fills are mixed: OFF
```
**What happens with this setup**:
- Signals only after CHoCH (trend confirmed)
- Filter 6 changes bar colors
- Liquidity Sweeps also displayed
---
#### 🚀 Advanced Settings (Full Utilization)
**Goal**: Master all features
```
【FILTERS】
✅ Bonus Filter: ON
✅ Filter 6 (OB/BB/NPR Zone Filter): ON
✅ ICT Market Structure Filter: ON
✅ Direction Filter: ON
✅ EMA Trend Filter: ON
❌ Liquidation Reversal Filter: OFF (optional)
✅ OB/FVG Filter 1: ON
✅ OB/FVG Filter 2: ON
【SIGNALS】
✅ All ON
【LS BOUNCE SIGNAL】
✅ Exclude EMA50 from touch detection: ON (reduce EMA50 noise)
✅ Only show when EMA fills are mixed: ON (show only transition zones)
```
**What happens with this setup**:
- Fewer signals (precision-focused)
- Multiple confirmations greatly reduce false signals
- Only signals confirmed by trend, momentum, and zones
---
### 🎨 Display Customization
#### Change Label Size
```
【BUY/SELL SIGNAL APPEARANCE】
→ "BUY/SELL Label Size"
→ Choose from: tiny / small / normal / large / huge
Recommended: small (default)
```
#### Order Block Display Settings
```
【ORDER BLOCK (OB) SETTINGS】
✅ Show Current TF OB: Current timeframe OB
✅ Show 1min OB: 1-minute OB
✅ Show 5min OB: 5-minute OB
✅ Show 15min OB: 15-minute OB
Recommended: Only 15min OB ON (simple)
```
#### Liquidity Sweep Display
```
【LIQUIDITY SWEEPS SETTINGS】
→ "Sweep Length": Sensitivity (small=frequent, large=selective)
→ "Sweep Option": Standard / Maximum
Recommended: Length=40, Option=Standard
```
#### NPR/BB Bands Display
```
【NPR (NON-REPAINT STDEV) SETTINGS】
✅ Display 60min NPR Bands: 60-minute support/resistance
❌ Display Current TF NPR Bands: Current timeframe (optional)
Recommended: Only 60min ON
```
---
### ⚙️ Advanced Settings
#### Fine-tune Filter 6
```
【FINAL FILTERS】
→ "Enable Filter 6 (OB/BB/NPR Zone Filter)"
When ON:
- Bars color-coded red/green/white
- Behavior at OB, NPR/BB touches controlled
```
#### LS Bounce Signal Adjustments
```
【LS BOUNCE SIGNAL】
→ "Exclude EMA50 from touch detection"
OFF: Detect NPR/BB/EMA50 (all 3)
ON: Detect NPR/BB only (exclude EMA50)
→ "Only show when EMA fills are mixed"
OFF: Show all LS Bounce Signals
ON: Show only transition zone signals (yellow text)
```
#### MTF (Multi-Timeframe) Control
```
【ORDER BLOCK (OB) SETTINGS】
→ "Disable MTF on 1hr+ Charts"
ON: Disable MTF on 1H+ (save memory)
OFF: MTF enabled on all timeframes
Recommended: ON (unnecessary on larger timeframes)
```
---
### 🎯 Purpose-Based Configuration Guide
#### 🔍 Goal 1: Reduce Signal Count
```
✅ Bonus Filter: ON
✅ ICT Market Structure Filter: ON
✅ Filter 6: ON
✅ All Signals OFF, only Signal 0 ON
```
#### 🔍 Goal 2: Get More Signals
```
❌ All Filters OFF
✅ All Signals ON
```
#### 🔍 Goal 3: Trend Following Only
```
✅ ICT Market Structure Filter: ON
✅ Direction Filter: ON
✅ EMA Trend Filter: ON
```
#### 🔍 Goal 4: Counter-Trend Trading
```
✅ LS Bounce Signal: ON
✅ Filter 6: ON
❌ ICT Market Structure Filter: OFF
```
#### 🔍 Goal 5: Day Trading (5-15min charts)
```
✅ Show 15min OB: ON
✅ Display 60min NPR Bands: ON
✅ LS Bounce Signal: ON
❌ Show 1min/5min OB: OFF
```
#### 🔍 Goal 6: Scalping (1-5min charts)
```
✅ Show 5min OB: ON
✅ Show 15min OB: ON
✅ Display 60min NPR Bands: ON
✅ All Signals: ON
```
---
### 💾 Saving and Loading Settings
#### Save Settings
```
1. Click "..." in top-right of Settings screen
2. Select "Save as default"
→ Same settings auto-applied next time
```
#### Reset Settings
```
1. Click "..." in top-right of Settings screen
2. Select "Reset settings"
→ Return to default settings
```
---
## Why Combine Multiple Features?
### 🎯 Problem: Single Indicator Limitations
Common trader problems:
```
❌ RSI alone → Trade against trend, lose
❌ Moving Average alone → Late entry timing
❌ Support/Resistance alone → Caught by false breakouts
```
**Markets are complex**. One angle isn't enough.
---
### 💡 Solution: Multi-Angle Integrated Approach
#### 1️⃣ Structure × Zone × Momentum
```
📐 Structure (ICT CHoCH)
→ "Which direction is likely?"
📦 Zone (OB/NPR/BB)
→ "Where will price react?"
💨 Momentum (EMA/VWC)
→ "Is there momentum now?"
```
**When all 3 align = Highest win-rate timing**
---
#### 2️⃣ Multi-Timeframe Analysis
```
Big picture: Confirm Daily direction
Medium-term: Check 1H Order Blocks
Short-term: Time entry on 5min
```
**Short-term entries aligned with higher timeframes = Better win rate**
---
#### 3️⃣ Understanding Liquidity
```
🎣 Institutional strategy:
1. Intentionally move price opposite to stop out retail
2. Then, move in real direction
💡 Liquidity Sweep = Visualize this "trap"
→ Read institutional order flow
```
---
### 🧠 Integration Examples
#### Case 1: RSI Alone vs Integrated System
**Scenario**: RSI at 30 (oversold)
```
❌ RSI-only decision:
→ "Buy!"
→ But downtrend continues, loss 😢
✅ Trend Gazer:
CHoCH check → Still downtrend ❌
Order Block → In Bearish OB ❌
LS Bounce → SHORT signal only ❌
→ Skip or SHORT
→ Avoid loss ✅
```
**Result**: Multiple filters block wrong entry
---
#### Case 2: LS Bounce Signal 2-Stage Logic
**Scenario**: Price touches 60min NPR lower band
```
🔍 Traditional method:
Touched → Buy!
→ But price continues down 😢
✅ Trend Gazer:
Stage 1: NPR touch + red bar → Flag ON
Stage 2: EMA20 crosses above EMA50 → Confirm bounce
→ Now "Long@ HL only" displays
→ Entry → Success ✅
```
**Result**: Not just "touch" but "touch + bounce confirmation" improves accuracy
---
### 🎓 Progressive Learning Design
This indicator is designed for **beginners to advanced**:
```
📖 Beginner (Month 1):
Use only CHoCH + LS Bounce Signal
→ Learn trend and entry points
📖 Intermediate (Months 2-3):
Add Order Block + Bar Color
→ Learn support/resistance and filtering
📖 Advanced (Month 6+):
Master all features
→ Read institutional order flow
```
**Ultimate goal**: Indicator becomes confirmation tool. Your market sense becomes primary.
---
### 🔬 Technical Advantages
#### 1. Non-Repaint STDEV (NPR)
```
Normal Bollinger Bands:
→ Past data changes (repaints)
→ Inaccurate backtesting
NPR:
→ Past data doesn't change (non-repaint)
→ Reliable verification possible
```
#### 2. 2-Stage Signal Logic
```
Traditional: Condition met → Immediate signal
→ Many false signals
Trend Gazer: Condition1 → Flag ON → Condition2 → Signal
→ Confirmation step improves accuracy
```
#### 3. Alternating Filter
```
Problem: Same-direction signals spam
→ Overtrading
Solution: LONG → SHORT → LONG alternating only
→ Prevent unnecessary entries
```
---
### 💎 Conclusion: Why Integration?
```
Single indicator = "Partial truth"
Integrated system = "3D market perspective"
```
**Markets are multifaceted**. One angle isn't enough.
Trend Gazer **integrates multiple screens pros watch simultaneously into ONE**,
allowing beginners to read charts with institutional perspective.
---
## FAQ
### ❓ Q1: Which timeframe is best?
**A**: Depends on trading style
```
Scalping: 1min ~ 5min
Day Trading: 5min ~ 15min
Swing: 1H ~ 4H
```
**Important**: LS Bounce Signal only works on 30min and below.
---
### ❓ Q2: Too many signals, confused
**A**: Enable filters
```
【Recommended Settings】
✅ Bonus Filter: ON
✅ Filter 6: ON
✅ ICT Market Structure Filter: ON
→ Show only Signal 0
```
This significantly reduces signal count.
---
### ❓ Q3: No CHoCH appearing, what to do?
**A**: Wait or check higher timeframe
```
Method 1: Wait for CHoCH (recommended)
Method 2: Check higher timeframe (e.g., Daily) for trend
Method 3: Disable ICT Filter (not recommended)
```
**When trend is unclear, sitting out is also strategy**.
---
### ❓ Q4: LS Bounce Signal not appearing
**A**: Checkpoints
```
1. Are you on 30min or below chart?
→ Doesn't show on 1H+
2. Are NPR/BB bands displayed?
→ Check Settings "Display 60min NPR Bands"
3. Is EMA50 excluded?
→ If "Exclude EMA50" is ON, EMA50 signals won't show
```
---
### ❓ Q5: Bar color not changing?
**A**: Check Filter 6
```
Settings → FINAL FILTERS
→ Confirm "Enable Filter 6 (OB/BB/NPR Zone Filter)" is ON
If ON but still not changing:
→ Current price may be outside OB/NPR/BB zones
```
---
### ❓ Q6: Too many Order Blocks, hard to see
**A**: Narrow down displayed OBs
```
Settings → ORDER BLOCK (OB) SETTINGS
Recommended:
❌ Show Current TF OB: OFF
❌ Show 1min OB: OFF
❌ Show 5min OB: OFF
✅ Show 15min OB: ON (only this)
```
---
### ❓ Q7: How to improve win rate?
**A**: Thorough multiple confirmations
```
Checklist:
✅ CHoCH appeared
✅ LS Bounce Signal (white text)
✅ Bar color matches (red bar=LONG, green bar=SHORT)
✅ Signal within Order Block
✅ Aligns with higher timeframe trend
Enter ONLY when all align
```
---
### ❓ Q8: Want to practice on demo
**A**: Recommended practice method
```
Week 1: Observation only
→ Watch signals and chart movement
→ Resist entering
Weeks 2-3: Keep records
→ Screenshot when signal appears
→ Record subsequent movement
Week 4+: Start demo trading
→ Start with small amounts
→ Continue keeping records
```
---
### ❓ Q9: Are there alert features?
**A**: Yes, multiple alerts available
```
Setup method:
1. Right-click indicator on chart
2. Select "Add Alert..."
3. Choose from:
- ANY ALERT: BUY/SELL Signals
- BUY ONLY ALERT
- SELL ONLY ALERT
- MS UP / MS DOWN
- BAR COLOR: RED / LIME
- LS BOUNCE: LONG / SHORT Signal
```
---
### ❓ Q10: Works on other markets?
**A**: Yes, works on all markets
```
✅ Cryptocurrency (BTC, ETH, etc.)
✅ Forex (EUR/USD, USD/JPY, etc.)
✅ Stocks (individual stocks, indices)
✅ Futures (oil, gold, etc.)
```
Works on any market with price and volume data.
---
## 📋 Disclaimer
### ⚠️ Important Notice
This indicator is for **educational and informational purposes only**.
```
❌ NOT investment advice
❌ Does NOT guarantee profits
❌ Past results do NOT guarantee future performance
```
### Risk Warning
```
⚠️ Trading involves substantial risk
⚠️ Only trade with funds you can afford to lose
⚠️ Practice extensively on demo account before live trading
⚠️ Make your own informed decisions and act at your own risk
```
---
## 📞 Support
### Feedback & Questions
Feel free to ask questions in TradingView comments section.
### Bug Reports
Please report with specific details (timeframe, symbol, screenshots).
---
**Author**: rasukaru666
**License**: Mozilla Public License 2.0
**Last Updated**: December 2025
**Version**: Latest
---
**Thank you for using Trend Gazer!**
**Happy Trading! 📈**
---------------

ACCDv3# ACCDv3 - Accumulation/Distribution MACD with Divergence Detection
## Overview
**ACCDv3** (Accumulation/Distribution MACD Version 3) is an advanced volume-weighted momentum indicator that combines the Accumulation/Distribution (A/D) line with MACD methodology and divergence detection. It helps identify trend strength, momentum shifts, and potential reversals by analyzing volume-weighted price movements.
## Key Features
- **Volume-Weighted MACD**: Applies MACD calculation to volume-weighted A/D values for earlier, more reliable signals
- **Divergence Detection**: Identifies when A/D trend diverges from MACD momentum
- **Volume Strength Filtering**: Distinguishes high-volume confirmations from low-volume noise
- **Color-Coded Histogram**: 4-color system showing momentum direction and volume strength
- **Real-Time Alerts**: Background colors and alert conditions for bullish/bearish divergences
## Components
### 1. Accumulation/Distribution (A/D) Line
The A/D line measures buying and selling pressure by comparing the close price to the trading range, weighted by volume:
```
A/D = Σ ((2 × Close - Low - High) / (High - Low)) × Volume
```
- **Rising A/D**: More accumulation (buying pressure)
- **Falling A/D**: More distribution (selling pressure)
- **Doji Handling**: When High = Low, contribution is zero (avoids division errors)
### 2. Volume-Weighted MACD
Instead of simple EMAs, the indicator weights A/D values by volume:
- **Fast Line** (default 12): `EMA(A/D × Volume, 12) / EMA(Volume, 12)`
- **Slow Line** (default 26): `EMA(A/D × Volume, 26) / EMA(Volume, 26)`
- **MACD Line**: Fast Line - Slow Line (green line)
- **Signal Line** (default 9): EMA or SMA of MACD (orange line)
- **Histogram**: MACD - Signal (color-coded columns)
This volume-weighting ensures that periods with higher volume have greater influence on the indicator values.
### 3. Histogram Color System
The histogram uses 4 distinct colors based on **direction** and **volume strength**:
| Condition | Color | Meaning |
|-----------|-------|---------|
| Rising + High Volume | **Dark Green** (#1B5E20) | Strong bullish momentum with volume confirmation |
| Rising + Low Volume | **Light Teal** (#26A69A) | Bullish momentum but weak volume (less reliable) |
| Falling + High Volume | **Dark Red** (#B71C1C) | Strong bearish momentum with volume confirmation |
| Falling + Low Volume | **Light Red/Pink** (#FFCDD2) | Bearish momentum but weak volume (less reliable) |
Additional shading:
- **Light Cyan** (#B2DFDB): Positive but not rising (momentum stalling)
- **Bright Red** (#FF5252): Negative and accelerating down
### 4. Divergence Detection
Divergence occurs when A/D trend and MACD momentum move in opposite directions:
#### Bullish Divergence (Green Background)
- **Condition**: A/D is trending up BUT MACD is negative and trending down
- **Interpretation**: Accumulation increasing while momentum appears weak
- **Signal**: Potential bullish reversal or continuation
- **Action**: Look for entry opportunities or hold long positions
#### Bearish Divergence (Red Background)
- **Condition**: A/D is trending down BUT MACD is positive and trending up
- **Interpretation**: Distribution increasing while momentum appears strong
- **Signal**: Potential bearish reversal or weakening uptrend
- **Action**: Consider exits, tighten stops, or prepare for reversal
## Parameters
| Parameter | Default | Range | Description |
|-----------|---------|-------|-------------|
| **Fast Length** | 12 | 1-50 | Period for fast EMA (shorter = more sensitive) |
| **Slow Length** | 26 | 1-100 | Period for slow EMA (longer = smoother) |
| **Signal Smoothing** | 9 | 1-50 | Period for signal line (MACD smoothing) |
| **Signal Line MA Type** | EMA | SMA/EMA | Moving average type for signal calculation |
| **Volume MA Length** | 20 | 5-100 | Period for volume average (strength filter) |
## Usage Guide
### Reading the Indicator
1. **MACD Lines (Green & Orange)**
- **Crossovers**: When green crosses above orange = bullish, below = bearish
- **Distance**: Wider gap = stronger momentum
- **Zero Line**: Above = bullish bias, below = bearish bias
2. **Histogram Colors**
- Focus on **dark colors** (dark green/red) for high-confidence signals
- Be cautious with **light colors** (teal/pink) - wait for volume confirmation
- Watch for **rising red bars** (V-bottom pattern) = potential bullish reversal
- Watch for **falling green bars** (Λ-top pattern) = potential bearish reversal
3. **Background Divergence Alerts**
- **Green background**: Bullish divergence - consider long entries
- **Red background**: Bearish divergence - consider exits or shorts
- Best used in combination with price action and support/resistance levels
### Trading Strategies
#### Trend Following
1. Wait for MACD to cross above zero line with dark green histogram
2. Enter long when histogram shows consecutive dark green bars
3. Exit when histogram turns light green or red appears
#### Divergence Trading
1. Wait for background divergence alert (green or red)
2. Confirm with price action (support/resistance, candlestick patterns)
3. Enter on next dark-colored histogram bar in divergence direction
4. Set stops beyond recent swing high/low
#### Volume Confirmation
1. Ignore signals during low-volume periods (light colors)
2. Take aggressive positions during high-volume confirmations (dark colors)
3. Use volume strength as position sizing guide (larger size on dark bars)
### Best Practices
✓ **Combine with price action**: Don't rely on indicator alone
✓ **Wait for dark colors**: High-volume bars are more reliable
✓ **Watch for divergences**: Early warning signs of reversals
✓ **Use multiple timeframes**: Confirm signals across 1m, 5m, 15m
✓ **Respect zero line**: Trading direction should align with MACD side
✗ **Don't chase light-colored signals**: Low volume = lower reliability
✗ **Don't ignore context**: Market structure and levels matter
✗ **Don't over-trade**: Wait for clear, high-volume setups
✗ **Don't ignore alerts**: Divergences are early warnings
## Technical Details
### Volume-Weighted Calculation Method
Traditional MACD uses simple price EMAs. ACCDv3 weights each A/D value by its corresponding volume:
```pine
// Volume-weighted fast EMA
close_vol_fast = ta.ema(ad × volume, fast_length)
vol_fast = ta.ema(volume, fast_length)
vw_ad_fast = close_vol_fast / vol_fast
// Same for slow EMA
close_vol_slow = ta.ema(ad × volume, slow_length)
vol_slow = ta.ema(volume, slow_length)
vw_ad_slow = close_vol_slow / vol_slow
// MACD is the difference
macd = vw_ad_fast - vw_ad_slow
```
This ensures high-volume periods have proportionally more impact on the indicator.
### Volume Strength Filter
Determines whether current volume is above or below average:
```pine
vol_avg = ta.sma(volume, vol_length)
vol_strength = volume > vol_avg
```
Used to select dark (high volume) vs light (low volume) histogram colors.
### Divergence Logic
```pine
// A/D trending up if above its 5-period SMA
ad_trend = ad > ta.sma(ad, 5)
// MACD trending up if above zero
macd_trend = macd > 0
// Divergence when trends oppose
divergence = ad_trend != macd_trend
// Specific conditions
bullish_divergence = ad_trend and not macd_trend and macd < 0
bearish_divergence = not ad_trend and macd_trend and macd > 0
```
## Alerts
The indicator includes built-in alert conditions:
- **Bullish Divergence**: "Bullish Divergence: A/D trending up but MACD trending down"
- **Bearish Divergence**: "Bearish Divergence: A/D trending down but MACD trending up"
To enable:
1. Click "Create Alert" button in TradingView
2. Select "ACCDv3" as condition
3. Choose "Bullish Divergence" or "Bearish Divergence"
4. Configure notification method (popup, email, webhook, etc.)
## Comparison with Standard MACD
| Feature | Standard MACD | ACCDv3 |
|---------|---------------|---------|
| **Input** | Close price | Accumulation/Distribution line |
| **Weighting** | Simple EMA | Volume-weighted EMA |
| **Divergence** | Price vs MACD | A/D vs MACD |
| **Volume Analysis** | None | Built-in strength filter |
| **Color System** | 2 colors (up/down) | 4+ colors (direction + volume) |
| **Leading/Lagging** | Lagging | More leading (volume-weighted) |
## Example Scenarios
### Scenario 1: Strong Bullish Signal
- **Chart**: MACD crosses above zero line
- **Histogram**: Dark green bars (#1B5E20) appearing
- **Volume**: Above 20-period average
- **Action**: Enter long, strong momentum with volume confirmation
### Scenario 2: Weak Bearish Signal
- **Chart**: MACD crosses below zero line
- **Histogram**: Light pink bars (#FFCDD2) appearing
- **Volume**: Below 20-period average
- **Action**: Avoid shorting, low volume = unreliable signal
### Scenario 3: Bullish Divergence Reversal
- **Chart**: Price making lower lows
- **Indicator**: A/D line trending up, MACD negative
- **Background**: Green shading appears
- **Histogram**: Transitions from red to dark green
- **Action**: Look for long entry on next dark green bar
### Scenario 4: V-Bottom Reversal
- **Chart**: Downtrend in place
- **Histogram**: Red bars start rising (becoming less negative)
- **Pattern**: Forms "V" shape at bottom
- **Confirmation**: Transitions to dark green bars
- **Action**: Bullish reversal signal, consider long entry
## Timeframe Recommendations
- **1-minute**: Scalping, very fast signals (noisy, use with caution)
- **5-minute**: Intraday momentum trading (recommended)
- **15-minute**: Swing entries, clearer trend signals
- **1-hour+**: Position trading, major trend identification
## Limitations
- **Requires volume data**: Will not work on instruments without volume
- **Lag during consolidation**: MACD is inherently trend-following
- **False signals in chop**: Sideways markets generate noise
- **Not a standalone system**: Should be combined with price action and risk management
## Version History
- **v3**: Removed traditional price MACD, using only volume-weighted A/D MACD with A/D divergence
- **v2**: Added A/D divergence detection, volume strength filtering, enhanced histogram colors
- **v1**: Basic MACD on A/D line with volume-weighted calculation
## Support & Further Reading
For questions, updates, or to report issues, refer to the main project documentation or contact the developer.
**Related Indicators in Suite:**
- **VMACDv3**: Volume-weighted MACD on price (not A/D)
- **RSIv2**: RSI with A/D divergence
- **DMI**: Directional Movement Index with A/D divergence
- **Elder Impulse**: Bar coloring system using volume-weighted MACD
---
*This indicator is for educational purposes. Always practice proper risk management and never risk more than you can afford to lose.*

AI Kernel Regression StrategyHow to Use This Strategy
Paste the Code: Open the Pine Editor, paste the code, and click "Add to chart".
Look for Reversals:
BUY Signal: The price dipped below the green band (oversold) and snapped back up. The script identifies this as a high-probability bounce.
SELL Signal: The price spiked above the red band (overbought) and snapped back down.
Adjust the "Lookback Window":
In the settings (gear icon), if you change Lookback Window to a higher number (e.g., 15-20), the lines become smoother (better for trends).
If you lower it (e.g., 3-5), it becomes very reactive (better for scalping).
Important Note on "Repainting"
This script uses a technique called Regression. In live trading, it works perfectly (the signal appears when the candle closes). However, be aware that "AI" scripts like this are heavy on calculations. If you refresh your browser, the historical lines might shift slightly to fit the data better. Always wait for the candle to close before taking the trade to ensure the signal is locked in.

Quicksilver Recovery Overlay [Strict]The Quicksilver Recovery Overlay is a proprietary visual analysis tool designed to identify high-probability reversal points in volatile markets. Originally developed for internal use to stabilize Prop Firm drawdowns, this script translates complex algorithmic logic into simple, actionable visual signals on your chart.
🚫 The Problem:
Most traders lose capital trying to "catch a falling knife." They buy too early during a crash and get liquidated before the reversal happens.
✅ The Solution:
This overlay forces discipline. It will only print a "QS BUY" signal when three specific institutional criteria are met simultaneously. If the setup is not perfect, the chart remains clean, keeping you out of bad trades.
The Logic (The "Triple Confluence" Engine):
Deep Exhaustion: The Stochastic RSI must pierce the extreme oversold zone (< 20), indicating seller exhaustion.
Momentum Crossover: The Fast %K line must cross above the Slow %D line, confirming momentum has shifted.
Heikin Ashi Filter: The current Heikin Ashi candle must be GREEN (Bullish). This filters out "fake" reversals where price is still wicking down.
Features:
Visual Signal Labels: Green "QS BUY" and Red "QS SELL" tags appear directly on the bar.
Zero Repaint Logic: Signals are confirmed on candle close.
Status Dashboard: A built-in monitor in the top right corner confirms the algorithm is active.
Recommended Settings:
Assets: ETHUSD, BTCUSD, XAUUSD (Gold).
Timeframes:
1-Minute: For scalping and drawdown recovery.
15-Minute: For swing trading and trend reversals.
How to Get Access:
This is a Protected Script. Access is granted exclusively to members of the Quicksilver Algo Systems ecosystem.
Get your license key here: whop.com
Risk Disclosure: Trading involves substantial risk. Past performance is not indicative of future results.

Daily Range SeqDaily Range Seq
Time Window: 04:00 - 10:25 EST
Eval. Window: 10:30 - 15:55 EST
Time Window sets the target for price during the Eval. Window.
If high of time window is created first, then target the high during the Eval. Window.
If low of time window is created first, then target the low during the Eval. Window.

Responsive ADX (RADX)Introducing the new Responsive ADX (RADX), running with a (length = 9) and exactly how it differs from the standard built-in ADX you see on TradingView chart.
This indicator is still a true ADX at its core — it measures trend strength from 0 to 100 and uses the classic +DI and –DI lines to show direction — but it has been carefully "tuned" to react noticeably faster while staying smooth and usable. With the length set to 9, it is one of the most responsive versions you can run without turning into noise.
How it behaves differently from the normal (Wilder) ADX
Normal ADX is lagging, now this version gives you the same trend-strength reading 4–8 bars earlier than the built-in ADX. On a daily chart that can easily be 4–8 calendar days of earlier warning. On a 4-hour chart it’s 16–32 hours earlier. That head-start is the whole point.
The ADX line rises and falls much quicker.
When a new trend actually starts, you will often see this Fast ADX cross above 18–20 while the built-in ADX is still sleeping below 15. Conversely, when a trend dies, this version drops faster, so you’re not left holding a dead trade for an extra week.
The +DI and –DI lines are almost identical to the original, but lightly smoothed with a 5-period EMA (you can turn this off). This makes the DI crossovers cleaner and reduces whipsaws without adding meaningful lag.
The final ADX smoothing uses a lightweight Hull-style technique instead of Wilder’s very slow RMA. This is the main “secret sauce” that removes roughly half the lag while keeping the line smooth and readable.
Values are realistic and tradable.
With length 9 you will typically see:
– 0–18 = flat / chop
– 15–20 = emerging trend (background starts colouring)
– 20–50 = strong trend (most people take this as confirmation)
– above 50–60 only in very powerful moves (same as normal ADX)
The aqua / purple background only appears when both conditions are met: the correct DI is on top and Fast ADX is above your chosen “weak-to-trending” level (default 18).
This prevents the background from flashing on and off in sideways markets — exactly the same logic you liked in the original Trinity ADX, but now much earlier.
In very simple terms
Think of the normal built-in ADX as a diesel truck — reliable but slow to accelerate and slow to stop. Fast Responsive ADX with length 9 is the same truck with a turbocharger — same destination and same load capacity, but it gets up to speed twice as fast and brakes earlier when the road turns.
We would recommend people who switch to this version keep the (length 9–12) because the edge in timing is obvious on the chart.
That’s it — this is a new more responsive version, still-logical ADX!

TMT 1M HA Scalping INDICATOR - Hitesh Nimje📊 TMT 1 Minute HA Scalping Strategy - Hitesh Nimje
🎯 Strategy Overview
A 1-minute scalping strategy designed for high-frequency trading using Heikin Ashi-inspired crossover logic with multiple filters for precision entries.
🔧 Key Components
1. Moving Averages (Trend Detection)
LineTypePeriodColorPurposeFast SMASimple MA9🔵 BluePrimary signal lineSlow SMASimple MA21🔴 RedSecondary confirmationTrend SMASMA (1H)50⚫ BlackOverall market trend bias
2. Entry Signals (Crossover Logic)
🔥 BUY Signal: Fast SMA (9) crosses ABOVE Slow SMA (21)
🔥 SELL Signal: Fast SMA (9) crosses BELOW Slow SMA (21)
3. Entry Filters (4-Layer Confirmation)
✅ LONG Entry = Crossover + Trend Up + RSI Overbought + Bar Confirmed
✅ SHORT Entry = Crossunder + Trend Down + RSI Oversold + Bar Confirmed
longCond = sma_slope > 0 AND rsi >= 70 AND buySignal
shortCond = sma_slope < 0 AND rsi <= 30 AND sellSignal
FilterLongShortPurposeTrend Slopesma_slope > 0sma_slope < 0Market directionRSI FilterRSI >= 70RSI <= 30Momentum extremeCrossoverFast > SlowFast < SlowEntry triggerBar Statebarstate.isconfirmedbarstate.isconfirmedNo repaint
⚡ Risk Management
Stop Loss (Dynamic ATR-based)
Long SL = Lowest Low (7) - 1×ATR(14)
Short SL = Highest High (7) + 1×ATR(14)
Take Profit (1:1 Risk-Reward)
Long TP = Entry + (Entry - SL distance)
Short TP = Entry - (SL distance - Entry)
⏰ Trading Hours
📅 Active: 00:00 - 14:59 (3:00 PM cutoff)
🛑 Auto-close: All positions closed at 15:00
🎨 Visual Elements
📍 BUY Labels: 🟢 Green (below bar)
📍 SELL Labels: 🔴 Red (above bar)
📈 Fast SMA: 🔵 Blue line (9-period)
📉 Slow SMA: 🔴 Red line (21-period)
📊 Trend SMA: ⚫ Black line (50-period, 1H)
⚙️ Input Parameters
ParameterDefaultPurposeEnd of Day1500 (3 PM)Auto-close timeLot Size1Position size
🚀 How It Works (Step-by-Step)
1. Monitor Fast(9) vs Slow(21) SMA crossover
2. Check 1H Trend SMA slope (up/down bias)
3. Validate RSI extreme (70+/30-)
4. Wait for bar confirmation
5. Enter with ATR-based SL & 1:1 TP
6. Auto-exit at 3 PM or SL/TP hit
💡 Strategy Strengths
* ✅ Multi-timeframe trend filter
* ✅ RSI momentum confirmation
* ✅ Dynamic ATR stop losses
* ✅ No repaint signals
* ✅ End-of-day risk control
* ✅ 1:1 Risk-Reward consistency
Perfect for 1-minute scalping on volatile instruments! 🔥
© Hitesh Nimje | Thought Magic Trading
Contact: 8087192915
TRADING DISCLAIMER
RISK WARNING
Trading involves substantial risk of loss and is not suitable for all investors. Past performance is not indicative of future results. You should carefully consider whether trading is suitable for you in light of your circumstances, knowledge, and financial resources.
NO FINANCIAL ADVICE
This indicator is provided for educational and informational purposes only. It does not constitute:
* Financial advice or investment recommendations
* Buy/sell signals or trading signals
* Professional investment advice
* Legal, tax, or accounting guidance
LIMITATIONS AND DISCLAIMERS
Technical Analysis Limitations
* Pivot points are mathematical calculations based on historical price data
* No guarantee of accuracy of price levels or calculations
* Markets can and do behave irrationally for extended periods
* Past performance does not guarantee future results
* Technical analysis should be used in conjunction with fundamental analysis
Data and Calculation Disclaimers
* Calculations are based on available price data at the time of calculation
* Data quality and availability may affect accuracy
* Pivot levels may differ when calculated on different timeframes
* Gaps and irregular market conditions may cause level failures
* Extended hours trading may affect intraday pivot calculations
Market Risks
* Extreme market volatility can invalidate all technical levels
* News events, economic announcements, and market manipulation can cause gaps
* Liquidity issues may prevent execution at calculated levels
* Currency fluctuations, inflation, and interest rate changes affect all levels
* Black swan events and market crashes cannot be predicted by technical analysis
USER RESPONSIBILITIES
Due Diligence
* You are solely responsible for your trading decisions
* Conduct your own research before using this indicator
* Verify calculations with multiple sources before trading
* Consider multiple timeframes and confirm levels with other technical tools
* Never rely solely on one indicator for trading decisions
Risk Management
* Always use proper risk management and position sizing
* Set appropriate stop-losses for all positions
* Never risk more than you can afford to lose
* Consider the inherent risks of leverage and margin trading
* Diversify your portfolio and trading strategies
Professional Consultation
* Consult with qualified financial advisors before trading
* Consider your tax obligations and legal requirements
* Understand the regulations in your jurisdiction
* Seek professional advice for complex trading strategies
LIMITATION OF LIABILITY
Indemnification
The creator and distributor of this indicator shall not be liable for:
* Any trading losses, whether direct or indirect
* Inaccurate or delayed price data
* System failures or technical malfunctions
* Loss of data or profits
* Interruption of service or connectivity issues
No Warranty
This indicator is provided "as is" without warranties of any kind:
* No guarantee of accuracy or completeness
* No warranty of uninterrupted or error-free operation
* No warranty of merchantability or fitness for a particular purpose
* The software may contain bugs or errors
Maximum Liability
In no event shall the liability exceed the purchase price (if any) paid for this indicator. This limitation applies regardless of the theory of liability, whether contract, tort, negligence, or otherwise.
REGULATORY COMPLIANCE
Jurisdiction-Specific Risks
* Regulations vary by country and region
* Some jurisdictions prohibit or restrict certain trading strategies
* Tax implications differ based on your location and trading frequency
* Commodity futures and options trading may have additional requirements
* Currency trading may be regulated differently than stock trading
Professional Trading
* If you are a professional trader, ensure compliance with all applicable regulations
* Adhere to fiduciary duties and best execution requirements
* Maintain required records and reporting
* Follow market abuse regulations and insider trading laws
TECHNICAL SPECIFICATIONS
Data Sources
* Calculations based on TradingView data feeds
* Data accuracy depends on broker and exchange reporting
* Historical data may be subject to adjustments and corrections
* Real-time data may have delays depending on data providers
Software Limitations
* Internet connectivity required for proper operation
* Software updates may change calculations or functionality
* TradingView platform dependencies may affect performance
* Third-party integrations may introduce additional risks
MONEY MANAGEMENT RECOMMENDATIONS
Conservative Approach
* Risk only 1-2% of capital per trade
* Use position sizing based on volatility
* Maintain adequate cash reserves
* Avoid over-leveraging accounts
Portfolio Management
* Diversify across multiple strategies
* Don't put all capital into one approach
* Regularly review and adjust trading strategies
* Maintain detailed trading records
FINAL LEGAL NOTICES
Acceptance of Terms
* By using this indicator, you acknowledge that you have read and understood this disclaimer
* You agree to assume all risks associated with trading
* You confirm that you are legally permitted to trade in your jurisdiction
Updates and Changes
* This disclaimer may be updated without notice
* Continued use constitutes acceptance of any changes
* It is your responsibility to stay informed of updates
Governing Law
* This disclaimer shall be governed by the laws of the jurisdiction where the indicator was created
* Any disputes shall be resolved in the appropriate courts
* Severability clause: If any part of this disclaimer is invalid, the remainder remains enforceable
REMEMBER: THERE ARE NO GUARANTEES IN TRADING. THE MAJORITY OF RETAIL TRADERS LOSE MONEY. TRADE AT YOUR OWN RISK.
Contact Information:
* Creator: Hitesh_Nimje
* Phone: Contact@8087192915
* Source: Thought Magic Trading
© HiteshNimje - All Rights Reserved
This disclaimer should be prominently displayed whenever the indicator is shared, sold, or distributed to ensure users are fully aware of the risks and limitations involved in trading.

