TMT 1M HA Scalping INDICATOR - Hitesh Nimje📊 TMT 1 Minute HA Scalping Strategy - Hitesh Nimje
🎯 Strategy Overview
A 1-minute scalping strategy designed for high-frequency trading using Heikin Ashi-inspired crossover logic with multiple filters for precision entries.
🔧 Key Components
1. Moving Averages (Trend Detection)
LineTypePeriodColorPurposeFast SMASimple MA9🔵 BluePrimary signal lineSlow SMASimple MA21🔴 RedSecondary confirmationTrend SMASMA (1H)50⚫ BlackOverall market trend bias
2. Entry Signals (Crossover Logic)
🔥 BUY Signal: Fast SMA (9) crosses ABOVE Slow SMA (21)
🔥 SELL Signal: Fast SMA (9) crosses BELOW Slow SMA (21)
3. Entry Filters (4-Layer Confirmation)
✅ LONG Entry = Crossover + Trend Up + RSI Overbought + Bar Confirmed
✅ SHORT Entry = Crossunder + Trend Down + RSI Oversold + Bar Confirmed
longCond = sma_slope > 0 AND rsi >= 70 AND buySignal
shortCond = sma_slope < 0 AND rsi <= 30 AND sellSignal
FilterLongShortPurposeTrend Slopesma_slope > 0sma_slope < 0Market directionRSI FilterRSI >= 70RSI <= 30Momentum extremeCrossoverFast > SlowFast < SlowEntry triggerBar Statebarstate.isconfirmedbarstate.isconfirmedNo repaint
⚡ Risk Management
Stop Loss (Dynamic ATR-based)
Long SL = Lowest Low (7) - 1×ATR(14)
Short SL = Highest High (7) + 1×ATR(14)
Take Profit (1:1 Risk-Reward)
Long TP = Entry + (Entry - SL distance)
Short TP = Entry - (SL distance - Entry)
⏰ Trading Hours
📅 Active: 00:00 - 14:59 (3:00 PM cutoff)
🛑 Auto-close: All positions closed at 15:00
🎨 Visual Elements
📍 BUY Labels: 🟢 Green (below bar)
📍 SELL Labels: 🔴 Red (above bar)
📈 Fast SMA: 🔵 Blue line (9-period)
📉 Slow SMA: 🔴 Red line (21-period)
📊 Trend SMA: ⚫ Black line (50-period, 1H)
⚙️ Input Parameters
ParameterDefaultPurposeEnd of Day1500 (3 PM)Auto-close timeLot Size1Position size
🚀 How It Works (Step-by-Step)
1. Monitor Fast(9) vs Slow(21) SMA crossover
2. Check 1H Trend SMA slope (up/down bias)
3. Validate RSI extreme (70+/30-)
4. Wait for bar confirmation
5. Enter with ATR-based SL & 1:1 TP
6. Auto-exit at 3 PM or SL/TP hit
💡 Strategy Strengths
* ✅ Multi-timeframe trend filter
* ✅ RSI momentum confirmation
* ✅ Dynamic ATR stop losses
* ✅ No repaint signals
* ✅ End-of-day risk control
* ✅ 1:1 Risk-Reward consistency
Perfect for 1-minute scalping on volatile instruments! 🔥
© Hitesh Nimje | Thought Magic Trading
Contact: 8087192915
TRADING DISCLAIMER
RISK WARNING
Trading involves substantial risk of loss and is not suitable for all investors. Past performance is not indicative of future results. You should carefully consider whether trading is suitable for you in light of your circumstances, knowledge, and financial resources.
NO FINANCIAL ADVICE
This indicator is provided for educational and informational purposes only. It does not constitute:
* Financial advice or investment recommendations
* Buy/sell signals or trading signals
* Professional investment advice
* Legal, tax, or accounting guidance
LIMITATIONS AND DISCLAIMERS
Technical Analysis Limitations
* Pivot points are mathematical calculations based on historical price data
* No guarantee of accuracy of price levels or calculations
* Markets can and do behave irrationally for extended periods
* Past performance does not guarantee future results
* Technical analysis should be used in conjunction with fundamental analysis
Data and Calculation Disclaimers
* Calculations are based on available price data at the time of calculation
* Data quality and availability may affect accuracy
* Pivot levels may differ when calculated on different timeframes
* Gaps and irregular market conditions may cause level failures
* Extended hours trading may affect intraday pivot calculations
Market Risks
* Extreme market volatility can invalidate all technical levels
* News events, economic announcements, and market manipulation can cause gaps
* Liquidity issues may prevent execution at calculated levels
* Currency fluctuations, inflation, and interest rate changes affect all levels
* Black swan events and market crashes cannot be predicted by technical analysis
USER RESPONSIBILITIES
Due Diligence
* You are solely responsible for your trading decisions
* Conduct your own research before using this indicator
* Verify calculations with multiple sources before trading
* Consider multiple timeframes and confirm levels with other technical tools
* Never rely solely on one indicator for trading decisions
Risk Management
* Always use proper risk management and position sizing
* Set appropriate stop-losses for all positions
* Never risk more than you can afford to lose
* Consider the inherent risks of leverage and margin trading
* Diversify your portfolio and trading strategies
Professional Consultation
* Consult with qualified financial advisors before trading
* Consider your tax obligations and legal requirements
* Understand the regulations in your jurisdiction
* Seek professional advice for complex trading strategies
LIMITATION OF LIABILITY
Indemnification
The creator and distributor of this indicator shall not be liable for:
* Any trading losses, whether direct or indirect
* Inaccurate or delayed price data
* System failures or technical malfunctions
* Loss of data or profits
* Interruption of service or connectivity issues
No Warranty
This indicator is provided "as is" without warranties of any kind:
* No guarantee of accuracy or completeness
* No warranty of uninterrupted or error-free operation
* No warranty of merchantability or fitness for a particular purpose
* The software may contain bugs or errors
Maximum Liability
In no event shall the liability exceed the purchase price (if any) paid for this indicator. This limitation applies regardless of the theory of liability, whether contract, tort, negligence, or otherwise.
REGULATORY COMPLIANCE
Jurisdiction-Specific Risks
* Regulations vary by country and region
* Some jurisdictions prohibit or restrict certain trading strategies
* Tax implications differ based on your location and trading frequency
* Commodity futures and options trading may have additional requirements
* Currency trading may be regulated differently than stock trading
Professional Trading
* If you are a professional trader, ensure compliance with all applicable regulations
* Adhere to fiduciary duties and best execution requirements
* Maintain required records and reporting
* Follow market abuse regulations and insider trading laws
TECHNICAL SPECIFICATIONS
Data Sources
* Calculations based on TradingView data feeds
* Data accuracy depends on broker and exchange reporting
* Historical data may be subject to adjustments and corrections
* Real-time data may have delays depending on data providers
Software Limitations
* Internet connectivity required for proper operation
* Software updates may change calculations or functionality
* TradingView platform dependencies may affect performance
* Third-party integrations may introduce additional risks
MONEY MANAGEMENT RECOMMENDATIONS
Conservative Approach
* Risk only 1-2% of capital per trade
* Use position sizing based on volatility
* Maintain adequate cash reserves
* Avoid over-leveraging accounts
Portfolio Management
* Diversify across multiple strategies
* Don't put all capital into one approach
* Regularly review and adjust trading strategies
* Maintain detailed trading records
FINAL LEGAL NOTICES
Acceptance of Terms
* By using this indicator, you acknowledge that you have read and understood this disclaimer
* You agree to assume all risks associated with trading
* You confirm that you are legally permitted to trade in your jurisdiction
Updates and Changes
* This disclaimer may be updated without notice
* Continued use constitutes acceptance of any changes
* It is your responsibility to stay informed of updates
Governing Law
* This disclaimer shall be governed by the laws of the jurisdiction where the indicator was created
* Any disputes shall be resolved in the appropriate courts
* Severability clause: If any part of this disclaimer is invalid, the remainder remains enforceable
REMEMBER: THERE ARE NO GUARANTEES IN TRADING. THE MAJORITY OF RETAIL TRADERS LOSE MONEY. TRADE AT YOUR OWN RISK.
Contact Information:
* Creator: Hitesh_Nimje
* Phone: Contact@8087192915
* Source: Thought Magic Trading
© HiteshNimje - All Rights Reserved
This disclaimer should be prominently displayed whenever the indicator is shared, sold, or distributed to ensure users are fully aware of the risks and limitations involved in trading.
Search in scripts for "机械革命无界15+时不时闪屏"


Obsidian Flux Matrix# Obsidian Flux Matrix | JackOfAllTrades
Made with my Senior Level AI Pine Script v6 coding bot for the community!
Narrative Overview
Obsidian Flux Matrix (OFM) is an open-source Pine Script v6 study that fuses social sentiment, higher timeframe trend bias, fair-value-gap detection, liquidity raids, VWAP gravitation, session profiling, and a diagnostic HUD. The layout keeps the obsidian palette so critical overlays stay readable without overwhelming a price chart.
Purpose & Scope
OFM focuses on actionable structure rather than marketing claims. It documents every driver that powers its confluence engine so reviewers understand what triggers each visual.
Core Analytical Pillars
1. Social Pulse Engine
Sentiment Webhook Feed: Accepts normalized scores (-1 to +1). Signals only arm when the EMA-smoothed value exceeds the `sentimentMin` input (0.35 by default).
Volume Confirmation: Requires local volume > 30-bar average × `volSpikeMult` (default 2.0) before sentiment flags.
EMA Cross Validation: Fast EMA 8 crossing above/below slow EMA 21 keeps momentum aligned with flow.
Momentum Alignment: Multi-timeframe momentum composite must agree (positive for longs, negative for shorts).
2. Peer Momentum Heatmap
Multi-Timeframe Blend: RSI + Stoch RSI fetched via request.security() on 1H/4H/1D by default.
Composite Scoring: Each timeframe votes +1/-1/0; totals are clamped between -3 and +3.
Intraday Readability: Configurable band thickness (1-5) so scalpers see context without losing space.
Dynamic Opacity: Stronger agreement boosts column opacity for quick bias checks.
3. Trend & Displacement Framework
Dual EMA Ribbon: Cyan/magenta ribbon highlights immediate posture.
HTF Bias: A higher-timeframe EMA (default 55 on 4H) sets macro direction.
Displacement Score: Body-to-ATR ratio (>1.4 default) detects impulses that seed FVGs or VWAP raids.
ATR Normalization: All thresholds float with volatility so the study adapts to assets and regimes.
4. Intelligent Fair Value Gap (FVG) System
Gap Detection: Three-candle logic (bullish: low > high ; bearish: high < low ) with ATR-sized minimums (0.15 × ATR default).
Overlap Prevention: Price-range checks stop redundant boxes.
Spacing Control: `fvgMinSpacing` (default 5) avoids stacking from the same impulse.
Storage Caps: Max three FVGs per side unless the user widens the limit.
Session Awareness: Kill zone filters keep taps focused on London/NY if desired.
Auto Cleanup: Boxes delete when price closes beyond their invalidation level.
5. VWAP Magnet + Liquidity Raid Engine
Session or Rolling VWAP: Toggle resets to match intraday or rolling preferences.
Equal High/Low Scanner: Looks back 20 bars by default for liquidity pools.
Displacement Filter: ATR multiplier ensures raids represent genuine liquidity sweeps.
Mean Reversion Focus: Signals fire when price displaces back toward VWAP following a raid.
6. Session Range Breakout System
Initial Balance Tracking: First N bars (15 default) define the session box.
Breakout Logic: Requires simultaneous liquidity spikes, nearby FVG activity, and supportive momentum.
Z-Score Volume Filter: >1.5σ by default to filter noisy moves.
7. Lifestyle Liquidity Scanner
Volume Z-Scores: 50-bar baseline highlights statistically significant spikes.
Smart Money Footprints: Bottom-of-chart squares color-code buy vs sell participation.
Panel Memory: HUD logs the last five raid timestamps, direction, and normalized size.
8. Risk Matrix & Diagnostic HUD
HUD Structure: Table in the top-right summarizes HTF bias, sentiment, momentum, range state, liquidity memory, and current risk references.
Signal Tags: Aggregates SPS, FVG, VWAP, Range, and Liquidity states into a compact string.
Risk Metrics: Swing-based stops (5-bar lookback) + ATR targets (1.5× default) keep risk transparent.
Signal Families & Alerts
Social Pulse (SPS): Volume-confirmed sentiment alignment; triangle markers with “SPS”.
Kill-Zone FVG: Session + HTF alignment + FVG tap; arrow markers plus SL/TP labels.
Local FVG: Captures local reversals when HTF bias has not flipped yet.
VWAP Raid: Equal-high/low raids that snap toward VWAP; “VWAP” label markers.
Range Breakout: Initial balance violations with liquidity and imbalance confirmation; circle markers.
Liquidity Spike: Z-score spikes ≥ threshold; square markers along the baseline.
Visual Design & Customization
Theme Palette: Primary background RGB (12,6,24). Accent shading RGB (26,10,48). Long accents RGB (88,174,255). Short accents RGB (219,109,255).
Stylized Candles: Optional overlay using theme colors.
Signal Toggles: Independently enable markers, heatmap, and diagnostics.
Label Spacing: Auto-spacing enforces ≥4-bar gaps to prevent text overlap.
Customization & Workflow Notes
Adjust ATR/FVG thresholds when volatility shifts.
Re-anchor sentiment to your webhook cadence; EMA smoothing (default 5) dampens noise.
Reposition the HUD by editing the `table.new` coordinates.
Use multiples of the chart timeframe for HTF requests to minimize load.
Session inputs accept exchange-local time; align them to your market.
Performance & Compliance
Pure Pine v6: Single-line statements, no `lookahead_on`.
Resource Safe: Arrays trimmed, boxes limited, `request.security` cached.
Repaint Awareness: Signals confirm on close; alerts mirror on-chart logic.
Runtime Safety: Arrays/loops guard against `na`.
Use Cases
Measure when social sentiment aligns with structure.
Plan ICT-style intraday rebalances around session-specific FVG taps.
Fade VWAP raids when displacement shows exhaustion.
Watch initial balance breaks backed by statistical volume.
Keep risk/target references anchored in ATR logic.
Signal Logic Snapshot
Social Pulse Long/Short: `sentimentEMA` gated by `sentimentMin`, `volSpike`, EMA 8/21 cross, and `momoComposite` sign agreement. Keeps hype tied to structural follow-through.
Kill-Zone FVG Long/Short: Requires session filter, HTF EMA bias alignment, and an active FVG tap (`bullFvgTap` / `bearFvgTap`). Labels include swing stops + ATR targets pulled from `swingLookback` and `liqTargetMultiple`.
Local FVG Long/Short: Uses `localBullish` / `localBearish` heuristics (EMA slope, displacement, sequential closes) to surface intraday reversals even when HTF bias has not flipped.
VWAP Raids: Detect equal-high/equal-low sweeps (`raidHigh`, `raidLow`) that revert toward `sessionVwap` or rolling VWAP when displacement exceeds `vwapAlertDisplace`.
Range Breakouts: Combine `rangeComplete`, breakout confirmation, liquidity spikes, and nearby FVG activity for statistically backed initial balance breaks.
Liquidity Spikes: Volume Z-score > `zScoreThreshold` logs direction, size, and timestamp for the HUD and optional review workflows.
Session Logic & VWAP Handling
Kill zone + NY session inputs use TradingView’s session strings; `f_inSession()` drives both visual shading and whether FVG taps are tradeable when `killZoneOnly` is true.
Session VWAP resets using cumulative price × volume sums that restart when the daily timestamp changes; rolling VWAP falls back to `ta.vwap(hlc3)` for instruments where daily resets are less relevant.
Initial balance box (`rangeBars` input) locks once complete, extends forward, and stays on chart to contextualize later liquidity raids or breakouts.
Parameter Reference
Trend: `emaFastLen`, `emaSlowLen`, `htfResolution`, `htfEmaLen`, `showEmaRibbon`, `showHtfBiasLine`.
Momentum: `tf1`, `tf2`, `tf3`, `rsiLen`, `stochLen`, `stochSmooth`, `heatmapHeight`.
Volume/Liquidity: `volLookback`, `volSpikeMult`, `zScoreLen`, `zScoreThreshold`, `equalLookback`.
VWAP & Sessions: `vwapMode`, `showVwapLine`, `vwapAlertDisplace`, `killSession`, `nySession`, `showSessionShade`, `rangeBars`.
FVG/Risk: `fvgMinTicks`, `fvgLookback`, `fvgMinSpacing`, `killZoneOnly`, `liqTargetMultiple`, `swingLookback`.
Visualization Toggles: `showSignalMarkers`, `showHeatmapBand`, `showInfoPanel`, `showStylizedCandles`.
Workflow Recipes
Kill-Zone Continuation: During the defined kill session, look for `killFvgLong` or `killFvgShort` arrows that line up with `sentimentValid` and positive `momoComposite`. Use the HUD’s risk readout to confirm SL/TP distances before entering.
VWAP Raid Fade: Outside kill zone, track `raidToVwapLong/Short`. Confirm the candle body exceeds the displacement multiplier, and price crosses back toward VWAP before considering reversions.
Range Break Monitor: After the initial balance locks, mark `rangeBreakLong/Short` circles only when the momentum band is >0 or <0 respectively and a fresh FVG box sits near price.
Liquidity Spike Review: When the HUD shows “Liquidity” timestamps, hover the plotted squares at chart bottom to see whether spikes were buy/sell oriented and if local FVGs formed immediately after.
Metadata
Author: officialjackofalltrades
Platform: TradingView (Pine Script v6)
Category: Sentiment + Liquidity Intelligence
Hope you Enjoy!

Ichimoku Multi-Timeframe Heatmap 12/5/2025
Multi-Timeframe Ichimoku Heatmap - Scan Your Watchlist in Seconds
This indicator displays all 5 critical Ichimoku signals (Cloud Angle, Lagging Line, Price vs Cloud, Kijun Slope, and Tenkan/Kijun Cross) across 10 timeframes (15s, 1m, 3m, 5m, 15m, 30m, 1h, 4h, Daily, Weekly) in one compact heatmap table. Instantly spot multi-timeframe trend alignment with color-coded cells: green for bullish, red for bearish, and gray for neutral. Perfect for quickly scanning through your entire watchlist to identify the strongest setups with confluent signals across all timeframes.

Grok/Claude AI Neural Fusion Pro V2AI Neural Fusion Pro V2 - New Features
Overview
Version 2 of AI Neural Fusion Pro introduces two complementary protection systems designed to preserve capital during market extremes. The first prevents over-buying during violent crashes. The second prevents over-selling during powerful rallies. Together, they transform a reactive trading system into one that adapts intelligently to market conditions.
Feature 1: Cascade Protection
Purpose
Cascade Protection prevents capital destruction during violent market crashes by implementing two independent safeguards that must both pass before any buy signal can fire.
The Problem It Solves
During market crashes, several dangerous conditions occur simultaneously. Volatility spikes to extreme levels, indicators scream "oversold," and each dip looks like the bottom. Traditional systems fire buy after buy, depleting capital reserves while price continues falling. By the time the actual bottom forms, there's no capital left to capture it.
How It Works
Layer 1: BBWP Freeze
Bollinger Band Width Percentile measures current volatility relative to historical volatility. When BBWP exceeds 92%, it indicates the market is experiencing abnormal volatility—typically during liquidation cascades or panic selling. During these periods, all buy signals are frozen regardless of how oversold conditions appear. This is an absolute freeze with no exceptions.
Layer 2: Consecutive Buy Counter
This layer limits the maximum number of buy orders that can execute without an intervening sell. The default limit is 3 consecutive buys. Once reached, additional buy signals are blocked until a sell signal fires and resets the counter. This prevents the common scenario where a bot keeps averaging down position after position during an extended decline.
Configuration
SettingDefaultDescriptionEnable Cascade ProtectionONMaster toggle for entire featureBBWP Length7Period for Bollinger Band calculationBBWP Lookback100Historical period for percentile rankingBBWP Freeze Level92%Threshold above which buys freezeMax Consecutive Buys3Maximum buys before forced pause
Panel Display
The info panel shows real-time protection status with color-coded feedback:
BBWP row: Shows current percentage and status (OK in green, FROZEN in red)
Buy Counter row: Shows current count versus maximum (green when available, orange approaching limit, red when blocked)
Key Behavior
Sell signals are never affected by cascade protection
The buy counter resets to zero after any sell signal fires
BBWP freeze is absolute—even extreme oversold conditions cannot bypass it
Feature 2: Dynamic Cooldown
Purpose
Dynamic Cooldown prevents over-selling during powerful rallies by automatically extending the minimum time between signals when the market enters a strong trend.
The Problem It Solves
During strong rallies, traditional indicators repeatedly hit overbought conditions, triggering sell after sell as price climbs. A trader might execute 10-15 sells during a sustained move from $86K to $93K, selling away their position piece by piece instead of letting profits run. Each sell captures a small gain while missing the larger move.
How It Works
The system monitors ADX (Average Directional Index) to detect trend strength. When ADX exceeds 50 and is rising, the market has entered a powerful trending phase. During these conditions, the cooldown period between signals automatically increases from 5 bars to 10 bars.
This means signals fire less frequently during strong trends, allowing positions more time to develop before the next potential exit. The extended cooldown applies equally to both buy and sell signals, though the primary benefit is reducing premature sells during rallies.
Normal Market (ADX < 50 or falling):
Cooldown = 5 bars (25 minutes on 5-minute chart)
Standard signal frequency
Strong Trend (ADX > 50 and rising):
Cooldown = 10 bars (50 minutes on 5-minute chart)
Reduced signal frequency to let trends develop
Configuration
SettingDefaultDescriptionEnable Dynamic CooldownONMaster toggle for featureSignal Cooldown5 barsStandard cooldown between signalsStrong Trend ADX Threshold50ADX level that triggers extended cooldownStrong Trend Cooldown10 barsExtended cooldown during strong trends
Panel Display
The info panel provides visual indication of current cooldown state:
ADX row: Shows value with arrow indicator (ADX ↑) when in strong trend mode, blue background when above threshold
Cooldown row: Shows active cooldown period with arrow indicator (Cooldown ↑) when extended, blue background during strong trends
Key Behavior
Cooldown applies to both buy and sell signals equally
Transition between modes is automatic based on ADX conditions
ADX must be both above threshold AND rising to trigger extended cooldown
When ADX stops rising or drops below threshold, cooldown returns to normal immediately
Combined Effect
These two features work together to create a more intelligent trading system:
During Crashes:
BBWP spikes above 92% → Buys frozen
System waits for volatility to normalize
When BBWP drops, limited buys (3 max) capture the actual bottom
Capital preserved for recovery
During Rallies:
ADX rises above 50 → Cooldown extends to 10 bars
Fewer sell signals fire during the move
Positions held longer, capturing more of the trend
Profits allowed to run
During Normal Markets:
Standard 5-bar cooldown
No BBWP restrictions
Full signal frequency for active trading
Summary
Version 2 transforms AI Neural Fusion Pro from a purely reactive indicator into an adaptive system that recognizes market extremes and adjusts its behavior accordingly. Cascade Protection guards against buying into crashes. Dynamic Cooldown guards against selling out of rallies. Together, they help preserve capital during adverse conditions while allowing full participation when markets behave normally.

Daily Dual Pivots (Std + Fib) Extended by Jackel
簡介: 這個指標旨在為日內交易者提供最強大的支撐與阻力參考。它將市場上最常用的兩種 Pivot Points 計算方式——標準 (Standard) 與 斐波那契 (Fibonacci)——結合在同一個圖表中,讓你一眼就能看出關鍵的價格匯聚點 (Confluence Areas)。
主要特色:
雙重系統並存:
標準 Pivot (Standard):以 實線 (Solid Lines) 顯示。這是機構與大部分交易者使用的傳統支撐阻力位。
斐波那契 Pivot (Fibonacci):以 圓點/虛線 (Dotted Lines) 顯示。利用 Fib 黃金比例 (0.382, 0.618) 計算出的潛在反轉位。
清晰的視覺區分:標準版使用暖色系 (紅/綠/橙),Fib 版使用冷色系 (藍/紫),互不干擾,清晰易讀。
可選擴展關卡 (S4-S5 / R4-R5):預設顯示 P, R1-R3, S1-S3。如果市場波動劇烈,你可以在設定中開啟 "Show Extra Levels" 來顯示 R4/R5 及 S4/S5。
自動隱藏歷史:預設只顯示「當日」的線條,保持圖表整潔。如需回測,可開啟「顯示歷史數據」選項。
如何使用:
當 實線 (Standard) 與 虛線 (Fib) 重疊或非常接近時,該區域通常具有更強的支撐或阻力效力。
適用於 15分鐘、1小時或 4小時圖表操作日內交易。
Introduction: This indicator is designed for intraday traders who need precise Support & Resistance levels. It combines the two most popular Pivot Point calculation methods—Standard (Traditional) and Fibonacci—into a single chart, allowing you to easily identify key areas of confluence.
Key Features:
Dual System Strategy:
Standard Pivots: Displayed as Solid Lines. These represent the traditional structural levels used by most traders and institutions.
Fibonacci Pivots: Displayed as Dotted/Circle Lines. These use key Fibonacci ratios (0.382, 0.618) to identify potential reversal zones.
Visual Clarity: Different line styles and color groups allow you to distinguish between Standard and Fib levels instantly without chart clutter.
Extended Levels (Optional): By default, it shows P, R1-R3, and S1-S3. In highly volatile markets, you can enable "Show Extra Levels" in the settings to reveal S4/S5 and R4/R5.
Clean Chart: By default, it only shows levels for the current day. You can enable "Show History" in the settings if you need to backtest.
How to Use:
Look for Confluence: When a Solid Line (Standard) and a Dotted Line (Fib) overlap or are very close to each other, it indicates a very strong Support or Resistance zone.
Best used on 15m, 1H, or 4H charts for intraday analysis.

Custom ORB (Adjust Time, Color, + Alerts)Set Opening Range Break Out for whatever time range you choose for current day only. 15 min, 30 min etc. You can add alerts on ORB High Low and change color of Lines.

DarkPool FlowDarkPool Flow is a professional-grade technical analysis tool designed to align retail traders with the dominant "smart money" flow. Unlike standard moving average crossovers that often generate false signals during consolidation, this script employs a multi-layered filtering engine to isolate high-probability trends.
The core philosophy of this indicator is that Trends are fractal. A sustainable move on a lower timeframe must be supported by momentum on a higher timeframe. By comparing a "Fast Signal Trend" against a "Slow Anchor Trend" (e.g., Daily vs. Weekly), the script identifies the market bias used by institutional algorithms.
This edition features a Smart Recovery Engine, ensuring that valid trends are not missed simply because momentum started slowly, and a Dynamic Cloud that visually represents the strength of the trend spread.
Key Features
1. Auto-Adaptive Timeframe Logic
The script eliminates the guesswork of Multi-Timeframe (MTF) selection. By enabling "Auto-Adapt," the indicator detects your current chart timeframe and automatically maps it to the mathematically correct institutional pairings:
Scalping (<15m): Uses 15-Minute Trend vs. 1-Hour Anchor.
Day Trading (15m - 1H): Uses 4-Hour Trend vs. Daily Anchor.
Swing Trading (4H - Daily): Uses Daily Trend vs. Weekly Anchor (The classic "Golden" setup).
Investing (Weekly): Uses 21-Week EMA vs. 50-Week SMA (Bull Market Support Band logic).
2. Smart Recovery Signal Engine
Standard crossover scripts often miss major moves if the specific breakout candle has low volume or weak ADX. This script utilizes a state-machine logic that "remembers" the trend direction. If a trend begins during low volatility (gray candles), the script waits. The moment volatility and momentum confirm the move, a Smart Recovery Signal is triggered, allowing you to enter an existing trend safely.
3. Chop Protection (Gray Candles)
Preservation of capital is the priority. The script analyzes the Average Directional Index (ADX) and Volatility (ATR).
Colored Candles (Green/Red): The market is trending with sufficient strength. Trading is permitted.
Gray Candles: The market is in a low-energy chop or consolidation (ADX < 20). Trading is discouraged.
4. Dynamic Trend Cloud
The space between the Fast and Slow trends is filled with a dynamic cloud.
Darker/Opaque Cloud: Indicates a widening spread, suggesting accelerating momentum.
Lighter/Transparent Cloud: Indicates a narrowing spread, suggesting the trend may be weakening or consolidating.
5. Pullback & Retest Signals (+)
While triangles mark the start of a trend, the Plus (+) signs mark low-risk opportunities to add to a position. These appear when price dips into the cloud, finds support at the "Fair Value" zone, and closes back in the direction of the trend with confirmed momentum.
User Guide & Strategy
Setup
Add the indicator to your chart.
For Beginners: Enable "Auto-Adaptive Timeframes" in the settings.
For Advanced Users: Disable Auto-Adapt and manually configure your Fast/Slow pairings (Default is Daily 50 EMA / Weekly 50 EMA).
Signal Mode: Choose "First Breakout Only" for a cleaner chart, or "All Signals" if you wish to see re-entry points during choppy starts.
Long Entry Criteria (Buy)
Trend: The Cloud must be Green (Fast Trend > Slow Trend).
Signal: A Green Triangle appears below the bar.
Confirmation: The signal candle must not be Gray.
Re-Entry: A small Green (+) sign appears, indicating a successful test of the cloud support.
Short Entry Criteria (Sell)
Trend: The Cloud must be Red (Fast Trend < Slow Trend).
Signal: A Red Triangle appears above the bar.
Confirmation: The signal candle must not be Gray.
Re-Entry: A small Red (+) sign appears, indicating a successful test of the cloud resistance.
Stop Loss & Risk Management
Stop Loss: A standard institutional stop loss is placed just beyond the Slow Trend Line (the outer edge of the cloud). If price closes beyond the Slow Trend, the macro thesis is invalid.
Take Profit: Target liquidity pools or use a trailing stop based on the Fast Trend line.
Settings Overview
Mode Selection: Toggle between Auto-Adaptive logic or Manual control.
Manual Configuration: Define the specific Timeframe, Length, and Type (EMA, SMA, WMA) for both Fast and Slow trends.
Signal Logic: Toggle "Show Pullback Signals" on/off. Switch between "First Breakout" or "All Signals."
Quality Filters: Toggle individual filters (ATR, RSI, ADX) to adjust sensitivity. Turning these off makes the script more responsive but increases false signals.
Visual Style: Customize colors for Bullish, Bearish, and Neutral (Gray) states. Adjust cloud transparency.
Disclaimer
Risk Warning: Trading financial markets involves a high degree of risk and is not suitable for all investors. You could lose some or all of your initial investment.
Educational Use Only: This script and the information provided herein are for educational and informational purposes only. They do not constitute financial advice, investment advice, trading advice, or any other recommendation.
No Guarantee: Past performance of any trading system or methodology is not necessarily indicative of future results. The "Institutional Trend" indicator is a tool to assist in technical analysis, not a crystal ball. The creators of this script assume no responsibility or liability for any trading losses or damages incurred as a result of using this tool. Always perform your own due diligence and consult with a qualified financial advisor before making investment decisions.

PRO Trade Manager//@version=5
indicator("PRO Trade Manager", shorttitle="PRO Trade Manager", overlay=false)
// ============================================================================
// INPUTS
//This code and all related materials are the exclusive property of Trade Confident LLC. Any reproduction, distribution, modification, or unauthorized use of this code, in whole or in part, is strictly prohibited without the express written consent of Trade Confident LLC. Violations may result in civil and/or criminal penalties to the fullest extent of the law.
// © Trade Confident LLC. All rights reserved.
// ============================================================================
// Moving Average Settings
maLength = input.int(15, "Signal Strength", minval=1, tooltip="Length of the moving average to measure deviation from (lower = more sensitive)")
maType = "SMA" // Fixed to SMA, no longer user-selectable
// Deviation Settings
deviationLength = input.int(20, "Deviation Period", minval=1, tooltip="Lookback period for standard deviation calculation")
// Signal Frequency dropdown - controls both upper and lower thresholds
signalFrequency = input.string("More/Good Accuracy", "Signal Frequency", options= ,
tooltip="Normal/Highest Accuracy = ±2.0 StdDev | More/Good Accuracy = ±1.5 StdDev | Most/Moderate Accuracy = ±1.0 StdDev")
// Set thresholds based on selected frequency
upperThreshold = signalFrequency == "Most/Moderate Accuracy" ? 1.0 : signalFrequency == "More/Good Accuracy" ? 1.5 : 2.0
lowerThreshold = signalFrequency == "Most/Moderate Accuracy" ? -1.0 : signalFrequency == "More/Good Accuracy" ? -1.5 : -2.0
// Continuation Signal Settings
atrMultiplier = input.float(2.0, "TP/DCA Market Breakout Detection", minval=0, step=0.5, tooltip="Number of ATR moves required to trigger continuation signals (Set to 0 to disable)")
// Visual Settings
showMA = false // MA display removed from settings
showSignals = input.bool(true, "Show Alert Signals", tooltip="Show visual signals when price is overextended")
// ============================================================================
// CALCULATIONS
// ============================================================================
// Calculate Moving Average based on type
ma = switch maType
"SMA" => ta.sma(close, maLength)
"EMA" => ta.ema(close, maLength)
"WMA" => ta.wma(close, maLength)
"VWMA" => ta.vwma(close, maLength)
=> ta.sma(close, maLength)
// Calculate deviation from MA
deviation = close - ma
// Calculate standard deviation
stdDev = ta.stdev(close, deviationLength)
// Calculate number of standard deviations away from MA
deviationScore = stdDev != 0 ? deviation / stdDev : 0
// Smooth the deviation score slightly for cleaner signals
smoothedDeviation = ta.ema(deviationScore, 3)
// ============================================================================
// SIGNALS
// ============================================================================
// Overextended conditions
overextendedHigh = smoothedDeviation >= upperThreshold
overextendedLow = smoothedDeviation <= lowerThreshold
// Signal triggers (crossing into overextended territory)
bullishSignal = ta.crossunder(smoothedDeviation, lowerThreshold)
bearishSignal = ta.crossover(smoothedDeviation, upperThreshold)
// Track if we're in bright histogram zones
isBrightGreen = smoothedDeviation <= lowerThreshold
isBrightRed = smoothedDeviation >= upperThreshold
// Track if we were in bright zone on previous bar
wasBrightGreen = smoothedDeviation <= lowerThreshold
wasBrightRed = smoothedDeviation >= upperThreshold
// Detect oscillator turning up after bright green (buy signal)
// Trigger if we were in bright green and oscillator turns up, even if no longer bright green
oscillatorTurningUp = smoothedDeviation > smoothedDeviation
buySignal = barstate.isconfirmed and wasBrightGreen and oscillatorTurningUp and smoothedDeviation <= smoothedDeviation
// Detect oscillator turning down after bright red (sell signal)
// Trigger if we were in bright red and oscillator turns down, even if no longer bright red
oscillatorTurningDown = smoothedDeviation < smoothedDeviation
sellSignal = barstate.isconfirmed and wasBrightRed and oscillatorTurningDown and smoothedDeviation >= smoothedDeviation
// ============================================================================
// ATR-BASED CONTINUATION SIGNALS
// ============================================================================
// Calculate ATR for distance measurement
atrLength = 14
atr = ta.atr(atrLength)
// Track price levels when ANY sell or buy signal occurs (original or continuation)
var float lastSellPrice = na
var float lastBuyPrice = na
// Initialize tracking on original signals
if sellSignal
lastSellPrice := close
if buySignal
lastBuyPrice := close
// Continuation Sell Signal: Price moved up by ATR multiplier from last red dot
// Disabled when atrMultiplier is set to 0
continuationSell = atrMultiplier > 0 and barstate.isconfirmed and not na(lastSellPrice) and close >= lastSellPrice + (atrMultiplier * atr)
// Continuation Buy Signal: Price moved down by ATR multiplier from last green dot
// Disabled when atrMultiplier is set to 0
continuationBuy = atrMultiplier > 0 and barstate.isconfirmed and not na(lastBuyPrice) and close <= lastBuyPrice - (atrMultiplier * atr)
// Update reference prices when continuation signals trigger (reset the 3 ATR counter)
if continuationSell
lastSellPrice := close
if continuationBuy
lastBuyPrice := close
// Combine original and continuation signals for plotting
allBuySignals = buySignal or continuationBuy
allSellSignals = sellSignal or continuationSell
// Track if a signal occurred to keep it visible on dashboard
// Signals trigger at barstate.isconfirmed (bar close)
var bool showBuyOnDashboard = false
var bool showSellOnDashboard = false
// Update dashboard flags immediately when signals occur
if allBuySignals
showBuyOnDashboard := true
showSellOnDashboard := false
else if allSellSignals
showSellOnDashboard := true
showBuyOnDashboard := false
else if barstate.isconfirmed
// Reset flags on bar close if no new signal
showBuyOnDashboard := false
showSellOnDashboard := false
// ============================================================================
// PLOTTING
// ============================================================================
// Professional color scheme
var color colorBullish = #00C853 // Professional green
var color colorBearish = #FF1744 // Professional red
var color colorNeutral = #2962FF // Professional blue
var color colorGrid = #363A45 // Dark gray for lines
var color colorBackground = #1E222D // Chart background
// Dynamic line color based on value
lineColor = smoothedDeviation > upperThreshold ? colorBearish :
smoothedDeviation < lowerThreshold ? colorBullish :
smoothedDeviation > 0 ? color.new(colorBearish, 50) :
color.new(colorBullish, 50)
// Plot the deviation oscillator with dynamic coloring
plot(smoothedDeviation, "Deviation Score", color=lineColor, linewidth=2)
// Plot zero line
hline(0, "Zero Line", color=color.new(colorGrid, 0), linestyle=hline.style_solid, linewidth=1)
// Subtle fill for overextended zones (without visible threshold lines)
upperLine = hline(upperThreshold, "Upper Threshold", color=color.new(color.gray, 100), linestyle=hline.style_dashed, linewidth=1)
lowerLine = hline(lowerThreshold, "Lower Threshold", color=color.new(color.gray, 100), linestyle=hline.style_dashed, linewidth=1)
fill(upperLine, hline(3), color=color.new(colorBearish, 95), title="Overextended High Zone")
fill(lowerLine, hline(-3), color=color.new(colorBullish, 95), title="Overextended Low Zone")
// Histogram style visualization (optional alternative)
histogramColor = smoothedDeviation >= upperThreshold ? color.new(colorBearish, 20) :
smoothedDeviation <= lowerThreshold ? color.new(colorBullish, 20) :
smoothedDeviation > 0 ? color.new(colorBearish, 80) :
color.new(colorBullish, 80)
plot(smoothedDeviation, "Histogram", color=histogramColor, style=plot.style_histogram, linewidth=3)
// ============================================================================
// BUY/SELL SIGNAL MARKERS
// ============================================================================
// Plot buy signals at -3.5 level (includes both initial and extended signals)
plot(allBuySignals ? -3.5 : na, title="Buy Signal", style=plot.style_circles,
color=color.new(colorBullish, 0), linewidth=4)
// Plot sell signals at 3.5 level (includes both initial and extended signals)
plot(allSellSignals ? 3.5 : na, title="Sell Signal", style=plot.style_circles,
color=color.new(colorBearish, 0), linewidth=4)
// ============================================================================
// ALERTS - SIMPLIFIED TO ONLY TWO ALERTS
// ============================================================================
// Alert 1: Long Entry/Short TP - fires on ANY green dot (original or continuation)
alertcondition(allBuySignals, "Long Entry/Short TP", "Long Entry/Short TP")
// Alert 2: Long TP/Short Entry - fires on ANY red dot (original or continuation)
alertcondition(allSellSignals, "Long TP/Short Entry", "Long TP/Short Entry")
// ============================================================================
// DATA DISPLAY
// ============================================================================
// Create a professional table for current readings
var color tableBgColor = #1a2332 // Dark blue background
var table infoTable = table.new(position.middle_right, 2, 2, border_width=1,
border_color=color.new(#2962FF, 30),
frame_width=1,
frame_color=color.new(#2962FF, 30))
if barstate.islast
// Determine status
statusText = overextendedHigh ? "OVEREXTENDED ↓" :
overextendedLow ? "OVEREXTENDED ↑" :
smoothedDeviation > 0 ? "Buyers In Control" : "Sellers In Control"
statusColor = overextendedHigh ? color.new(colorBearish, 0) :
overextendedLow ? color.new(colorBullish, 0) :
color.white
// Background color for status cell
statusBgColor = color.new(tableBgColor, 0)
// Status Row
table.cell(infoTable, 0, 0, "Status",
bgcolor=color.new(tableBgColor, 0),
text_color=color.white,
text_size=size.normal)
table.cell(infoTable, 1, 0, statusText,
bgcolor=statusBgColor,
text_color=statusColor,
text_size=size.normal)
// Signal Row - always show
table.cell(infoTable, 0, 1, "Signal",
bgcolor=color.new(tableBgColor, 0),
text_color=color.white,
text_size=size.normal)
// Show signal if flags are set (will stay visible during the bar)
if showBuyOnDashboard or showSellOnDashboard
// Green dot (buy signal) = "Long Entry/Short TP" with arrow up, white text on green background
// Red dot (sell signal) = "Long TP/Short Entry" with arrow down, white text on red background
signalText = showBuyOnDashboard ? "↑ Long Entry/Short TP" : "↓ Long TP/Short Entry"
signalColor = showBuyOnDashboard ? color.new(colorBullish, 0) : color.new(colorBearish, 0)
table.cell(infoTable, 1, 1, signalText,
bgcolor=signalColor,
text_color=color.white,
text_size=size.normal)
else
table.cell(infoTable, 1, 1, "Watching...",
bgcolor=color.new(tableBgColor, 0),
text_color=color.new(color.white, 60),
text_size=size.normal)

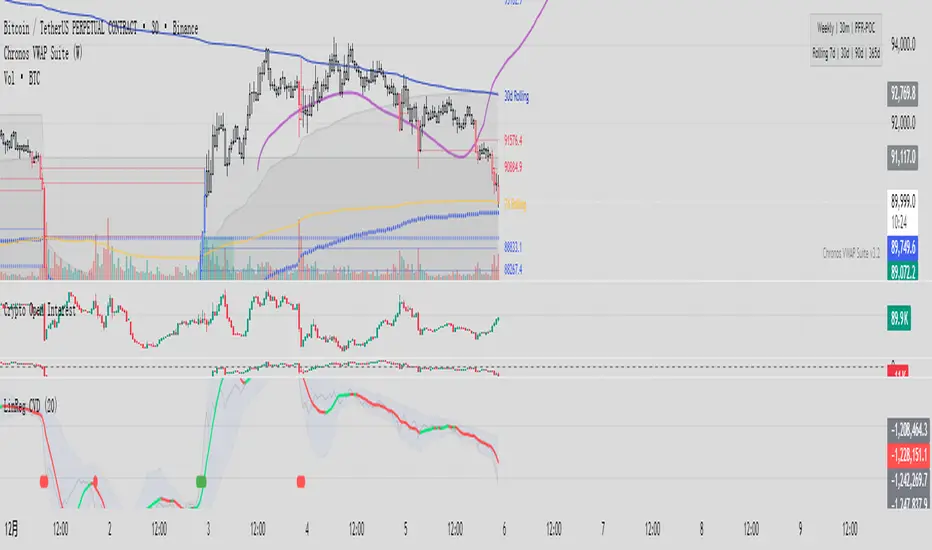
Linear Regression CVDHere is the complete user manual and introduction for the Linear Regression CVD indicator in English. You can save this as your documentation for your trading system.
📊 Linear Regression CVD – Trader’s Manual
1. Introduction
Core Concept:
Standard Cumulative Volume Delta (CVD) indicators are often noisy and jagged, making it difficult to decipher the true direction of capital flow. This indicator applies a Linear Regression algorithm to smooth out the CVD data and adds a Standard Deviation Channel. It is designed to answer two critical questions:
What is the "True Trend" of the money flow? (Filtering out noise)
Is the market sentiment currently overheated? (Using the channel to spot extremes)
Best Markets:
Crypto Perpetual Futures (e.g., BTCUSDT.P) — Highly Recommended.
Stocks & Forex (Must have volume data).
Timeframes:
Scalping: 1m, 5m, 15m (To catch rapid capital inflows/outflows).
Swing Trading: 1H, 4H (To identify the dominant direction of "Smart Money").
2. Visual Guide
When you load the indicator, you will see the following elements:
A. The Main Line (Linear Regression)
Appearance: A smooth, thick line.
Meaning: The average trend of capital flow.
Color Logic:
🟢 Green: Money flow is trending UP (Buyers are dominant).
🔴 Red: Money flow is trending DOWN (Sellers are dominant).
B. The Raw Line (Gray Hairline)
Appearance: A thin, jagged gray line fluctuating around the main line.
Meaning: The Raw, Real-time CVD. It calculates the volume delta (Close vs. Open) for every single candle without smoothing.
C. The Channel (Blue Background)
Appearance: A blue shaded area around the main line.
Meaning: The "Normal Volatility Range."
Calculated based on 2 Standard Deviations (2σ) from the Linear Regression.
If the Gray Line stays inside this channel, the market is stable/balanced.
D. The Signal Dots
🟢 Green Dot (Upside Extension): The Raw CVD has broken above the upper channel.
Meaning: Extreme Greed / Aggressive Buying / FOMO.
🔴 Red Dot (Downside Extension): The Raw CVD has broken below the lower channel.
Meaning: Extreme Fear / Panic Selling / Capitulation.
3. Trading Strategies
Strategy 1: Trend Confirmation
The basic "Follow the Money" approach.
Bullish Signal (Long):
Price is making Higher Highs.
CVD Main Line turns Green and slopes upward.
Action: Confirms that the price rise is backed by real volume. Hold or Add to Longs.
Bearish Signal (Short):
Price is making Lower Lows.
CVD Main Line turns Red and slopes downward.
Action: Confirms that sellers are in control. Hold Shorts.
Strategy 2: Divergence (High Win Rate)
Finding disagreements between "Price" and "Money Flow".
Bearish Divergence (Top Signal):
Price makes a Higher High.
CVD Main Line makes a Lower High (or fails to break out).
Meaning: Price is rising, but buying effort is fading (Exhaustion) or Limit Sellers are absorbing the buy orders (Absorption).
Action: Look for Short entries.
Bullish Divergence (Bottom Signal):
Price makes a Lower Low.
CVD Main Line makes a Higher Low.
Meaning: Price is dropping, but selling pressure is drying up, or Smart Money is absorbing sell orders via limit buy orders.
Action: Look for Long entries.
Strategy 3: Mean Reversion (Extreme Extensions)
Using the Red/Green dots to fade extremes.
Long Opportunity (Bounce):
Price crashes rapidly.
Cluster of Red Dots appears at the bottom.
Meaning: Panic selling has peaked (Capitulation). The market is oversold on a volume basis.
Action: Wait for a candle reversal pattern, then Long for a bounce.
Short Opportunity (Pullback):
Price pumps vertically.
Cluster of Green Dots appears at the bottom.
Meaning: Retail traders are chasing the pump (FOMO). Buying power is overextended.
Action: Wait for momentum to stall, then Short.
4. Important Limitations & Notes
Data Source Accuracy:
TradingView Standard Volume is an approximation (Close vs. Open logic).
It is not perfect "Tick Data" (like professional Orderflow software), but it is 90% accurate for trend analysis on 1H/4H charts.
Tip: Always use Perpetual Contract charts (e.g., BTCUSDT.P) for Crypto, not Spot charts, to get the correct volume data.
The "Extension" Trap:
Do not Short just because you see a Green Dot. In a strong parabolic bull run, you will see many Green Dots in a row while price keeps flying.
These dots indicate velocity, not necessarily a reversal. Always look for resistance levels or divergence before fading the move.
Settings:
Default Length: 20.
For faster signals: Try 10 or 14.
For smoother trends: Try 50.
5. Pre-Trade Checklist
Before entering a trade, check the Linear CVD:
Color: Is the CVD Line Green or Red? Does it match my trade direction?
Slope: Is the CVD accelerating or flattening out?
Divergence: Did price break a level, but CVD failed to follow? (Fakeout warning).
Extremes: Are there Red/Green dots appearing? If yes, am I chasing a trade too late?
这是一套完整的线性回归 CVD (Linear Regression CVD) 指标的使用说明书和简介。你可以把它保存下来,作为你的交易系统参考文档。
📊 线性回归 CVD (Linear Regression CVD) —— 交易员手册
1. 指标简介 (Introduction)
核心理念:
普通的 CVD(累积成交量差)往往噪音很大,线条锯齿状严重,导致交易者难以看清真正的资金流向趋势。本指标通过线性回归算法 (Linear Regression) 对 CVD 进行平滑处理,并结合标准差通道 (Standard Deviation Channel),试图解决两个核心问题:
资金流向的真实趋势是什么?(排除噪音)
当前的情绪是否过热?(通过通道判定)
适用市场:
加密货币合约 (BTC, ETH 等永续合约) —— 效果最佳
股票、外汇 (需有成交量数据)
适用周期:
日内短线:1分钟、5分钟、15分钟(捕捉快速的资金进出)。
趋势波段:1小时、4小时(判断主力资金的大方向)。
2. 视觉元素说明 (Visual Guide)
当你加载指标后,你会看到以下几个部分:
A. 彩色主线 (The LinReg Line)
形态:一条平滑的粗线。
含义:资金流向的**“平均趋势”**。
颜色:
🟢 绿色:资金流向趋势向上(买盘主导)。
🔴 红色:资金流向趋势向下(卖盘主导)。
B. 灰色背景细线 (Raw CVD)
形态:一条充满锯齿的灰色细线,在主线周围波动。
含义:原始的、实时的累积成交量。它反应了当下的每一根K线的实际买卖差额。
C. 蓝色背景通道 (The Channel)
形态:包裹在主线周围的深蓝色带状区域。
含义:“正常波动范围”。
基于线性回归的 2倍标准差计算。
如果灰色细线在通道内运行,说明市场情绪稳定,多空力量均衡。
D. 信号点 (The Dots)
🟢 绿点 (底部出现):原始 CVD 向上突破了通道上轨。代表极度贪婪 / 抢筹。
🔴 红点 (底部出现):原始 CVD 向下跌破了通道下轨。代表极度恐慌 / 抛售。
3. 实战交易策略 (Trading Strategies)
策略一:趋势确认 (Trend Following)
这是最基础的顺势用法。
做多信号:
价格处于上升趋势(如在均线之上)。
CVD 主线由红变绿,且持续向上倾斜。
操作:这确认了价格的上涨有真金白银的买盘支持,可以持有或加仓。
做空信号:
价格处于下降趋势。
CVD 主线由绿变红,且持续向下倾斜。
操作:确认卖盘主导,价格下跌是健康的。
策略二:背离交易 (Divergence) —— 胜率最高的用法
寻找“主力资金”与“价格”不一致的地方。
顶背离 (看跌):
价格创出了新高 (Higher High)。
CVD 主线却没有创新高,或者形成更低的高点 (Lower High)。
含义:价格在涨,但买入的资金在减少。这通常是主力在通过限价单悄悄出货,或者是买盘枯竭。
操作:准备做空,或多单止盈。
底背离 (看涨):
价格创出了新低 (Lower Low)。
CVD 主线却形成了更高的低点 (Higher Low)。
含义:价格在跌,但卖出的资金在减少,或者有大资金在底部通过挂单吸筹 (Absorption)。
操作:准备做多,或空单止盈。
策略三:极端情绪反转 (Mean Reversion)
利用红绿点判断短期的超买超卖。
做多机会 (反弹):
价格快速下跌,甚至暴跌。
指标底部出现密集的红点 (Downside Extension)。
含义:恐慌盘被杀出来了 (Capitulation),市场短期内无可再卖。
操作:等待K线出现反转形态(如长下影线)后尝试博反弹。
做空机会 (回调):
价格快速拉升(垂直上涨)。
指标底部出现密集的绿点 (Upside Extension)。
含义:大量的散户在追涨 (FOMO),透支了买盘动能。
操作:等待上涨停滞后尝试做空。
4. 关键注意事项 (Limitations)
数据源区别:
TradingView 的普通 Volume 是基于 K 线的近似计算(Close > Open 算买,Close < Open 算卖)。
这与专业的 Orderflow 软件(如 Exocharts)使用的逐笔 Tick 数据有一定误差,但在 1小时/4小时 级别上,趋势方向基本一致。
建议:如果你是做合约,请务必加载 合约图表(如 BTCUSDT.P),不要用现货图表看 CVD。
红绿点的陷阱:
不要一看到绿点就做空! 在超级大单边行情(比如牛市主升浪)中,绿点会连续出现,价格会一直涨。
红绿点必须配合 关键支撑/阻力位 使用。如果在“半空中”出现绿点,往往意味着趋势加速,而不是反转。
参数调整:
默认 LinReg Length = 20。
如果你觉得反应太慢,可以改为 10 或 14。
如果你觉得假信号太多,可以改为 50,但这会牺牲灵敏度。
5. 快速检查清单 (Checklist)
在开单前,看一眼 CVD:
颜色:CVD 是绿的还是红的?和我想做的方向一致吗?
斜率:CVD 是在加速上升/下降,还是开始变平了?
背离:价格破位了,CVD 跟着破位了吗?如果没跟,就是假突破。
极值:有没有出现红点/绿点?如果出现了,是不是应该等回调再进场?
TMT EMA Bundle - Hitesh NimjeTMT EMA Bundle - Multi Timeframe EMA Indicator
Created by: Hitesh Nimje | Contact: 8087192915
Overview
The TMT EMA Bundle is a comprehensive multi-EMA indicator designed for traders who rely on multiple exponential moving averages for trend analysis and trading decisions. This powerful tool displays 10 essential EMAs on your chart, providing complete visibility of short, medium, and long-term trends.
Key Features
🔹 10 Essential EMAs Included:
• EMA 9 (Blue) - Ultra Short-term trend
• EMA 11 (Red) - Short-term momentum
• EMA 15 (Yellow) - Quick trend changes
• EMA 21 (Black) - Swing trading reference
• EMA 50 (Gray) - Medium-term bias
• EMA 51 (Orange) - Alternative medium-term
• EMA 55 (Brown) - Extended medium-term
• EMA 100 (Purple) - Long-term trend
• EMA 200 (Maroon) - Major support/resistance
• EMA 400 (Green) - Primary trend direction
🔹 Customizable Settings
• Source selection for each EMA (Open, High, Low, Close, HL2, HLC3, OHLC4)
• Independent length adjustment for each moving average
• Color-coded lines for easy identification
🔹 Professional Features
• Clean, overlay display on price charts
• Optimized performance with max limits set
• Compatible with all timeframes
• Works on all instruments (Forex, Stocks, Crypto, Commodities)
How to Use
1. Trend Identification: All EMAs aligned = Strong trend
2. Support/Resistance: EMAs act as dynamic support/resistance levels
3. Entry Signals: Price reactions at key EMAs
4. Trend Confirmation: EMA crossovers indicate potential trend changes
5. Risk Management: Use EMAs for stop-loss placement
Best Practices
• Use higher timeframes (1H, 4H, Daily) for clearer signals
• Combine with price action and volume analysis
• Watch for EMA clusters and divergences
• Consider trend strength by EMA separation
Perfect For
✓ Swing Traders
✓ Day Traders
✓ Trend Followers
✓ Scalpers (shorter timeframes)
✓ Position Traders
Technical Specifications
• Version: Pine Script v6
• Overlay: Yes
• Multi-timeframe compatible
• No repainting
• Lightweight and efficient
This indicator is part of the Thought Magic Trading collection, designed to provide professional-grade technical analysis tools for serious traders.
Happy Trading! 📈
TRADING DISCLAIMER
RISK WARNING
Trading involves substantial risk of loss and is not suitable for all investors. Past performance is not indicative of future results. You should carefully consider whether trading is suitable for you in light of your circumstances, knowledge, and financial resources.
NO FINANCIAL ADVICE
This indicator is provided for educational and informational purposes only. It does not constitute:
* Financial advice or investment recommendations
* Buy/sell signals or trading signals
* Professional investment advice
* Legal, tax, or accounting guidance
LIMITATIONS AND DISCLAIMERS
Technical Analysis Limitations
* Pivot points are mathematical calculations based on historical price data
* No guarantee of accuracy of price levels or calculations
* Markets can and do behave irrationally for extended periods
* Past performance does not guarantee future results
* Technical analysis should be used in conjunction with fundamental analysis
Data and Calculation Disclaimers
* Calculations are based on available price data at the time of calculation
* Data quality and availability may affect accuracy
* Pivot levels may differ when calculated on different timeframes
* Gaps and irregular market conditions may cause level failures
* Extended hours trading may affect intraday pivot calculations
Market Risks
* Extreme market volatility can invalidate all technical levels
* News events, economic announcements, and market manipulation can cause gaps
* Liquidity issues may prevent execution at calculated levels
* Currency fluctuations, inflation, and interest rate changes affect all levels
* Black swan events and market crashes cannot be predicted by technical analysis
USER RESPONSIBILITIES
Due Diligence
* You are solely responsible for your trading decisions
* Conduct your own research before using this indicator
* Verify calculations with multiple sources before trading
* Consider multiple timeframes and confirm levels with other technical tools
* Never rely solely on one indicator for trading decisions
Risk Management
* Always use proper risk management and position sizing
* Set appropriate stop-losses for all positions
* Never risk more than you can afford to lose
* Consider the inherent risks of leverage and margin trading
* Diversify your portfolio and trading strategies
Professional Consultation
* Consult with qualified financial advisors before trading
* Consider your tax obligations and legal requirements
* Understand the regulations in your jurisdiction
* Seek professional advice for complex trading strategies
LIMITATION OF LIABILITY
Indemnification
The creator and distributor of this indicator shall not be liable for:
* Any trading losses, whether direct or indirect
* Inaccurate or delayed price data
* System failures or technical malfunctions
* Loss of data or profits
* Interruption of service or connectivity issues
No Warranty
This indicator is provided "as is" without warranties of any kind:
* No guarantee of accuracy or completeness
* No warranty of uninterrupted or error-free operation
* No warranty of merchantability or fitness for a particular purpose
* The software may contain bugs or errors
Maximum Liability
In no event shall the liability exceed the purchase price (if any) paid for this indicator. This limitation applies regardless of the theory of liability, whether contract, tort, negligence, or otherwise.
REGULATORY COMPLIANCE
Jurisdiction-Specific Risks
* Regulations vary by country and region
* Some jurisdictions prohibit or restrict certain trading strategies
* Tax implications differ based on your location and trading frequency
* Commodity futures and options trading may have additional requirements
* Currency trading may be regulated differently than stock trading
Professional Trading
* If you are a professional trader, ensure compliance with all applicable regulations
* Adhere to fiduciary duties and best execution requirements
* Maintain required records and reporting
* Follow market abuse regulations and insider trading laws
TECHNICAL SPECIFICATIONS
Data Sources
* Calculations based on TradingView data feeds
* Data accuracy depends on broker and exchange reporting
* Historical data may be subject to adjustments and corrections
* Real-time data may have delays depending on data providers
Software Limitations
* Internet connectivity required for proper operation
* Software updates may change calculations or functionality
* TradingView platform dependencies may affect performance
* Third-party integrations may introduce additional risks
MONEY MANAGEMENT RECOMMENDATIONS
Conservative Approach
* Risk only 1-2% of capital per trade
* Use position sizing based on volatility
* Maintain adequate cash reserves
* Avoid over-leveraging accounts
Portfolio Management
* Diversify across multiple strategies
* Don't put all capital into one approach
* Regularly review and adjust trading strategies
* Maintain detailed trading records
FINAL LEGAL NOTICES
Acceptance of Terms
* By using this indicator, you acknowledge that you have read and understood this disclaimer
* You agree to assume all risks associated with trading
* You confirm that you are legally permitted to trade in your jurisdiction
Updates and Changes
* This disclaimer may be updated without notice
* Continued use constitutes acceptance of any changes
* It is your responsibility to stay informed of updates
Governing Law
* This disclaimer shall be governed by the laws of the jurisdiction where the indicator was created
* Any disputes shall be resolved in the appropriate courts
* Severability clause: If any part of this disclaimer is invalid, the remainder remains enforceable
REMEMBER: THERE ARE NO GUARANTEES IN TRADING. THE MAJORITY OF RETAIL TRADERS LOSE MONEY. TRADE AT YOUR OWN RISK.
Contact Information:
* Creator: Hitesh_Nimje
* Phone: Contact@8087192915
* Source: Thought Magic Trading
© HiteshNimje - All Rights Reserved
This disclaimer should be prominently displayed whenever the indicator is shared, sold, or distributed to ensure users are fully aware of the risks and limitations involved in trading.

Simulated Liquidation Heatmap [QuantAlgo]🟢 Overview
This indicator visualizes where clusters of stop-loss orders and liquidation levels are likely located, displayed as a 'heatmap'. It's based on the concept of market structure liquidity: large groups of stop orders tend to gather around obvious technical levels (like swing highs and lows), and these pools of orders often attract price movement from institutional traders. The indicator uses a fractal-based algorithm to identify these high-probability liquidation zones and displays them as dynamic, color-coded boxes.
The key feature is the thermal color gradient, which indicates the freshness (age) and therefore the relative relevance of the liquidity zone. Hot colors (e.g., Red/Yellow) represent fresh clusters that have just formed, suggesting strong and immediate liquidity interest. Cold colors (e.g., Blue/Purple) represent aged or decaying clusters that are becoming less relevant over time. This visualization allows traders to anticipate potential liquidity sweeps (stop hunts) and understand areas of significant retail and institutional positioning.
🟢 Key Features
1. Liquidity Zone Heatmap
The core function is the identification of swing high and swing low price points using a user-defined Lookback period. These points are where retail traders are statistically most likely to place their stop-loss orders. The indicator simulates the clustering of these orders by drawing a zone (box) around the detected swing point, with the vertical size controlled by the Stop/Liquidation Zone Width (%) setting.
▶ Cluster Lookback: Defines the sensitivity of swing point detection. Lower values detect frequent, minor zones (scalping/intraday); higher values detect major, stronger swing points (swing trading).
▶ Zone Width (%): Sets the percentage range above and below the swing point where stops are simulated to cluster, accounting for slippage and typical stop placement spread.
▶ Liquidity Decay: Zones gradually fade in color intensity and are eventually removed after the user-defined Liquidity Decay Period (Bars), ensuring the heatmap only displays relevant, current liquidity areas.
▶ Round Number Filter: An optional filter that limits the display to liquidity zones occurring only at psychologically significant round numbers (e.g., $100, $1,500.00), which typically attract higher concentrations of orders.
2. Thermal Color Gradient
The heatmap's color is a direct function of the zone's age, providing a visual proxy for immediate relevance.
▶ Freshness: Newly created zones are displayed in the Hot Color (high relevance).
▶ Decay: As bars pass, the zone color transitions along the gradient toward the Cold Color and increased transparency (lower relevance), until it is removed entirely.
▶ Color Schemes: Multiple pre-configured and custom color schemes are available to optimize the visualization for different chart themes and color preferences.
3. Liquidity Heat Thermometer
An optional visual thermometer is displayed on the chart to provide an instant, overall assessment of the current liquidation heat level in the immediate vicinity of the price.
▶ Calculation: The thermometer calculates an aggregate heat score based on the age and proximity of all liquidity zones within a user-defined Zone Detection Range (%) of the current price.
▶ Visual Feedback: A marker (triangle) points to the corresponding level on the thermometer's color gradient (Hot to Cold). A high reading indicates price is close to fresh, dense stop clusters, suggesting high volatility or an imminent liquidity sweep is probable. A low reading indicates price is in a low-density or aged liquidity area.
▶ Customization: The thermometer's resolution, position, and text size are fully customizable for optimal chart placement and readability.
🟢 Practical Applications
▶ Anticipate Sweeps: Prioritize trading in the direction of Hot (fresh) liquidity zones. For example, a hot low-side zone suggests strong sell-side liquidity (stop-losses) is available for large buyers to sweep.
▶ Filter Noise: Use the Round Number Filter to focus only on the highest probability liquidation zones, which are often at clean, psychological price levels.
▶ Validate Entries: Combine the Heat Thermometer with price action analysis. A rising heat level indicates increasing proximity to a major stop cluster, signaling a potential turn or an aggressive market move to sweep those stops.
▶ Risk Management: Understand that price often acts dynamically around these zones. High heat levels imply high risk/reward setups; stops should be placed strategically beyond the defined Liquidation Zone Width.
▶ Multi-Timeframe Context: Higher timeframes (e.g., Daily, 4-Hour) often reveal more significant, major liquidity zones. Use this indicator on lower timeframes (e.g., 5-min, 15-min) for execution, but prioritize zones that align with higher-timeframe structures.

Daily Settlement TWAPThis TWAP is reanchored to 14:59 CT everyday which is the CME settlement period for SP500 and Emini500 (14:59:30-15:00:00 CT). It has 5 standard deviations.

XAUUSD Liquidity Sweep + Engulfing (4H/2H/15m)Key Features in This Script:
4H Bias (Trend): We use RSI on 4H to determine if the market is in a bullish or bearish trend.
2H Setup: When price sweeps below previous lows or above previous highs (liquidity sweep), we confirm it with RSI and an engulfing candle.
15m Entry: After the liquidity sweep is confirmed on the 15m chart, we check for a bullish engulfing (for buys) or bearish engulfing (for sells) with RSI confirmation.
How to Use It:
Add the Script: Copy-paste the code above into TradingView’s Pine Editor.
Apply it to the 15-minute chart for XAUUSD (Gold).
Alerts: Set up alerts when a Buy or Sell signal appears based on the conditions.
Alerts Example:
When a liquidity sweep and RSI flip happens with an engulfing candle, TradingView will notify you, helping you enter at the right time.
🚀 Next Steps:
Try it out and let me know how the alerts and signals are working for you.
If you'd like to add custom stop-loss or take-profit calculations, or include Fibonacci levels, let me know!

FluxPulse Beacon## FluxPulse Beacon
FluxPulse Beacon applies a microstructure lens to every bar, combining directional thrust, realized volatility, and multi-timeframe liquidity checks to decide whether the tape is being pushed by real sponsorship or just noise. The oscillator's color-coded columns and adaptive burst thresholds transform complex flow dynamics into a single actionable flux score for futures and equities traders.
HOW IT WORKS
Momentum Extraction – Price differentials over a configurable pulse distance are smoothed using exponential moving averages to isolate directional thrust without reacting to single prints.
Volatility + Liquidity Normalization – The momentum stream is divided by realized volatility and multiplied by both local and higher-timeframe EMA volume ratios, ensuring pulses only appear when volatility and liquidity align.
Adaptive Thresholding – A volatility-derived standard deviation of flux is blended with the base threshold so bursts scale automatically between low-volatility and high-volatility market conditions.
Divergence Engine – Linear regression slopes compare price vs. flux to tag bullish/bearish divergences, highlighting stealth accumulation or distribution zones.
HOW TO USE IT
Continuation Entries : Go with the trend when histogram bars stay above the adaptive threshold, the signal line confirms, and trend bias agrees—this is where liquidity-backed follow-through lives.
Fade Plays : Watch for divergence alerts and shrinking compression values; when flux prints below zero yet price grinds higher, hidden selling pressure often precedes rollovers.
Session Filter : Compression percentage in the diagnostics table instantly tells you whether to trade thin overnight sessions—low compression means stand down.
VISUAL FEATURES
Dynamic background heat maps flux magnitude, while threshold lines provide a quick read on whether a pulse is statistically significant.
Diagnostics table displays live flux, signal, adaptive threshold, and compression for quick reference.
Alert-first workflow: The surface is intentionally clean—bursts and divergences are delivered via alerts instead of on-chart clutter.
PARAMETERS
Trend EMA Length (default: 34): Defines the macro bias anchor; increase for higher-timeframe confirmation.
Pulse Distance (default: 8): Controls how sensitive momentum extraction becomes.
Volatility Window (default: 21): Sample window for realized volatility normalization.
Liquidity Window (default: 55): Volume smoothing window that proxies liquidity expansion.
Liquidity Reference TF (default: 60): Select a higher timeframe to cross-check whether current volume matches institutional flows.
Adaptive Threshold (default: enabled): Disable for fixed thresholds on slower markets; enable for high-volatility assets.
Base Burst Threshold (default: 1.25): Minimum flux magnitude that qualifies as an actionable pulse.
ALERTS
The indicator includes four alert conditions:
Bull Burst: Detects upside liquidity pulses
Bear Burst: Detects downside liquidity pulses
Bull Divergence: Flags bullish delta divergence
Bear Divergence: Flags bearish delta divergence
LIMITATIONS
This indicator is designed for liquid futures and equity markets. Performance may degrade in low-volume or highly illiquid instruments. The adaptive threshold system works best on timeframes where sufficient volatility history exists (typically 15-minute charts and above). Divergence signals are probabilistic and should be confirmed with price action.
INSERT_CHART_SNAPSHOT_URL_HERE
---
## RangeLattice Mapper
RangeLattice Mapper constructs a higher-timeframe scaffolding on any intraday chart, locking in structural highs/lows, mid/quarter grids, VWAP confluence, and live acceptance/break analytics. It provides a non-repainting overlay that turns range management into a disciplined process.
HOW IT WORKS
Structure Harvesting – Using request.security() , the script samples highs/lows from a user-selected timeframe (default 240 minutes) over a configurable lookback to establish the dominant range.
Grid Construction – Midpoint and quarter levels are derived mathematically, mirroring how institutional traders map distribution/accumulation zones.
Acceptance Detection – Consecutive closes inside the range flip an acceptance flag and darken the cloud, signaling balanced auction conditions.
Break Confirmation – Multi-bar closes outside the structure raise break labels and alerts, filtering the countless fake-outs that plague breakout traders.
VWAP Fan Overlay – Session VWAP plus ATR-based bands provide a live measure of flow centering relative to the lattice.
HOW TO USE IT
Range Plays : Fade taps of the outer rails only when acceptance is active and VWAP sits inside the grid—this is where mean-reversion works best.
Breakout Plays : Wait for confirmed break labels before entering expansion trades; the dashboard's Width/ATR metric tells you if the expansion has enough fuel.
Market Prep : Carry the same lattice from pre-market into regular trading hours by keeping the structure timeframe fixed; alerts keep you notified even when managing multiple tickers.
VISUAL FEATURES
Range Tap and Mid Pivot markers provide a tape-reading breadcrumb trail for journaling.
Cloud fill opacity tightens when acceptance persists, visually signaling balance compressions ready to break.
Dashboard displays absolute width, ATR-normalized width, and current state (Balanced vs Transitional) so you can glance across charts quickly.
Acceptance Flag toggle: Keep the repeated acceptance squares hidden until you need to audit balance.
PARAMETERS
Structure Timeframe (default: 240): Choose the timeframe whose ranges matter most (4H for indices, Daily for stocks).
Structure Lookback (default: 60): Bars sampled on the structure timeframe.
Acceptance Bars (default: 8): How many consecutive bars inside the range confirm balance.
Break Confirmation Bars (default: 3): Bars required outside the range to validate a breakout.
ATR Reference (default: 14): ATR period for width normalization.
Show Midpoint Grid (default: enabled): Display the midpoint and quarter levels.
Show Adaptive VWAP Fan (default: enabled): Toggle the VWAP channel for assets where volume distribution matters most.
Show Acceptance Flags (default: disabled): Turn the acceptance markers on/off for maximum visual control.
Show Range Dashboard (default: enabled): Disable if screen space is limited, re-enable during prep sessions.
ALERTS
The indicator includes five alert conditions:
Range High Tap: Price interacted with the RangeLattice high
Range Low Tap: Price interacted with the RangeLattice low
Range Mid Tap: Price interacted with the RangeLattice mid
Range Break Up: Confirmed upside breakout
Range Break Down: Confirmed downside breakout
LIMITATIONS
This indicator works best on liquid instruments with clear structural levels. On very low timeframes (1-minute and below), the structure may update too frequently to be useful. The acceptance/break confirmation system requires patience—faster traders may find the multi-bar confirmation too slow for scalping. The VWAP fan is session-based and resets daily, which may not suit all trading styles.
---

Structure Analysis + Hammer Alert# Structure Resistance + Hammer Alert
## 📊 Indicator Overview
This indicator integrates Structure Breakout Analysis with Candlestick Pattern Recognition, helping traders identify market trend reversal points and strong momentum signals. Through visual markers and background colors, you can quickly grasp the bullish/bearish market structure.
---
## 🎯 Core Features
### 1️⃣ Structure Resistance System
- Auto-plot Previous High/Low: Automatically marks key support/resistance based on pivot points
- Structure Breakout Detection: Shows "BULL" when price breaks above previous high, "BEAR" when breaking below previous low
- Trend Background Color: Green background for bullish structure, red background for bearish structure
### 2️⃣ Bullish Momentum Candles (Hammer Patterns)
Detects candles with long lower shadows, indicating strong buying pressure at lows:
- 💪Strong Bull (Bullish Hammer): Green marker, bullish close with significant lower shadow
- 💪Weak Bull (Bearish Hammer): Teal marker, bearish close but strong lower shadow
### 3️⃣ Bearish Momentum Candles (Inverted Hammer/Shooting Star)
Detects candles with long upper shadows, indicating strong selling pressure at highs:
- 💪Weak Bear (Bullish Inverted Hammer): Orange marker, bullish close but significant upper shadow
- 💪Strong Bear (Shooting Star): Red marker, bearish close with significant upper shadow
### 4️⃣ Smart Marker Sizing
Markers automatically adjust size based on current trend:
- With-Trend Signals: Larger markers (e.g., hammer in bullish trend)
- Counter-Trend Signals: Smaller markers (e.g., shooting star in bullish trend)
- Neutral Trend: Medium-sized markers
---
## ⚙️ Parameter Settings
### Structure Resistance Parameters
- Swing Length: Default 5, higher values = clearer structure but fewer signals
- Show Lines/Labels: Toggle on/off options
### Bullish Momentum (Hammer) Parameters
- Lower Shadow/Body Ratio: Default 2.0, lower shadow must be 2x body size
- Upper Shadow/Body Ratio Limit: Default 0.2, upper shadow cannot be too long
- Body Position Ratio: Default 2.0, ensures body is at the top of candle
### Bearish Momentum (Inverted Hammer) Parameters
- Upper Shadow/Body Ratio: Default 2.0, upper shadow must be 2x body size
- Lower Shadow/Body Ratio Limit: Default 0.2, lower shadow cannot be too long
- Body Position Ratio: Default 2.0, ensures body is at the bottom of candle
### Filter & Display Settings
- Minimum Body Size: Filters out doji-like candles with tiny bodies
- Pattern Type Toggles: Show/hide different pattern types individually
- Background Transparency: Adjust background color intensity (higher = more transparent)
- Label Distance: Adjust marker distance from candles
---
## 📈 Usage Guidelines
### Trading Signal Interpretation
**Long Signals (Strongest to Weakest):**
1. Bullish Structure + Bullish Hammer (💪Strong Bull) → Strongest long signal
2. Bullish Structure + Bearish Hammer (💪Weak Bull) → Secondary long signal
3. Bearish Structure + Hammer → Potential reversal signal
**Short Signals (Strongest to Weakest):**
1. Bearish Structure + Shooting Star (💪Strong Bear) → Strongest short signal
2. Bearish Structure + Bullish Inverted Hammer (💪Weak Bear) → Secondary short signal
3. Bullish Structure + Shooting Star → Potential reversal signal
### Practical Tips
✅ Trend Following: Prioritize large marker signals (aligned with trend)
✅ Structure Confirmation: Wait for structure breakout before entry to avoid false breaks
✅ Multiple Timeframes: Confirm trend direction with higher timeframes
⚠️ Counter-Trend Caution: Small marker signals (counter-trend) require stricter risk management
---
## 🔔 Alert Setup
This indicator provides 9 alert conditions:
- Individual Patterns: Bullish Hammer, Bearish Hammer, Bullish Inverted Hammer, Shooting Star
- Combined Signals: Bullish Momentum, Bearish Momentum, Bull/Bear Momentum
- Structure Breakouts: Bullish Structure Break, Bearish Structure Break
---
## 💡 FAQ
**Q: Why do hammers sometimes appear without markers?**
A: Check "Minimum Body Size" setting - the candle body may be too small and filtered out
**Q: Too many or too few markers?**
A: Adjust "Lower Shadow/Body Ratio" or "Upper Shadow/Body Ratio" parameters - higher ratios = stricter conditions
**Q: How to see only the strongest signals?**
A: Disable "Bearish Hammer" and "Bullish Inverted Hammer", keep only "Bullish Hammer" and "Shooting Star"
**Q: Can it be used on all timeframes?**
A: Yes, but recommended for 15-minute and higher timeframes - shorter timeframes have more noise
---
## 📝 Disclaimer
⚠️ This indicator is a supplementary tool and should be used with other technical analysis methods
⚠️ Past performance does not guarantee future results - always practice proper risk management
⚠️ Recommended to test on demo account before live trading
---
**Version:** Pine Script v6
**Applicable Markets:** Stocks, Futures, Cryptocurrencies, and all markets

CCI TIME COUNT//@version=6
indicator("CCI Multi‑TF", overlay=true)
// === Inputs ===
// CCI Inputs
cciLength = input.int(20, "CCI Length", minval=1)
src = input.source(hlc3, "Source")
// Timeframes
timeframes = array.from("1", "3", "5", "10", "15", "30", "60", "1D", "1W")
labels = array.from("1m", "3m", "5m", "10m", "15m", "30m", "60m", "Daily", "Weekly")
// === Table Settings ===
tblPos = input.string('Top Right', 'Table Position', options = , group = 'Table Settings')
i_textSize = input.string('Small', 'Text Size', options = , group = 'Table Settings')
textSize = i_textSize == 'Small' ? size.small : i_textSize == 'Normal' ? size.normal : i_textSize == 'Large' ? size.large : size.tiny
textColor = color.white
// Resolve table position
var pos = switch tblPos
'Top Left' => position.top_left
'Top Right' => position.top_right
'Bottom Left' => position.bottom_left
'Bottom Right' => position.bottom_right
'Middle Left' => position.middle_left
'Middle Right' => position.middle_right
=> position.top_right
// === Custom CCI Function ===
customCCI(source, length) =>
sma = ta.sma(source, length)
dev = ta.dev(source, length)
(source - sma) / (0.015 * dev)
// === CCI Values for All Timeframes ===
var float cciVals = array.new_float(array.size(timeframes))
for i = 0 to array.size(timeframes) - 1
tf = array.get(timeframes, i)
cciVal = request.security(syminfo.tickerid, tf, customCCI(src, cciLength))
array.set(cciVals, i, cciVal)
// === Countdown Timers ===
var string countdowns = array.new_string(array.size(timeframes))
for i = 0 to array.size(timeframes) - 1
tf = array.get(timeframes, i)
closeTime = request.security(syminfo.tickerid, tf, time_close)
sec_left = barstate.isrealtime and not na(closeTime) ? math.max(0, (closeTime - timenow) / 1000) : na
min_left = sec_left >= 0 ? math.floor(sec_left / 60) : na
sec_mod = sec_left >= 0 ? math.floor(sec_left % 60) : na
timer_text = barstate.isrealtime and not na(sec_left) ? str.format("{0,number,00}:{1,number,00}", min_left, sec_mod) : "–"
array.set(countdowns, i, timer_text)
// === Build Table ===
if barstate.islast
rows = array.size(timeframes) + 1
var table t = table.new(pos, 3, rows, frame_color=color.rgb(252, 250, 250), border_color=color.rgb(243, 243, 243))
// Headers
table.cell(t, 0, 0, "Timeframe", text_color=textColor, bgcolor=color.rgb(238, 240, 242), text_size=textSize)
table.cell(t, 1, 0, "CCI (" + str.tostring(cciLength) + ")", text_color=textColor, bgcolor=color.rgb(239, 243, 246), text_size=textSize)
table.cell(t, 2, 0, "Time to Close", text_color=textColor, bgcolor=color.rgb(239, 244, 248), text_size=textSize)
// Data Rows
for i = 0 to array.size(timeframes) - 1
row = i + 1
label = array.get(labels, i)
cciVal = array.get(cciVals, i)
countdown = array.get(countdowns, i)
// Color CCI: Green if < -100, Red if > 100
cciColor = cciVal < -100 ? color.green : cciVal > 100 ? color.red : color.rgb(236, 237, 240)
// Background warning if <60 seconds to close
tf = array.get(timeframes, i)
closeTime = request.security(syminfo.tickerid, tf, time_close)
sec_left = barstate.isrealtime and not na(closeTime) ? math.max(0, (closeTime - timenow) / 1000) : na
countdownBg = sec_left < 60 ? color.rgb(255, 220, 220, 90) : na
// Table cells
table.cell(t, 0, row, label, text_color=color.rgb(239, 240, 244), text_size=textSize)
table.cell(t, 1, row, str.tostring(cciVal, "#.##"), text_color=cciColor, text_size=textSize)
table.cell(t, 2, row, countdown, text_color=color.rgb(232, 235, 243), bgcolor=countdownBg, text_size=textSize)

Kalman Ema Crosses - [JTCAPITAL]Kalman EMA Crosses - is a modified way to use Kalman Filters applied on Exponential Moving Averages (EMA Crosses) for Trend-Following.
Credits for the kalman function itself goes to @BackQuant
The Kalman filter is a recursive smoothing algorithm that reduces noise from raw price or indicator data, and in this script it is applied both directly to price and on top of EMA calculations. The goal is to create cleaner, more reliable crossover signals between two EMAs that are less prone to false triggers caused by volatility or market noise.
The indicator works by calculating in the following steps:
Source Selection
The script starts by selecting the price input (default is Close, but can be adjusted). This chosen source is the foundation for all further smoothing and EMA calculations.
Kalman Filtering on Price
Depending on user settings, the selected source is passed through one of two independent Kalman filters. The filter takes into account process noise (representing expected market randomness) and measurement noise (representing uncertainty in the price data). The Kalman filter outputs a smoothed version of price that minimizes noise and preserves underlying trend structure.
EMA Calculation
Two exponential moving averages (EMA 1 and EMA 2) are then computed on the Kalman-smoothed price. The lengths of these EMAs are fully customizable (default 15 and 25).
Kalman Filtering on EMA Values
Instead of directly using raw EMA curves, the script applies a second layer of Kalman filtering to the EMA values themselves. This step significantly reduces whipsaw behavior, creating smoother crossovers that emphasize real momentum shifts rather than temporary volatility spikes.
Trend Detection via EMA Crossovers
-A bullish trend is detected when EMA 1 (fast) crosses above EMA 2 (slow).
-A bearish trend is detected when EMA 1 crosses below EMA 2.
The detected trend state is stored and used to dynamically color the plots.
Visual Representation
Both EMAs are plotted on the chart. Their colors shift to blue during bullish phases and purple during bearish phases. The area between the two EMAs is filled with a shaded region to clearly highlight trending conditions.
Buy and Sell Conditions:
-Buy Condition: When the Kalman-smoothed EMA 1 crosses above the Kalman-smoothed EMA 2, a bullish crossover is confirmed.
-Sell Condition: When EMA 1 crosses below EMA 2, a bearish crossover is confirmed.
Users may enhance the robustness of these signals by adjusting process noise, measurement noise, or EMA lengths. Lower measurement noise values make the filter react faster (but potentially noisier), while higher values make it smoother (but slower).
Features and Parameters:
-Source: Selectable price input (Close, Open, High, Low, etc.).
-EMA 1 Length: Defines the fast EMA period.
-EMA 2 Length: Defines the slow EMA period.
-Process Noise: Controls how much randomness the Kalman filter assumes in price dynamics.
-Measurement Noise: Controls how much uncertainty is assumed in raw input data.
-Kalman Usage: Option to apply Kalman filtering either before EMA calculation (on price) or after (on EMA values).
Specifications:
Kalman Filter
The Kalman filter is an optimal recursive algorithm that estimates the state of a system from noisy measurements. In trading, it is used to smooth prices or indicator values. By balancing process noise (expected volatility) with measurement noise (data uncertainty), it generates a smoothed signal that reacts adaptively to market conditions.
Exponential Moving Average (EMA)
An EMA is a weighted moving average that emphasizes recent data more heavily than older data. This makes it more responsive than a simple moving average (SMA). EMAs are widely used to identify trends and momentum shifts.
EMA Crossovers
The crossing of a fast EMA above a slow EMA suggests bullish momentum, while the opposite suggests bearish momentum. This is a cornerstone technique in trend-following systems.
Dual Kalman Filtering
Applying Kalman both to raw price and to the EMAs themselves reduces whipsaws further. It creates crossover signals that are not only smoothed but also validated across two levels of noise reduction. This significantly enhances signal reliability compared to traditional EMA crossovers.
Process Noise
Represents the filter’s assumption about how much the underlying market can randomly change between steps. Higher values make the filter adapt faster to sudden changes, while lower values make it more stable.
Measurement Noise
Represents uncertainty in price data. A higher measurement noise value means the filter trusts the model more than the observed data, leading to smoother results. A lower value makes the filter more reactive to observed price fluctuations.
Trend Coloring & Fill
The use of dynamic colors and filled regions provides immediate visual recognition of trend states, helping traders act faster and with greater clarity.
Enjoy!

Linear Trajectory & Volume StructureThe Linear Trajectory & Volume Structure indicator is a comprehensive trend-following system designed to identify market direction, volatility-adjusted channels, and high-probability entry points. Unlike standard Moving Averages, this tool utilizes Linear Regression logic to calculate the "best fit" trajectory of price, encased within volatility bands (ATR) to filter out market noise.
It integrates three core analytical components into a single interface:
Trend Engine: A Linear Regression Curve to determine the mean trajectory.
Volume Verification: Filters signals to ensure price movement is backed by market participation.
Market Structure: Identifies previous high-volume supply and demand zones for support and resistance analysis.
2. Core Components and Logic
The Trajectory Engine
The backbone of the system is a Linear Regression calculation. This statistical method fits a straight line through recent price data points to determine the current slope and direction.
The Baseline: Represents the "fair value" or mean trajectory of the asset.
The Cloud: Calculated using Average True Range (ATR). It expands during high volatility and contracts during consolidation.
Trend Definition:
Bullish: Price breaks above the Upper Deviation Band.
Bearish: Price breaks below the Lower Deviation Band.
Neutral/Chop: Price remains inside the cloud.
Smart Volume Filter
The indicator includes a toggleable volume filter. When enabled, the script calculates a Simple Moving Average (SMA) of the volume.
High Volume: Current volume is greater than the Volume SMA.
Signal Validation: Reversal signals and structure zones are only generated if High Volume is present, reducing the likelihood of trading false breakouts on low liquidity.
Volume Structure (Smart Liquidity)
The script automatically plots Support (Demand) and Resistance (Supply) boxes based on pivot points.
Creation: A box is drawn only if a pivot high or low is formed with High Volume (if the volume filter is active).
Mitigation: The boxes extend to the right. If price breaks through a zone, the box turns gray to indicate the level has been breached.
3. Signal Guide
Trend Reversals (Buy/Sell Labels)
These are the primary signals indicating a potential change in the macro trend.
BUY Signal: Appears when price closes above the upper volatility band after previously being in a downtrend.
SELL Signal: Appears when price closes below the lower volatility band after previously being in an uptrend.
Pullbacks (Small Circles)
These are continuation signals, useful for adding to positions or entering an existing trend.
Long Pullback: The trend is Bullish, but price dips momentarily below the baseline (into the "discount" area) and closes back above it.
Short Pullback: The trend is Bearish, but price rallies momentarily above the baseline (into the "premium" area) and closes back below it.
4. Configuration and Settings
Trend Engine Settings
Trajectory Length: The lookback period for the Linear Regression. This is the most critical setting for tuning sensitivity.
Channel Multiplier: Controls the width of the cloud.
1.0: Aggressive. Results in narrower bands and earlier signals, but more false positives.
1.5: Balanced (Default).
2.0+: Conservative. Creates a wide channel, filtering out significant noise but delaying entry signals.
Signal Logic
Show Trend Reversals: Toggles the main Buy/Sell labels.
Show Pullbacks: Toggles the re-entry circle signals.
Smart Volume Filter: If checked, signals require above-average volume. Unchecking this yields more signals but removes the volume confirmation requirement.
Volume Structure
Show Smart Liquidity: Toggles the Support/Resistance boxes.
Structure Lookback: Defines how many bars constitute a pivot. Higher numbers identify only major market structures.
Max Active Zones: Limits the number of boxes on the chart to prevent clutter.
5. Timeframe Optimization Guide
To maximize the effectiveness of the Linear Trajectory, you must adjust the Trajectory Length input based on your trading style and timeframe.
Scalping (1-Minute to 5-Minute Charts)
Recommended Length: 20 to 30
Multiplier: 1.2 to 1.5
Logic: Fast-moving markets require a shorter lookback to react quickly to micro-trend changes.
Day Trading (15-Minute to 1-Hour Charts)
Recommended Length: 55 (Default)
Multiplier: 1.5
Logic: A balance between responsiveness and noise filtering. The default setting of 55 is standard for identifying intraday sessions.
Swing Trading (4-Hour to Daily Charts)
Recommended Length: 89 to 100
Multiplier: 1.8 to 2.0
Logic: Swing trading requires filtering out intraday noise. A longer length ensures you stay in the trade during minor retracements.
6. Dashboard (HUD) Interpretation
The Head-Up Display (HUD) provides a summary of the current market state without needing to analyze the chart visually.
Bias: Displays the current trend direction (BULLISH or BEARISH).
Momentum:
ACCELERATING: Price is moving away from the baseline (strong trend).
WEAKENING: Price is compressing toward the baseline (potential consolidation or reversal).
Volume: Indicates if the current candle's volume is HIGH or LOW relative to the average.
Disclaimer
*Trading cryptocurrencies, stocks, forex, and other financial instruments involves a high level of risk and may not be suitable for all investors. This indicator is a technical analysis tool provided for educational and informational purposes only. It does not constitute financial advice, investment recommendations, or a guarantee of profit. Past performance of any trading system or methodology is not necessarily indicative of future results.

Matt's Multi-Timeframe MACD Direction AlertThe indicator monitors the direction of the Moving Average Convergence Divergence (MACD) lines on four specific timeframes: 1-hour, 15-minute, 5-minute, and 1-minute.
It only generates a signal when the MACD in all four timeframes is trending in the same direction (either all are bullish, or all are bearish). This alignment suggests a strong, synchronized market momentum from short-term scalping views up to immediate-term swing views.
Key Features:
Multi-Timeframe Confirmation: Uses TradingView's request.security() function to fetch data from different timeframes (1h, 15m, 5m, 1m), preventing the need to manually switch charts.
Visual Dashboard: A dashboard table is displayed on your chart, providing an immediate visual status (Bullish/Bearish/Neutral) for each of the four timeframes.
On-Chart Signals: The indicator plots visual shapes (green triangles for bullish alignment, red triangles for bearish alignment) directly on the sub-chart when the condition is met.
Custom Alert Integration: It includes a built-in alertcondition() function, allowing traders to set up real-time, hands-free notifications whenever a synchronized trading opportunity arises.
This tool helps filter out noise and potential false signals that might appear on a single timeframe, focusing instead on robust signals confirmed by a consensus of time perspectives.

BTC Price Prediction Model [Global PMI]V2🇺🇸 English Guide
1. Introduction
This indicator was created by GW Capital using Gemini Vibe Coding technology. It leverages advanced AI coding capabilities to reconstruct complex macroeconomic models into actionable trading tools.
2. Credits
Special thanks to the original model author, Marty Kendall. His research into the correlation between Bitcoin's price and macroeconomic factors lays the foundation for this algorithm.
3. Model Principles & Formula
This model calculates the "Fair Value" of Bitcoin based on four key macroeconomic pillars. It assumes that Bitcoin's price is a function of Global Liquidity, Network Security, Risk Appetite, and the Economic Cycle.
💡 Unique Insight: PMI & The 4-Year Cycle
A key distinguishing feature of this model is the hypothesis that Bitcoin's famous "4-Year Halving Cycle" may be intrinsically linked to the Global Business Cycle (PMI), rather than just supply shocks.
Therefore, the model incorporates PMI as a valuation "Amplifier".
Note: Due to TradingView data limitations, US PMI is currently used as the proxy for the global cycle.
The Formula
$$\ln(BTC) = \alpha + (1 + \beta \cdot PMI_{z}) \times $$
Global Liquidity (M2): Sum of M2 supply from US, China, Eurozone, and Japan (converted to USD). Represents the pool of fiat money available to flow into assets.
Network Security (Hashrate): Bitcoin's hashrate, representing the physical security and utility of the network.
Risk Appetite (S&P 500): Used as a proxy for global risk sentiment.
Economic Cycle (PMI Z-Score): US Manufacturing PMI is used to amplify or dampen the valuation based on where we are in the business cycle (Expansion vs. Contraction).
4. How to Use
The indicator plots the Fair Value (White Line) and four sentiment bands based on statistical deviation (Z-Score).
Sentiment Zones
🚨 Extreme Greed (Red Zone): Price > +0.3 StdDev. Historically indicates a market top or overheated sentiment.
⚠️ Greed (Orange Zone): Price > +0.15 StdDev. Bullish momentum is strong but caution is advised.
⚖️ Fair Value (White Line): The theoretical "correct" price based on macro data.
😨 Fear (Teal Zone): Price < -0.15 StdDev. Undervalued territory.
💎 Extreme Fear (Green Zone): Price < -0.3 StdDev. Historically a generational buying opportunity.
Sentiment Score (0-100)
100: Maximum Greed (Top)
50: Fair Value
0: Maximum Fear (Bottom)
5. Usage Recommendations
Timeframe: Daily (1D) or Weekly (1W) ONLY.
Reason: The underlying data sources (M2, PMI) are updated monthly. The S&P 500 and Hashrate are daily. Using this indicator on intraday charts (e.g., 15m, 1h, 4h) adds no value because the fundamental data does not change that fast.
Long-Term View: This is a macro-cycle indicator designed for identifying cycle tops and bottoms over months and years, not for day trading.
6. Disclaimer
This indicator is for educational and informational purposes only. It does not constitute financial advice. The model relies on historical correlations which may not hold true in the future. All trading involves risk. GW Capital and the creators assume no responsibility for any trading losses.
7. Support Us ❤️
If you find this indicator useful, please Boost 👍, Comment, and add it to your Favorites! Your support keeps us going.
🇨🇳 中文说明 (Chinese Version)
1. 简介
本指标由 GW Capital 使用 Gemini Vibe Coding 技术制作。利用先进的 AI 编程能力,将复杂的宏观经济模型重构为可执行的交易工具。
2. 致谢
特别感谢模型原作者 Marty Kendall。他对这一算法的研究奠定了基础,揭示了比特币价格与宏观经济因素之间的深层联系。
3. 模型原理与公式
该模型基于四大宏观经济支柱计算比特币的“公允价值”。它假设比特币的价格是全球流动性、网络安全性、风险偏好和经济周期的函数。
💡 独家洞察:PMI 与 4年周期
本模型的一个核心独特之处在于:我们认为比特币著名的“4年减半周期”背后的真正驱动力,可能与全球商业周期 (PMI) 高度同步,而不仅仅是供应减半。
因此,模型特别引入 PMI 作为估值的“放大器” (Amplifier)。
注:由于 TradingView 数据源限制,目前采用历史数据最详尽的美国 PMI 作为全球周期的代理指标。
模型公式
$$\ln(BTC) = \alpha + (1 + \beta \cdot PMI_{z}) \times $$
全球流动性 (M2): 美、中、欧、日四大经济体的 M2 总量(折算为美元)。代表可流入资产的法币资金池。
网络安全性 (Hashrate): 比特币全网算力,代表网络的物理安全性和实用价值。
风险偏好 (S&P 500): 作为全球风险情绪的代理指标。
经济周期 (PMI Z-Score): 美国制造业 PMI 用于根据商业周期(扩张 vs 收缩)来放大或抑制估值。
4. 指标用法
指标会在图表上绘制 公允价值 (白线) 以及基于统计偏差 (Z-Score) 的四条情绪带。
情绪区间
🚨 极度贪婪 (红色区域): 价格 > +0.3 标准差。历史上通常预示市场顶部或情绪过热。
⚠️ 一般贪婪 (橙色区域): 价格 > +0.15 标准差。多头动能强劲,但需谨慎。
⚖️ 公允价值 (白线): 基于宏观数据的理论“正确”价格。
😨 一般恐惧 (青色区域): 价格 < -0.15 标准差。进入低估区域。
💎 极度恐惧 (绿色区域): 价格 < -0.3 标准差。历史上通常是代际级别的买入机会。
情绪评分 (0-100)
100: 极度贪婪 (顶部)
50: 公允价值
0: 极度恐惧 (底部)
5. 使用建议
周期: 仅限日线 (1D) 或周线 (1W)。
原因: 底层数据源(M2, PMI)是月度更新的。标普500和算力是日度更新的。在日内图表(如15分钟、1小时、4小时)上使用此指标没有任何意义,因为基本面数据不会变化得那么快。
长期视角: 这是一个宏观周期指标,旨在识别数月甚至数年的周期顶部和底部,而非用于日内交易。
6. 免责声明
本指标仅供教育和参考使用,不构成任何财务建议。该模型依赖于历史相关性,未来可能不再适用。所有交易均涉及风险。GW Capital 及制作者不对任何交易损失承担责任。

BTC Price Prediction Model [Global PMI]🇨🇳 中文说明 (Chinese Version)
1. 简介
本指标由 GW Capital 使用 Gemini Vibe Coding 技术制作。利用先进的 AI 编程能力,将复杂的宏观经济模型重构为可执行的交易工具。
2. 致谢
特别感谢模型原作者 Marty Kendall。他对这一算法的研究奠定了基础,揭示了比特币价格与宏观经济因素之间的深层联系。
3. 模型原理与公式
该模型基于四大宏观经济支柱计算比特币的“公允价值”。它假设比特币的价格是全球流动性、网络安全性、风险偏好和经济周期的函数。
模型公式
$$\ln(BTC) = \alpha + (1 + \beta \cdot PMI_{z}) \times $$
全球流动性 (M2): 美、中、欧、日四大经济体的 M2 总量(折算为美元)。代表可流入资产的法币资金池。
网络安全性 (Hashrate): 比特币全网算力,代表网络的物理安全性和实用价值。
风险偏好 (S&P 500): 作为全球风险情绪的代理指标。
经济周期 (PMI Z-Score): 美国制造业 PMI 用于根据商业周期(扩张 vs 收缩)来放大或抑制估值。
4. 指标用法
指标会在图表上绘制 公允价值 (白线) 以及基于统计偏差 (Z-Score) 的四条情绪带。
情绪区间
🚨 极度贪婪 (红色区域): 价格 > +0.3 标准差。历史上通常预示市场顶部或情绪过热。
⚠️ 一般贪婪 (橙色区域): 价格 > +0.15 标准差。多头动能强劲,但需谨慎。
⚖️ 公允价值 (白线): 基于宏观数据的理论“正确”价格。
😨 一般恐惧 (青色区域): 价格 < -0.15 标准差。进入低估区域。
💎 极度恐惧 (绿色区域): 价格 < -0.3 标准差。历史上通常是代际级别的买入机会。
情绪评分 (0-100)
100: 极度贪婪 (顶部)
50: 公允价值
0: 极度恐惧 (底部)
5. 使用建议
周期: 仅限日线 (1D) 或周线 (1W)。
原因: 底层数据源(M2, PMI)是月度更新的。标普500和算力是日度更新的。在日内图表(如15分钟、1小时、4小时)上使用此指标没有任何意义,因为基本面数据不会变化得那么快。
长期视角: 这是一个宏观周期指标,旨在识别数月甚至数年的周期顶部和底部,而非用于日内交易。
6. 免责声明
本指标仅供教育和参考使用,不构成任何财务建议。该模型依赖于历史相关性,未来可能不再适用。所有交易均涉及风险。GW Capital 及制作者不对任何交易损失承担责任。
🇺🇸 English Guide (英文说明)
1. Introduction
This indicator was created by GW Capital using Gemini Vibe Coding technology. It leverages advanced AI coding capabilities to reconstruct complex macroeconomic models into actionable trading tools.
2. Credits
Special thanks to the original model author, Marty Kendall. His research into the correlation between Bitcoin's price and macroeconomic factors lays the foundation for this algorithm.
3. Model Principles & Formula
This model calculates the "Fair Value" of Bitcoin based on four key macroeconomic pillars. It assumes that Bitcoin's price is a function of Global Liquidity, Network Security, Risk Appetite, and the Economic Cycle.
The Formula
$$\ln(BTC) = \alpha + (1 + \beta \cdot PMI_{z}) \times $$
Global Liquidity (M2): Sum of M2 supply from US, China, Eurozone, and Japan (converted to USD). Represents the pool of fiat money available to flow into assets.
Network Security (Hashrate): Bitcoin's hashrate, representing the physical security and utility of the network.
Risk Appetite (S&P 500): Used as a proxy for global risk sentiment.
Economic Cycle (PMI Z-Score): US Manufacturing PMI is used to amplify or dampen the valuation based on where we are in the business cycle (Expansion vs. Contraction).
4. How to Use
The indicator plots the Fair Value (White Line) and four sentiment bands based on statistical deviation (Z-Score).
Sentiment Zones
🚨 Extreme Greed (Red Zone): Price > +0.3 StdDev. Historically indicates a market top or overheated sentiment.
⚠️ Greed (Orange Zone): Price > +0.15 StdDev. Bullish momentum is strong but caution is advised.
⚖️ Fair Value (White Line): The theoretical "correct" price based on macro data.
😨 Fear (Teal Zone): Price < -0.15 StdDev. Undervalued territory.
💎 Extreme Fear (Green Zone): Price < -0.3 StdDev. Historically a generational buying opportunity.
Sentiment Score (0-100)
100: Maximum Greed (Top)
50: Fair Value
0: Maximum Fear (Bottom)
5. Usage Recommendations
Timeframe: Daily (1D) or Weekly (1W) ONLY.
Reason: The underlying data sources (M2, PMI) are updated monthly. The S&P 500 and Hashrate are daily. Using this indicator on intraday charts (e.g., 15m, 1h, 4h) adds no value because the fundamental data does not change that fast.
Long-Term View: This is a macro-cycle indicator designed for identifying cycle tops and bottoms over months and years, not for day trading.
6. Disclaimer
This indicator is for educational and informational purposes only. It does not constitute financial advice. The model relies on historical correlations which may not hold true in the future. All trading involves risk. GW Capital and the creators assume no responsibility for any trading losses.

STRAT - MTF Dashboard + FTFC + Reversals v2.7# STRAT Indicator - Complete Description
## Overview
A comprehensive multi-timeframe STRAT trading system indicator that combines market structure analysis, flip levels, Full Timeframe Continuity (FTFC), and reversal pattern detection across 12 timeframes.
## Core Features
### 1. **Multi-Timeframe STRAT Dashboard**
- Displays STRAT combos (1, 2u, 2d, 3) across 12 timeframes: 1m, 5m, 15m, 30m, 1H, 4H, 12H, Daily, Weekly, Monthly, Quarterly, Yearly
- Color-coded directional bias (green/red/doji)
- Inside bars (●) and Outside bars (●) highlighted
- Current timeframe marked with ★
### 2. **HTF Flip Levels with Smart Grouping**
- Displays higher timeframe (HTF) flip levels (open prices) as labels on the right side
- Automatically groups multiple timeframes at the same price level (e.g., "★ 1H/4H/D")
- Current timeframe flip level always displayed with ★ marker
- Color-coded: Green (above price) / Red (below price)
### 3. **Full Timeframe Continuity (FTFC)**
- User-selectable 4 timeframes for FTFC analysis (default: D, W, M, Q)
- Green line: FTFC Up (highest open of 4 timeframes)
- Red line: FTFC Down (lowest open of 4 timeframes)
- Identifies when price is above/below all 4 timeframe opens
### 4. **Hammer & Shooting Star Detection**
- **Hammer Pattern**: Long lower wick (≥2x body), small upper wick, signals potential bottom reversal
- **Shooting Star Pattern**: Long upper wick (≥2x body), small lower wick, signals potential top reversal
- Scans last 100 bars (adjustable) and marks ALL historical patterns
- Chart markers: 🔨 (Hammer) below bars, 🔻 (Shooting Star) above bars
- Dashboard column shows reversal patterns for each timeframe
- Adjustable wick-to-body ratio sensitivity (1.5 to 5.0)
### 5. **Debug Tables**
- **FTFC Debug**: Shows close vs. 4 timeframe opens, confirms all-green/all-red conditions
- **Reversal Debug**: Real-time analysis of current bar - body size, wick measurements, ratios, and pattern qualification
## Settings
### Display Settings
- Dashboard position (9 options: top-left to bottom-right)
- Dashboard text size (tiny to huge)
- Label offset and text size
- Toggle individual features on/off
### FTFC Settings
- Select 4 custom timeframes for continuity analysis
- Default: Daily, Weekly, Monthly, Quarterly
### Reversal Settings
- **Wick to Body Ratio**: Sensitivity for pattern detection (default 2.0)
- **Lookback Bars**: How many historical bars to scan (default 100, max 500)
- Show/hide reversal markers on chart
- Show/hide reversal debug table
## Use Cases
1. **Momentum Trading**: Identify STRAT setups (2-2, 2-1-2 reversals, 3-bar plays) across multiple timeframes
2. **Swing Trading**: Use HTF flip levels as support/resistance and FTFC for trend confirmation
3. **Reversal Trading**: Catch hammer/shooting star patterns at key levels for counter-trend entries
4. **Multi-Timeframe Analysis**: Confirm alignment across timeframes before entering trades
## How to Use
### For STRAT Traders
- Look for 2-1-2 reversal setups in the dashboard
- Watch for inside bars (●) at HTF flip levels for breakout trades
- Use outside bars (●) to identify potential volatility expansion
### For Reversal Traders
- 🔨 Hammers after downtrends = potential long entries
- 🔻 Shooting stars after uptrends = potential short entries
- Combine with HTF flip levels for high-probability setups
### For Trend Followers
- FTFC green line above = bullish structure
- FTFC red line below = bearish structure
- Enter when price breaks and holds above/below FTFC levels
## Visual Elements
- **Green Labels**: HTF flip levels above current price (resistance)
- **Red Labels**: HTF flip levels below current price (support)
- **Lime Line**: FTFC Up (highest timeframe open)
- **Red Line**: FTFC Down (lowest timeframe open)
- **🔨 Icon**: Hammer pattern (potential reversal up)
- **🔻 Icon**: Shooting Star pattern (potential reversal down)
- **★ Symbol**: Current timeframe or multiple timeframes grouped
## Performance Notes
This indicator performs 12 multi-timeframe security calls and may take 15-30 seconds to calculate on initial load. This is normal for comprehensive MTF analysis.
## Version
v2.7 - Simplified reversal detection, current TF labeling, optimized performance
---
**Perfect for**: STRAT traders, multi-timeframe analysts, reversal pattern traders, swing traders looking for high-probability setups with confluence across timeframes.
