Savanner Level IndexFinds Price Support Based on last 20 Bar Low, 40 Bar low, and 80 Bar low, and calculated using 1x 80 bar low, 0.5x 40 bar low, and 0.2x of the 20 bar low. Feel free to check out the script!
How to use: Add to your chart, drag the indictor to the main chart, then merge both scales on the right!
Search in scripts for "股价在8元左右净利润为正市值小于80亿的热门股票有哪些"

trend Screener List1This is type of custom screener I searched and made to screen bulk stocks any one can modify it, other may get help out of it.
in my code i have made defined
1. uptrend= ema(close,55)> ema(close,144) and ema(close,144)> ema(close,388) and ema(close,388)> ema(close,576) and close>ema(close,388)
2. downtrend = ema(close,55)< ema(close,144) and ema(close,144)< ema(close,388) and ema(close,388)

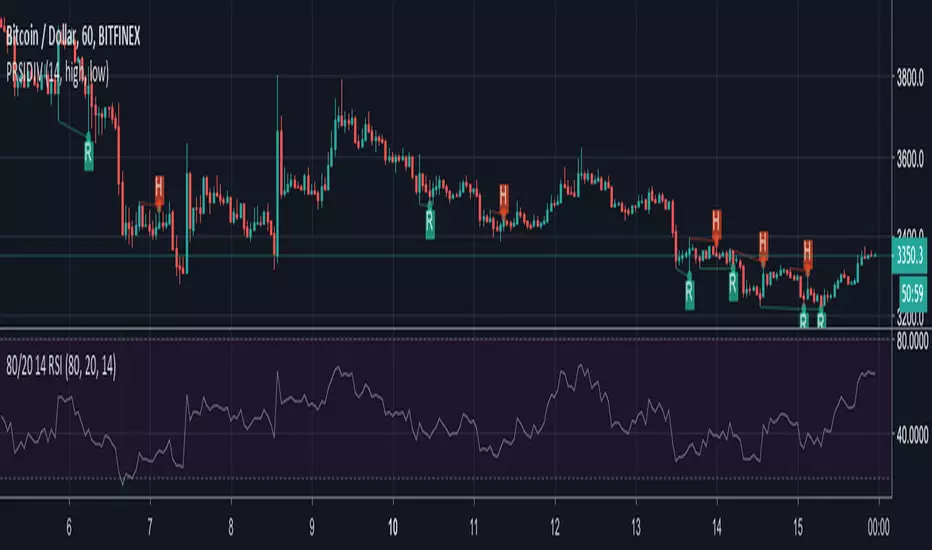
Bjorgum RSIRSI output signals are displayed with color change to reflect the plotted value. This makes evaluating RSI conditions require but a glance.
RSI momentum buy signals are given on the cross of the 50 level, whereas sell signals are given on a fall below.
Default values a 5 period RSI which gives more timely entrances and exits for swing traders. This can be adjusted to the typical 14 period if the viewer desires slower signals.
Bullish and bearish area is shaded to accentuate the signal to the eye.
Excellent results can be found when coupling BJ RSI, with BJ TSI, and the reversal system using all 3 as a complete together simultaneously
Default color changes are plotted as a recorded value falls within the following levels:
RSI < 30 = green
RSI 30-50 = red
RSI 50-70 = blue
RSI 70-80 = yellow
RSI 80-90 = orange
RSI 90-100 = white hot

RSI Step Oscillator [racer8]Purpose of RSO is to identify when RSI has reached key levels. These levels are 80, 70, 60, 40, 30, and 20.
When indicator displays a bar with color...
Purple : RSI > 80
Blue : RSI > 70
Green : RSI > 60
Gray : RSI is inbetween 40 and 60.
Yellow : RSI < 40
Orange : RSI < 30
Red : RSI < 20
Hit the like button and enjoy 😁

ATR Percentile [racer8]ATR Percentile shows you the percentile that the current ATR is at relative to it's previous values.
There are 3 parameters: ATR length, Percentile length, Percentile level.
This is indicator is very interesting because it's based on an indicator that originally doesn't generate signals.
When the current ATR's percentile is higher than the Percentile level, the histogram turns red signalling that the market is more volatile than usual.
For example, ATR len = 10, percentile len = 80, percentile lvl = 70
A signal will be generated when the current ATR(10) is higher than 70% of 80 of it's previous values.
ATR Percentile is range bound between 0 and 100. The histogram's value represents a percentage between that range.
ATR Percentile = ( number of ATR values below current ATR over n periods / n periods ) * 100
Enjoy 🤪

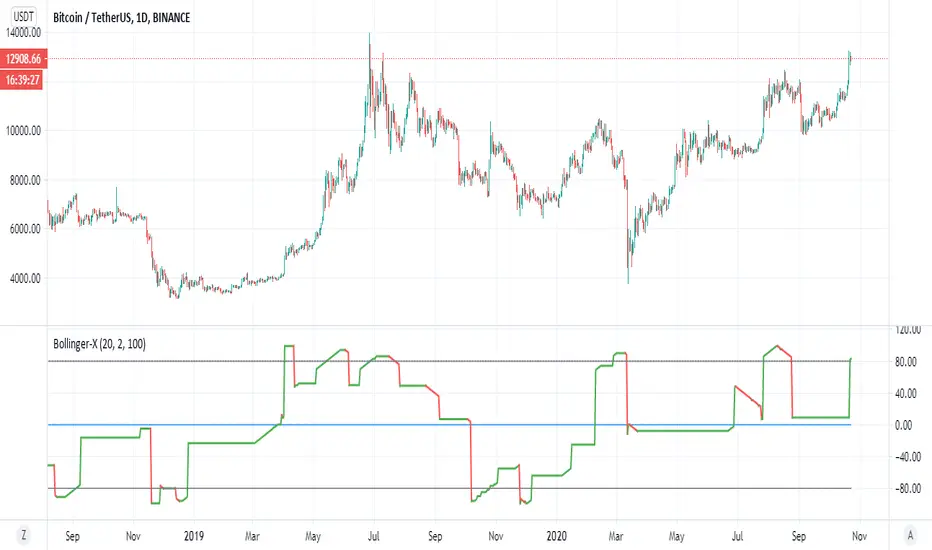
Bollinger-XThis is a different way to look on the bollinger :)
color red is bearish , color green is bullish
the low points is when our modified bollinger cross -80 and high point when cross down 80
above 0 is bullish trend bellow zero is barish trend
so you can look on this indicator from different prespective how to enter or exit trade
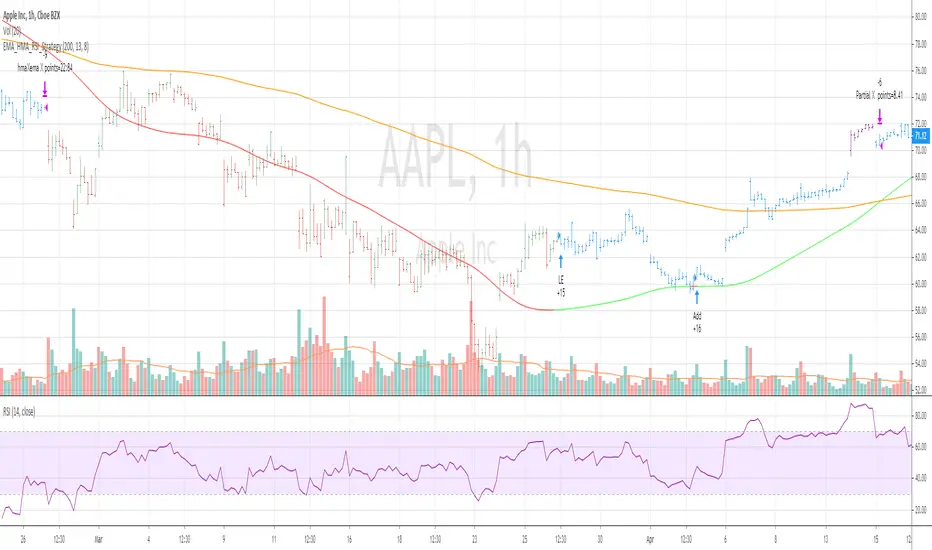
EMA_HMA_RSI_StrategyThis strategy BUYS when HMA is below EMA (default setting is 200) and HMA turning to green and RSI 13 is below 70
Adds to existing position when current price is below BUY price and RSI crossing above 30 or 40
Exits the long position when HMA crosses down EMA
when you select Take Profit setting , partial profits are taken when current price > BUY price and RSI 13 crossing down 80
Bar color changes to purple when RSI13 is above 80 (if only in Long position exists)
Tested for SPY QQQ AAPL on hourly and 30 mins chart
Warning : For educational purposes only
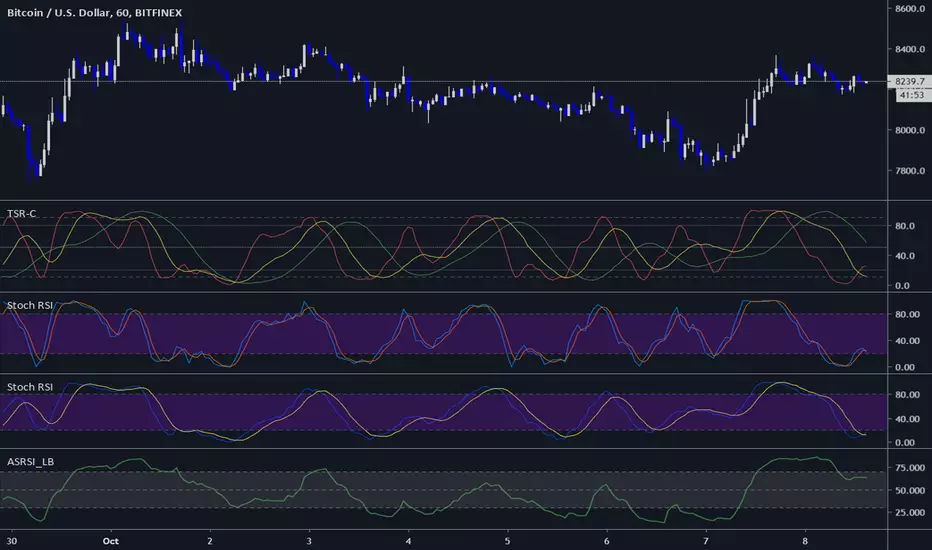
Stoch X, an Indicator of Indicators by DGTStochastic refers to a randomly determined process and financial markets use stochastic models to represent the seemingly random behaviour of assets and then used by quantitative analysts to value options on asset prices
The stochastic oscillator, developed by George Lane, presents the location of the closing price of a stock in relation to the high and low range of the price of a stock over a period of time. Lane has said that the stochastic oscillator does not follow price or volume or anything similar. He indicates that the oscillator follows the speed or momentum of price.
Traditionally, readings over 80 are considered in the overbought range, and readings under 20 are considered oversold. Please note that, very strong trends can maintain overbought or oversold conditions for an extended period and traders should look to changes in the stochastic oscillator for clues about future trend shifts. It is advised to check the higher timeframe of your trading timeframe and see where you are in the “big picture”
Signal crosses , intersection of stochastic and its signal line is considered to be a signal that a reversal may be in the works
Divergence between the stochastic oscillator and trending price action is also seen as an important reversal signal
Lane also reveals in interviews that, as a rule, the momentum or speed of the price of a stock changes before the price changes itself . In this way, the stochastic oscillator can be used to foreshadow reversals when the indicator reveals bullish or bearish divergences. This signal is the first, and arguably the most important, trading signal Lane identified.
What is Stochastic X ?
Stochastic X , is essentially an indicator of an indicator, providing stochastic calculation to some of well known indicators, such as RSI, MFI, OBV, etc. This means that it is a measure of selected specific indicator relative to its own high/low range over a user defined period of time.
Features of Stoch X
1- Displays Stoch of and indicator plus a companion indicator (companion display can be disabled from user dialog box)
Available options
Stoch Source plus PM A, where Source is close price and PMA refers to Price Distance to its Moving Average (for further details you may check my study of Price Distance to its MA by DGT, and different application of distance concept available with “MACD-X, More Than MACD" And “P-MACD”)
Stoch RSI plus RSI , Stoch RSI, developed by Tushar Chande and Stanley Kroll, is a build-in indicator available on Trading View, where Stoch X adds RSI as a companion indicator to Stoch RSI
Stoch MFI and MFI , where MFI is Money Flow Index, measures buying and selling pressure through analyzing both price and volume
Stoch OBV + VO , Where OBV is On Balance Volume, is a momentum indicator that measures positive and negative volume flow. VO stands for Volume Oscillator which aims to confirm a market turnaround or trend reversal
Stoch EWO + EWO , EWO stands for Elliott Wave Oscillator
By default the threshold levels are indicated and are displayed differently for the regular Stoch or Stoch RSI. Overbought band (70-80), oversold band (20-30) and middle line (0) are emphasized
Warning : Centered Oscillators base line is moved from 0 to 50 to better suit with Stoch X, which is applied to PMA, VO and EWO
2- Can be plotted along with Stoch in the same window using the same scaling
To avoid misinterpreting the area between Stoch X and its Signal Line is highlighted automatically in case Stoch is selected to be plotted
3- Squeeze Indicator added as Add-on in the bottom of the Stoch X
During volatile market conditions the stochastic oscillator has been known to produce false signals. One way to help with this is to take the price trend as a filter, or basic chart pattern analysis can help to identify major, underlying trends and increase the Stoch X's accuracy.
This study implements Squeeze Indicator to help and add additional insight for filtering false signals. Blue diamond shapes indicates the squeeze release, that is volatility increased and according to momentum direction the buy/sell possibility can be considered. Orange ones displays consolidation periods, that is low volatility and the market is assumed to be in squeeze and no trade is recommended. in this phase.
Disclaimer: Trading success is all about following your trading strategy and the indicators should fit within your trading strategy, and not to be traded upon solely
The script is for informational and educational purposes only. Use of the script does not constitutes professional and/or financial advice. You alone the sole responsibility of evaluating the script output and risks associated with the use of the script. In exchange for using the script, you agree not to hold dgtrd TradingView user liable for any possible claim for damages arising from any decision you make based on use of the script

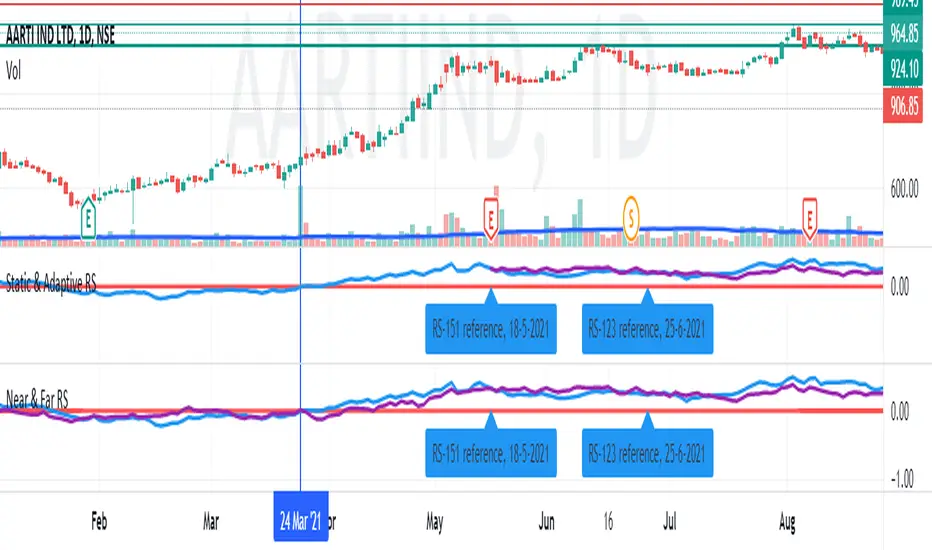
Near & Far Relative StrengthDefine a near time frame base and a far time frame base to compare the selected symbol RS. This helps in situations were you could keep the far RS length to a fixed value and the near RS length to a more recent "event" in the market and it's subsequent movement.
For example, if the market index has made a recovery from a deep crash 80 sessions ago, set the near RS length to 80 and keep the far RS length to a fixed value say, 123 corresponding to 6 months. This will help you gauge the historical vs the recovery strength of your interested symbol before and after the "event".
Ultimate Moving Averages (SMA & EMA)Welcome to the Ultimate Moving Average indicator.
Never again spend time looking for EMA / SMA indicators when you can have them all in this single indicator.
Options include :
Daily Chart: Classic Golden / Death Cross - 50/D and 200/D SMA
Daily Chart: 3-day Golden / Death Cross - 150/D and 600/D SMA
Daily Chart: 140/D SMA
Daily Chart: 700/D SMA
Daily Chart: 1458/D SMA
Daily Chart: Golden Ratio Multiplier
Any Chart: Scalping
9 SMA
10 SMA
20 SMA
21 SMA
30 SMA
34 SMA
50 SMA
80 SMA
100 SMA
200 SMA
8 EMA
10 EMA
13 EMA
20 EMA
21 EMA
26 EMA
30 EMA
34 EMA
50 EMA
55 EMA
80 EMA
89 EMA
100 EMA
200 EMA

KD compare strategy (交易策略對照組)This is a base and easy trading strategy for comparing my other strategy.
The strategy consider K >= 80 is strong target in the last high period,
and consider K <=20 is the weak target in the last low period.
In the strong target, the strategy may increase long at the first day when K < 50, until 2/3 max order limitation or strong target become to weak.
In the weak target, the strategy may increase short at the first day when K > 50, until 2/3 max order limitation or strong target become to strong.
there are three orders for this strategy.
when the strong become to weak, it may use the remain 1/3 to save itself, and change the direction at the next k > 50
when the weak become to weak, it may use the remain 1/3 to save itself, and change the direction at the next k < 50
這是一個簡單的雙向交易策略,用來對照我其他的策略。
當 K>=80 它會認為目前是強勢股,偏多操作
當 K<=20 它會認為目前是強勢股,偏空操作
當標的為強勢股時,當第一次 K<50 會加碼多單,最多買進2/3的持股,直到轉弱
當標的為弱勢股時,當第一次 K>50 會加碼空單,最多買進2/3的持股,直到轉強
當強勢轉弱勢時,會使用剩下的1/3來拯救持股,在下次 k > 50 出清持股
當弱勢轉強勢時,會使用剩下的1/3來拯救持股,在下次 k < 50 出清持股
Three StochRSI ComboThree StochRSI with adjustable lengths in one indicator, with no extra bells or whistles. Lazybear's Apirine Slow RSI is used for the RSI formula for the third Stoch.
14-period StochRSI (red) is considered short term.
20-period StochRSI is another short to mid term preset I've seen used in various indicators on different platforms by default, and is included as the yellow stochRSI.
Lazybear's Apirine Slow RSI is used as the base for the third, slower stoch - parameter input adjustment for your specific timeframe and instrument is recommended. The Apirine Slow RSI doesn't have as effective strong divergences during established trends, so the way it would react in when run through a stoch should be more synergistic than not during trending periods for longer term trends.
StochRSI:
StochRSI measures the value of RSI relative to its high/low range over a set number of periods - It's important to note that StochRSI is technically an indicator of an indicator (RSI), which makes it the second derivative of price. This is part of the main contributing factors to how it looks and functions in relation to price.
A move above 80 ---> considered overbought.
A move below 20 ---> considered oversold.
Moves around the midline (50) can also be interpreted as continuation of upward/downwards trend depending on whether the midline is acting more of as a support (uptrend) or a resistance level (downtrend).
Stoch K-line disabled by default/D-line enabled by default.
Stoch K/D lengths are set to 3/3/14/14 (red), 6/6/20/20 (yellow), 12/12 (green) by default.
Midline (50) set to white/silver to make more visible on darkmode charts.
Additional adjustable levels for Overbought/Oversold beyond 20/80 (set at 10/90 by default - see dashed grey line. Dotted line is 20/80.)
Three stochRSI with 3/3/14/14, 6/6/20/20, and 12/12/14/14/6 length are shown below the indicator for reference.
Acknowledgements:
// Aprine Slow RSI - Lazybear
//
// Stockcharts for StochRSI reference
// school.stockcharts.com
Open Interest Money Flow Index (OIMFI)CAUTION : This system was inspired from seiglerj' s "Money Flow Index " script. Open Interests are used instead of volume.
What is the Money Flow Index ( MFI )?
The Money Flow Index ( MFI ) is a technical oscillator that uses price and volume for identifying overbought or oversold conditions in an asset. It can also be used to spot divergences which warn of a trend change in price. The oscillator moves between 0 and 100.
Unlike conventional oscillators such as the Relative Strength Index ( RSI ), the Money Flow Index incorporates both price and volume data, as opposed to just price. For this reason, some analysts call MFI the volume-weighted RSI .
What Does the Money Flow Index ( MFI ) Tell You?
One of the primary ways to use the Money Flow Index is when there is a divergence. A divergence is when the oscillator is moving in the opposite direction of price. This is a signal of a potential reversal in the prevailing price trend.
For example, a very high Money Flow Index that begins to fall below a reading of 80 while the underlying security continues to climb is a price reversal signal to the downside. Conversely, a very low MFI reading that climbs above a reading of 20 while the underlying security continues to sell off is a price reversal signal to the upside.
Traders also watch for larger divergences using multiple waves in the price and MFI . For example, a stock peaks at $10, pulls back to $8, and then rallies to $12. The price has made two successive highs, at $10 and $12. If MFI makes a lower higher when the price reaches $12, the indicator is not confirming the new high. This could foreshadow a decline in price.
The overbought and oversold levels are also used to signal possible trading opportunities. Moves below 10 and above 90 are rare. Traders watch for the MFI to move back above 10 to signal a long trade, and to drop below 90 to signal a short trade.
Other moves out of overbought or oversold territory can also be useful. For example, when an asset is in an uptrend, a drop below 20 (or even 30) and then a rally back above it could indicate a pullback is over and the price uptrend is resuming. The same goes for a downtrend. A short-term rally could push the MFI up to 70 or 80, but when it drops back below that could be the time to enter a short trade in preparation for another drop .
Reference : www.investopedia.com
WARNING :
** Since each instrument in the list has its own unique contract data, you must first enter its name to display it. I recommend you to select OANDA from the markets. Finally, when the COT reports are issued, it may repaints. However, this repaint is usually close to closing or after close .(When COT reports are so sharp ) So use this script only 1W ( 1 week ) or 1 M ( 1 month ) timeframe.
** This data is taken to Tradingview with the help of Quandl. This is a very low possibility, but the system will not work if there is a malfunction.
FEATURES :
*** Working with all futures (Including : Bitcoin )
*** If you dont work with "Futures" , you can select "Others" from switchable menu and use volume for all instruments.
*** New generation elegant design used : Adaptive coloring Overbought - Oversold Levels according to the closing price.
NOTE : This code is open source under the MIT License. If you have any improvements or corrections to suggest, please send me a pull request via the github repository github.com
Stay tuned. Best wishes !

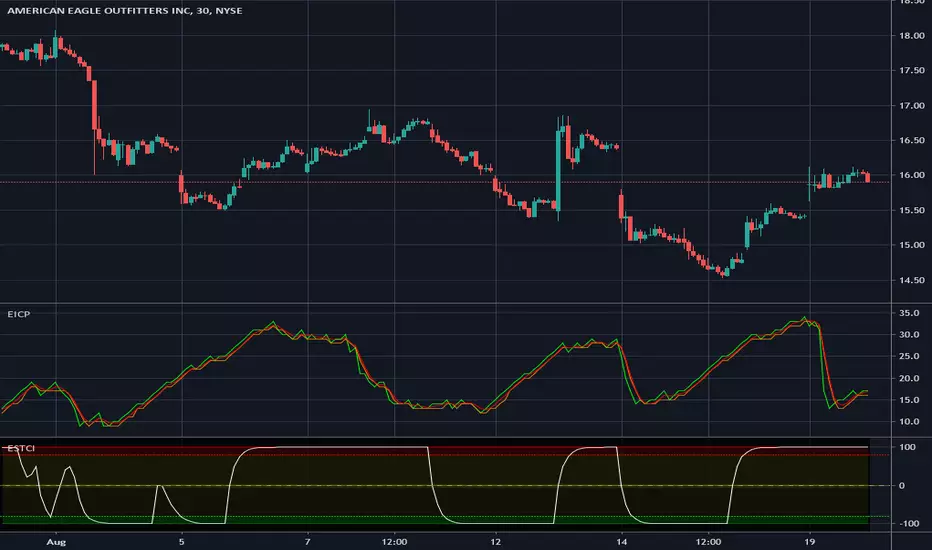
Enhanced Instantaneous Cycle Period - Dr. John EhlersThis is my first public release of detector code entitled "Enhanced Instantaneous Cycle Period" for PSv4.0 I built many months ago. Be forewarned, this is not an indicator, this is a detector to be used by ADVANCED developers to build futuristic indicators in Pine. The origins of this script come from a document by Dr. John Ehlers entitled "SIGNAL ANALYSIS CONCEPTS". You may find this using the NSA's reverse search engine "goggles", as I call it. John Ehlers' MESA used this measurement to establish the data window for analysis for MESA Cycle computations. So... does any developer wish to emulate MESA Cycle now??
I decided to take instantaneous cycle period to another level of novel attainability in this public release of source code with the following methods, if you are curious how I ENHANCED it. Firstly I reduced the delay of accurate measurement from bar_index==0 by quite a few bars closer to IPO. Secondarily, I provided a limit of 6 for a minimum instantaneous cycle period. At bar_index==0, it would provide a period of 0 wrecking many algorithms from the start. I also increased the instantaneous cycle period's maximum value to 80 from 50, providing a window of 6-80 for the instantaneous cycle period value window limits. Thirdly, I replaced the internal EMA with another algorithm. It reduces the lag while extracting a floating point number, for algorithms that will accept that, compared to a sluggish ordinary EMA return. You will see the excessive EMA delay with adding plot(ema(ICP,7)) as it was originally designed. Lastly it's in one simple function for reusability in a nice little package comprising of less than 40 lines of code. I hope I explained that adequately enough and gave you the reader a glimpse of the "Power of Pine" combined with ingenuity.
Be forewarned again, that most of Pine's built-in functions will not accept a floating-point number or dynamic integers for the "length" of it's calculation. You will have to emulate the built-in functions by creating Pine based custom functions, and I assure you, this is very possible in many cases, but not all without array support. You may use int(ICP) to extract an integer from the smoothICP return variable, which may be favorable compared to the choppiness/ringing if ICP alone.
This is commonly what my dense intricate code looks like behind the veil. If you are wondering why there is barely any notation, that's because the notation is in the variable naming and this is intended primarily for ADVANCED developers too. It does contain lines of code that explore techniques in Pine that may be applicable in other Pine projects for those learning or wishing to excel with Pine.
Showcased in the chart below is my free to use "Enhanced Schaff Trend Cycle Indicator", having a common appeal to TV users frequently. If you do have any questions or comments regarding this indicator, I will consider your inquiries, thoughts, and ideas presented below in the comments section, when time provides it. As always, "Like" it if you simply just like it with a proper thumbs up, and also return to my scripts list occasionally for additional postings. Have a profitable future everyone!
NOTICE: Copy pasting bandits who may be having nefarious thoughts, DO NOT attempt this, because this may violate Tradingview's terms, conditions and/or house rules. "WE" are always watching the TV community vigilantly for mischievous behaviors and actions that exploit well intended authors for the purpose of increasing brownie points in reputation scores. Hiding behind a "protected" wall may not protect you from investigation and account penalization by TV staff. Be respectful, and don't just throw an ma() in there branding it as "your" gizmo. Fair enough? Alrighty then... I firmly believe in "innovating" future state-of-the-art indicators, and please contact me if you wish to do so.
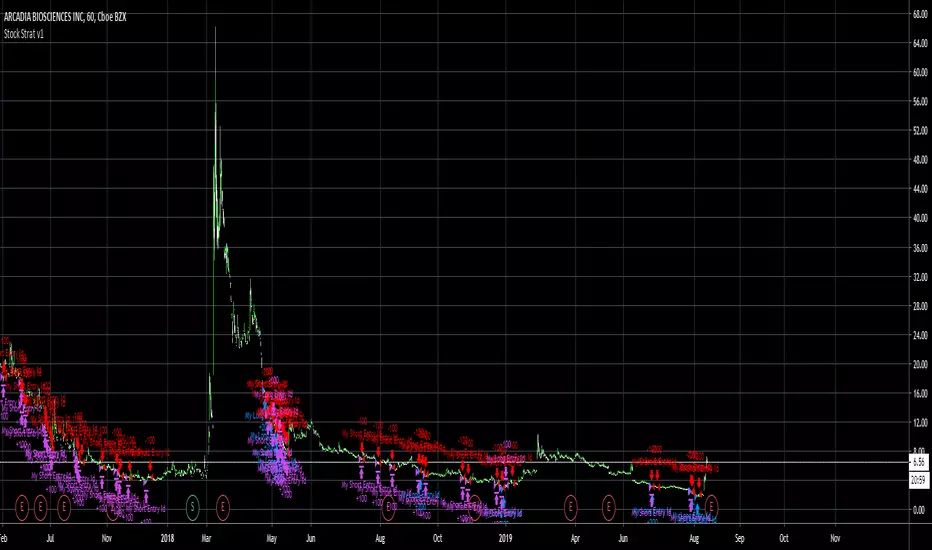
Stock Strat v1Stock Strat v1
Buy: mom > mom1 and mom1 > mom2 and rsi > 80
Sell: mom < mom1 and mom1 < mom2 and rsi < 80
stoch pop and RSI2 strategyI have combined stochsatic POP and RSI2 strategy.
Go Long on stochstaic > 80 and RSI2 pulled back to 30 (note when you are entering Long, check that stochsatic is still above 80 )
Close Long when stochastic crossing down 55
I have back tested this on SPY weekly. It has less trades but high profitable with very less draw down.
Other time frames you have more signals but , not great winning rate.
Since this is weekly setup, good for investing ... long waiting to close , patience required :-)

FX Meter ScriptA while ago, we wrote* about the usefulness of using a currency strength meter and how you can build one from scratch.
See here: www.globalprime.com.au
Now we've taken this little project to the next level by visually spotting, via color signals in a dashboard and alerts, when a potential new trend might be developing in a currency pair.
*It's critical that you first read that article before you jump into reading this one or else you could get easily lost.
The script gives a trigger every time two currencies show diverging flows via opposing moving average slopes.
The signals originate from a first chart where currency indexes can be found, calculated through a formula, in various thin lines. Then a moving average to each currency index is applied so that it can smooth out the lines (what I call Micro moving averages – thicker lines -) and is usually a 4-5 period MA, with the key input to pay attention being the slope. One can perform their own tests on what works best for their particular trading style. The smaller the period in the moving average, the more responsive to changes in biases but the downside is that you will get a greater number of false moves. In the windows below the 1st chart, the stochRSI is calculated for each currency index (these values originate from the currency index and not from the applied MA). By default, a 25-period is applied to both RSI and Stoch length.
A 2nd chart that looks at the same logic is also accounted for to build this script, but instead of checking the micro trend, it applies a 25MA to the currency index, so it looks at what I call the slope of the macro trend. In this case, by default, a 125-period is applied to both RSI and Stoch length.
We had in mind to transition from just eye-balling and monitoring these charts manually to build a script via Tradingview that makes calculations real time (whenever the change in the moving average slope first occurs, and not when the bar/line closes), so that one can decide whether or not its a signal worth trading as part of a new trend emerging. Note, this is not so much a signal-triggering indicator but rather a tool to constantly be on the lookout monitoring what currencies might start to develop trends.
The actual script consists of a dashboard with different colored rectangles being triggered depending on the quality of the signal.
We will be happy to discuss it further with anyone who is interested in exploiting all the benefits that it can offer.
The way you add the script into your Tradingview chart is by first copy everything in the txt file. Then go to Pine editor (bottom middle-left) in your tradingview chart, delete everything there, then Paste the script. Then click Add to Chart (top right of the pine editor).
Note, you should add via the Anchored Text function the following list of pairs below, in this alphabetic order, on the right-hand side of the chart, as demonstrated above:
AUDCAD
AUDJPY
AUDNZD
AUDUSD
CADJPY
EURAUD
EURJPY
EURCAD
EURNZD
EURGBP
EURUSD
GBPAUD
GBPCAD
GBPJPY
GBPNZD
GBPUSD
NZDCAD
NZDJPY
NZDUSD
USDCAD
USDJPY
There are only 2 rules for the script to trigger a signal (see below). However, as I will elaborate further down, there are up to 6 different colors we can grade a signal
RULE 1 -> 2 moving averages, which are a calculation applied to a currency index as shown in the micro trend above, exhibit slopes in the opposite direction.
RULE 2 -> The Stoch RSI cannot be in overbought conditions if the slope of the moving average points higher or in oversold if the slope points lower.
Note 1: Even if the chart is a 60m timeframe by default (can be changed to any timeframe(, one gets the signal the moment the change of slope is identified, which means the indicator monitors changes in price tick by tick, and not on a candle close, otherwise one would get the trigger too late.
As an example of the highest-graded signal triggering (in green), a few hours ago we were given the visual cue that GBPCAD was experiencing a change of behavior. If we crosscheck the time the green-colored trigger was given with the actual GBPCAD chart, this is what we can observe. The pair is 30p higher since the trigger.
HOW TO SETUP ALERTS
One can easily setup a notification window each time the above rules are met, for example, if the EUR MA slope changes to bullish, and the AUD MA slope changes to bearish, and none of the 2 currency index values corresponding to these 2 moving averages (EUR and AUD) show a stoch RSI in overbought (above 80) in the case of the EUR, or oversold (below 20) in the case of the AUD, then the notification pop up would show a customized line: Long EURAUD
Note 1: Recording the slope of the macro moving average, which is usually a 25period MA applied to the currency index, is not included as part of the rules to trigger a signal, but it is taken into account to grade the quality of each signal.
Note 2: I recommend each signal to be triggered once or if you prefer, simply monitor the chart visually on the change of colors via the dashboard. The calculation resets and can appear again the moment that the slope changes to the opposite direction, so it’s a very dynamic indicator that will alert you the second a pair of currencies starts trending.
Note 3: When the signal is triggered, the indicator draws a colored rectangle. Each signal notification should be colored based on the following logic below.
LOGIC TO QUALIFY SIGNALS
-> Any long micro position with Macro MA in full agreement (ie/ Long EURAUD, Macro EUR up, Macro AUD down) is highlighted with green color
-> Any long micro position with macro moving averages in partial agreement (for example Long EURAUD, Macro EUR up AUD up) is highlighted with blue color
-> Any long micro position with macro moving averages in full disagreement (for example Long EURAUD, Macro EUR down AUD up) is highlighted with magenta color
-> Any short micro position with macro moving averages in full agreement (for example Short EURAUD, Macro EUR down AUD up) is highlighted with red color
-> Any short micro position with macro moving averages in partial agreement (for example Short EURAUD, Macro EUR up AUD up) is highlighted with orange color
-> Any short micro position with macro moving averages in full disagreement (for example Short EURAUD, Macro EUR up AUD down) is highlighted with purple color
PARAMETERS IN THE SCRIPT SETTINGS
Overbought/oversold: One can modify the stoch RSI level from which the indicator considers the value to be in overbought or oversold conditions. As a rule of thumb, consider 20/30 for oversold and 70/80 for oversold.
Slopes micro/macro MAs: One can edit the slope of the micro MA period (rule of thumb 4-5) and the macro MA (by default 25).
Value StochRSI: The default inputs are K 3, D 3, RSI Length 25, Stoch Length 25 for the micro and 125 period for the macro.
Change colors: One can edit the assigned colors in the signals dashboard.
Timeframe applied: The indicator has the flexibility to be applied to any timeframe, not just the 60m by default. Simply change the timeframe temporality.
CURRENCY INDEXES FORMULAS
It is the responsibility of the user to keep the values of the indexes updated. Find a recent sample below, as per values in early April. What this means is that at least once a week, in order to not let the values outdated, you should update the script with the latest valuations in the denominator.
NZD INDEX -> FX_IDC:NZDAUD/0.96+FX:NZDJPY/75.81+FX:NZDUSD/0.68+FX_IDC:NZDEUR/0.6+FX_IDC:NZDGBP/0.52+FX:NZDCHF/0.69+FX:NZDCAD/0.9
EUR INDEX -> FX:EURUSD/1.13+FX:EURJPY/125.5+FX:EURGBP/0.87+FX:EURCHF/1.135+FX:EURCAD/1.49+FX:EURNZD/1.655+FX:EURAUD/1.59
JPY INDEX -> 1/(FX:USDJPY/110.5+FX:EURJPY/125.5+FX:AUDJPY/79+FX:NZDJPY/75.5+FX:GBPJPY/144.5+FX:CHFJPY/110.5+FX:CADJPY/84)
USD INDEX -> FX_IDC:USDEUR/0.88+FX:USDJPY/110.5+FX_IDC:USDGBP/0.77+FX:USDCHF+FX:USDCAD/1.315+FX_IDC:USDNZD/1.46+FX_IDC:USDAUD/1.4
CAD INDEX-> FX_IDC:CADAUD/1.07+FX_IDC:CADNZD/1.11+FX:CADJPY/84.27+FX_IDC:CADUSD/0.76+FX_IDC:CADEUR/0.67+FX:CADCHF/0.76+FX_IDC:CADGBP/0.58
GBP INDEX -> FX:GBPAUD/1.83+FX:GBPNZD/1.91+FX:GBPJPY/144.5+FX_IDC:GBPEUR/1.15+FX:GBPCHF/1.31+FX:GBPUSD/1.31+FX:GBPCAD/1.71
Remember, I have provided a manual on how to build a currency strength meter. That’s what you will need to do first if you want to obtain the actual currency indexes other than just the indicator, which is just the visual cue to get you alerted when the slopes turn.
Once you’ve created your indexes via tradingview, you then apply a moving average to each index. Then apply the stochrsi 25 period to each index. For the macro trend, I make the same calculations, but the period of the MA is 25 instead of 4, while the stoch rsi is 125 periods vs 25 periods.
FINAL NOTE
This is a tool that should be interpreted as visual assistance, via the dashboard, to get that first cue when opposing micro slopes via the FX meter occur. However, you still need to check the technical context of the pair (levels marked, proj reached, etc.) but that first cue is a major time saver to constantly spot what's trending in FX. The permutations u can play with, as part of this script, are significant. You can tweak the timeframes you use, the periods of the moving averages, etc. I find the micro and macro trend combos when either a green or red signals is triggered the most reliable, with positions to be exploited via 15m and hourly under the right technical context.

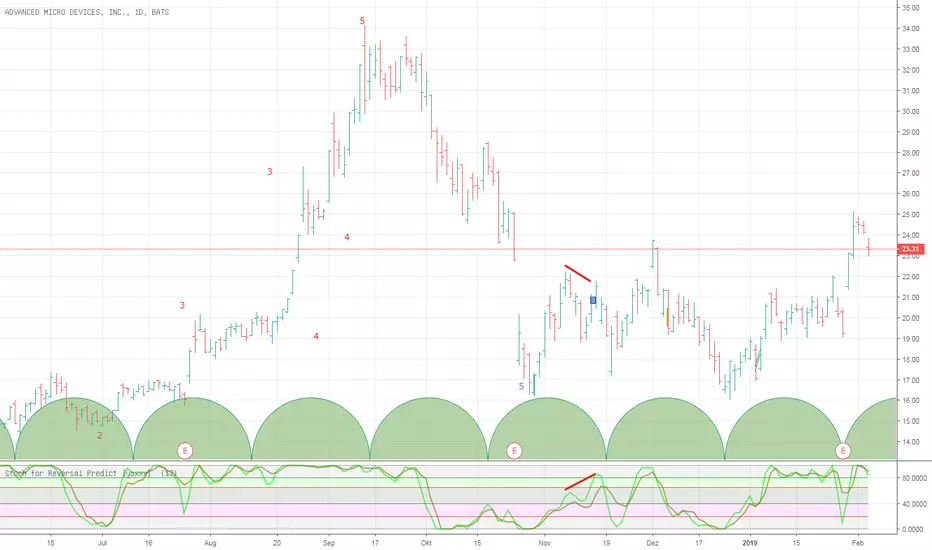
Stochastic for Reversal Predict [yoxxx] Usable for all markets, all time frames. (The bull bear sup/res lines are specific for stocks, but differ just a little to other instruments.)
This script is more likely a method support than a study - and your exit from the default stochastic club:
Most people use Stoch for ins and outs by 20 rsp 80 (a default behavior MM know well to deal with). C.G. Lane, the inventor of this indicator,
however used it to find divergences with quote (price / close) to predict reversals. Constance Brown refined this method by laying
a fix time cycle underneath the chart that is in rhythm with specific highs or lows of a stock or an index.
The length of one cycle divided by 2 equals the proper value for %D specified for that stock /index. The script offers an input for this specific value.
C. Brown stresses that good signals are only given within the bull or bear ranges (20-65 for bear markets, 40-80 for bull markets).
For your convenience, I laid these areas underneath the graphs. You can automate the divergence research (relative to quote)
by using my script "Bull Bear Divergence Indicator". Feedback welcome. Have fun and success.
The Last 50 Trading System - RSIThis is an adjustment to default RSI indicator
14 time period to 8
70 and 30 lines to 80 and 20
change RSI line color on oversold and overbought area to yellow
this indicator is for the use of "RSI 80 - 20 Trading Sytem: Learn to Trade Divergence, and Find a Low Risk Way to Sell Near The Top or Buy Near The Bottom " by TradingStrategyGuides.com
You can FREE download the PDF here drive.google.com (GDrive)
you will also need "The Last 50 Overlay" Indicator to put on chart

Prices / RSI divergences detectorPrices / RSI divergences detector.
Display both hidden and regular divergences.
I used it with my own RSI indicator. You can find the script here:
RSI|The Wave PrincipleThe Wave Principle | Modified RSI
30 green | 70 red = Strong Movement (Possible Impulse)
20 cyan | 80 Yellow = Strongest Movement
Support and Resistance Level (Trend Continuation)
Uptrend= 40
Downtrend = 60
Break+Retest = BR
Div = Divergence (Change in trend)
--------------------------------------------
This indicator has been modified from original RSI to fit Wave Principle characteristics:
Uptrend Impulsive Wave over 70 RSI it changes color to red, and > 80 yellow stronger impulse | Usually means continuation, at least once more.
Downtrend Impulsive Wave under 30 RSI it changes color to green, and < 20 cyan stronger impulse | Usually means continuation, at least once more.
Once RSI reached these levels, it doesn't mean trend reversal but a correction is expected. If it shows divergence along with an Ending Diagonal, it's a confirmation for trend reversal.
In a corrective wave, levels 40-60 represents support and resistance levels where price won't go further. Indicating Corrective Waves, not as strong as Impulsives.
Prices can breakout RSI trend lines and retest from the other side before continue the new trend as also described in the Wave Principle.
--------------------------------------------

RSI / Stoch / SRSI / MFI / Aroon Overlay [SigmaDraconis]Combines 4 popular indicators (RSI, Stoch, SRSI, MFI) and 1 peculiar one (Aroon) in 1 for those who want to save indicators but not only.
This is an evolution of my (simpler) "RSI / Stoch / Stoch RSI (SRSI) Overlay " that you can find on my scripts.
Added bands for oversold/overbought areas (70/30 common for RSI and 80/20 for SRSI and MFI), as well as a middle 50 horizontal line.
Neutral bands around 55-45 added as well that can be hidden for less clutter. I also recommend a more transparent coloring for these since Pine script doesn't allow default transparency for horizontal lines.
By default only RSI and Stoch are activated, you can activate Aroon, MFI and SRSI on the inputs window.
Some extra notes:
* RSI, Stoch and MFI can help to strengthen one's decision as well as Aroon to predict a possible trend reversal, SRSI can show when RSI has high probability of being topped or bottomed when oversold/overbought but don't forget to look at volume and how the trend progresses that can keep SRSI above 80 or below 20 while RSI and price continues to trend, divergences are most helpful here to find possible reversal areas.
* This chart depicts some interesting divergences, as well as Stoch tops and bottoms and confluences between RSI/MFI and Stoch on some over-extended tops and bottoms that shown being good reversal zones.
RSI resistances are shown as well, failing to break above 60 or the neutral zone (this is a bearish BTC trend chart after all) or failing to gain support to break up certain levels (RSI notes a more bullish trend when consistently above 60 and more bearish below 40).
If you like it and use it to profit, please tip me below :)
Tip jars:
BTC: 15nMBiEGVrdGcu9C1h6QRcTNRvugHkqrMQ
ETH: 0xC33845946c48B61fBCbEA0367ec2238CaF2b73bc
BTS: sigma-draconis

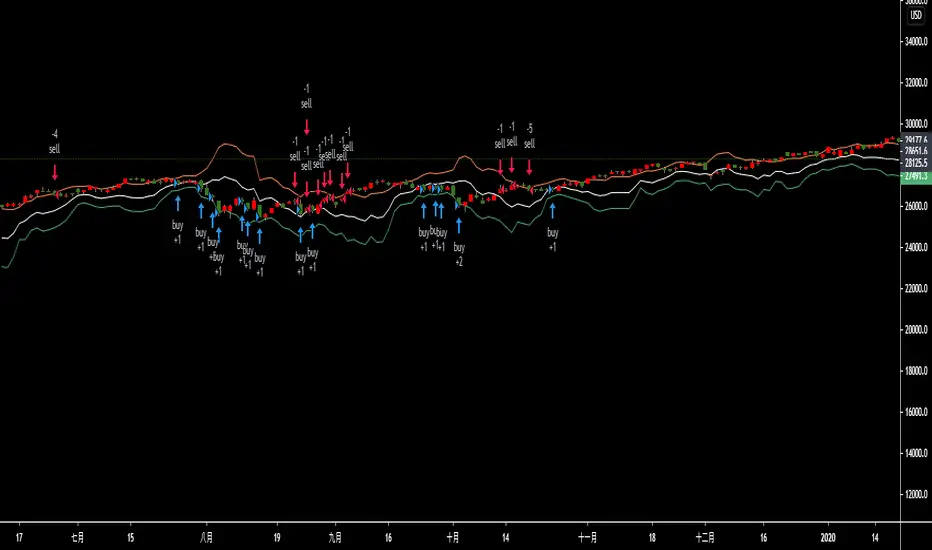
MACZVWAP modifiedThis is lazy bear script . I just modify little so we can produce better signals
buy is cross above -80 ..
sell is cross down bellow 80
