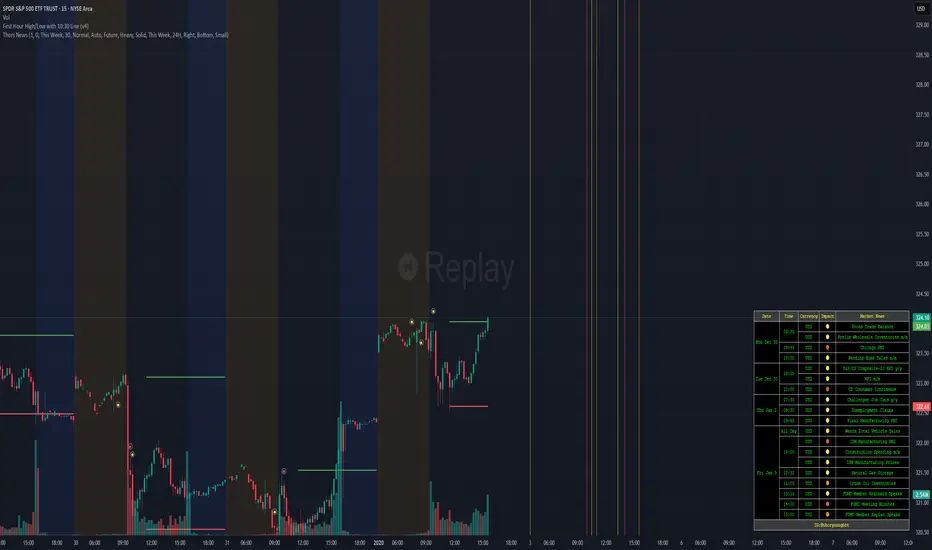
๐ % Drop from 52WH & ATH (Color Coded)This indicator displays the percentage drop of the current price from:
๐น 52-week high (approx. 1 year)
๐น All-time high (ATH)
Each value is color-coded to reflect market positioning and risk level:
โ
Green: Drop less than 25% (low drawdown, relatively strong)
โ ๏ธ Yellow: Drop between 25%โ35% (moderate drawdown)
๐ด Red: Drop more than 35% (deep drawdown, potentially oversold)
The values appear in a compact info box at the top-right of the chart and work on any timeframe and asset, including stocks, crypto, indices, etc.
This tool is ideal for:
๐ Spotting deep corrections
๐ข Identifying strong relative performers
๐ Managing entry/exit based on risk zones
Sentiment
FMX Trend Confirmation - No Reversals๐ FMX Continuation Signal โ No Reversals
Powered by the FMX Model (Fundamentals Meet Execution)
This indicator is designed to capture high-probability continuation trades only, avoiding risky reversals. It confirms buy or sell signals based on:
โ
15-Minute Structure Shift Confirmation
โ
Liquidity Sweeps (stop hunts beyond recent highs/lows)
โ
Trend Validation using HTF SMA (default: 15min)
โ
Second Candle Close inside the sweep range โ FMX-grade precision
๐ Green โBuyโ labels appear when:
Liquidity is swept below recent lows
Price closes back inside the range
The higher timeframe trend is bullish
๐ Orange โSellโ labels appear when:
Liquidity is swept above recent highs
Price closes back inside the range
The higher timeframe trend is bearish
๐ก๏ธ No reversal signals are plotted. This tool is meant for traders who follow the trend with smart money logic, inspired by FMX principles.
Bitcoin PERP/SPOT Sentiment Index# Bitcoin PERP/SPOT Sentiment Index
A comprehensive Pine Script indicator that measures market sentiment by analyzing the premium/discount between Bitcoin perpetual futures and spot prices across multiple cryptocurrency exchanges.
## ๐ Overview
The Bitcoin PERP/SPOT Sentiment Index provides traders with deep insights into market psychology and risk appetite in the cryptocurrency ecosystem. By calculating the price difference (premium/discount) between perpetual futures contracts and spot prices, it reveals how traders are positioned and their sentiment toward Bitcoin's price direction.
**Key Insight**: The premium between PERP and SPOT prices is a powerful sentiment indicator that reflects trader positioning, risk appetite, and market psychology - data that influences but is separate from actual exchange funding rates.
## ๐ฏ Core Functionality
### Premium Calculation Methodology
The indicator calculates market sentiment using the following approach:
1. **Multi-Exchange Data Collection**: Fetches real-time prices from major exchanges for both perpetual futures (PERP) and spot markets
2. **TWAP Calculation**: Computes time-weighted average prices for both market types to reduce noise
3. **Premium Analysis**: Calculates the percentage difference between PERP and SPOT prices
4. **Sentiment Smoothing**: Applies time-weighted smoothing for stable sentiment readings
**Formula**: `Premium = (PERP_TWAP / SPOT_TWAP - 1) ร 100`
### Market Sentiment Insights
**Positive Premium (PERP > SPOT) = Risk-On Sentiment**
- Traders prefer leveraged long positions via perpetuals
- High risk appetite and bullish expectations
- Willingness to pay premium for leverage access
- Often coincides with FOMO and greed phases
**Negative Premium (PERP < SPOT) = Risk-Off Sentiment**
- Traders prefer spot holdings or short perpetuals
- Fear-driven behavior and bearish expectations
- Spot premium indicates institutional accumulation
- Often coincides with capitulation and fear phases
### Exchange Coverage
**Perpetual Futures (17 markets)**:
- Bitmex (USD, USDT)
- Binance (USDT, USD)
- Bitget (USD, USDT, USDC)
- Bybit (USDT, USD)
- Phemex (USD, USDT)
- Huobi, Kraken, OKX (USD, USDT)
- Deribit, BingX
**Spot Markets (12 markets)**:
- Bitstamp, Binance, Coinbase
- Phemex, Huobi, Kraken, OKX
- Kucoin (USDT, USDC)
- Bitget (USDT, USDC)
- BTC Index
## ๐๏ธ Exchange Selection Modes
### 1. "Most Relevant Exchanges" (Default) โญ
**Why this selection provides the best sentiment analysis:**
This preset focuses on exchanges that most accurately reflect true market sentiment by prioritizing:
#### **Institutional & Retail Balance**
- **Diverse User Base**: Includes exchanges serving both institutional (Coinbase, Kraken) and retail (Binance, Bybit) traders
- **Geographic Diversity**: Balances Western and Asian markets for global sentiment representation
- **Regulatory Clarity**: Focuses on exchanges with clear regulatory standing
#### **High-Quality Sentiment Data**
- **Deep Liquidity**: Ensures price movements reflect genuine sentiment, not thin book effects
- **Price Discovery Leaders**: These exchanges set market direction and sentiment trends
- **Reduced Manipulation**: Larger exchanges are less susceptible to artificial price manipulation
#### **Trading Behavior Insights**
- **Leverage Preferences**: Captures where traders actually choose to take leveraged positions
- **Risk Appetite Signals**: Reflects real money sentiment from major market participants
- **Arbitrage Efficiency**: Premium differences here represent actionable sentiment signals
**Included Exchanges**:
- **PERP**: Bitmex (USD/USDT), Binance (USDT/USD), Bybit (USDT/USD)
- **SPOT**: Bitstamp, Binance, Coinbase, Kraken, Kucoin, Bitget (USDT/USDC)
### 2. "All Exchange Data"
- Maximum market coverage for comprehensive sentiment analysis
- Includes smaller exchanges that may reflect niche trading behaviors
- Best for research and identifying sentiment divergences across market segments
### 3. "Excl. OKX and Huobi"
- Focuses on Western and international exchanges
- Useful for analyzing sentiment outside specific jurisdictions
- Maintains broad coverage while addressing regional concerns
### 4. "Individual: Select Below"
- Custom sentiment analysis for specific exchange combinations
- Perfect for testing regional sentiment differences
- Allows focus on specific trader demographics or market segments
## โ๏ธ Configuration Options
### Core Settings
- **TWAP Interval**: Time period for price averaging
- **Premium Calculation Interval**: Data fetching frequency for sentiment updates
- **Percentage Rate Timeframe**: Multiplier for annualizing premium rates (e.g., 365 for annual rate)
### Sentiment Analysis Controls
- **Cut High Values**: Filters extreme sentiment spikes (>0.1%, >0.2%, >0.5%, >1.2%)
- **Enable Data Validation**: Automatically filters invalid price data for accurate sentiment
- **Minimum Exchanges Required**: Ensures reliable sentiment calculation (default: 3)
### Advanced Features
- **Sentiment Boost**: Adds realistic trading costs to better reflect actual sentiment impact
- **Moving Average Options**: SMA, WMA, EMA, RMA smoothing for trend analysis
- **Real-time Validation**: Prevents calculation with insufficient data
## ๐ Sentiment Interpretation Guide
### Positive Premium (Blue Bars) - Risk-On Sentiment
- **0-0.1%**: Neutral to slightly bullish sentiment
- **0.1-0.3%**: Moderate bullish sentiment, increasing risk appetite
- **0.3-0.5%**: Strong bullish sentiment, high leverage demand
- **>0.5%**: Extreme greed, potential contrarian signal
**Trading Psychology**: Traders are eager to pay premium for leveraged long exposure, indicating confidence and risk-taking behavior.
### Negative Premium (Red Bars) - Risk-Off Sentiment
- **0 to -0.1%**: Neutral to slightly bearish sentiment
- **-0.1% to -0.3%**: Moderate bearish sentiment, risk reduction
- **-0.3% to -0.5%**: Strong bearish sentiment, fear-driven behavior
- **<-0.5%**: Extreme fear, potential capitulation, contrarian opportunity
**Trading Psychology**: Traders prefer spot holdings or short positions, indicating caution and defensive positioning.
## ๐ง Sentiment Analysis Applications
### 1. **Market Psychology Assessment**
- Gauge overall trader confidence and risk appetite
- Identify shifts from greed to fear (and vice versa)
- Spot emotional extremes that often precede reversals
### 2. **Contrarian Trading Signals**
- Extreme positive premium (>0.5%) = potential sell signal (overconfidence)
- Extreme negative premium (<-0.5%) = potential buy signal (oversold sentiment)
- Divergences between price and sentiment for early reversal detection
### 3. **Risk Management**
- High premium = reduce position size (crowded long trades)
- Low/negative premium = potential opportunity for contrarian positions
- Sentiment trend analysis for position timing
### 4. **Market Timing**
- Premium expansion = momentum continuation likely
- Premium contraction = potential trend exhaustion
- Zero-line crosses = sentiment regime changes
### 5. **Institutional vs Retail Behavior**
- Sustained negative premium often indicates institutional accumulation
- Extreme positive premium suggests retail FOMO and leverage excess
## ๐ง Technical Implementation
### Anti-Repainting Protection
```pine
securemodule(data, intervall, source) =>
request.security(data, intervall, source , lookahead=barmerge.lookahead_on)
```
### Data Quality & Sentiment Accuracy
- Price bounds checking (1,000 - 200,000 USD) for realistic data
- Invalid data filtering to prevent sentiment distortion
- Minimum exchange count requirements for reliable sentiment readings
- Outlier detection to filter manipulation attempts
### Performance Optimizations
- Array-based exchange management for efficiency
- Efficient TWAP calculations for real-time sentiment updates
- Modular configuration system for easy customization
- Reduced redundant calculations for faster processing
## ๐ Key Features (v1.0)
- **Bitcoin PERP/SPOT Sentiment Index**: First public release focused on sentiment analysis
- **Multi-Exchange Aggregation**: Combines data from 17 PERP and 12 SPOT markets
- **Advanced Data Validation**: Robust outlier filtering and data quality controls
- **Configurable Exchange Presets**: Optimized selections for different analysis needs
- **Real-Time Sentiment Analysis**: Live premium calculations with anti-repainting protection
## โ ๏ธ Important Distinctions
**What This Indicator Measures:**
- โ
PERP/SPOT price premium (sentiment indicator)
- โ
Market psychology and risk appetite
- โ
Trader positioning preferences
- โ
Leverage demand vs spot preference
**What This Indicator Does NOT Measure:**
- โ Actual exchange funding rates (these come from exchange APIs)
- โ Real funding costs paid by traders
- โ Exact arbitrage profitability
- โ Future price direction (sentiment can be wrong)
**Relationship to Funding Rates:**
The premium calculated by this indicator influences actual funding rates, but funding rates also include exchange-specific factors like funding intervals, rate caps, and internal calculations. This premium serves as a leading sentiment indicator that helps predict funding rate direction.
## ๐ก Advanced Sentiment Strategies
1. **Sentiment Divergence**: Watch for premium direction differing from price movement
2. **Regime Change Detection**: Monitor sustained shifts in premium sign (+ to - or vice versa)
3. **Volatility Prediction**: Extreme premiums often precede high volatility periods
4. **Correlation Analysis**: Compare with VIX, Fear & Greed Index, and on-chain metrics
5. **Multi-Timeframe Sentiment**: Use different timeframes to identify sentiment trends vs noise
BTC Perp-Spot PremiumBTC PerpโSpot Premium w/ EMA Cross
This indicator measures the premium or discount between BTC spot prices and perpetual futures across major exchanges. It visualizes real-time sentiment in the derivatives market and identifies potential inflection points by comparing the behavior of spot traders (real demand) and perp traders (speculative positioning).
What It Does
Calculates the premium spread
Shows the percentage difference between perp and spot prices as a color-coded histogram. Blue bars indicate perps trading above spot (aggressive longs), while red bars suggest perps below spot (risk-off or bearish positioning).
7-exchange composite data feed
Uses a robust average of six perpetual futures sources and seven spot market sources across Binance, Bybit, OKX, Coinbase, Bitfinex, Kraken, and Bitstamp for a balanced and high-fidelity view.
EMA crossover signals
Includes a customizable EMA and MA of the premium. Crossovers are visualized with subtle circle markers to signal sentiment shiftsโblue for EMA crossing above, red for crossing below.
Zero baseline
A horizontal line at zero makes it easy to identify when perps flip from premium to discount territory and vice versa.
Dynamic stats table
Displays live values for the perp average, spot average, and premium % in a neatly formatted corner table.
Why It's Useful
This tool helps traders:
Monitor market sentiment and speculative aggression
Spot inefficiencies between derivatives and spot markets
Identify early reversal or continuation signals
Track potential liquidation zones or trend exhaustion
Confirm breakouts with perp/spot alignment
Whether you're trading short-term momentum or watching for mean-reverting setups, this premium analysis tool brings deeper context to BTC price action directly on your chart.
Rishabh Jackpot Zones + Open Line narendra๐ Narendra Jackpot Zones + Open Line โ by Narendra
This custom indicator is designed to identify key Support and Resistance Zones based on pivot highs/lows, and highlight the Spot Day Open Price โ offering traders clear intraday decision-making references.
๐ Features:
๐ธ Dynamic Support and Resistance Zones from pivot structures
๐ธ Customizable Spot Open Line for trend bias identification
๐ธ Auto-cleaning of old lines for better chart visibility
๐ธ Flexible label sizing to suit your chart aesthetics
โ๏ธ Inputs:
Spot_Day_Open_Price: Manually input today's spot price
Pivot Lookback: Sensitivity of pivot detection
Zone Line Length: Control horizontal zone visibility
Max Lines: Limit visual clutter by setting maximum zones
Label Size: Choose between Small, Normal, Large, Huge
๐ผ Use Cases:
Intraday and positional traders for reversal & breakout points
Visual clarity for trend continuation vs rejection
Works across all instruments and timeframes
โ ๏ธ Disclaimer: This is an educational tool. Use it with your trading plan and risk management. Not a buy/sell recommendation.
Psychological Levels by BulltrekHello Traders !
This Indicator specifically designed to mark Major price points in terms of Psychological or blind levels for XAU Pairs
You can edit the price points as per your desire and can also use it on other pairs too.
Psychological levels are very crucial price points while trading where major reversals or entry points can be observed.
This Indicator once activated displays a line on the Psychological levels , in case of reset chart settings , you can also customise the chart size in the settings on the indicator.
This Indicator is developed by Rahul Jain - Founder of Bulltrek Technology
ๆไบค้ๅๅธไธ่กไธบๅๆ(VP)# ๐ ๆไบค้ๅๅธไธไปทๆ ผ่กไธบๅๆๆๆ ไฝฟ็จ่ฏดๆ
## ๐ ๆๆ ๆฆ่ฟฐ
**ๆไบค้ๅๅธไธไปทๆ ผ่กไธบๅๆ**ๆฏไธไธชไธไธ็TradingViewๆๆ ๏ผ็ปๅไบไผ ็ป็ๆไบค้ๅๅธๅๆ๏ผVolume Profile๏ผๅ็ฐไปฃไปทๆ ผ่กไธบๆๆฏ๏ผไธบไบคๆ่
ๆไพๅ
จ้ข็ๅธๅบๅๆๅทฅๅ
ทใ
### โจ ๆ ธๅฟๅ่ฝ
- ๐ **ๆไบค้ๅๅธๅๆ** - ๆพ็คบ็นๅฎไปทๆ ผๅบ้ด็ๆไบค้้ไธญๅบฆ
- ๐ฏ **ไปทๆ ผ่กไธบ่ฏๅซ** - ๆบ่ฝ่ฏๅซๅ
ณ้ฎไปทๆ ผๆฐดๅนณๅๅธๅบ่กไธบ
- ๐ **ๆ
็ปชๅๅธๅๆ** - ๅฑ็คบไนฐๅๅๆนๅจไธๅไปทๆ ผ็ๅ้ๅฏนๆฏ
- ๐ **ๆฏๆ้ปๅ่ฝฌๆข** - ่ชๅจๆฃๆตๆฏๆ้ปๅ็่ฝฌๆข
- ๐ **ไธไธ็ป่ฎกไฟกๆฏ** - ๆไพ่ฏฆ็ป็ๅธๅบๆฐๆฎ็ป่ฎก
---
## ๐ ๏ธ ๅ่ฝๆจกๅ่ฏฆ่งฃ
### 1. ๐ ๆไบค้ไธๆ
็ปชๅๅธ
#### ๆไบค้ๅๅธ
- **็จ้**: ๆพ็คบๅจ็นๅฎไปทๆ ผๆฐดๅนณ็ๆไบค้ๅฏๅบฆ
- **่งฃ่ฏป**:
- ๐ข **็ปฟ่ฒๆกๅฝข** = ไธๆถจๆไบค้๏ผไนฐ็ไธปๅฏผ๏ผ
- ๐ด **็บข่ฒๆกๅฝข** = ไธ่ทๆไบค้๏ผๅ็ไธปๅฏผ๏ผ
- ๐ **ๆกๅฝข้ฟๅบฆ** = ๆไบค้ๅคงๅฐ
#### ไปทๅผๅบๅ (Value Area)
- **๐ ไปทๅผๅบๅไธๆถจ/ไธ่ท**: 68%ๆไบค้้ไธญ็ๅบๅ
- **๐ VAH (Value Area High)**: ไปทๅผๅบๅไธ่พน็
- **๐ VAL (Value Area Low)**: ไปทๅผๅบๅไธ่พน็
- **๐ฏ POC (Point of Control)**: ๆไบค้ๆๅคง็ไปทๆ ผๆฐดๅนณ
#### ๆ
็ปชๅๅธ
- **๐ ็ๆถจๆ
็ปช**: ไนฐ็ๅ้ๅ ไผๅฟ็ไปทๆ ผๅบๅ
- **๐ป ็่ทๆ
็ปช**: ๅ็ๅ้ๅ ไผๅฟ็ไปทๆ ผๅบๅ
#### ไพ้ๅบๅ
- **๐ป ไพๅบๅบๅ**: ๅๅ้ไธญ็ไฝๆไบค้ๅบๅ
- **๐บ ้ๆฑๅบๅ**: ไนฐ็้ไธญ็ไฝๆไบค้ๅบๅ
### 2. ๐ฏ ไปทๆ ผ่กไธบๅๆ
#### ๅ
ณ้ฎไปทๆ ผๆ้
- **๐ฏ POC้่ฟ**: ไปทๆ ผๆฅ่ฟๆงๅถ็นๆถๆพ็คบๆฉ่ฒๅ็น
- **โก VAHๆต่ฏ**: ไปทๆ ผๆต่ฏไปทๅผๅบๅ้ซ็นๆถๆพ็คบ็บข่ฒไธ่ง
- **๐ฅ VALๆต่ฏ**: ไปทๆ ผๆต่ฏไปทๅผๅบๅไฝ็นๆถๆพ็คบ็ปฟ่ฒไธ่ง
#### ๆไบค้็ช็ ดไฟกๅท
- **๐ ็ช็ ด็กฎ่ฎค**: ๆไบค้ๅผๅธธๆพๅคงๆถK็บฟ่พนๆก้ซไบฎ
- **้ข่ฒๅซไน**:
- ๐ข **็ปฟ่ฒ่พนๆก** = ไธๆถจ็ช็ ด
- ๐ด **็บข่ฒ่พนๆก** = ไธ่ท็ช็ ด
#### ๆฏๆ้ปๅ่ฝฌๆข
- **๐ ้ปๅ่ฝฌๆฏๆ**: ็ช็ ดVAHๅๆพ็คบ่่ฒ่็บฟ
- **๐ ๆฏๆ่ฝฌ้ปๅ**: ่ท็ ดVALๅๆพ็คบ็ดซ่ฒ่็บฟ
### 3. ๐ ๆไบค้็ดๆนๅพ
- **๐ ็ปฟ่ฒๆฑ็ถ**: ไธๆถจK็บฟ็ๆไบค้
- **๐ ็บข่ฒๆฑ็ถ**: ไธ่ทK็บฟ็ๆไบค้
- **๐ ้ป่ฒ็บฟๆก**: ๆไบค้็งปๅจๅนณๅ็บฟ
- **๐ ็ฟป่ฝฌๆนๅ**: ๅฏ้ๆฉๅไธๆๅไธๆพ็คบ
- **๐ ไฝ็ฝฎๆงๅถ**: ๅฏๆพ็ฝฎๅจK็บฟๅพไธๆนๆไธๆน
---
## โ๏ธ ๅๆฐ่ฎพ็ฝฎๆๅ
### ๐ ๆไบค้ไธๆ
็ปชๅๅธ
| ๅๆฐ | ่ฏดๆ | ๆจ่่ฎพ็ฝฎ |
|------|------|----------|
| **ๆไบค้ๅๅธ** | ๅฏ็จ/็ฆ็จไธป่ฆๅ่ฝ | โ
ๅผๅฏ |
| **ๆ
็ปชๅๅธ** | ๆพ็คบไนฐๅๆ
็ปชๅฏนๆฏ | โ
ๅผๅฏ |
| **ไพ้ๅบๅ** | ๆพ็คบไพ้ๅคฑ่กกๅบๅ | โ
ๅผๅฏ |
| **ไปทๅผๅบๅ (%)** | ๆไบค้้ไธญๅบฆ | 68% (้ป่ฎค) |
| **ๅๅธ่กๆฐ** | ไปทๆ ผ็ฒพๅบฆ | 100่ก |
| **ๅๅธๅฎฝๅบฆ** | ๆพ็คบๅฎฝๅบฆ | 31% |
| **ๅ็้ฟๅบฆ** | ๅๆK็บฟๆฐ้ | 360ๆ น |
### ๐ฏ ไปทๆ ผ่กไธบๅๆ
| ๅๆฐ | ่ฏดๆ | ๅปบ่ฎฎ่ฎพ็ฝฎ |
|------|------|----------|
| **ๅ
ณ้ฎไปทๆ ผๆ้** | POC/VAH/VALๆ้ | โ
ๅผๅฏ |
| **POCๆๆๅบฆ** | POCๆ้ๆๆๅบฆ | 0.2% |
| **VAH/VALๆๆๅบฆ** | ่พน็ๆต่ฏๆๆๅบฆ | 0.3% |
| **ๆไบค้็ช็ ดไฟกๅท** | ๅคงๆไบค้ๆ้ | โ
ๅผๅฏ |
| **ๆไบค้็ช็ ดๅๆฐ** | ็ช็ ดๅคๅฎๅๆฐ | 1.5ๅ |
| **ๆฏๆ้ปๅ่ฝฌๆข** | S/R่ฝฌๆข็บฟๆก | โ
ๅผๅฏ |
| **ๆพ็คบ้ฃๆ ผ** | ่ง่งๅผบๅบฆ | ๆ ๅ |
### ๐ ๆไบค้็ดๆนๅพ
| ๅๆฐ | ่ฏดๆ | ๅปบ่ฎฎ |
|------|------|------|
| **ๆไบค้็ดๆนๅพ** | ๅฏ็จ็ดๆนๅพ | โ
ๅผๅฏ |
| **ๆไบค้MA** | ็งปๅจๅนณๅ็บฟ | โ
ๅผๅฏ๏ผ21ๅจๆ |
| **ไฝ็ฝฎ** | ๆพ็คบไฝ็ฝฎ | ้กถ้จ |
| **็ฟป่ฝฌๆนๅ** | ๆนๅๆงๅถ | โ ๅ
ณ้ญ |
| **้ซๅบฆ** | ๆพ็คบ้ซๅบฆ | ้ป่ฎค |
| **ๅ็ดๅ็งป** | ไฝ็ฝฎๅพฎ่ฐ | 1 |
---
## ๐ ๅฎๆไบคๆ็ญ็ฅ
### ๐ฏ ็ญ็ฅไธ๏ผPOCๅๅฝไบคๆ
**่ฎพ็ฝฎ่ฆๆฑ**:
- โ
ๅผๅฏไปทๆ ผ่กไธบๅๆ
- ๐ฏ POCๆๆๅบฆ: 0.2%
- ๐ ๆไบค้็ช็ ด: 1.5ๅ
**ไบคๆไฟกๅท**:
1. **๐ฏ ๆฉ่ฒๅ็นๅบ็ฐ** โ ไปทๆ ผๆฅ่ฟPOC
2. **๐ ๆไบค้็กฎ่ฎค** โ ็ญๅพ
ๆไบค้ๆพๅคง
3. **๐ ็ช็ ดไฟกๅท** โ K็บฟ่พนๆก้ซไบฎๆถๅ
ฅๅบ
**้ฃ้ฉ็ฎก็**:
- ๆญขๆ๏ผVAH/VAL่พน็
- ๆญข็๏ผๅฏนไพงไปทๅผๅบๅ่พน็
### ๐ ็ญ็ฅไบ๏ผๆฏๆ้ปๅ่ฝฌๆข
**่ฎพ็ฝฎ่ฆๆฑ**:
- โ
ๅผๅฏๆฏๆ้ปๅ่ฝฌๆข
- ๐ ็บฟๆก้ฟๅบฆ: 5-10ๆ นK็บฟ
- โก VAH/VALๆๆๅบฆ: 0.3%
**ไบคๆไฟกๅท**:
1. **๐ต ่่ฒ่็บฟ** โ ้ปๅ่ฝฌๆฏๆ๏ผ็ๆถจ
2. **๐ฃ ็ดซ่ฒ่็บฟ** โ ๆฏๆ่ฝฌ้ปๅ๏ผ็่ท
3. **๐ ๆไบค้็กฎ่ฎค** โ ้
ๅๅคงๆไบค้
**้็จๅธๅบ**:
- ่ถๅฟ่กๆ
- ็ช็ ด่กๆ
- ๅบ้ด้่กๆซๆ
### ๐ ็ญ็ฅไธ๏ผไปทๅผๅบๅไบคๆ
**่ฎพ็ฝฎ่ฆๆฑ**:
- ๐ ไปทๅผๅบๅ: 68%
- ๐ ๅๅธ็ป่ฎก: ๅผๅฏ
- ๐จ ๆพ็คบ้ฃๆ ผ: ๆ ๅ
**ไบคๆ้ป่พ**:
1. **ไปทๅผๅบๅๅ
** โ ๅบ้ดไบคๆ็ญ็ฅ
2. **ไปทๅผๅบๅไธๆน** โ ๅผบๅฟ่ฟฝๅค
3. **ไปทๅผๅบๅไธๆน** โ ๅผฑๅฟๅ็ฉบ
4. **VAH/VALๆต่ฏ** โ ๅๅผน/ๅ่ฐๆบไผ
---
## ๐จ ๆพ็คบ้ฃๆ ผ้ๆฉ
### ๐ ็ฎ็บฆ้ฃๆ ผ
- **้็จ**: ็ป้ชไธฐๅฏ็ไบคๆ่
- **็น็น**: ๆ็คบ้ๅธธไฝ่ฐ๏ผไธๅฝฑๅๅพ่กจ้
่ฏป
- **ๆจ่**: ไธไธไบคๆๅ
### ๐ ๆ ๅ้ฃๆ ผ
- **้็จ**: ๅคงๅคๆฐไบคๆ่
- **็น็น**: ๅนณ่กก็่ง่งๆๆ๏ผไฟกๆฏๆธ
ๆฐ
- **ๆจ่**: ๆฅๅธธไบคๆไฝฟ็จ
### ๐ฏ ้็ฎ้ฃๆ ผ
- **้็จ**: ๅญฆไน ้ถๆฎต็ไบคๆ่
- **็น็น**: ไฟกๅทๆๆพ๏ผๅฎนๆ่ฏๅซ
- **ๆจ่**: ๆฐๆไบคๆ่
---
## ๐จ ่ญฆๆฅ่ฎพ็ฝฎ
### ่ชๅจ่ญฆๆฅๅ่ฝ
- **๐ฏ POC็ฉฟ่ถ่ญฆๆฅ**: ไปทๆ ผ็ช็ ดๆงๅถ็น
- **๐ VAH็ช็ ด่ญฆๆฅ**: ไปทๆ ผ็ช็ ดไปทๅผๅบๅ้ซ็น
- **๐ VAL็ช็ ด่ญฆๆฅ**: ไปทๆ ผ่ท็ ดไปทๅผๅบๅไฝ็น
- **๐ ้ซๆไบค้่ญฆๆฅ**: ๆฃๆตๅฐๅผๅธธๆไบค้
- **๐ ๆไบค้็ช็ ด่ญฆๆฅ**: ็กฎ่ฎค็ช็ ดไฟกๅท
### ่ญฆๆฅ่ฎพ็ฝฎๅปบ่ฎฎ
1. ๅฏ็จ**POC็ฉฟ่ถ่ญฆๆฅ**็จไบๅ
ณ้ฎ็นไฝๆ้
2. ๅฏ็จ**ๆไบค้็ช็ ด่ญฆๆฅ**็จไบๅ
ฅๅบ็กฎ่ฎค
3. ๆ นๆฎไบคๆ้ฃๆ ผ้ๆฉๆงๅฏ็จๅ
ถไป่ญฆๆฅ
---
## ๐ ็ป่ฎกไฟกๆฏ่งฃ่ฏป
### ๅณไธ่ง็ป่ฎก่กจๆ ผ
| ้กน็ฎ | ๅซไน | ็จ้ |
|------|------|------|
| **ๆงๅถ็น** | ๆไบค้ๆๅคง็ไปทๆ ผ | ๅ
ณ้ฎๆฏๆ/้ปๅไฝ |
| **ไปทๅผๅบๅ้ซ็น/ไฝ็น** | 68%ๆไบค้่พน็ | ๆญฃๅธธๆณขๅจ่ๅด |
| **ๆปๆไบค้** | ๅๆๆ้ดๆปๆไบค้ | ๅธๅบๆดป่ทๅบฆ |
| **ๅนณๅๆไบค้/K็บฟ** | ๅนณๅK็บฟๆไบค้ | ๆไบค้ๅบๅ |
| **ไปทๆ ผ่กไธบ** | ๅฝๅๅธๅบ็ถๆ | ๅฎๆถๅๆ็ปๆ |
### ไปทๆ ผ่กไธบ็ถๆ่ฏดๆ
| ็ถๆ | ๅซไน | ๆไฝๅปบ่ฎฎ |
|------|------|----------|
| **๐็ช็ ด** | ๆไบค้็ช็ ดไธญ | ่่่ฟฝๆถจ/่ฟฝ่ท |
| **๐ฏPOC** | ๆฅ่ฟๆงๅถ็น | ๅ
ณๆณจๅ่ฝฌๆบไผ |
| **โกVAH** | ๆต่ฏไปทๅผๅบๅ้ซ็น | ่งๅฏ็ช็ ด/ๅ่ฝ |
| **๐ฅVAL** | ๆต่ฏไปทๅผๅบๅไฝ็น | ่งๅฏๅๅผน/็ ดไฝ |
| **โไธๆน** | ไปทๅผๅบๅไธๆน | ๅผบๅฟๅธๅบ |
| **โไธๆน** | ไปทๅผๅบๅไธๆน | ๅผฑๅฟๅธๅบ |
| **๐ๅบๅๅ
** | ไปทๅผๅบๅๅ
| ๅบ้ด้่ก |
---
## ๐ก ไฝฟ็จๆๅทง
### โ
ๆไฝณๅฎ่ทต
1. **๐ ๅคๆถ้ดๆกๆถๅๆ**:
- ้ซๆถ้ดๆกๆถ็กฎๅฎ่ถๅฟ
- ไฝๆถ้ดๆกๆถๅฏปๆพๅ
ฅๅบ็น
2. **๐ฏ ๅ
ณ้ฎๆฐดๅนณ็กฎ่ฎค**:
- POCไฝไธบไธป่ฆๆฏๆ/้ปๅ
- VAH/VALไฝไธบๆฌก่ฆๅ
ณ้ฎไฝ
3. **๐ ๆไบค้็กฎ่ฎค**:
- ็ช็ ดๅฟ
้กป้
ๅๆไบค้ๆพๅคง
- ไฝๆไบค้็ช็ ด่ฐจๆ
ๅฏนๅพ
4. **๐ ๅจๆ่ฐๆด**:
- ๆ นๆฎๅธๅบ็ฏๅข่ฐๆดๆๆๅบฆ
- ่ถๅฟๅธๅบ้ไฝๆๆๅบฆ
- ้่กๅธๅบๆ้ซๆๆๅบฆ
### โ ๅธธ่ง่ฏฏๅบ
1. **่ฟๅบฆไพ่ตๅไธไฟกๅท**: ้่ฆๅค้็กฎ่ฎค
2. **ๅฟฝ็ฅๅคง่ถๅฟ**: VPๅๆ่ฆ็ปๅ่ถๅฟๆนๅ
3. **้ข็น่ฐๆดๅๆฐ**: ไฟๆๅๆฐ็จณๅฎๆง
4. **ๅฟฝ็ฅ้ฃ้ฉ็ฎก็**: ่ฎพ็ฝฎๅ็ๆญขๆ
---
## ๐ง ๆ
้ๆ้ค
### ๅธธ่ง้ฎ้ข
**Q: ไปทๆ ผ่กไธบๆ็คบไธๆพ็คบ๏ผ**
A: ๆฃๆฅไปฅไธ่ฎพ็ฝฎ๏ผ
- โ
็กฎ่ฎค"ๅฏ็จไปทๆ ผ่กไธบๅๆ"ๅทฒๅผๅฏ
- ๐จ ่ฐๆด"ๆพ็คบ้ฃๆ ผ"ไธบ"้็ฎ"
- ๐ ้ไฝๆๆๅบฆ่ฎพ็ฝฎ
**Q: ๆไบค้ๅๅธๆพ็คบไธๅฎๆด๏ผ**
A: ่ฐๆดไปฅไธๅๆฐ๏ผ
- ๐ ๅขๅ "ๅ็้ฟๅบฆ"
- ๐ ่ฐๆด"ๅๅธ่กๆฐ"
- ๐ ๆฃๆฅๆฐๆฎๆบ
**Q: ่ญฆๆฅ่ฟไบ้ข็น๏ผ**
A: ไผๅ่ญฆๆฅ่ฎพ็ฝฎ๏ผ
- ๐ฏ ๆ้ซๆๆๅบฆ้ๅผ
- ๐ ๅขๅ ๆไบค้็ช็ ดๅๆฐ
- โฐ ้ๆฉๅ
ณ้ฎ่ญฆๆฅ็ฑปๅ
---
## ๐ ๆๆฏๆฏๆ
ๅฆๆๅ
ถไป้ฎ้ข๏ผ่ฏทๅ่TradingViewๅธฎๅฉๆๆกฃๆ่็ณปๆๆฏๆฏๆๅข้ใ
---
*๐ก ๆ็คบ๏ผ่ฏฅๆๆ ๆ้ๅ็จไบ่ก็ฅจใๅคๆฑใๅ ๅฏ่ดงๅธ็ญๅ
ทๆๅ
่ถณๆไบค้็ๅธๅบใๅปบ่ฎฎๅจไฝฟ็จๅๅ
ๅจๆจกๆ็ฏๅขไธญ็ๆๅ้กนๅ่ฝใ*
# Volume Profile & Price Action Analysis Indicator
## Overview
This is a comprehensive **Volume Profile (VP)** indicator with advanced **Price Action Analysis** features, designed for professional trading on TradingView. It combines traditional volume profile analysis with sophisticated price behavior detection to provide traders with deeper market insights.
## ๐ฏ Key Features
### ๐ Volume Profile Analysis
- **Volume Distribution**: Visual representation of trading activity at different price levels
- **Point of Control (POC)**: Identifies the price level with highest volume
- **Value Area**: Highlights the price range containing 68% (customizable) of total volume
- **Sentiment Profile**: Shows bullish vs bearish sentiment at each price level
- **Supply & Demand Zones**: Identifies low-volume areas indicating potential breakout zones
### ๐ฏ Advanced Price Action Analysis
- **Key Price Level Alerts**: Smart detection when price approaches critical levels
- **Volume Breakout Signals**: Identifies significant volume spikes with visual confirmation
- **Support/Resistance Conversion**: Tracks when key levels flip their role
- **Real-time Price Behavior Status**: Live updates in statistics table
### ๐ Volume Histogram
- **Enhanced Volume Bars**: Visual volume representation with customizable placement
- **Volume Moving Average**: Overlay MA on volume for trend analysis
- **Flip Direction**: Option to invert histogram direction
- **Adjustable Height & Offset**: Full customization of visual appearance
## ๐ ๏ธ Configuration Guide
### Volume Profile Settings
| Parameter | Description | Default | Range |
|-----------|-------------|---------|--------|
| **Volume Profile** | Enable/disable main volume profile | โ Enabled | - |
| **Up Volume Color** | Color for bullish volume bars | Gray-Blue | Custom |
| **Down Volume Color** | Color for bearish volume bars | Gray | Custom |
| **Value Area %** | Percentage of volume for value area | 68% | 0-100% |
| **Profile Rows** | Resolution of volume profile | 100 | 10-150 |
| **Profile Width** | Width of volume profile bars | 31% | 0-250% |
### Price Action Analysis Settings
| Parameter | Description | Default | Range |
|-----------|-------------|---------|--------|
| **Enable Price Action** | Master switch for price analysis | โ Enabled | - |
| **Key Price Alerts** | POC/VAH/VAL proximity detection | โ Enabled | - |
| **POC Sensitivity** | Distance threshold for POC alerts | 0.2% | 0.1-1.0% |
| **VAH/VAL Sensitivity** | Distance threshold for value area alerts | 0.3% | 0.1-1.0% |
| **Volume Breakout Signals** | Large volume detection | โ Enabled | - |
| **Volume Threshold** | Multiplier for breakout detection | 1.5x | 1.2-3.0x |
| **Display Style** | Visual intensity of signals | Standard | Simple/Standard/Bold |
### Volume Histogram Settings
| Parameter | Description | Default | Range |
|-----------|-------------|---------|--------|
| **Volume Histogram** | Enable volume bars | โ Enabled | - |
| **Placement** | Position relative to price | Top | Top/Bottom |
| **Flip Direction** | Invert histogram direction | โ Disabled | - |
| **Height** | Size of volume bars | 8/10 | 1-10 |
| **Vertical Offset** | Position adjustment | 1 | -20 to 20 |
## ๐ How to Use
### 1. Basic Setup
1. Add the indicator to your chart
2. Adjust the **Lookback Length** (default: 360 bars) for your analysis period
3. Set **Profile Placement** (Right or Left side)
4. Configure colors to match your chart theme
### 2. Volume Profile Analysis
- **High Volume Areas** (thick bars) = Consolidation/Value zones
- **Low Volume Areas** (thin bars) = Potential breakout zones
- **POC Line** (red) = Strongest support/resistance level
- **Value Area** (highlighted) = Fair value trading range
### 3. Price Action Signals
#### Visual Indicators
- **๐ก Small Dots** = Price near POC (potential reversal zone)
- **๐บ Red Triangle** = Price testing Value Area High
- **๐ป Green Triangle** = Price testing Value Area Low
- **๐ Highlighted Candles** = Volume breakout confirmation
- **--- Dashed Lines** = Support/Resistance conversion
#### Statistics Table
Monitor real-time price behavior status:
- **๐ Breakout** = Volume surge detected
- **๐ฏ POC** = Price near Point of Control
- **โก VAH** = Testing Value Area High
- **๐ฅ VAL** = Testing Value Area Low
- **โ Above** = Price above value area
- **โ Below** = Price below value area
### 4. Trading Applications
#### Entry Signals
- **Volume Breakout** + **POC Touch** = High probability setup
- **VAH/VAL Test** + **Volume Confirmation** = Reversal opportunity
- **Supply/Demand Zone** + **Price Action** = Breakout trade
#### Risk Management
- Use **Value Area** boundaries as dynamic support/resistance
- **POC** often acts as strong magnetic level
- **Low Volume Zones** may indicate stop-loss placement areas
#### Trend Analysis
- **Price Above Value Area** = Bullish bias
- **Price Below Value Area** = Bearish bias
- **Price Within Value Area** = Consolidation/ranging market
## โ ๏ธ Important Notes
### Performance Optimization
- Indicator processes multiple timeframes automatically
- **Data Source** shown in stats table (1S/5S/1min/5min etc.)
- Adjust **Profile Rows** if performance issues occur
### Best Practices
1. **Combine with Price Action**: Don't rely solely on volume profile
2. **Adjust Sensitivity**: Fine-tune alert thresholds for your timeframe
3. **Monitor Statistics**: Keep an eye on the real-time status table
4. **Use Multiple Timeframes**: Confirm signals across timeframes
### Alerts Setup
The indicator includes built-in alerts for:
- POC crossovers
- Value Area High/Low breaks
- Volume spike detection
- Significant volume increases
## ๐จ Customization Tips
### Professional Look
- Set **Display Style** to "Simple" for clean charts
- Use **muted colors** for volume profile
- Enable **Value Area Background** for clear visualization
### Active Trading
- Set **Display Style** to "Bold" for clear signals
- Lower **sensitivity thresholds** for more frequent alerts
- Enable **Volume Histogram** for quick volume assessment
### Multi-Timeframe Analysis
- Use **Visible Range** for dynamic analysis
- Adjust **Lookback Length** based on your trading style
- Monitor **Data Source** to understand calculation basis
## ๐ Understanding the Output
### Volume Profile Interpretation
- **Wide profiles** = Consolidation periods
- **Narrow profiles** = Trending periods
- **Split profiles** = Double distribution (support/resistance)
### Price Action Signals
- **Cluster of signals** = High probability zone
- **Isolated signals** = Lower confidence
- **Signal + Volume** = Highest probability setups
---
**Disclaimer**: This indicator is for educational purposes. Always perform your own analysis and risk management before making trading decisions.
Open Interest Screener (Fixed Zones)๐ Purpose
This indicator scans Open Interest (OI) changes across selected exchanges and highlights significant spikes or drops directly on the chart using dynamic shaded zones.
It is designed to help traders detect unusual market positioning changes that may precede volatility events.
๐ง How It Works
1. Data Sources
Supports multiple exchanges: BitMEX USD, BitMEX USDT, Kraken USD (toggle on/off in settings).
Automatically adapts symbol prefix based on the chartโs base asset.
2. Spike / Drop Detection
OI % Change is calculated over a configurable lookback (Bars to look back).
Spike Up: OI increases by more than Threshold %.
Spike Down: OI decreases by more than Threshold %.
3. Dynamic Zones
When a spike occurs, a green zone (increase) or red zone (decrease) is drawn on the chart.
Zone height is dynamic, based on price high/low ยฑ 5%, preventing chart distortion.
Minimum spacing (Zone Spacing) prevents clustering.
๐ How to Use
Green Zones: Large OI increase can signal fresh positioning (possible breakout setups).
Red Zones: Large OI decrease can signal liquidation events or position unwinds.
Combine with price action, funding rates, or volatility measures for higher confidence.
Recommended Timeframes: Works best on 15m, 1h, 4h.
Markets: Crypto derivatives (OI data available).
โ๏ธ Inputs
Bars to Look Back
OI % Change Threshold
Zone Width
Exchange toggles (BitMEX USD/USDT, Kraken USD)
โ ๏ธ Disclaimer
This script is for educational purposes only and does not constitute financial advice.
Always test thoroughly before live trading.
HTF Trend Table + Recommendation AurumFxHTF Trend Table + Recommendation by AurumFx
This powerful multi-timeframe trend indicator provides a concise visual summary of market direction across key timeframes: 5m, 15m, 1H, 4H, and 1D. By analyzing each timeframe's position relative to the 50 EMA, the script classifies the trend as Bullish, Bearish, or Neutral. It then aggregates the trend signals and delivers a smart trading biasโprioritize LONGS, SHORTS, or stay NEUTRALโbased on trend alignment. Designed for traders who want a clear, quick, and data-driven directional edge.
Price-Volume Strength Meter (Color Zones)The Price-Volume Strength Meter is a custom-built tool designed to help traders assess market strength by analyzing both price action and volume behavior. It generates a smoothed strength signal and color-coded visualization for quick decision-making.
๐ Key Features:
โ
Dual Momentum Analysis โ Evaluates price and volume movements to identify strong or weak trends.
๐จ Color Zones โ
๐ข Green: Bullish strength
๐ด Red: Bearish strength
๐ก Yellow: Sideways or indecisive zone
๐ง Smoothed Output โ Uses internal smoothing to reduce noise and provide a cleaner trend view.
๐ Strength Range:
+100: Strong Bullish
+50: Weak Bullish
0: Neutral
-50: Weak Bearish
-100: Strong Bearish
This indicator can be used as a market strength confirmation tool for trend-following strategies or to filter out sideways/no-trade zones. Ideal for intraday to swing trading setups.
OptionLens for NSE IndicesOptionLens is a unique tool designed to give traders of NIFTY, BANKNIFTY, FINNIFTY, and MIDCPNIFTY real-time insights into market sentiment by analyzing live option premiums across multiple strike prices. Unlike traditional indicators, OptionLens draws on the collective effect of option pricing mechanicsโincluding the influence of Delta (directional conviction), Gamma (momentum of Delta), Theta (impact of time decay), Vega (volatility response), and Rho (interest rate sensitivity). By tracking how traders are bidding for Calls and Puts around the ATM strike, it estimates whether the broader market is leaning bullish or bearishโreflected as a 4-color histogram:
Dark Green bars signal strong bullish sentiment
Light Green bars reflect a developing bullish bias or price consolidation
Light Red bars suggest mild bearish undertones or price consolidation
Dark Red bars represent strong bearish momentum
OptionLens does not rely on volume or open interest but uses price action in the options market to offer a clean, visual snapshot of sentiment shifts. It includes built-in alerts for significant sentiment transitions, making it an ideal companion for intraday and swing traders seeking a deeper edge from the derivatives market.
First Round Break TrackerA simple indicator that tracks the first-time breakouts of round number levels (psychological levels) on any chart. Clean interface with minimal configuration needed
First Breakout Only : Marks each round level only once when broken for the first time
Customizable Step Size : Adjustable round number intervals (e.g., 100, 1000, 10000 etc.)
Clean Visual Alerts : Green labels with "FIRST:" prefix appear exactly at breakout moments
Real-time Info Panel : Shows current price, next target level, and total breakouts count
Cartelscope | Alchemical IntelSUMMARY
This unique tool looks beneath the surface of price, at a range of fundamental core catalyst metrics that tend to lead & influence price -- the price of most high cap crypto assets, most of the time.
Cartelcope offers a range of fundamental visualizations out-of-the-box, derived from first principles crypto metrics.
Like Stablecoin Supply, Coinbase Premium & Tether Dominance, as well as custom metrics that measure whale activity and macro sentiment.
Stack them vertically into a dashboard, for a top down view of some of the most relevant leading indicators. All normalized to each other.
TRADE SIGNALS
Cartelscope generates long & short signals, utilizing cumulative volume thresholds & horizontal oscillator thresholds.
Signals are designed for use with most (but certainly not all) high cap crypto assets. See the list of recommended assets at the end of these docs.
Most Cartelscope signals will make good trade entries (or exits), but no signals are perfect, and Cartelscope will never have a 100% hit rate.
ALERTS ENABLED
Cartelscope alerts are enabled out-of-the-box. With JSON automation available to Premium users.
SIGNAL CONFLUENCE
A confluence of signals from multiple metrics is a high probability trade setup.
Consider stacking & minimizing your leading indicators, for the clearest view of all signals.
Cartelscope's first two settings are important: SCOPE & LENS.
SCOPE is your data source:
What's being visualized.
LENS is your zoom:
Cumulative (zoomed out) for better long & short signals.
Realtime (zoomed in) for more precision data.
CUMULATIVE & REALTIME SIGNALS
Cumulative signals should be expected to out-perform realtime signals. They're higher timeframe, and higher conviction.
Realtime signals are shorter term. Their main use case is day to day momentum scalps, in the direction of HTF trend, with conservative targets.
Their other use case is market visualization, in a dashboard. Your focus should probably skew cumulative, but there's room for both.
SCOPES AT A GLANCE
The scopes tooltip is a helpful quickview of each use case -- expanded upon in much greater depth throughout the rest of these docs.
EXPLORING EACH SCOPE, AND THEIR USE CASES:
SMART EXCHANGE VOLUME
Volume & open interest from exchanges dominated by whales and smart money.
Divided by the opposite -- volume from 'dumb money' exchanges. Kim Chi Premium was made for that. No disrespect to our Korean friends.
Setting LENS set to cumulative reveals picture perfect buy signals, at every local low for the last 3 years.
Setting LENS to realtime offers shorter term trade signals.
The stronger the indicator print, the higher (or lower) it goes on its Y axis -- the stronger you should consider the signal.
FIAT LIQUIDITY RATIO
USDT / USD, a proxy for Tether entering (or exiting) centralized exchanges.
Expect price to follow Tether closely, in either direction.
COINBASE PREMIUM
Coinbase spot BTC premium (or discount) / BTCUSD Index
Frequent cumulative & realtime signals, for shorter term swing entries.
STABLECOIN SUPPLY
USDT + USDC market cap
Unlike Fiat Liquidity Ratio, which visualizes stablecoin inflow momentum, this metric measures market cap -- raw purchasing power across the marketplace. Which tends to reliably lead price.
In cumulative mode, signals are good, but we're less interested in them. For Stablecoin Supply, we're interested in oscillator momentum. Which reliably tends to lead price -- by days, sometimes by weeks.
In realtime mode, outsized changes to stablecoin supply tend to resolve in the direction of the change, later that same day or the next day.
BITFINEX BTC MARGIN LONGS / MARGIN SHORTS
Some call it Tether's 'man behind the curtain'. The ratio of BTC margin longs to shorts on Bitfinex plays an outsized role in day-to-day price action.
This metric paradoxically counter-trades the broader market in realtime mode, while revealing true market direction in cumulative mode.
The cumulative higher timeframe view:
In Realtime, on lower timeframes:
ESCOBAR EXPRESS
Cartelscope's most lethal weapon & highest hit rate scope.
Escobar signals are highly directionally accurate, within a 24-48 hour window. Cumulative signals should be considered dated after 48 hours.
Realtime signals are usually excellent.
TETHER DOMINANCE
USDT.D
Cumulative USDT.D generates extraordinary buy signals at key swing low pivots, like smart exchange volume.
Realtime USDT.D tends to generate well-timed lower timeframe long & short signals.
MACRO CREDIT SPREADS
This global macro metric generates some of our most reliable swing entries, in cumulative mode.
SIGNAL STRENGTH
HOW TO NAVIGATE MIXED SIGNALS
RECOMMENDED ASSETS
The author has tested all of the above signals on the following list of high cap crypto assets. Signals generally perform well on each of these assets.
Other assets may or may not perform as well with these signals. The lower the token's FDV, the less you should expect these signals to perform.
TIMEFRAMES FOR USE
For HTF big picture, use the 4H, 8H or 12H. To zoom in for day to day use, use the 1H or 15M.
SPREAD SYMBOL TRADEOFFS
Spread symbols in tradingview have limited history. Which means less backtesting data than we prefer. Most of our metrics print 2 years of history. Some print more.
Also, our scopes are 'pinned' to a timeframe -- so you see the same print, no matter what timeframe you like to use. That's a good thing. But it has the same tradeoffs -- limited history, less backtesting data.
Central Bank Divergence IndexCentral Bank Divergence Index (CBDiv) by CWRP blends foreign exchange (FX) market behavior and short-term interest rate (STIR) spreads to detect monetary policy divergence or convergence among major economies.
It calculates a composite Z-score index that tracks divergence between the US and other major economies using FX pairs USDJPY, EURUSD, GBPUSD, AUDUSD (With AUD acting as a proxy to the RMB) and short-term bond ETFs (SHY = U.S. 1โ3Y Treasury, EWJ = Japan, IEUR = Europe).
SHY/EWJ and SHY/IEUR: If SHY outperforms, it means US short-term rates are rising relative to Japan/Europe.
How to Read:
Highlighting
Yellow = Diverging central bank policy (US > others) ; Hawkish
Blue = Converging policy (US < others) ; Dovish/Lagging
Gray = Neutral
Table
FX Divergence:
Positive (> +1) -> USD is strengthening unusually fast -> Fed is likely tighter than others
Negative (< -1) -> USD is weakening -> Other central banks might be tightening relative to the Fed
Rate Spread Divergence (Which acts as a proxy for interest rate divergence):
Positive -> U.S. rates are rising faster than Japan/Europe
Negative -> Foreign short-term rates outperforming U.S.
Composite:
Positive (> +1) -> Strong U.S. policy divergence (hawkish Fed)
Negative (< -1) -> Converging or dovish Fed
Neutral (Between -1 and +1) -> Neutral policy stance
Thank you for using the Central Bank Divergence Index by CWRP!
I'm open to all critiques and discussion around macroeconomics and hope you find use in this model!
Cross-Asset Risk Appetite IndexCross-Asset Risk Appetite Index (RiskApp) by CWRP combines multiple asset classes into a single risk sentiment signal to help traders and investors detect when the market is in a risk-on or risk-off regime.
It calculates a composite Z-score index based on relative performance between:
SPY / IEF: Equities vs Bonds
HYG / LQD: High Yield vs Investment Grade Credit
CL / GC: Oil vs Gold
VIX / MOVE: Equity vs Bond Market Volatility (inverted)
Each component reflects capital flows toward riskier or safer assets, with dynamic weighting (Equity/Bond: 30%, Credit: 25%, Commodities: 25%, Volatility: 20%) and smoothing applied for a cleaner signal.
How to Read:
Highlighting
Yellow = Risk-On sentiment (market favors risk assets)
Orange = Risk-Off sentiment (flight to safety)
Black Background = Neutral design for emotional detachment
Table
Equity/Bond Z-Score:
Positive (> +1) --> Stocks outperforming bonds --> Risk-On
Negative (< -1) --> Bonds outperforming stocks --> Risk-Off
Credit Spread Z-Score (HYG/LQD):
Positive --> High yield outperforming --> Investors seeking yield
Negative --> Flight to quality --> Credit concerns
Oil/Gold Z-Score:
Positive --> Oil outperforming --> Economic optimism
Negative --> Gold outperforming --> Defensive positioning
Volatility Spread (VIX/MOVE):
Positive --> Equity vol falling relative to bond vol --> Risk stabilizing
Negative --> Equity vol rising --> Caution / Risk-Off
Composite Index:
> +1 --> Strong Risk Appetite
< -1 --> Strong Risk Aversion
Between -1 and +1 --> Neutral regime
Thank you for using the Cross-Asset Risk Appetite Index by CWRP!
I'm open to all critiques and discussion around macro-finance and hope this model adds clarity to your decision-making.
52SIGNAL RECIPE Coinbase Institutional Smart Money DetectorCoinbase Institutional Smart Money Detector
โ Overview
Coinbase Institutional Smart Money Detector is an innovative indicator that detects the buying and selling movements of institutional investors through Coinbase Prime in real-time. This powerful tool tracks the flow of funds from large institutions to provide valuable signals before significant market direction changes occur. It can be applied to Bitcoin charts on any exchange, allowing traders to follow the "smart money" movements of institutions anytime, anywhere.
The unique strength of this indicator lies in its comprehensive assessment of institutional investors' consecutive trading behaviors, volume patterns, and trend strength by analyzing Coinbase data in real-time. By providing clear visual representation of institutional fund flow data that is difficult for ordinary traders to access, you gain the opportunity to move alongside the big players in the market.
โโโโโโโโโโโโโโโโโโโโโโโโโโโโโโโโโโโโโ
โ Key Features
โข Coinbase Prime Data Analysis: Tracks institutional movements in real-time by analyzing data from Coinbase Prime, an institutional-only service
โข Real-time Institutional Fund Flow Monitoring: Immediately detects large institutions' spot buying/selling activities, allowing positioning ahead of the market
โข Universal Exchange Compatibility: Applicable to Bitcoin charts on any exchange, enabling use on your preferred trading platform
โข Institutional Continuity Analysis: Identifies continuous institutional activity by tracking consecutive buying/selling patterns
โข Smart Volume Analysis: Detects increased volume compared to averages and analyzes key trading time periods
โข Trend Strength Measurement: Quantifies and displays the strength of upward/downward trends by analyzing candle patterns
โข Intuitive Visualization: Clearly marks institutional activity points on charts through bar coloring and labels
โข Real-time Strength Display: Calculates and displays current trend strength in a table in real-time
โข Customizable Settings: Allows customization of key parameters to match your trading style
โโโโโโโโโโโโโโโโโโโโโโโโโโโโโโโโโโโโโ
โ Understanding Signal Types
โ Institutional Buy Signal
โข Definition: Occurs when institutional investors show consecutive buying activity through Coinbase Prime, accompanied by increased volume and strong upward trend
โข Visual Representation: Translucent blue bar coloring and "Institution Buying Detected!" label on the candle where the buy signal occurs
โข Market Interpretation: Indicates that institutional investors are actively buying spot Bitcoin, which is likely to lead to price increases
โข Signal Strength Factors:
โถ Consecutive price increase patterns
โถ Above-average volume
โถ Strong upward trend strength measurement
โถ Significant price movement
โ Institutional Sell Signal
โข Definition: Occurs when institutional investors show consecutive selling activity through Coinbase Prime, accompanied by increased volume and strong downward trend
โข Visual Representation: Translucent pink bar coloring and "Institution Selling Detected!" label on the candle where the sell signal occurs
โข Market Interpretation: Indicates that institutional investors are actively selling spot Bitcoin, which is likely to lead to price decreases
โข Signal Strength Factors:
โถ Consecutive price decrease patterns
โถ Above-average volume
โถ Strong downward trend strength measurement
โถ Significant price movement
โโโโโโโโโโโโโโโโโโโโโโโโโโโโโโโโโโโโโ
โ Understanding Trend Strength
โ Trend Strength Measurement Method
โข Definition: Measures trend strength by analyzing the ratio of up/down candles over a recent period
โข Visual Representation: Displayed in the table as "BULL STRENGTH" or "BEAR STRENGTH" with percentage value and "STRONG" or "WEAK" status
โข Strength Threshold: Strong/weak determination according to user-configurable threshold
โข Calculation Method:
โถ Upward trend strength = (Number of upward candles) / (Total analysis period)
โถ Downward trend strength = (Number of downward candles) / (Total analysis period)
โถ Displayed as "STRONG" when strength is above threshold, "WEAK" when below
โ Utilizing Trend Strength
โข Signal Filtering: Generates signals only when trend strength is strong, reducing false signals
โข Trend Confirmation: Evaluates the health and sustainability of the current market trend
โข Entry/Exit Decisions: Consider entering in strong trends and exiting when trends weaken
โข Risk Management: Develop strategies to reduce position size in weak trends and increase in strong trends
โโโโโโโโโโโโโโโโโโโโโโโโโโโโโโโโโโโโโ
โ Practical Trading Applications
โ Institutional Buy Signal Strategy
โข Trend Reversal Scenario:
โถ Setup: Strong institutional buy signal during a downtrend
โถ Entry: Buy after signal confirmation in the next candle
โถ Stop Loss: Below the low of the signal candle
โถ Take Profit: When reaching previous major resistance or when trend strength weakens
โข Trend Continuation Scenario:
โถ Setup: Institutional buy signal after correction in an uptrend
โถ Entry: Buy after signal confirmation
โถ Stop Loss: Below recent major low
โถ Take Profit: Gradually take profits considering trend strength
โ Institutional Sell Signal Strategy
โข Trend Reversal Scenario:
โถ Setup: Strong institutional sell signal during an uptrend
โถ Entry: Sell after signal confirmation in the next candle
โถ Stop Loss: Above the high of the signal candle
โถ Take Profit: When reaching previous major support or when trend strength weakens
โข Trend Continuation Scenario:
โถ Setup: Institutional sell signal after bounce in a downtrend
โถ Entry: Sell after signal confirmation
โถ Stop Loss: Above recent major high
โถ Take Profit: Gradually take profits considering trend strength
โ Multi-Timeframe Approach
โข Higher Timeframe Direction Confirmation:
โถ Check institutional signals and trend strength on daily/4-hour charts
โถ Use for setting main trading direction
โข Lower Timeframe Entry Point Finding:
โถ Wait for lower timeframe signals that align with higher timeframe direction
โถ Use for capturing precise entry points
โข Cross-Timeframe Signal Alignment:
โถ Signal strength increases when signals occur in the same direction across multiple timeframes
โถ Capture high-probability trading opportunities
โโโโโโโโโโโโโโโโโโโโโโโโโโโโโโโโโโโโโ
โ Indicator Settings Guide
โ Main Setting Parameters
โข Institutional Continuity Period:
โถ Purpose: Sets the period to check institutional consecutive buying/selling activity
โถ Lower value: Generates more signals, increases responsiveness
โถ Higher value: Reduces number of signals, increases reliability
โข Trend Strength Threshold:
โถ Purpose: Sets the minimum threshold for determining strong trends
โถ Lower value: More signals, less filtering
โถ Higher value: Generates signals only in stronger trends, higher filtering
โโโโโโโโโโโโโโโโโโโโโโโโโโโโโโโโโโโโโ
โ Synergy with Other Indicators
โข Support/Resistance Levels:
โถ Institutional signals occurring at key support/resistance levels have higher probability
โถ Combination of key technical analysis levels and institutional activity provides powerful signals
โข Moving Averages:
โถ Pay attention to institutional signals near key moving averages (50MA, 200MA)
โถ Strong trend change possibility when moving average crossovers coincide with institutional signals
โข RSI/Momentum Indicators:
โถ Institutional buy signals in oversold conditions increase reversal probability
โถ Institutional sell signals in overbought conditions increase reversal probability
โข Volume Profile:
โถ Institutional signals at high volume nodes confirm important price levels
โถ Institutional activity in key trading areas greatly impacts price direction
โข Market Structure:
โถ Institutional signals near key market structures (higher highs/lows, lower highs/lows) suggest structural changes
โถ Coincidence of market structure changes and institutional activity indicates important trend turning points
โโโโโโโโโโโโโโโโโโโโโโโโโโโโโโโโโโโโโ
โ Conclusion
Coinbase Institutional Smart Money Detector provides traders with valuable insights by tracking spot Bitcoin trading activities of institutional investors through Coinbase Prime in real-time. Because it can be applied to Bitcoin charts on any exchange, you can utilize it immediately on your preferred trading platform.
The core value of this indicator is providing intuitive visualization of institutional fund flow data that is difficult for ordinary traders to access. By comprehensively analyzing consecutive price movements, volume increases, and trend strength to capture institutional activity, you gain the opportunity to move alongside the big players in the market.
Clear buy/sell signals based on Coinbase Prime data and real-time trend strength measurements help traders quickly grasp market conditions and make strategic decisions. By integrating this powerful tool into your trading strategy, secure a competitive edge to understand where the market's smart money is flowing and position accordingly.
โโโโโโโโโโโโโโโโโโโโโโโโโโโโโโโโโโโโโ
โป Disclaimer: Like all trading tools, the Institutional Smart Money Detector should be used as a supplementary indicator and not relied upon exclusively for trading decisions. Past patterns of institutional behavior may not guarantee future market movements. Always employ appropriate risk management strategies in your trading.
Coinbase Institutional Smart Money Detector
โ ๊ฐ์
Coinbase Institutional Smart Money Detector๋ ์ฝ์ธ๋ฒ ์ด์ค ํ๋ผ์(Coinbase Prime)์ ํตํ ๊ธฐ๊ด ํฌ์์๋ค์ ํ๋ฌผ ๋นํธ์ฝ์ธ ๋งค์/๋งค๋ ์์ง์์ ์ค์๊ฐ์ผ๋ก ๊ฐ์งํ๋ ํ์ ์ ์ธ ์งํ์
๋๋ค. ์ด ๊ฐ๋ ฅํ ๋๊ตฌ๋ ๋ํ ๊ธฐ๊ด๋ค์ ์๊ธ ํ๋ฆ์ ์ถ์ ํ์ฌ ์ค์ํ ์์ฅ ๋ฐฉํฅ ์ ํ์ด ์ผ์ด๋๊ธฐ ์ ์ ๊ท์คํ ์ ํธ๋ฅผ ์ ๊ณตํฉ๋๋ค. ์ด๋ค ๊ฑฐ๋์์ ๋นํธ์ฝ์ธ ์ฐจํธ์๋ ์ ์ฉ ๊ฐ๋ฅํ์ฌ ํธ๋ ์ด๋๋ค์ด ์ธ์ ์ด๋์๋ ๊ธฐ๊ด์ "์ค๋งํธ ๋จธ๋" ์์ง์์ ๋ฐ๋ผ๊ฐ ์ ์๊ฒ ํด์ค๋๋ค.
์ด ์งํ์ ๋
๋ณด์ ์ธ ๊ฐ์ ์ ์ฝ์ธ๋ฒ ์ด์ค ๋ฐ์ดํฐ๋ฅผ ์ค์๊ฐ์ผ๋ก ๋ถ์ํ์ฌ ๊ธฐ๊ด ํฌ์์๋ค์ ์ฐ์์ ์ธ ๋งค๋งค ํ๋, ๊ฑฐ๋๋ ํจํด, ๊ทธ๋ฆฌ๊ณ ์ถ์ธ ๊ฐ๋๋ฅผ ์ข
ํฉ์ ์ผ๋ก ํ๊ฐํ๋ค๋ ์ ์
๋๋ค. ์ผ๋ฐ ํธ๋ ์ด๋๋ค์ด ์ ๊ทผํ๊ธฐ ์ด๋ ค์ด ๊ธฐ๊ด ์๊ธ ํ๋ฆ ๋ฐ์ดํฐ๋ฅผ ์๊ฐ์ ์ผ๋ก ๋ช
ํํ๊ฒ ์ ๊ณตํจ์ผ๋ก์จ, ์ฌ๋ฌ๋ถ์ ์์ฅ์ ํฐ ์๋ค๊ณผ ํจ๊ป ์์ง์ผ ์ ์๋ ๊ธฐํ๋ฅผ ์ป๊ฒ ๋ฉ๋๋ค.
โโโโโโโโโโโโโโโโโโโโโโโโโโโโโโโโโโโโโ
โ ์ฃผ์ ํน์ง
โข ์ฝ์ธ๋ฒ ์ด์ค ํ๋ผ์ ๋ฐ์ดํฐ ๋ถ์: ๊ธฐ๊ด ์ ์ฉ ์๋น์ค์ธ ์ฝ์ธ๋ฒ ์ด์ค ํ๋ผ์์ ๋ฐ์ดํฐ๋ฅผ ์ค์๊ฐ์ผ๋ก ์ถ์ ํ์ฌ ๊ธฐ๊ด์ ์์ง์ ํฌ์ฐฉ
โข ์ค์๊ฐ ๊ธฐ๊ด ์๊ธ ํ๋ฆ ๋ชจ๋ํฐ๋ง: ๋ํ ๊ธฐ๊ด๋ค์ ํ๋ฌผ ๋งค์/๋งค๋ ํ๋์ ์ฆ๊ฐ์ ์ผ๋ก ๊ฐ์งํ์ฌ ์์ฅ์ ์์ ํฌ์ง์
๋ ๊ฐ๋ฅ
โข ๋ชจ๋ ๊ฑฐ๋์ ํธํ์ฑ: ์ด๋ค ๊ฑฐ๋์์ ๋นํธ์ฝ์ธ ์ฐจํธ์๋ ์ ์ฉ ๊ฐ๋ฅํ์ฌ ์ ํธํ๋ ํธ๋ ์ด๋ฉ ํ๋ซํผ์์ ํ์ฉ ๊ฐ๋ฅ
โข ๊ธฐ๊ด ์ฐ์์ฑ ๋ถ์: ์ฐ์์ ์ธ ๋งค์/๋งค๋ ํจํด์ ์ถ์ ํ์ฌ ๊ธฐ๊ด์ ์ง์์ ์ธ ํ๋ ์๋ณ
โข ์ค๋งํธ ๋ณผ๋ฅจ ๋ถ์: ํ๊ท ๋๋น ๊ฑฐ๋๋ ์ฆ๊ฐ๋ฅผ ๊ฐ์งํ๊ณ ์ฃผ์ ๊ฑฐ๋ ์๊ฐ๋๋ฅผ ๋ถ์
โข ์ถ์ธ ๊ฐ๋ ์ธก์ : ์บ๋ค ํจํด์ ๋ถ์ํด ์์น/ํ๋ฝ ์ถ์ธ์ ๊ฐ๋๋ฅผ ์์นํํ์ฌ ํ์
โข ์ง๊ด์ ์๊ฐํ: ๋ฐ ์ปฌ๋ฌ๋ง๊ณผ ๋ผ๋ฒจ์ ํตํด ๊ธฐ๊ด ํ๋ ์ง์ ์ ์ฐจํธ์ ๋ช
ํํ๊ฒ ํ์
โข ์ค์๊ฐ ๊ฐ๋ ํ์: ํ์ฌ ์ถ์ธ์ ๊ฐ๋๋ฅผ ์ค์๊ฐ์ผ๋ก ๊ณ์ฐํ์ฌ ํ
์ด๋ธ์ ํ์
โข ์ฌ์ฉ์ ์ ์ ์ค์ : ์ฃผ์ ๋งค๊ฐ๋ณ์๋ฅผ ์กฐ์ ํ์ฌ ์์ ์ ํธ๋ ์ด๋ฉ ์คํ์ผ์ ๋ง๊ฒ ์ปค์คํฐ๋ง์ด์ง ๊ฐ๋ฅ
โโโโโโโโโโโโโโโโโโโโโโโโโโโโโโโโโโโโโ
โ ์ ํธ ์ ํ ์ดํดํ๊ธฐ
โ ๊ธฐ๊ด ๋งค์ ์ ํธ
โข ์ ์: ์ฝ์ธ๋ฒ ์ด์ค ํ๋ผ์์ ํตํด ๊ธฐ๊ด ํฌ์์๋ค์ด ์ฐ์์ ์ธ ๋งค์ ํ๋์ ๋ณด์ด๋ฉฐ, ์ด์ ํจ๊ป ๊ฑฐ๋๋ ์ฆ๊ฐ์ ๊ฐํ ์์น ์ถ์ธ๊ฐ ๋ํ๋ ๋ ๋ฐ์
โข ์๊ฐ์ ํํ: ๋งค์ ์ ํธ๊ฐ ๋ฐ์ํ ์บ๋ค์ ๋ฐํฌ๋ช
ํ๋์ ๋ฐ ์ปฌ๋ฌ๋ง๊ณผ ํจ๊ป "Institution Buying Detected!" ๋ผ๋ฒจ ํ์
โข ์์ฅ ํด์: ๊ธฐ๊ด ํฌ์์๋ค์ด ์ ๊ทน์ ์ผ๋ก ํ๋ฌผ ๋นํธ์ฝ์ธ์ ๋งค์ํ๊ณ ์์ผ๋ฉฐ, ์ด๋ ๊ณง ๊ฐ๊ฒฉ ์์น์ผ๋ก ์ด์ด์ง ๊ฐ๋ฅ์ฑ์ด ๋์์ ์๋ฏธ
โข ์ ํธ ๊ฐ๋ ์์:
โถ ์ฐ์์ ์ธ ๊ฐ๊ฒฉ ์์น ํจํด
โถ ํ๊ท ๋ณด๋ค ๋์ ๊ฑฐ๋๋
โถ ๊ฐํ ์์น ์ถ์ธ ๊ฐ๋ ์ธก์ ๊ฐ
โถ ์ ์๋ฏธํ ๊ฐ๊ฒฉ ๋ณ๋
โ ๊ธฐ๊ด ๋งค๋ ์ ํธ
โข ์ ์: ์ฝ์ธ๋ฒ ์ด์ค ํ๋ผ์์ ํตํด ๊ธฐ๊ด ํฌ์์๋ค์ด ์ฐ์์ ์ธ ๋งค๋ ํ๋์ ๋ณด์ด๋ฉฐ, ์ด์ ํจ๊ป ๊ฑฐ๋๋ ์ฆ๊ฐ์ ๊ฐํ ํ๋ฝ ์ถ์ธ๊ฐ ๋ํ๋ ๋ ๋ฐ์
โข ์๊ฐ์ ํํ: ๋งค๋ ์ ํธ๊ฐ ๋ฐ์ํ ์บ๋ค์ ๋ฐํฌ๋ช
๋ถํ์ ๋ฐ ์ปฌ๋ฌ๋ง๊ณผ ํจ๊ป "Institution Selling Detected!" ๋ผ๋ฒจ ํ์
โข ์์ฅ ํด์: ๊ธฐ๊ด ํฌ์์๋ค์ด ์ ๊ทน์ ์ผ๋ก ํ๋ฌผ ๋นํธ์ฝ์ธ์ ๋งค๋ํ๊ณ ์์ผ๋ฉฐ, ์ด๋ ๊ณง ๊ฐ๊ฒฉ ํ๋ฝ์ผ๋ก ์ด์ด์ง ๊ฐ๋ฅ์ฑ์ด ๋์์ ์๋ฏธ
โข ์ ํธ ๊ฐ๋ ์์:
โถ ์ฐ์์ ์ธ ๊ฐ๊ฒฉ ํ๋ฝ ํจํด
โถ ํ๊ท ๋ณด๋ค ๋์ ๊ฑฐ๋๋
โถ ๊ฐํ ํ๋ฝ ์ถ์ธ ๊ฐ๋ ์ธก์ ๊ฐ
โถ ์ ์๋ฏธํ ๊ฐ๊ฒฉ ๋ณ๋
โโโโโโโโโโโโโโโโโโโโโโโโโโโโโโโโโโโโโ
โ ์ถ์ธ ๊ฐ๋ ์ดํดํ๊ธฐ
โ ์ถ์ธ ๊ฐ๋ ์ธก์ ๋ฐฉ์
โข ์ ์: ์ต๊ทผ ์ผ์ ๊ธฐ๊ฐ ๋์์ ์์น/ํ๋ฝ ์บ๋ค ๋น์จ์ ๋ถ์ํ์ฌ ์ถ์ธ์ ๊ฐ๋๋ฅผ ์ธก์
โข ์๊ฐ์ ํํ: ํ
์ด๋ธ์ "BULL STRENGTH" ๋๋ "BEAR STRENGTH"๋ก ํ์๋๋ฉฐ, ๋ฐฑ๋ถ์จ ๊ฐ๊ณผ ํจ๊ป "STRONG" ๋๋ "WEAK" ์ํ ํ์
โข ๊ฐ๋ ์๊ณ๊ฐ: ์ฌ์ฉ์๊ฐ ์ค์ ๊ฐ๋ฅํ ์๊ณ๊ฐ์ ๋ฐ๋ผ ๊ฐํจ/์ฝํจ ํ์
โข ๊ณ์ฐ ๋ฐฉ์:
โถ ์์น ์ถ์ธ ๊ฐ๋ = (์์น ์บ๋ค ์) / (์ ์ฒด ๋ถ์ ๊ธฐ๊ฐ)
โถ ํ๋ฝ ์ถ์ธ ๊ฐ๋ = (ํ๋ฝ ์บ๋ค ์) / (์ ์ฒด ๋ถ์ ๊ธฐ๊ฐ)
โถ ๊ฐ๋๊ฐ ์๊ณ๊ฐ ์ด์์ผ ๋ "STRONG", ๋ฏธ๋ง์ผ ๋ "WEAK"๋ก ํ์
โ ์ถ์ธ ๊ฐ๋์ ํ์ฉ
โข ์ ํธ ํํฐ๋ง: ์ถ์ธ ๊ฐ๋๊ฐ ๊ฐํ ๋๋ง ์ ํธ๋ฅผ ์์ฑํ์ฌ ํ์ ์ ํธ ๊ฐ์
โข ์ถ์ธ ํ์ธ: ํ์ฌ ์์ฅ ์ถ์ธ์ ๊ฑด์ ์ฑ๊ณผ ์ง์ ๊ฐ๋ฅ์ฑ ํ๊ฐ
โข ์ง์
/ํด์ถ ๊ฒฐ์ : ๊ฐํ ์ถ์ธ์์ ์ง์
ํ๊ณ ์ฝํ ์ถ์ธ๋ก ์ ํ๋ ๋ ํด์ถ ๊ณ ๋ ค
โข ๋ฆฌ์คํฌ ๊ด๋ฆฌ: ์ฝํ ์ถ์ธ์์๋ ํฌ์ง์
ํฌ๊ธฐ๋ฅผ ์ค์ด๊ณ , ๊ฐํ ์ถ์ธ์์๋ ๋๋ฆฌ๋ ์ ๋ต ์๋ฆฝ ๊ฐ๋ฅ
โโโโโโโโโโโโโโโโโโโโโโโโโโโโโโโโโโโโโ
โ ์ค์ ํธ๋ ์ด๋ฉ ์์ฉ
โ ๊ธฐ๊ด ๋งค์ ์ ํธ ํ์ฉ ์ ๋ต
โข ์ถ์ธ ์ ํ ์๋๋ฆฌ์ค:
โถ ์ค์ : ํ๋ฝ ์ถ์ธ ์ค ๊ฐํ ๊ธฐ๊ด ๋งค์ ์ ํธ ๋ฐ์
โถ ์ง์
: ์ ํธ ํ์ธ ํ ๋ค์ ์บ๋ค์์ ๋งค์
โถ ์์ : ์ ํธ ์บ๋ค์ ์ ์ ์๋
โถ ์ด์ต์คํ: ์ด์ ์ฃผ์ ์ ํญ์ ๋๋ฌ ์ ๋๋ ์ถ์ธ ๊ฐ๋๊ฐ ์ฝํด์ง ๋
โข ์ถ์ธ ์ง์ ์๋๋ฆฌ์ค:
โถ ์ค์ : ์์น ์ถ์ธ ์ค ์กฐ์ ํ ๊ธฐ๊ด ๋งค์ ์ ํธ ๋ฐ์
โถ ์ง์
: ์ ํธ ํ์ธ ํ ๋งค์
โถ ์์ : ์ต๊ทผ ์ฃผ์ ์ ์ ์๋
โถ ์ด์ต์คํ: ์ถ์ธ ๊ฐ๋๋ฅผ ๊ณ ๋ คํ์ฌ ๋จ๊ณ์ ์ผ๋ก ์ด์ต์คํ
โ ๊ธฐ๊ด ๋งค๋ ์ ํธ ํ์ฉ ์ ๋ต
โข ์ถ์ธ ์ ํ ์๋๋ฆฌ์ค:
โถ ์ค์ : ์์น ์ถ์ธ ์ค ๊ฐํ ๊ธฐ๊ด ๋งค๋ ์ ํธ ๋ฐ์
โถ ์ง์
: ์ ํธ ํ์ธ ํ ๋ค์ ์บ๋ค์์ ๋งค๋
โถ ์์ : ์ ํธ ์บ๋ค์ ๊ณ ์ ์
โถ ์ด์ต์คํ: ์ด์ ์ฃผ์ ์ง์ง์ ๋๋ฌ ์ ๋๋ ์ถ์ธ ๊ฐ๋๊ฐ ์ฝํด์ง ๋
โข ์ถ์ธ ์ง์ ์๋๋ฆฌ์ค:
โถ ์ค์ : ํ๋ฝ ์ถ์ธ ์ค ๋ฐ๋ฑ ํ ๊ธฐ๊ด ๋งค๋ ์ ํธ ๋ฐ์
โถ ์ง์
: ์ ํธ ํ์ธ ํ ๋งค๋
โถ ์์ : ์ต๊ทผ ์ฃผ์ ๊ณ ์ ์
โถ ์ด์ต์คํ: ์ถ์ธ ๊ฐ๋๋ฅผ ๊ณ ๋ คํ์ฌ ๋จ๊ณ์ ์ผ๋ก ์ด์ต์คํ
โ ๋ค์ค ์๊ฐํ๋ ์ ์ ๊ทผ๋ฒ
โข ์์ ์๊ฐํ๋ ์ ๋ฐฉํฅ์ฑ ํ์ธ:
โถ ์ผ๋ด/4์๊ฐ๋ด์์ ๊ธฐ๊ด ์ ํธ ๋ฐ ์ถ์ธ ๊ฐ๋ ํ์ธ
โถ ์ฃผ ํธ๋ ์ด๋ฉ ๋ฐฉํฅ ์ค์ ์ ํ์ฉ
โข ํ์ ์๊ฐํ๋ ์ ์ง์
์ ์ฐพ๊ธฐ:
โถ ์์ ์๊ฐํ๋ ์ ๋ฐฉํฅ๊ณผ ์ผ์นํ๋ ํ์ ์๊ฐํ๋ ์ ์ ํธ ๋๊ธฐ
โถ ์ ๋ฐํ ์ง์
์ ํฌ์ฐฉ์ ํ์ฉ
โข ์๊ฐํ๋ ์ ๊ฐ ์ ํธ ์ผ์น ํ์ธ:
โถ ์ฌ๋ฌ ์๊ฐํ๋ ์์์ ๋์ผํ ๋ฐฉํฅ์ ์ ํธ๊ฐ ๋ฐ์ํ ๋ ์ ํธ ๊ฐ๋ ์ฆ๊ฐ
โถ ๋์ ํ๋ฅ ์ ํธ๋ ์ด๋ฉ ๊ธฐํ ํฌ์ฐฉ
โโโโโโโโโโโโโโโโโโโโโโโโโโโโโโโโโโโโโ
โ ์งํ ์ค์ ๊ฐ์ด๋
โ ์ฃผ์ ์ค์ ๋งค๊ฐ๋ณ์
โข Institutional Continuity Period (๊ธฐ๊ด ์ฐ์์ฑ ํ์ธ ๊ธฐ๊ฐ):
โถ ๋ชฉ์ : ๊ธฐ๊ด์ ์ฐ์์ ์ธ ๋งค์/๋งค๋ ํ๋์ ํ์ธํ ๊ธฐ๊ฐ ์ค์
โถ ๋ฎ์ ๊ฐ: ๋ ๋ง์ ์ ํธ ์์ฑ, ๋ฐ์์ฑ ์ฆ๊ฐ
โถ ๋์ ๊ฐ: ์ ํธ ์ ๊ฐ์, ์ ๋ขฐ์ฑ ์ฆ๊ฐ
โข Trend Strength Threshold (์ถ์ธ ๊ฐ๋ ์๊ณ๊ฐ):
โถ ๋ชฉ์ : ์ถ์ธ๊ฐ ๊ฐํ๋ค๊ณ ํ๋จํ ์ต์ ์๊ณ๊ฐ ์ค์
โถ ๋ฎ์ ๊ฐ: ๋ ๋ง์ ์ ํธ, ๋ฎ์ ํํฐ๋ง
โถ ๋์ ๊ฐ: ๋ ๊ฐํ ์ถ์ธ์์๋ง ์ ํธ ์์ฑ, ๋์ ํํฐ๋ง
โโโโโโโโโโโโโโโโโโโโโโโโโโโโโโโโโโโโโ
โ ๋ค๋ฅธ ์งํ์์ ์๋์ง
โข ์ง์ง/์ ํญ ๋ ๋ฒจ:
โถ ์ฃผ์ ์ง์ง/์ ํญ ๋ ๋ฒจ์์ ๋ฐ์ํ๋ ๊ธฐ๊ด ์ ํธ๋ ํ๋ฅ ์ด ๋ ๋์
โถ ๊ธฐ์ ์ ๋ถ์์ ํต์ฌ ๋ ๋ฒจ๊ณผ ๊ธฐ๊ด ํ๋์ ๊ฒฐํฉ์ ๊ฐ๋ ฅํ ์๊ทธ๋ ์ ๊ณต
โข ์ด๋ํ๊ท ์ :
โถ ์ฃผ์ ์ด๋ํ๊ท ์ (50MA, 200MA) ๊ทผ์ฒ์์ ๋ฐ์ํ๋ ๊ธฐ๊ด ์ ํธ ์ฃผ๋ชฉ
โถ ์ด๋ํ๊ท ์ ๋ํ์ ๊ธฐ๊ด ์ ํธ๊ฐ ์ผ์นํ ๋ ๊ฐํ ์ถ์ธ ๋ณํ ๊ฐ๋ฅ์ฑ
โข RSI/๋ชจ๋ฉํ
์งํ:
โถ ๊ณผ๋งค์/๊ณผ๋งค๋ ์ํ์์ ๋ฐ์ํ๋ ๊ธฐ๊ด ์ ํธ๋ ๋ฐ์ ๊ฐ๋ฅ์ฑ ๋์
โถ ๋ชจ๋ฉํ
๋ค์ด๋ฒ์ ์ค์ ๊ธฐ๊ด ์ ํธ์ ์ผ์น๋ ๊ฐ๋ ฅํ ๋ฐ์ ์ ํธ
โข ๋ณผ๋ฅจ ํ๋กํ์ผ:
โถ ๋์ ๋ณผ๋ฅจ ๋
ธ๋์์ ๋ฐ์ํ๋ ๊ธฐ๊ด ์ ํธ๋ ์ค์ํ ๊ฐ๊ฒฉ ๋ ๋ฒจ ํ์ธ
โถ ์ฃผ์ ๊ฑฐ๋ ์์ญ์์์ ๊ธฐ๊ด ํ๋์ ๊ฐ๊ฒฉ ๋ฐฉํฅ์ ํฐ ์ํฅ ๋ฏธ์นจ
โข ์์ฅ ๊ตฌ์กฐ:
โถ ์ฃผ์ ์์ฅ ๊ตฌ์กฐ(๋์ ๊ณ ์ /์ ์ , ๋ฎ์ ๊ณ ์ /์ ์ ) ๊ทผ์ฒ์์ ๋ฐ์ํ๋ ๊ธฐ๊ด ์ ํธ๋ ๊ตฌ์กฐ ๋ณํ ์์
โถ ์์ฅ ๊ตฌ์กฐ ๋ณํ์ ๊ธฐ๊ด ํ๋์ ์ผ์น๋ ์ค์ํ ์ถ์ธ ์ ํ์ ํ์
โโโโโโโโโโโโโโโโโโโโโโโโโโโโโโโโโโโโโ
โ ๊ฒฐ๋ก
Coinbase Institutional Smart Money Detector๋ ์ฝ์ธ๋ฒ ์ด์ค ํ๋ผ์์ ํตํ ๊ธฐ๊ด ํฌ์์๋ค์ ํ๋ฌผ ๋นํธ์ฝ์ธ ๊ฑฐ๋ ํ๋์ ์ค์๊ฐ์ผ๋ก ์ถ์ ํ์ฌ ํธ๋ ์ด๋๋ค์๊ฒ ๊ท์คํ ํต์ฐฐ๋ ฅ์ ์ ๊ณตํฉ๋๋ค. ์ด๋ค ๊ฑฐ๋์์ ๋นํธ์ฝ์ธ ์ฐจํธ์๋ ์ ์ฉ ๊ฐ๋ฅํ๊ธฐ ๋๋ฌธ์, ์ฌ๋ฌ๋ถ์ด ์ ํธํ๋ ํธ๋ ์ด๋ฉ ํ๋ซํผ์์ ๋ฐ๋ก ํ์ฉํ ์ ์์ต๋๋ค.
์ด ์งํ์ ํต์ฌ ๊ฐ์น๋ ์ผ๋ฐ ํธ๋ ์ด๋๋ค์ด ์ ๊ทผํ๊ธฐ ์ด๋ ค์ด ๊ธฐ๊ด ์๊ธ ํ๋ฆ ๋ฐ์ดํฐ๋ฅผ ์ง๊ด์ ์ผ๋ก ์๊ฐํํ์ฌ ์ ๊ณตํ๋ค๋ ์ ์
๋๋ค. ์ฐ์์ ์ธ ๊ฐ๊ฒฉ ์์ง์, ๊ฑฐ๋๋ ์ฆ๊ฐ, ๊ทธ๋ฆฌ๊ณ ์ถ์ธ ๊ฐ๋๋ฅผ ์ข
ํฉ์ ์ผ๋ก ๋ถ์ํ์ฌ ๊ธฐ๊ด์ ํ๋์ ํฌ์ฐฉํจ์ผ๋ก์จ, ์ฌ๋ฌ๋ถ์ ์์ฅ์ ํฐ ์๋ค๊ณผ ํจ๊ป ์์ง์ผ ์ ์๋ ๊ธฐํ๋ฅผ ์ป๊ฒ ๋ฉ๋๋ค.
์ฝ์ธ๋ฒ ์ด์ค ํ๋ผ์ ๋ฐ์ดํฐ๋ฅผ ๊ธฐ๋ฐ์ผ๋ก ํ ๋ช
ํํ ๋งค์/๋งค๋ ์ ํธ์ ์ค์๊ฐ ์ถ์ธ ๊ฐ๋ ์ธก์ ์ ํธ๋ ์ด๋๋ค์ด ์์ฅ ์ํฉ์ ํ๋์ ํ์
ํ๊ณ ์ ์ํ๊ฒ ์ ๋ต์ ๊ฒฐ์ ์ ๋ด๋ฆด ์ ์๊ฒ ๋์์ค๋๋ค. ์ด ๊ฐ๋ ฅํ ๋๊ตฌ๋ฅผ ์ฌ๋ฌ๋ถ์ ํธ๋ ์ด๋ฉ ์ ๋ต์ ํตํฉํจ์ผ๋ก์จ, ์์ฅ์ ์ค๋งํธ ๋จธ๋๊ฐ ์ด๋๋ก ํ๋ฌ๊ฐ๋์ง ํ์
ํ๊ณ ๊ทธ์ ๋ฐ๋ผ ํฌ์ง์
๋ํ ์ ์๋ ๊ฒฝ์ ์ฐ์๋ฅผ ํ๋ณดํ์ธ์.
โโโโโโโโโโโโโโโโโโโโโโโโโโโโโโโโโโโโโ
โป ๋ฉด์ฑ
์กฐํญ: ๋ชจ๋ ํธ๋ ์ด๋ฉ ๋๊ตฌ์ ๋ง์ฐฌ๊ฐ์ง๋ก, Institutional Smart Money Detector๋ ๋ณด์กฐ ์งํ๋ก ์ฌ์ฉํด์ผ ํ๋ฉฐ ํธ๋ ์ด๋ฉ ๊ฒฐ์ ์ ์ ์ ์ผ๋ก ์์กดํด์๋ ์ ๋ฉ๋๋ค. ๊ณผ๊ฑฐ์ ๊ธฐ๊ด ํ๋ ํจํด์ด ๋ฏธ๋ ์์ฅ ์์ง์์ ๋ณด์ฅํ์ง๋ ์์ต๋๋ค. ํญ์ ์ ์ ํ ๋ฆฌ์คํฌ ๊ด๋ฆฌ ์ ๋ต์ ํธ๋ ์ด๋ฉ์ ํ์ฉํ์ธ์.
TradeGlixAuto Support & Resistance, EMA Based Trading Supported. Bullish and Bearish Candle color. etc
SPY, QQQ, VIX Status TableBased on Ripster EMA and 1 hour MTF Clouds, this custom TradingView indicator displays a visual trend status table for SPY, QQQ, and VIX using multiple timeframes and EMA-based logic to be used on any stock ticker.
๐ Key Features:
โ
Tracks 3 symbols: SPY, QQQ, and VIX
โ
Multiple trend conditions:
10-min (5/12 EMA) Ripster cloud trend
10-min (34/50 EMA) Ripster cloud trend
1-Hour Multi-Timeframe Ripster EMA trend
Daily open/close trend
โ
Color-coded trend strength:
๐ฉ Green = Bullish
๐ฅ Red = Bearish
๐จ Yellow = Sideways
โ
TO save screen space, customizations available:
Show/hide individual rows (SPY, QQQ, VIX)
Show/hide any trend column (10m, 1H MTF, Daily)
Change header/background colors and font color
Bold white top row for readability
โ
Auto-updating table appears on your chart, top-right
This tool is great for active traders looking to quickly scan short-term and longer-term momentum in key market instruments without having to go back and forth market charts.
JXMJXRS - Macro Flow CompassThe Macro Flow Compass is designed to give a high-level view of market behaviour by tracking how capital is moving across the crypto ecosystem. Itโs not an entry or exit tool. Instead, it helps identify when the overall environment is shifting, whether capital is favouring majors like BTC and ETH, rotating into altcoins, or moving into stables.
The goal is to keep you aligned with broader market cycles, so trades are taken with macro context in mind.
The script works by analyzing four key metrics:
Total crypto market cap (CRYPTOCAP:TOTAL)
Bitcoin dominance (CRYPTOCAP:BTC.D)
Ethereum dominance (CRYPTOCAP:ETH.D)
Combined stable coin dominance from USDT and USDC (CRYPTOCAP:USDT.D + USDC.D)
These are smoothed using a basic EMA (Exponential Moving Average) to reduce noise. The script then checks for changes in dominance and market cap slope to detect when capital is likely flowing into or out of specific sectors.
When certain conditions align, the script will shade the background with one of the following colours:
Green Panel โ Risk-on behaviour in majors. Usually appears when total market cap is trending up and BTC dominance is dropping, or stable coin dominance is falling. It suggests BTC and ETH are likely receiving capital inflow, not necessarily pumping but positioned better for upside.
Orange Panel โ Altcoin rotation. Happens when ETH dominance is rising or stables are pulling back, while the market cap is also rising. These tend to precede altcoin outperformance phases.
Blue Panel โ Stable coin build-up. Signals increasing stable coin dominance. Often a defensive move, either after a drop or in anticipation of volatility. This can mean risk-off conditions.
The indicator uses three main settings:
Smoothing Length โ Controls how reactive the EMAs are. Lower values react quicker to short-term changes; higher values will slow things down and highlight more persistent trends.
Dominance Flip Threshold (%) โ Sets how much a dominance value must change in one bar to trigger a condition. Itโs there to avoid reacting to tiny shifts that donโt really matter.
Macro Cap Slope Length โ Determines how the macro market cap trend is calculated. It looks at the slope of a long-term regression to decide if weโre in an uptrend or downtrend.
This tool works on higher timeframes like the weekly or monthly, and itโs especially useful when combined with your own technical analysis.
Altcoin Breadth | QuantumResearch๐น Altcoin Breadth | QuantumResearch
Purpose:
Altcoin Breadth measures the strength of the altcoin market by tracking how many assets trade above key moving averages (50-day and 200-day). It offers a normalized view of trend participation across 40 major crypto assets.
How It Works:
For each of the 40 altcoins:
The script checks whether the asset's current price is above its 50-day and/or 200-day simple moving average.
Each condition counts as a binary "1" (trend up) or "0" (trend down).
The total values are averaged, yielding two normalized values between 0 and 1:
Breadth 50: % of assets above their 50 SMA
Breadth 200: % of assets above their 200 SMA
Visual Display:
Plots Breadth 50 and Breadth 200 separately as two gradient-colored lines.
Dynamic labels at the latest bar indicate current breadth values.
Optional bar coloring to reflect underlying breadth momentum.
Key Features:
Evaluates short-term and long-term trend strength across the altcoin sector.
Dynamic visualization of market participation breadth.
Clear trend shifts and sector-wide bullish/bearish transitions.
Separate toggles to show either Breadth 50, Breadth 200, or both.
Trading Application:
Identify broad altcoin uptrends or breakdowns.
Use Breadth 200 for macro confirmation; Breadth 50 for tactical shifts.
Align altcoin exposure with healthy trend participation levels.
โ ๏ธ Breadth tools offer market-wide context, not individual entry signals. Use in combination with trend or momentum indicators.
Disclaimer: Past performance does not guarantee future results. This tool is intended for informational and educational use only. Cryptocurrency markets are volatile and involve high risk.
Binance Spot vs Perpetual Price index by BIGTAKER๐ Overview
This indicator calculates the premium (%) between Binance Perpetual Futures and Spot prices in real time and visualizes it as a column-style chart.
It automatically detects numeric prefixes in futures symbolsโsuch as `1000PEPE`, `1MFLUX`, etc.โand applies the appropriate scaling factor to ensure accurate 1:1 price comparisons with corresponding spot pairs, without requiring manual configuration.
Rather than simply showing raw price differences, this tool highlights potential imbalances in supply and demand, helping to identify phases of market overheating or panic selling.
๐ง Component Breakdown
1. โ
Auto Symbol Mapping & Prefix Scaling
Automatically identifies and processes common numeric prefixes (`1000`, `1M`, etc.) used in Binance perpetual futures symbols.
Example:
`1000PEPEUSDT.P` โ Spot symbol: `PEPEUSDT`, Scaling factor: `1000`
This ensures precise alignment between futures and spot prices by adjusting the scale appropriately.
2. ๐ Premium Calculation Logic
Formula:
(Scaled Futures Price โ Spot Price) / Spot Price ร 100
Interpretation:
* Positive (+) โ Futures are priced higher than spot: indicates possible long-side euphoria
* Negative (โ) โ Futures are priced lower than spot: indicates possible panic selling or oversold conditions
* Zero โ Equilibrium between futures and spot pricing
3. ๐จ Visualization Style
* Rendered as column plots (bar chart) on each candle
* Color-coded based on premium polarity:
* ๐ฉ Positive premium: Light green (`#52ff7d`)
* ๐ฅ Negative premium: Light red (`#f56464`)
* โฌ Neutral / NA: Gray
* A dashed horizontal line at 0% is included to indicate the neutral zone for quick visual reference
๐ก Strategic Use Cases
| Market Behavior | Strategy / Interpretation |
| ----------------------------------------- | ------------------------------------------------------------------------ |
| ๐ Premium surging | Strong futures demand โ Overheated longs (short setup) |
| ๐ Premium dropping | Aggressive selling in futures โ Oversold signal (long setup) |
| ๐ Near-zero premium | Balanced market โ Wait and observe or reassess |
| ๐งฉ Combined with funding rate or OI delta | Enables multi-factor confirmation for short-term or mid-term signals |
๐ง Technical Advantages
* Fully automated scaling for prefixes like `1000`, `1M`, etc.
* Built-in error handling for inactive or missing symbols (`ignore_invalid_symbol=true`)
* Broad compatibility with Binance USDT Spot & Perpetual Futures markets
๐ Target Use Cases & Examples
Compatible symbols:
`1000PEPEUSDT.P`, `DOGEUSDT.P`, `1MFLUXUSDT.P`, `ETHUSDT.P`, and most other Binance USDT-margined perpetual futures
Works seamlessly with:
* Binance Spot Market
* Binance Perpetual Futures Market
Order-Flow Market StructureOrder-Flow Market Structure by The_Forex_Steward
A precision tool for visualizing internal shifts, swing structure, BOS events, Fibonacci levels, and multi-timeframe alerts.
What It Does
The Order-Flow Market Structure indicator intelligently tracks and visualizes price structure using higher timeframe candles. It automatically detects:
โข Internal bullish and bearish structure shifts
โข Swing highs and lows (HH, HL, LH, LL)
โข Break of Structure (BoS) confirmations
โข Fibonacci retracement levels from recent swing moves
โข Real-time alerts across LTF, MTF, and HTF modes
Itโs a complete tool for traders who follow Smart Money Concepts, ICT, or institutional price action strategies.
How It Works
โข You select a Higher Timeframe (HTF) to set the structural context
โข Internal shifts are identified using HTF candle closes
โข The indicator scans for swing highs/lows after each internal shift
โข Breaks of previous swing points confirm BoS and plot horizontal lines
โข Zigzag lines visually connect structural points (swings and BoS)
โข Fibonacci levels are drawn between the latest swings
โข Alerts can be configured for structure shifts, BoS events, and fib level breaks
How to Use It
Set your preferred HTF (e.g., 1H while trading on 5-minute)
Enable Fibonacci levels to visualize retracement zones
Watch for:
โข Bullish internal shifts โ HL to HH
โข Bearish internal shifts โ LH to LL
โข BOS โ Breakout confirmation
Enable alerts to catch structural events in real-time
Adjust the "Safe History Offset" if working with long lookbacks or volatile assets
Who It's For
โข Traders using Smart Money, ICT, or market structure-based systems
โข Scalpers, day traders, and swing traders
โข Anyone needing precise structural insight across multiple timeframes
Features
โข BoS detection with custom line styles and width
โข HH, HL, LH, LL label plotting
โข Optional Fibonacci retracement zones
โข Custom alerts for swing shifts and fib level breaks
โข LTF, MTF, and HTF alert modes
Stay aligned with structure, trade with precision, and get alerted to key shifts in real time.


