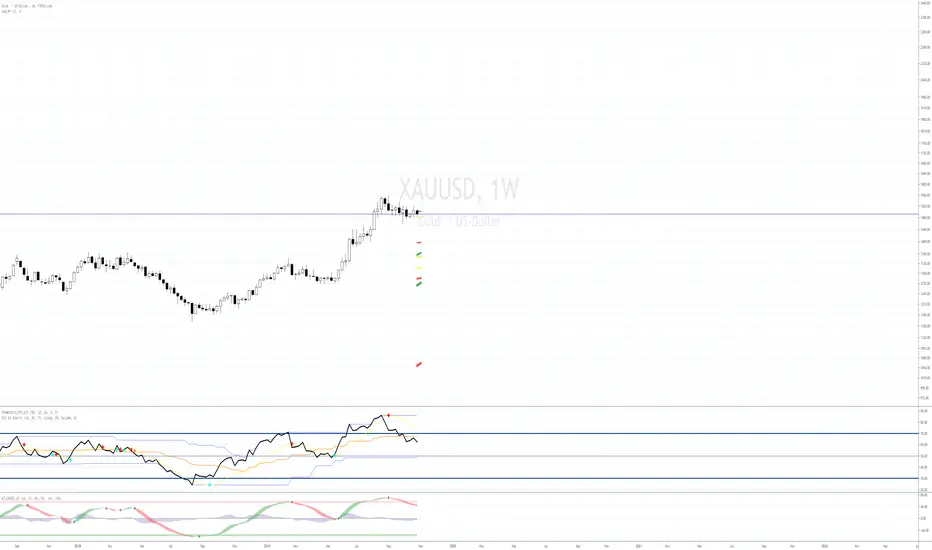
200SMA Distance OscillatorThe oscillator measures the percentage deviation of closing price x from SMA200.
The idea behind the oscillator was preceded by an analysis of how often MAs in the index hold/bounce or are broken through.
Basically, the idea was about index analysis, i.e., the macro picture of a market.
Who wants to buy individual stocks when the overall market is plummeting ;-)
Or in other words: How long are you long in a market? When is it time to take profits?
After the analysis of the stability of SMAs in the index was rather modest (ratio of just under 6:4 for bounce to breakout – overall in 20, 50, 100, and 200 frames from 2020 to 2025), it was noticeable that the percentage over- or underperformance was scalable, especially in indices.
And since indices generally move upwards, there were fixed limits for over- and underestimations – especially in the longer term (SMA200) – unlike with individual stocks.
It is therefore more a question of macro trends and less of short-term movements, e.g., in day trading.
It was now interesting to see at what percentage range counter-movements were likely – particularly in the positive range for profit-taking, but of course also in the negative range for entry into sold-off markets.
If, for example, closing prices around +25% above SMA200 were reached in the NDX, the probability is very high that the market has overreacted and an interim correction will follow – so the theory goes.
On the other hand, continuous levels of +5 to +10% are a product of healthy positive development in a bull market and do not necessarily require action.
The oscillator was specifically designed for the NDX, but can also be used for the SPX and others.
The style was based on the RSI, so that the color level rises from 10% to 20% (overbought/oversold principle).
Based on manually examined movements, the criteria were set as follows:
+/-10% = flow / no color background
> +/-10% = border areas / color background
The center line represents the 252 average of the percentage deviations and could also be used as a trigger, provided it has been historically examined and is valid.
The oscillator is very interesting because it behaves completely differently from one financial instrument to another and, as a result, also in the timeframes (4h, D, W).
It would probably make sense to change the flow and border levels in the code when using it outside of indices.
The fact is that the oscillator must be “adjusted” to each instrument in order to achieve its goal of providing the best possible prediction. “Adjusting” refers to the analysis of the levels at which an instrument/asset usually reacts.
As with all indicators and oscillators, it is advisable to take other indicators and, in particular, macro news into account when analyzing this development.
If I find any substantial correlations with other indicators, I will be happy to provide an update.
The idea came from me, the code from Grok.
The code is not 100% perfect, but the data (percentage deviation, color background) is correct according to initial analysis.
In the settings, you can make the lines of the plots invisible. This makes the oscillator clearer. You can also adjust the settings for the average line.
Sma200
Three Thumbs IndicatorChecks following on daily chart:
current close above previous year close
5th close above previous year close
current close above SMA200
Mikolaj Zakrzowski - Adjusted Mayer MultipleAuthor - Publication: Mikołaj Zakrzowski, Marek Zatwarnicki
Author - Algorithm: Mikołaj Zakrzowski
Author - Code: Marek Zatwarnicki, Derek Gruening
Inspired by: Mayer Multiple by Trace Mayer
Category: Technical Analysis
Type: Indicator
Timeframe: 1D Only
Index: INDEX:BTCUSD Only
About:
According to Willy Woo Mayer Multiple is "A way to gauge the current price of Bitcoin against its long range historical price movements (200 day moving average), the Mayer Multiple highlights when Bitcoin is overbought or oversold in the context of longer time frames".
My friend, Mikolaj Zakrzowski, decided to modify and adjust this indicator so that it could be normalized. This procedure allows for easier interpretation, and clear signals of the end of the ups and downs of a given Bitcoin cycle.
How to use:
BUY - Buy some Bitcoin , when label on last candle shows "Buy".
SELL- Sell some Bitcoin , when label on last candle shows "Sell".
Formula:
- Mayer Multiple - Close / ta. sma (close, 200)
- Formula for normalization is an intellectual property of Mikolaj Zakrzowski.
Overfitting: The presented algorithm is characterized by log regresion determined as of 01/01/2022. Tests with historical data show that the algorithm is very likely to work equally well the following years.
Disclaimer: Past good results do not guarantee future trading success. Please use the algorithm with caution and support it with your knowledge. Published algorithm decisions are not financial advice.

Daily/MTF Moving Averages (EMA20, EMA55, SMA50, SMA100, SMA200)Script to plot common daily/alternative timeframe moving averages on when viewing securities at other resolutions.
There's lots of different MA scripts out there, but I couldn't find one that just represented the standard support/resistance indicators that were typical for my markets. So, this is the DIY. :)
sma 50 100 200 multi Timframes actual daily weekly monthlysma 50-100-200
Just 3 sma from actual,daily,weekly and monthly timeframe
Mix1 : Ema Cross + Trend Channel [Gu5]Based on Trend Channel
Ema-crossover is added
Crossing alerts, only on trend
Basado en mi anterior indicador, Trend Channel
Se agrega Cruce de Medias Moviles (Ema-crossover)
Las alertas solo son en favor a la tendencia
El valor de SMA Range es arbitrario (No Backtesting). Cambia la amplitud de canal que determina cuando es rango (barras amarillas por estar muy cerca del SMA200, sin tendencia definida)
Range Multiplier adapta el indicador a distintos mercados
//Setting recommended for SMA Range
//BTCUSD = 100
//EURUSD = 1000
//SPX = 100
//ETHUSD = 10
Si te fue útil este indicador, puedes comprarme una cerveza ;)
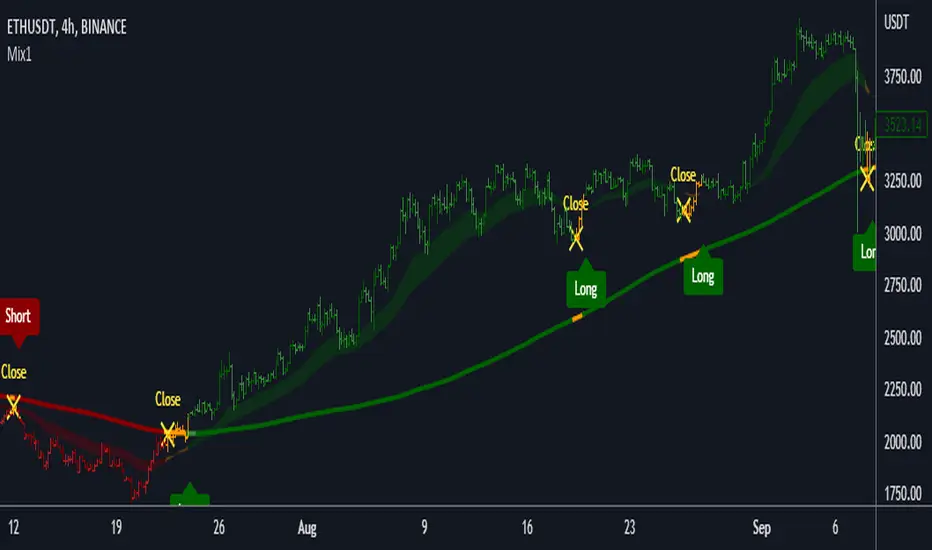
Trend Channel [Gu5]SMA 200 determines the trend
Bullish trend, green candles. Down trend, red candles.
If the market value is narrow to the SMA200 channel, yellow candles.
Setting recommended for SMA Range
BTCUSD = 100
EURUSD = 1000
SPX = 100
ETHUSD = 10

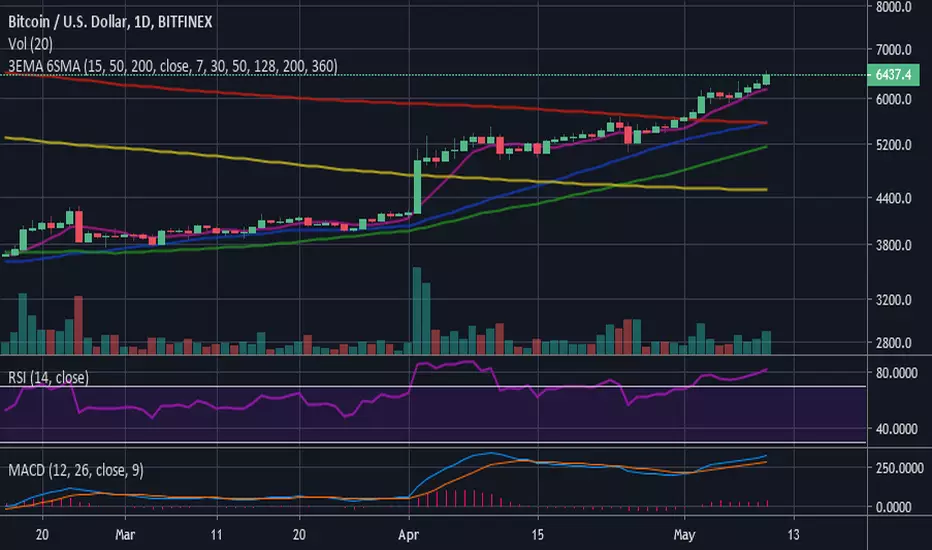
3 EMA (15-50-200) - 6 SMA (7-30-50-128-200-360)3 Moving Average Exponential - 6 Simple Moving Average . Crypto EMA - MA . 7 is a fast support or resistance, 15 confirmation support or resistance. 30 Important support and resistance . 50 institutional support or resistance. 200 institutional general trend, support and resistance , 360 general trend, support and resistance . The use of EMA or MA is according to your liking/trading plan
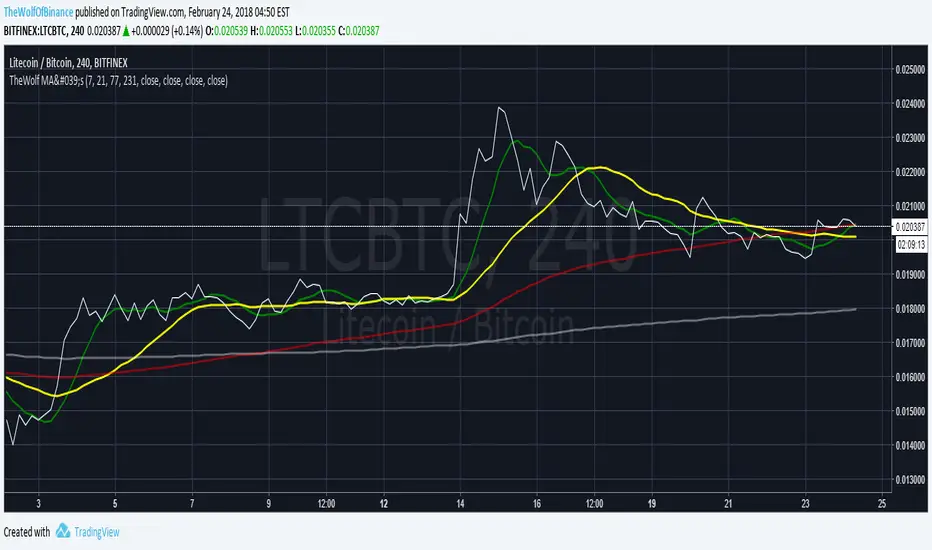
TheWolfOfBinance Moving Averages4 moving averages
231 (white) shows the trend
77 (red) crosses above 231 (white) buy signal - longterm
7 (green) crosses above 77 (red) buy signal - quick money
7 (green) crosses below 21 (yellow) sell signal - quick money gone
7 (green) crosses below 77 (red) sell signal - quick money gone