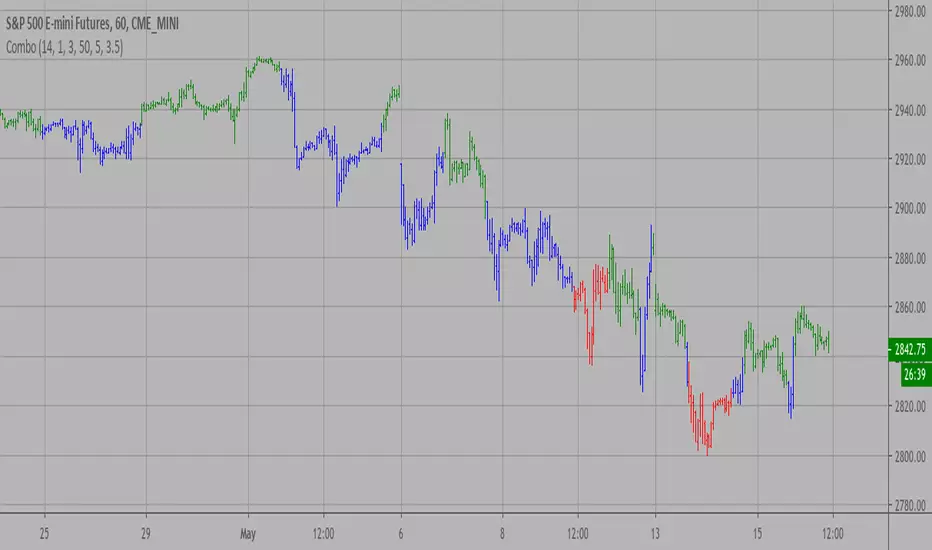
Combo Strategy 123 Reversal & Bear Power This is combo strategies for get
a cumulative signal. Result signal will return 1 if two strategies
is long, -1 if all strategies is short and 0 if signals of strategies is not equal.
First strategy
This System was created from the Book "How I Tripled My Money In The
Futures Market" by Ulf Jensen, Page 183. This is reverse type of strategies.
The strategy buys at market, if close price is higher than the previous close
during 2 days and the meaning of 9-days Stochastic Slow Oscillator is lower than 50.
The strategy sells at market, if close price is lower than the previous close price
during 2 days and the meaning of 9-days Stochastic Fast Oscillator is higher than 50.
Second strategy
Bear Power Indicator
To get more information please see "Bull And Bear Balance Indicator"
by Vadim Gimelfarb.
WARNING:
- For purpose educate only
- This script to change bars colors.
Strategy!

BAHbO BB,RSI strategyThis script is using Bollinger Bands in combination with Oversold/Overbought RSI 2(20,80).

Combo Strategy 123 Reversal & (H-L)/C Histogram This is combo strategies for get
a cumulative signal. Result signal will return 1 if two strategies
is long, -1 if all strategies is short and 0 if signals of strategies is not equal.
First strategy
This System was created from the Book "How I Tripled My Money In The
Futures Market" by Ulf Jensen, Page 183. This is reverse type of strategies.
The strategy buys at market, if close price is higher than the previous close
during 2 days and the meaning of 9-days Stochastic Slow Oscillator is lower than 50.
The strategy sells at market, if close price is lower than the previous close price
during 2 days and the meaning of 9-days Stochastic Fast Oscillator is higher than 50.
Second strategy
This histogram displays (high-low)/close
Can be applied to any time frame.
WARNING:
- For purpose educate only
- This script to change bars colors.

Combo Strategy 123 Reversal & Bandpass Filter This is combo strategies for get
a cumulative signal. Result signal will return 1 if two strategies
is long, -1 if all strategies is short and 0 if signals of strategies is not equal.
First strategy
This System was created from the Book "How I Tripled My Money In The
Futures Market" by Ulf Jensen, Page 183. This is reverse type of strategies.
The strategy buys at market, if close price is higher than the previous close
during 2 days and the meaning of 9-days Stochastic Slow Oscillator is lower than 50.
The strategy sells at market, if close price is lower than the previous close price
during 2 days and the meaning of 9-days Stochastic Fast Oscillator is higher than 50.
Second strategy
The related article is copyrighted material from
Stocks & Commodities Mar 2010
You can use in the xPrice any series: Open, High, Low, Close, HL2, HLC3, OHLC4 and ect...
WARNING:
- For purpose educate only
- This script to change bars colors.

Combo Strategy 123 Reversal & Average True Range Trailing Stops This is combo strategies for get
a cumulative signal. Result signal will return 1 if two strategies
is long, -1 if all strategies is short and 0 if signals of strategies is not equal.
First strategy
This System was created from the Book "How I Tripled My Money In The
Futures Market" by Ulf Jensen, Page 183. This is reverse type of strategies.
The strategy buys at market, if close price is higher than the previous close
during 2 days and the meaning of 9-days Stochastic Slow Oscillator is lower than 50.
The strategy sells at market, if close price is lower than the previous close price
during 2 days and the meaning of 9-days Stochastic Fast Oscillator is higher than 50.
Secon strategy
Average True Range Trailing Stops Strategy, by Sylvain Vervoort
The related article is copyrighted material from Stocks & Commodities Jun 2009
WARNING:
- For purpose educate only
- This script to change bars colors.
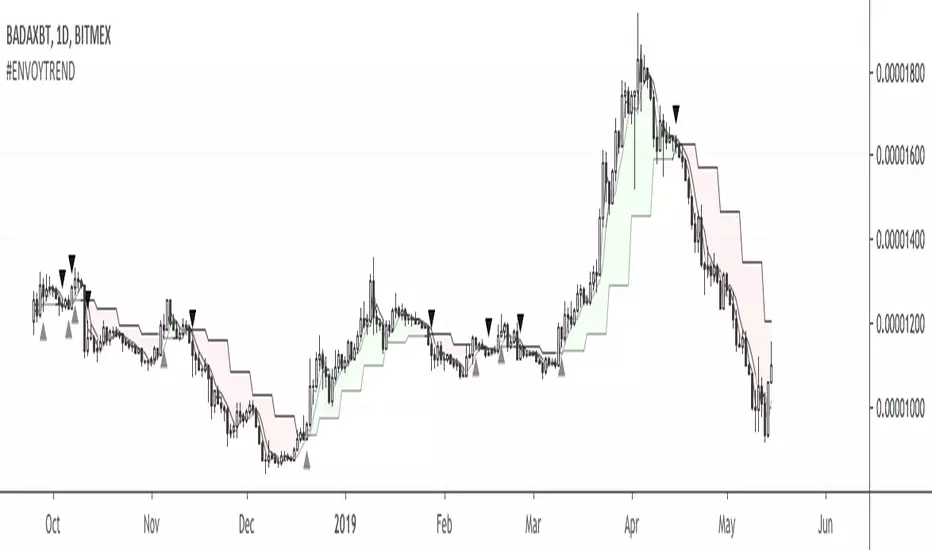
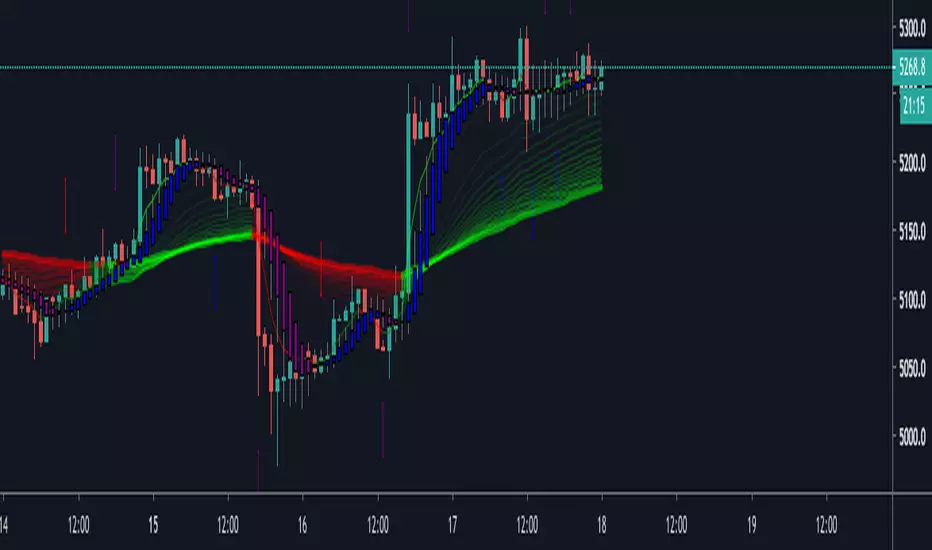
#ENVOYTREND#ENVOYTREND
Civilians don't like don't like simple strategies, but Envoys do.
With the collective #envoytrend trading strategy we ensure that no one is left behind when it comes to consistent profits. By working on the very same trades we bundle our efforts and help each other out. Maintaining an Envoy Account will give us reliable returns and teach us one of the most important lessons that we have to learn as a professional trader, which is consistency.
The indicator’s default settings show the trend cloud and the lines L, M and S with S crossing L being our main indication to enter a position. The general rule is that if S crosses over L we want to long as close to L as possible (if it shoots over by a lot we'd rather wait for a pullback to get in at a better price). If S crosses under L we want to short as close to L as possible (if it shoots under by a lot we'd rather wait for a pullback to get in at a better price). There are circumstances where we would want to take other lines into account like XL (which on some pairs can trump L), NEXT L (which is highly predictive but can give us a rough estimation where we might want to look for more aggressive, complimenting setups) or even M for very aggressive entries/exits on lower time frames. When price action goes utterly sideways so that we're getting back and forth signals we'd rather look for positions of strength within the narrow range. All our entries, exits, stops, take profits and additional plays in between are going to be discussed in the Envoy Academy, so no Envoy has to trade alone and can always ask for advise to get feedback on a position.
Enlist now.
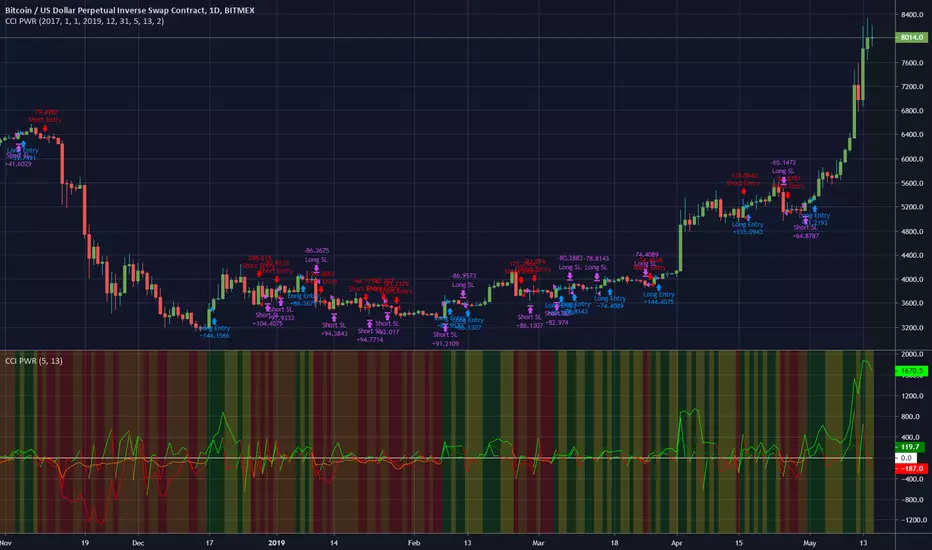
CCI PWRThis is a backtest for my CCI PWR indicator here . It works very well on a daily chart but may be useful for lower timeframes.
You can change the backtest settings to test different periods of time.
I have included a stop-loss function that will exit a trade if the price goes against the signals. The parameter is an integer that represents a %age of the current price, so for example, a value of 2 would mean a stoploss is set 2% below a long entry or 2% above a short entry.
Here is an image of ETH/BTC with the same settings.
Let me know if you find it useful!
Swing Surfing on Slow Heiken AshiGood for Crypto related markets. Guaranteed to catch every big swing, just have to make sure you keep your positions updated. 3m chart.

DEMO BEETHello dear traders,
This is my first attempt to create an automatic trading strategy. This is 100% automatic, no need for any kind of human intervention.
The strategy is based on momentum and will buy when condition 1 and 2 are met, and sell when condition 3 and 4 are met.
This is very basic and i need to implement an exit strategy to bank the profits.
Enjoy.

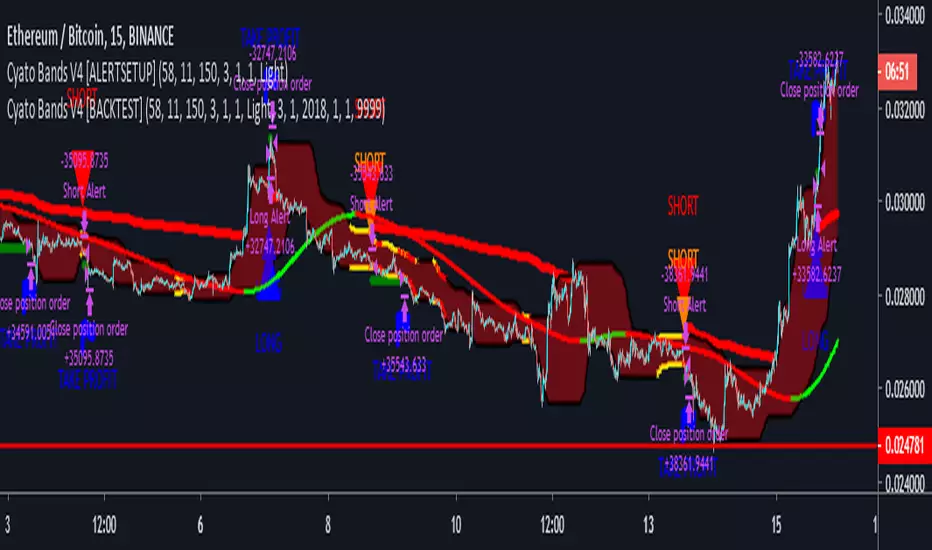
Cyatophilum Bands Pro Trader V4 [ALERTSETUP]> > PRESENTATION < <
This version includes a new feature, engineered to increase profitability.
About the backtest below:
Short + Long Strategy
0.05% Commission
10% of 10 000% equity per trade. Net Profit can be increased with a bigger % of equity.
Strategy data from 01/11/2019 to 30/04/2019
The Cyatophilum Bands, Trailing Stop Loss and Take Profit System are explained on here .
To automate the indicator, there are up to 8 different alerts that you can use:
1. LONG ENTRY
2. LONG EXIT
3. SHORT ENTRY
4. SHORT EXIT
5. TAKE PROFIT LONG
6. TAKE PROFIT SHORT
7. STOP LOSS LONG
8. STOP LOSS SHORT
The access to this indicator is included in the Cyatophilum Indicators pack available on my website .
To get a free trial, simply leave a comment, thank you very much for reading !
Previous version :
Arrows Perfect BinaryThis is a binary options script for detecting the best flaws in the market and taking advantage.
Initially, the script was coded with Martingale in mind and no losses occur in 3-5 cycles but a revision was made and this is the current version 1.0 of the script. Use this script wisely, It's a powerful one and might be the Holy Grail or Account Blower.
If you think of something please lemme know so that I can improve the value of this script to the community.
I am open to wise contributions.
Enjoy, lucemanb

SHA & MMAR Strategy Alert IndicatorIndicator w/ alerts for 'Slow-Heiken Ashi & Madrid Moving Average Strategy'.
High win-percentage with cryptocurrencies on a 1H timechart.
Combo Strategies 123 Reversal and 3-Bar-Reversal-Pattern This is combo strategies for get
a cumulative signal. Result signal will return 1 if two strategies
is long, -1 if all strategies is short and 0 if signals of strategies is not equal.
First strategy
This System was created from the Book "How I Tripled My Money In The
Futures Market" by Ulf Jensen, Page 183. This is reverse type of strategies.
The strategy buys at market, if close price is higher than the previous close
during 2 days and the meaning of 9-days Stochastic Slow Oscillator is lower than 50.
The strategy sells at market, if close price is lower than the previous close price
during 2 days and the meaning of 9-days Stochastic Fast Oscillator is higher than 50.
Secon strategy
This startegy based on 3-day pattern reversal described in "Are Three-Bar
Patterns Reliable For Stocks" article by Thomas Bulkowski, presented in
January,2000 issue of Stocks&Commodities magazine.
That pattern conforms to the following rules:
- It uses daily prices, not intraday or weekly prices;
- The middle day of the three-day pattern has the lowest low of the three days, with no ties allowed;
- The last day must have a close above the prior day's high, with no ties allowed;
- Each day must have a nonzero trading range.
WARNING:
- This script to change bars colors.

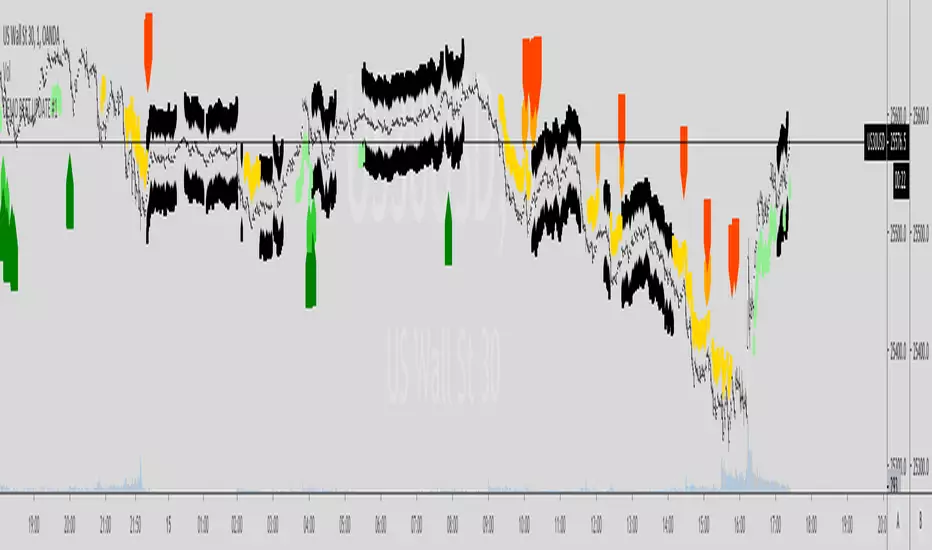
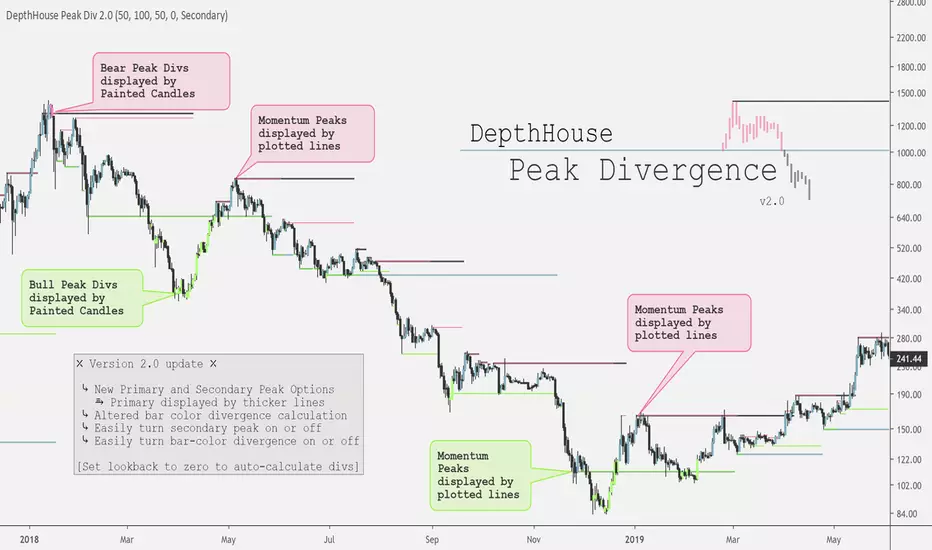
DepthHouse - Peak DivergenceDepthHouse - Peak Divergence indicator uses the same linear regression calculation as my Peak Momentum Oscillator to help determine and plot peak momentum points.
These peak levels are then plotted by either red or green lines above or below the candle.
Red lines represent a peak in bear momentum while green represents peaks in bull momentum.
These levels are then used to determine momentum divergence in the displayed market.
If divergence is present the bars colors will change represent either bull or bear div.
Important Notes:
If the price crosses a peak line and the bar color does not change; it means momentum has increased/decreased with the price and the divergence has been canceled.
If divergence is present, and then the following candle is not colored then momentum has increased to cancel the previously present divergence.
By default, the look-back period is set to zero , which automatically calculates the distance for the peak levels to look-back. However this number can be set to whatever look-back period you would like.
At time of release this indicator is in its early stages. So please leave feedback on how it can be improved!
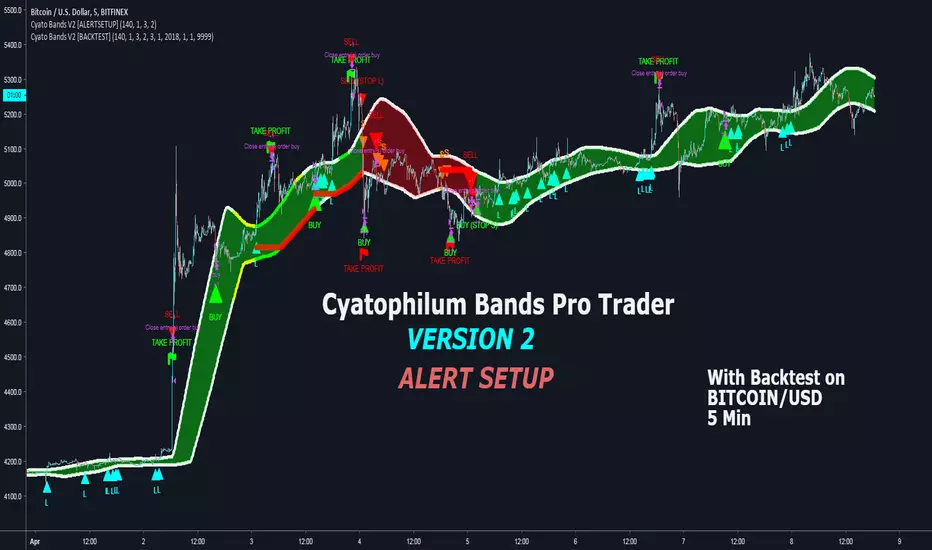
Cyatophilum Bands Pro Trader V2 [ALERTSETUP]An Original Automated Strategy that can be used for Manual or Bot Trading, on any timeframe and market.
Presentation page with video
How it works
The Cyatophilum Bands behave as either Trend Lines during a bear or bull market, or Support and Resistance during a Flat Market. Buy and Sell signals trigger upon Trend Reversal Breakouts.
Stop Loss System
An integrated Stop Loss System. Helps reducing risk by creating buy and sell signals when the price breaks through the red line.
Trailing Stop
Transform your Stop Loss into a Trailing Stop Loss. The red line will increase/decrease to secure profits.
Take Profit
Secure your profits using this new feature! When a flag appears, a buy/sell signal will trigger.
Re-Entries
A feature that can be helpful when using Take Profit or for manual trading in case you missed a trade.
Use it literally Anywhere
This indicator can be used on any timeframe and market (not only cryptocurrencies).
Backtest Below
Note: can be easily automated with Autoview
Get the indicator today!
Turtles Modified AlertsAlerts for famous Turtle Trading Rules. Based on work from tmr0 and ossettia . It can be used with Autoview.
If you have any advice on how to further improve the script, please let me know by PM or comment below. Thanks!
Please hit on "Like" if you find this script useful so that others can find it easier. Thanks!
*** The information and script provided here are no recommendation to buy or sell. They are just an idea for educational and discussion purposes. ***

Sar-MA SystemThis Script uses Parabolic SAR (developed by Welles Wilder) and some Moving Averages to calculate BUY/SELL and Close Buy/Close Sell points. Additionally the script adds Stop Loss line that is calculated by using Average True Range (ATR).
Basically, script checks the Parabolic SAR and gets confirmation from moving averages or parabolic sar of the higher time frame.
You will not be in a position all the time because if there is no comfirmation then you need to wait for it. For example after closing BUY position, if no confirmation from MAs or higher time frame SAR then there will not be short position, or vice versa.
if you use it please comment.
If you find this script useful, please consider a donation
BTC: 16XRqyS3Vgh1knAU1tCcruqhUrVm4QWWmR

Stochastic RSI Signal LinesThis script is for private use only. I created it as step 1 for my Renko Trading Strategy.
Tested on BitMex on XBTUSD.

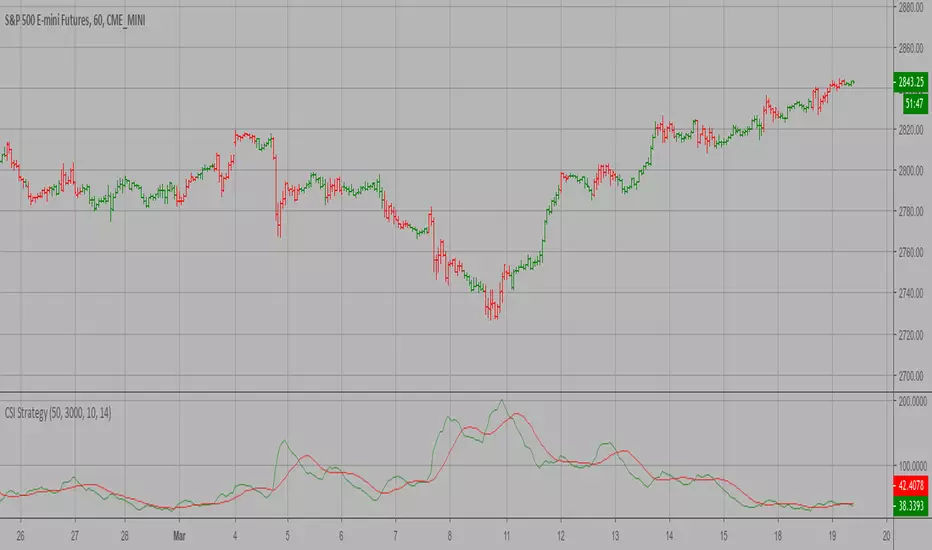
Commodity Selection Index Strategy The Commodity Selection Index ("CSI") is a momentum indicator. It was
developed by Welles Wilder and is presented in his book New Concepts in
Technical Trading Systems. The name of the index reflects its primary purpose.
That is, to help select commodities suitable for short-term trading.
A high CSI rating indicates that the commodity has strong trending and volatility
characteristics. The trending characteristics are brought out by the Directional
Movement factor in the calculation--the volatility characteristic by the Average
True Range factor.
Wilder's approach is to trade commodities with high CSI values (relative to other
commodities). Because these commodities are highly volatile, they have the potential
to make the "most money in the shortest period of time." High CSI values imply
trending characteristics which make it easier to trade the security.
The Commodity Selection Index is designed for short-term traders who can handle
the risks associated with highly volatile markets.
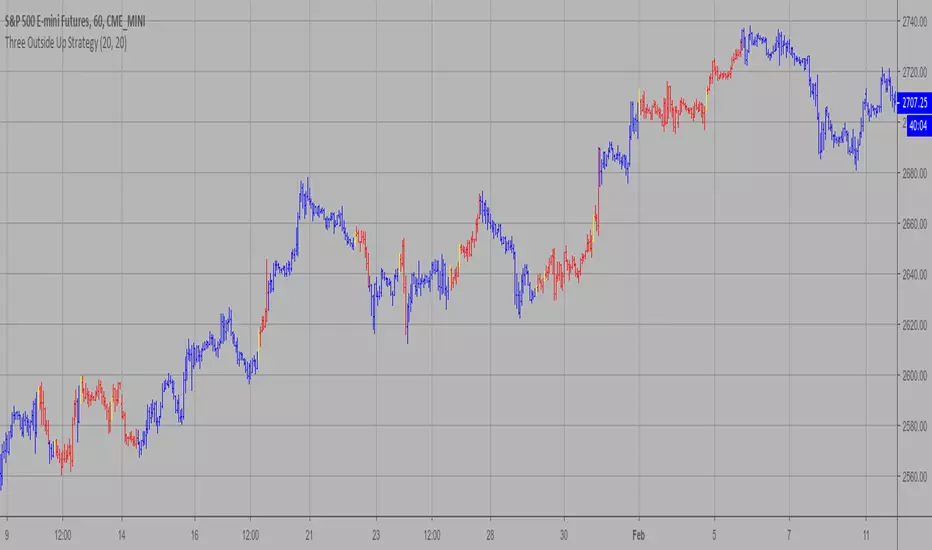
Three Outside Up Strategy This is a three candlestick bullish reversal pattern consisting of a bullish
engulfing pattern formed by the first two candlesticks then followed by an up
candlestick with a higher close than the prior candlestick.
WARNING:
- This script to change bars colors.
Short-Term Trend MasterThis is a short-term trend-following trading strategy.
Buy when there is a moving average crossover and green background signal.
Sell when there is a moving average crossover and red background signal.
Try different timeframes to find the best one.
Cheers!

Intelligent Moving AverageFor 4 simple moving averages, the script tests every single combination for maximum profitability and finds the best pair.
Combinations:
sma1 and sma2,
sma1 and sma3,
sma1 and sma4,
sma2 and sma3,
sma2 and sma4,
sma3 and sma4
And then paint the pair which get best performance. sma lengths are optional, so you can change lengths as you wish.
You will see in some charts that for example sma1 and sma2 pair was best perfrmance and colored on the chart but then sma2 and sma3 pair got better performance, so script starts to paint sma2 and sma3. so it's dynamic based on best performance.
keep in mind => length1 < length2 < length3 < length4 will be better
I didn't have enough time to test the script, so please comment when you test it.
by LonesomeTheBlue
