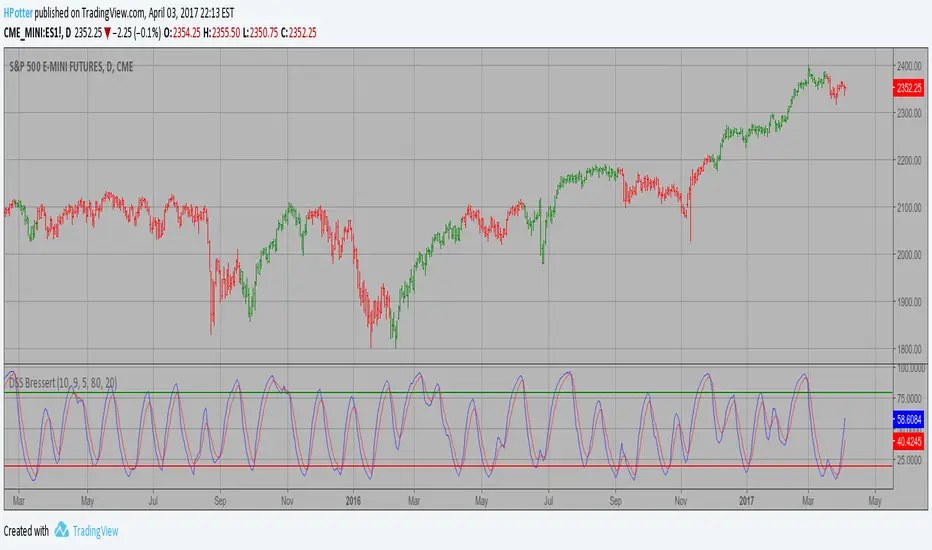
DSS Bressert (Double Smoothed Stochastic) Strategy Double Smoothed Stochastics (DSS) is designed by William Blaw. It attempts to combine moving average methods with oscillator principles. Pine Script® indicatorby HPotter110
Detrended Price Oscillator Strategy The Detrend Price Osc indicator is similar to a moving average, in that it filters out trends in prices to more easily identify cycles. The indicator is an attempt to define cycles in a trend by drawing a moving average as a horizontal straight line and placing prices along the line according to their relation to a moving average. It provides a means of identifying underlying cycles not apparent when the moving average is viewed within a price chart. Cycles of a longer duration than the Length (number of bars used to calculate the Detrend Price Osc) are effectively filtered or removed by the oscillator.Pine Script® indicatorby HPotter113
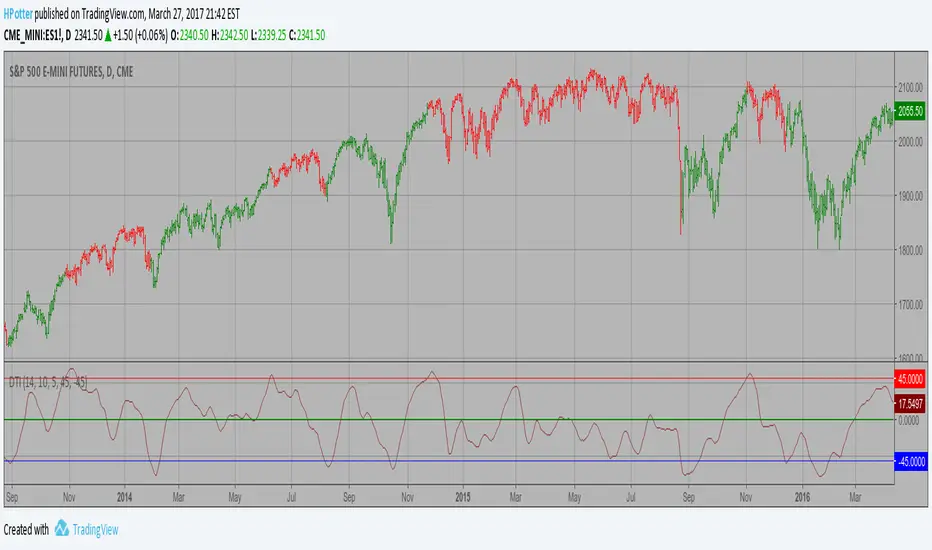
Directional Trend Index (DTI) Strategy This technique was described by William Blau in his book "Momentum, Direction and Divergence" (1995). His book focuses on three key aspects of trading: momentum, direction and divergence. Blau, who was an electrical engineer before becoming a trader, thoroughly examines the relationship between price and momentum in step-by-step examples. From this grounding, he then looks at the deficiencies in other oscillators and introduces some innovative techniques, including a fresh twist on Stochastics. On directional issues, he analyzes the intricacies of ADX and offers a unique approach to help define trending and non-trending periods. Directional Trend Index is an indicator similar to DM+ developed by Welles Wilder. The DM+ (a part of Directional Movement System which includes both DM+ and DM- indicators) indicator helps determine if a security is "trending." William Blau added to it a zeroline, relative to which the indicator is deemed positive or negative. A stable uptrend is a period when the DTI value is positive and rising, a downtrend when it is negative and falling. Pine Script® indicatorby HPotter11149
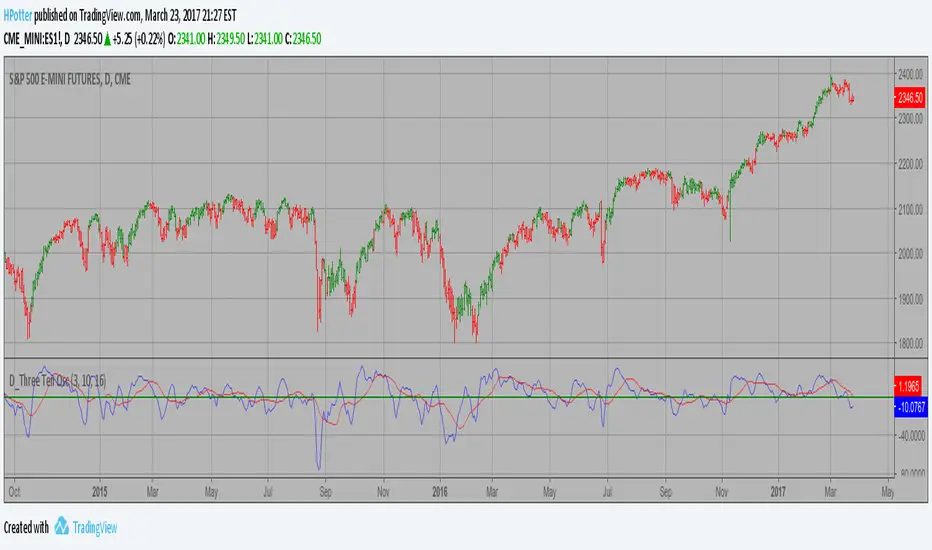
D_Three Ten Osc Strategy This indicator allows the user to plot a daily 3-10 Oscillator on a Tick Bar Chart or any intraday interval. Walter Bressert's 3-10 Oscillator is a detrending oscillator derived from subtracting a 10 day moving average from a 3 day moving average. The second plot is an 16 day simple moving average of the 3-10 Oscillator. The 16 period moving average is the slow line and the 3/10 oscillator is the fast line. For more information on the 3-10 Oscillator see Walter Bressert's book "The Power of Oscillator/Cycle Combinations"Pine Script® indicatorby HPotter44
D_ELI (Ehlers Leading Indicator) Strategy This Indicator plots a single Daily DSP (Detrended Synthetic Price) and a Daily ELI (Ehlers Leading Indicator) using intraday data. Detrended Synthetic Price is a function that is in phase with the dominant cycle of real price data. This one is computed by subtracting a 3 pole Butterworth filter from a 2 Pole Butterworth filter. Ehlers Leading Indicator gives an advanced indication of a cyclic turning point. It is computed by subtracting the simple moving average of the detrended synthetic price from the detrended synthetic price. Buy and Sell signals arise when the ELI indicator crosses over or under the detrended synthetic price. See "MESA and Trading Market Cycles" by John Ehlers pages 64 - 70. Pine Script® indicatorby HPotter1414125
D_DSP (Detrended Synthetic Price) Strategy 2 Detrended Synthetic Price is a function that is in phase with the dominant cycle of real price data. This DSP is computed by subtracting a half-cycle exponential moving average (EMA) from the quarter cycle exponential moving average. See "MESA and Trading Market Cycles" by John Ehlers pages 64 - 70. Pine Script® indicatorby HPotter50
D_DSP (Detrended Synthetic Price) Strategy Detrended Synthetic Price is a function that is in phase with the dominant cycle of real price data. This DSP is computed by subtracting a half-cycle exponential moving average (EMA) from the quarter cycle exponential moving average. See "MESA and Trading Market Cycles" by John Ehlers pages 64 - 70. Pine Script® indicatorby HPotter100
Confluence Strategy This is modified version of Dale Legan's "Confluence" indicator written by Gary Fritz. ================================================================ Here is Gary`s commentary: Since the Confluence indicator returned several "states" (bull, bear, grey, and zero), he modified the return value a bit: -9 to -1 = Bearish -0.9 to 0.9 = "grey" (and zero) 1 to 9 = Bullish The "grey" range corresponds to the "grey" values plotted by Dale's indicator, but they're divided by 10.Pine Script® indicatorby HPotter11183
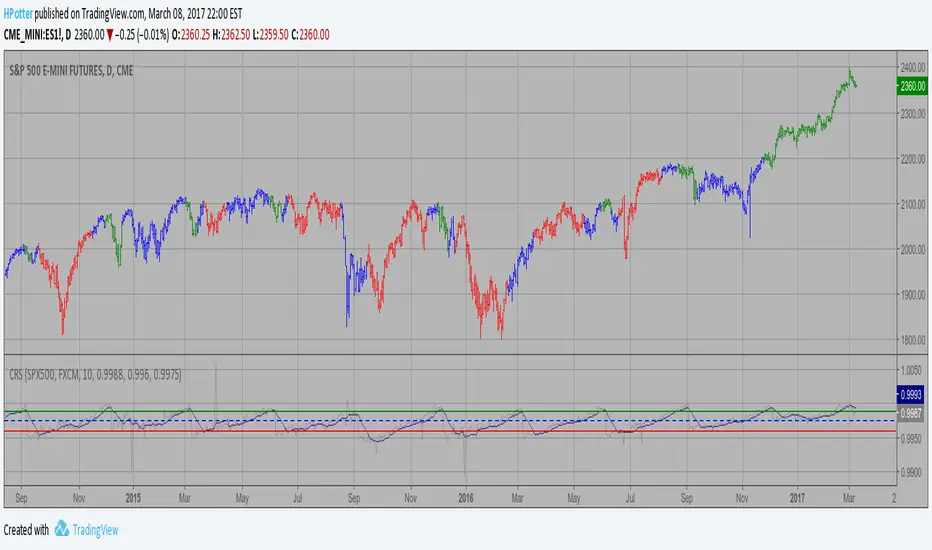
Comparative Relative Strength StrategyComparative Relative Strength Strategy for ESPine Script® indicatorby HPotter136
Combining Exponential And Volume WeightingThe related article is copyrighted material from Stocks & Commodities 2009 Oct Pine Script® indicatorby HPotter32
CMOfilt Strategy This indicator plots a CMO which ignores price changes which are less than a threshold value. CMO was developed by Tushar Chande. A scientist, an inventor, and a respected trading system developer, Mr. Chande developed the CMO to capture what he calls "pure momentum". For more definitive information on the CMO and other indicators we recommend the book The New Technical Trader by Tushar Chande and Stanley Kroll. The CMO is closely related to, yet unique from, other momentum oriented indicators such as Relative Strength Index, Stochastic, Rate-of-Change, etc. It is most closely related to Welles Wilder`s RSI, yet it differs in several ways: - It uses data for both up days and down days in the numerator, thereby directly measuring momentum; - The calculations are applied on unsmoothed data. Therefore, short-term extreme movements in price are not hidden. Once calculated, smoothing can be applied to the CMO, if desired; - The scale is bounded between +100 and -100, thereby allowing you to clearly see changes in net momentum using the 0 level. The bounded scale also allows you to conveniently compare values across different securities.Pine Script® indicatorby HPotter48
CMOav Strategy This indicator plots average of three different length CMO's. This indicator was developed by Tushar Chande. A scientist, an inventor, and a respected trading system developer, Mr. Chande developed the CMO to capture what he calls "pure momentum". For more definitive information on the CMO and other indicators we recommend the book The New Technical Trader by Tushar Chande and Stanley Kroll. The CMO is closely related to, yet unique from, other momentum oriented indicators such as Relative Strength Index, Stochastic, Rate-of-Change, etc. It is most closely related to Welles Wilder?s RSI, yet it differs in several ways: - It uses data for both up days and down days in the numerator, thereby directly measuring momentum; - The calculations are applied on unsmoothed data. Therefore, short-term extreme movements in price are not hidden. Once calculated, smoothing can be applied to the CMO, if desired; - The scale is bounded between +100 and -100, thereby allowing you to clearly see changes in net momentum using the 0 level. The bounded scale also allows you to conveniently compare values across different securities.Pine Script® indicatorby HPotter12
Highest High and Lowest Low channel StrategyHighest High and Lowest Low channel StrategyPine Script® indicatorby HPotter281
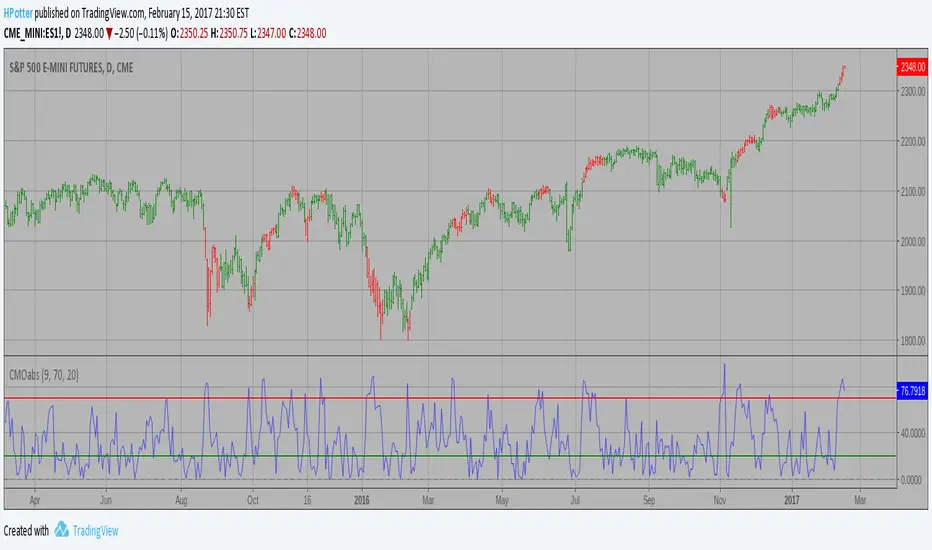
CMOabs Strategy// This indicator plots the absolute value of CMO. CMO was developed by Tushar Chande. A scientist, an inventor, and a respected trading system developer, Mr. Chande developed the CMO to capture what he calls "pure momentum". For more definitive information on the CMO and other indicators we recommend the book The New Technical Trader by Tushar Chande and Stanley Kroll. The CMO is closely related to, yet unique from, other momentum oriented indicators such as Relative Strength Index, Stochastic, Rate-of-Change, etc. It is most closely related to Welles Wilder`s RSI, yet it differs in several ways: - It uses data for both up days and down days in the numerator, thereby directly measuring momentum; - The calculations are applied on unsmoothed data. Therefore, short-term extreme movements in price are not hidden. Once calculated, smoothing can be applied to the CMO, if desired; - The scale is bounded between +100 and -100, thereby allowing you to clearly see changes in net momentum using the 0 level. The bounded scale also allows you to conveniently compare values across different securities.Pine Script® indicatorby HPotter19
FLD - Future Lines of Demarcation Strategy An FLD is a line that is plotted on the same scale as the price and is in fact the price itself displaced to the right (into the future) by (approximately) half the wavelength of the cycle for which the FLD is plotted. There are three FLD's that can be plotted for each cycle: An FLD based on the median price. An FLD based on the high price. An FLD based on the low price.Pine Script® indicatorby HPotter11194
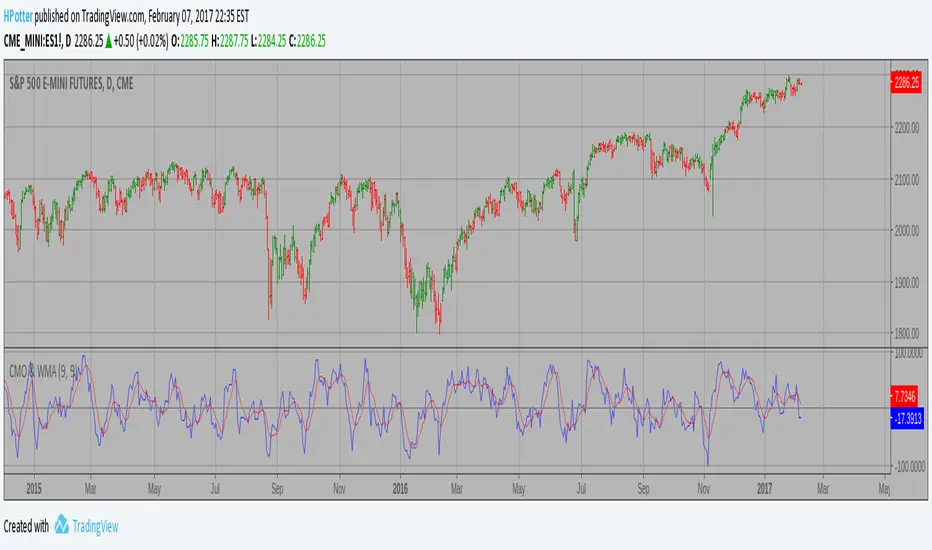
CMO & WMA Strategy This indicator plots Chande Momentum Oscillator and its WMA on the same chart. This indicator plots the absolute value of CMO. The CMO is closely related to, yet unique from, other momentum oriented indicators such as Relative Strength Index, Stochastic, Rate-of-Change, etc. It is most closely related to Welles Wilder?s RSI, yet it differs in several ways: - It uses data for both up days and down days in the numerator, thereby directly measuring momentum; - The calculations are applied on unsmoothed data. Therefore, short-term extreme movements in price are not hidden. Once calculated, smoothing can be applied to the CMO, if desired; - The scale is bounded between +100 and -100, thereby allowing you to clearly see changes in net momentum using the 0 level. The bounded scale also allows you to conveniently compare values across different securities.Pine Script® indicatorby HPotter4434
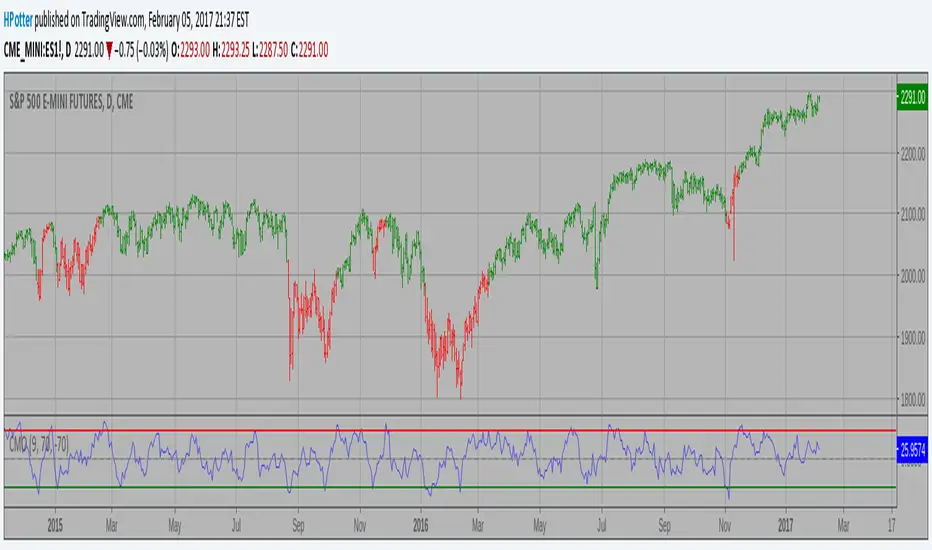
CMO (Chande Momentum Oscillator) Strategy This indicator plots Chande Momentum Oscillator. This indicator was developed by Tushar Chande. A scientist, an inventor, and a respected trading system developer, Mr. Chande developed the CMO to capture what he calls "pure momentum". For more definitive information on the CMO and other indicators we recommend the book The New Technical Trader by Tushar Chande and Stanley Kroll. The CMO is closely related to, yet unique from, other momentum oriented indicators such as Relative Strength Index, Stochastic, Rate-of-Change, etc. It is most closely related to Welles Wilder`s RSI, yet it differs in several ways: - It uses data for both up days and down days in the numerator, thereby directly measuring momentum; - The calculations are applied on unsmoothed data. Therefore, short-term extreme movements in price are not hidden. Once calculated, smoothing can be applied to the CMO, if desired; - The scale is bounded between +100 and -100, thereby allowing you to clearly see changes in net momentum using the 0 level. The bounded scale also allows you to conveniently compare values across different securities.Pine Script® indicatorby HPotter274
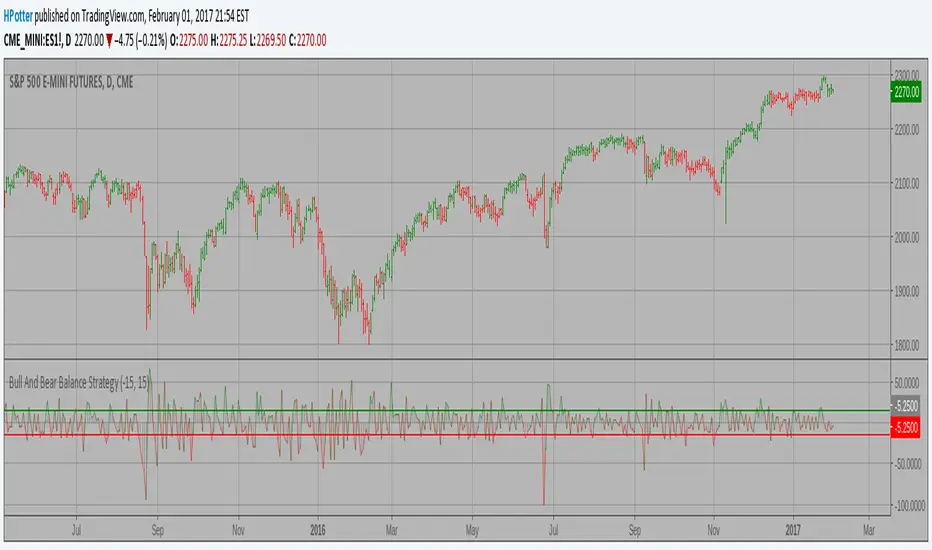
Bull And Bear Balance Strategy This new indicator analyzes the balance between bullish and bearish sentiment. One can cay that it is an improved analogue of Elder Ray indicator. To get more information please see "Bull And Bear Balance Indicator" by Vadim Gimelfarb. Pine Script® indicatorby HPotter44122
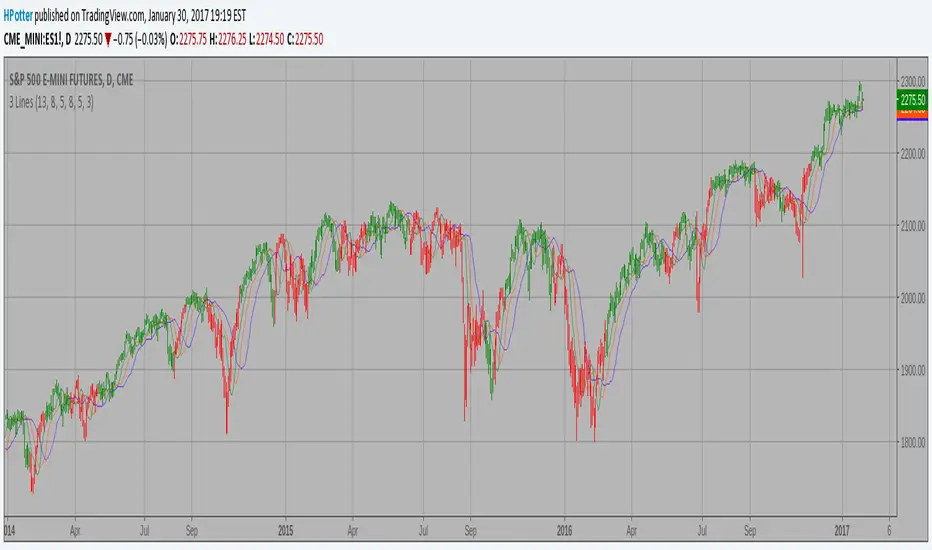
Bill Williams Averages. 3Lines Strategy This indicator calculates 3 Moving Averages for default values of 13, 8 and 5 days, with displacement 8, 5 and 3 days: Median Price (High+Low/2). The most popular method of interpreting a moving average is to compare the relationship between a moving average of the security's price with the security's price itself (or between several moving averages).Pine Script® indicatorby HPotter22179
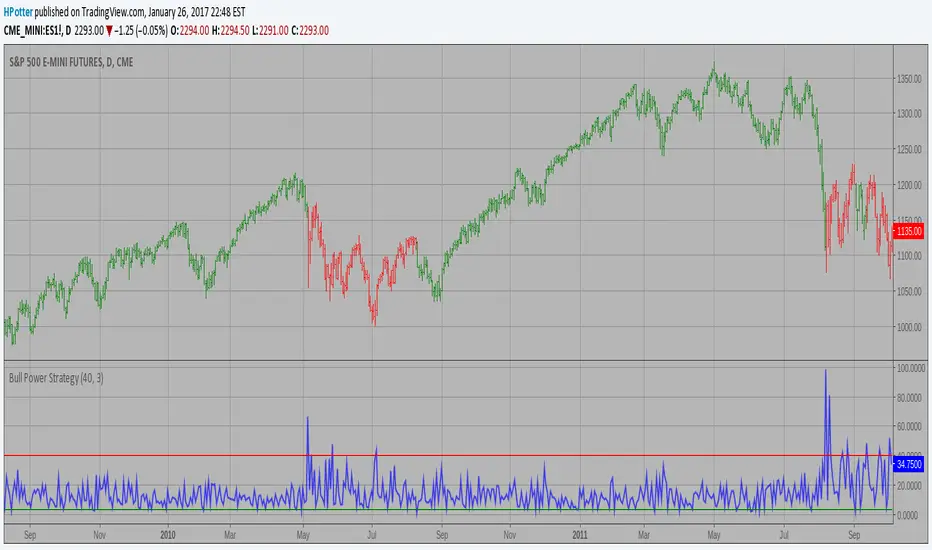
Bull Power Strategy Bull Power Indicator To get more information please see "Bull And Bear Balance Indicator" by Vadim Gimelfarb. Pine Script® indicatorby HPotter84
Bear Power Strategy Bear Power Strategy To get more information please see "Bull And Bear Balance Indicator" by Vadim Gimelfarb. Pine Script® indicatorby HPotter41
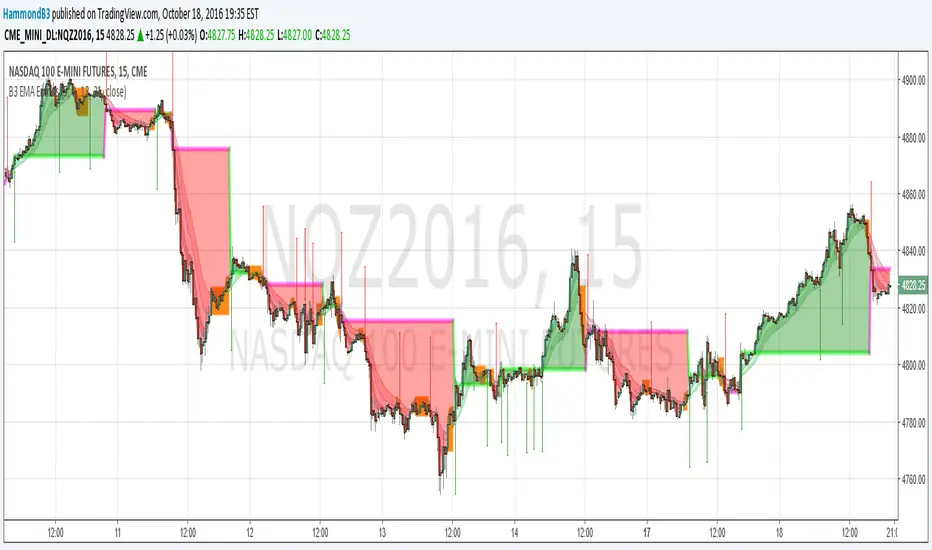
B3 EMA EntriesB3 EMA Entries = B3 EMA Ribbon "Trader" This study takes the B3 EMA Ribbon and builds trade entries from it. The clouds represent the deviation from entry points; orange equals weakening or undetermined trend. Manage your own exits, and if you have a large deviation cloud in comparison to prior clouds.... take them profits! Here also is a glimpse into my proprietary scripting that I will likely offer for a subscription at some point. Many simpler freebies like this share to come first of course! I will give away most simple indicators, but there are a few sub-chassis things I use, which I developed myself. One of which is indicator back testing, where I see all of the strategy's history information from the indicator on the chart. Sans trade-ticket automation, this voids the need for a strategy file or A.P.I. or backtesting devices (however, I plan to adapt things to TradingView's strategy system if I can, so that automation can take place). As well as this algorithmic trading system chassis, I also have a specialized statistical output chassis and another few graphical depiction sets. For this share, you should manage your own exits, (you could simply use the orange clouds as an exit.) This is my most simple of the "indicator traders" I call them. The more intricate algorithmic trading indicators I make have the full trading package down to the risk to reward, entry, target, stop, and trail. The statistical systems are pretty unique, and I haven't seen many doing what I do on that front yet, so I am excited to get those out to more people. Look for these subscriptions in the near future, but as a token of introduction enjoy my next several free shares too. Cheers, and good trades to you. ~B3Pine Script® indicatorby HammondB322205
Franklin barcolor ATRIndicator for trader.tfc3.ru strategy traders.Pine Script® indicatorby hell0men55